




Abstract
Gear fault vibration signals are commonly non-stationary, and useful fault information is often buried in heavy noise, which makes it difficult to extract gear fault features. How to select the suitable fault frequency bands is the key to gear fault diagnosis. To address the above problems, a method combining the improved minimum entropy deconvolution (MED) and accugram, named IMEDA, is proposed for extracting gear fault features. Firstly, a selection index based on permutation entropy (PE) and correlation coefficient is defined. Then, the optimal filter length can be effectively selected by the step-length searching method using the proposed index as objective function, and the improved MED is employed to preprocess the gear vibration signals. Finally, the accugram analysis is performed for the preprocessed signals to obtain the optimal frequency band, and the fault characteristic frequencies are extracted from the square envelope spectrum of the signals in the optimal band. The method is validated by gear experimental data with gear wear-out failure. The analysis results demonstrate that the proposed method owns superior effect by comparing with the fast kurtogram (FK), MED combined with FK (MED-FK), accugram and infogram.
Introduction
As the most widely used component in various industrial rotating machines, gears usually operate under high-speed and long-time operating conditions [1]. Gears in gearboxes are prone to wear, spalling, cracks and other faults [2]. Once a fault occurs, it can cause downtime, increase maintenance costs, and even cause safety accidents. Therefore, it is important to accurately diagnose gear failures in a timely manner.
Vibration signal analysis is a powerful method for gear fault detection [3]. Vibration signals contain a wealth of gear fault information. Due to the complex working environment of gears and the inevitable influence of external interference, gear vibration signals are usually non-stationary. How to obtain fault information from the vibration signals is the key to gear fault diagnosis. Identification and extraction of the fault frequency bands from the full frequency band can greatly increase the accuracy of mechanical fault diagnosis. This problem is called frequency band selection (FBS) [4].
Resonance demodulation technique is one of the commonly used fault diagnosis methods, also known as envelope analysis [5, 6]. The signal containing fault information is selected through band-pass filtering, and then the fault characteristic frequency is extracted by spectrum analysis to identify the fault type. The resonance demodulation technique is a kind of frequency band selection method. However, the traditional resonance demodulation technique has the inherent disadvantage that the natural frequency of the rotating machinery needs to be known in advance. In practical applications, the filter parameters, i.e., bandwidth and center frequency, in resonant demodulation techniques are difficult to determine due to the complex operating conditions of rotating machinery.
Essentially, the task of FBS is to select frequency bands which have an intrinsic connection with gear faults. During the operation of a gearbox, faults can excite the vibration transient impulses that helps to better detect the fault frequency band. Kurtosis is sensitive to impulses caused by abnormal vibrations. Thus it is usually used to directly measure the transient impulses of a signal [7]. Nevertheless, kurtosis is not suitable for fault detection under strong noise. Dwyer originally introduced spectral kurtosis (SK) [8, 9] to characterize transient impulses in signals. SK can reflect the existence of non-stationary components in the signal and indicate the position of these components in the frequency domain. Antoni made a thorough and systematic study on SK and formally gave the mathematical definition of SK [10]. Subsequently, Antoni and Randall coined kurtogram, a representation of the SK in the plane of frequency and frequency resolution. They explained the advantages of such a representation in [11]. For the convenience of industrial applications, fast kurtogram (FK) [12] was put forward to improve the computational efficiency. FK evenly divides the full spectrum to construct filters and then calculates the spectral kurtosis to find the optimal frequency band. However, it usually fails when analyzing strong noise signals [13].
All the time, many studies have been devoted to optimizing the FK. Zhang et al. [14] combined fast kurtogram with a genetic algorithm to determine the optimal center frequency and bandwidth. Wang and Liang [15] tried to optimize the filter bandwidth and locate center frequency by an improved spectral kurtosis algorithm. This new spectral kurtosis method can adaptively determine the bandwidth and center frequency. According to [16], Lei et al. proposed another improved kurtogram method to detect fault signals. This method replaces the original kurtogram filter with a wavelet packet transform filter. Zhong et al. [17] combined iterative filtering and fast kurtogram to extract the weak fault features of rolling bearings. It is worth noting that kurtosis value of the filtered signal is incorrect when the amplitude or kurtosis value of the random shocks in vibration signal is higher than those of the real faults. This means that the frequency band containing random shocks is detected, while the real fault is missing. To address this issue, Barszcz et al. [13] proposed a new tool called protrugram. This method displayed the kurtosis of the envelope spectrum instead of kurtosis of the filtered time signal. However, this method uses a fixed bandwidth and needs prior knowledge. Enhanced kurtogram was proposed by Wang et al. in [18]. In [18], the kurtosis value is calculated by the power spectrum of the signal envelope. Zhang et al. [19] used the concept of correlation kurtosis to improve the kurtogram for bearing fault diagnosis. In [20], the authors presented the PAR-based kurtogram to determine the informative frequency band. Recently, Antoni [21] combined kurtogram and protrugram to propose infogram. Negentropy was employed as a new indicator to detect repetitive transients. Inspired by the fact that real information is generally fuzzy, Li et al. [22] proposed a fuzzy technique to improve the performance of information frequency band determination. An information frequency band specific fuzzy clustering method is developed to divide the frequency spectrum, and three commonly-used criteria are combined using a fuzzy comprehensive evaluation method to guide the frequency band segmentation. Moshrefzadeh and Fasana [23] proposed a method, named autogram, to enhance the conventional kurtogram. This method can suppress the influence of noise from the original signal, thus enhancing the ability of frequency band selection.
Jin et al. [24] proposed a new method for frequency band selection to find the band that contained the richest fault information. This method improves the performance of information frequency band selection in two aspects. On the one hand, the normal signal is added as a health reference. On the other hand, an objective indicator called accuracy is proposed to select fault bands. The new indicator can integrate multi-dimensional information, like root mean square and kurtosis. Accuracy rate is obtained by comparing the degree of difference between the test and health data. Subsequently, a new tool called the accuracy diagram, which is similar to kurtogram, is proposed to show these accuracy rates. The frequency band with the highest accuracy value is the best band with fault information. In the paper [4], Liu et al. proposed a new frequency band selection method called accugram by combining health reference, impulsivity and cyclostationarity. The comparison results indicate its effectiveness and superiority over conventional envelope analysis, the kurtogram, and the infogram. However, due to the influence of background noise, the accuracy obtained by the accugram algorithm is not stable, resulting in the determined frequency band is not optimal.
In order to obtain useful signals, noise reduction preprocessing is required before analysis [25]. At present, there are many methods for vibration signal noise reduction [26]. MED is an effective technique widely used in fault detection. The MED method highlights the impulse characteristics in the signal by searching for an optimal set of filter coefficients. Since the fault information in the fault signal exists mainly in the form of impulses, the characteristics of MED are suitable for enhancing the fault information in mechanical signals.
Wiggins first proposed MED and successfully applied it to seismic wage processing [27]. Edno et al. [28] first applied MED to denoise vibration signal to diagnosis spalling and cracking failure in gears. For detection of rolling bearings faults, Sawalhi et al. [29] proposed an algorithm by combining MED and SK. MED can effectively reduce noise and highlight weak fault impulse components in the fault signal. However, the filtering effect of MED depends on the filter length. It is necessary to optimize this parameter to enhance the performance of MED. Entropy is adopted in many papers to construct new indicators, such as PE [30], fuzzy entropy (FE) [31]. PE is a kind of information entropy, which is often used to describe the complexity of time series. Compared with other commonly used indexes, PE has advantages of simple calculation, fast running speed, and good noise robustness. Considering that the filtered signal after MED should have a certain correlation with the original signal, correlation coefficient is introduced to construct a new index. Therefore, a comprehensive index based on PE and correlation coefficient is proposed to select the optimal filter length by step-length searching method in this paper.
Based on the above analysis, a frequency band selection method based on MED parameter optimization and accugram is proposed. Firstly, we use the proposed selection indicator to find the best filter parameter. Then the original vibration signal is denoised via improved MED method to obtain useful signal component, and the optimal frequency band is selected by accugram to extract the gear fault features. The results show that the proposed method can accurately detect the best frequency band and highlight fault features.
The rest of this paper is organized as follows: The first section introduces the background and motivation. The next section shows theoretical background of this paper. In the subsequent section, the steps and flowchart of the method are shown. Before the final section, the outcome is compared with FK, MED-FK, accugram and infogram to test the performance of the new method. Finally, conclusions are reached.
Theoretical background
Minimum entropy deconvolution (MED)
Assuming that a fault vibration signal can be expressed as follows [32, 33]:
MED can be adopted to construct an inverse filter w (n) to recover the original impulse signal x (n) from the measured signal y (n). The expression of the deconvolution process is as follows:
The quality of the inverse filter w (n) is evaluated by the entropy value of x (n). The MED algorithm takes the norm of x (n) as the objective function to measure the entropy value. The expression is as follows:
The purpose of deconvolution is to search for the best inverse filter to minimize the entropy, that is, to maximize the norm
According to Equation (2):
We can get the derivative on both sides of Equation (5):
The Equation (7) can be obtained from Equations (3) and (6):
The Equation (7) can be written as the matrix expression:
The minimum entropy iterative calculation process can be briefly summarized as follows: Initialize all elements in w to 1; Iteratively calculate x (n) = w (n) i-1 · y (n); Calculate Calculate w(i) = A-1b
i
; If
Taking into account the advantages and disadvantages of PE and correlation coefficient, a synthetic index is defined to optimize the length of the MED filter.
For the kth signal filtered by MED, its indicator can be expressed as:
When this index value reaches its maximum value, it indicates that the parameter (namely the filter length) used for MED filtering is the optimal parameter.
PE was proposed by Bandt and Pompe in [30]. It is a method to measure the complexity of time series. The PE is briefly defined as follows [34]:
A set of time series can be expressed as X ={ x (t) , t = 1, 2, ⋯ n }. Reconstruct the original time series by using the embedding theorem.
Rearrange all elements in ascending order:
So the symbol-sequence S (g) can be expressed as:
Define PE as:
A larger H p indicates a more complex time series, a smaller H p indicates a more regular time series.
Correlation coefficient is a statistical indicator designed by statistician Carl Pearson. Pearson correlation coefficient is a measure of how close two variables are relative to each other. It is defined as [35, 36]:
Pearson correlation coefficient varies from –1 to 1. r (X, Y) = 0 means no linear relationship between the two variables. A positive number indicates a positive correlation between X and Y, and a negative number indicates a negative correlation between X and Y.
The principle of this method is to evaluate each divided frequency band in the frequency spectrum and find the most sensitive one which contains rich fault information. The sensitivity of a band is measured by comparing the degree of difference between the test data and the healthy data [4]. This difference is quantified as accuracy by classification algorithm. A high accuracy indicates a higher probability of failure. In this way, the fault frequency band is accurately found.
Signal segmentation
The purpose of signal segmentation is to divide the original signal into several segments at the same interval. Four parameters are defined as follows: the length of a collected signal is N, the number of segments is n, the length of each segment is L
seg
, and the overlap length between two neighbor segments is L
overlap
. This method is called sliding segmentation approach [4], which is defined as follows:
The purpose of this step is to divide the whole frequency band into small frequency bands. The whole frequency band is from zero to a half of the sampling frequency. The principle of the FK frequency band division algorithm is based on an arborescent filter-bank structure. The algorithm is first based on a binary trees structure, and it is then extended to a richer 1/3-binary tree structure [12].
The frequency band division method of accugram is similar to FK. Low-pass, band-pass and high-pass filters are employed to obtain the frequency bands, which are defined as follows:
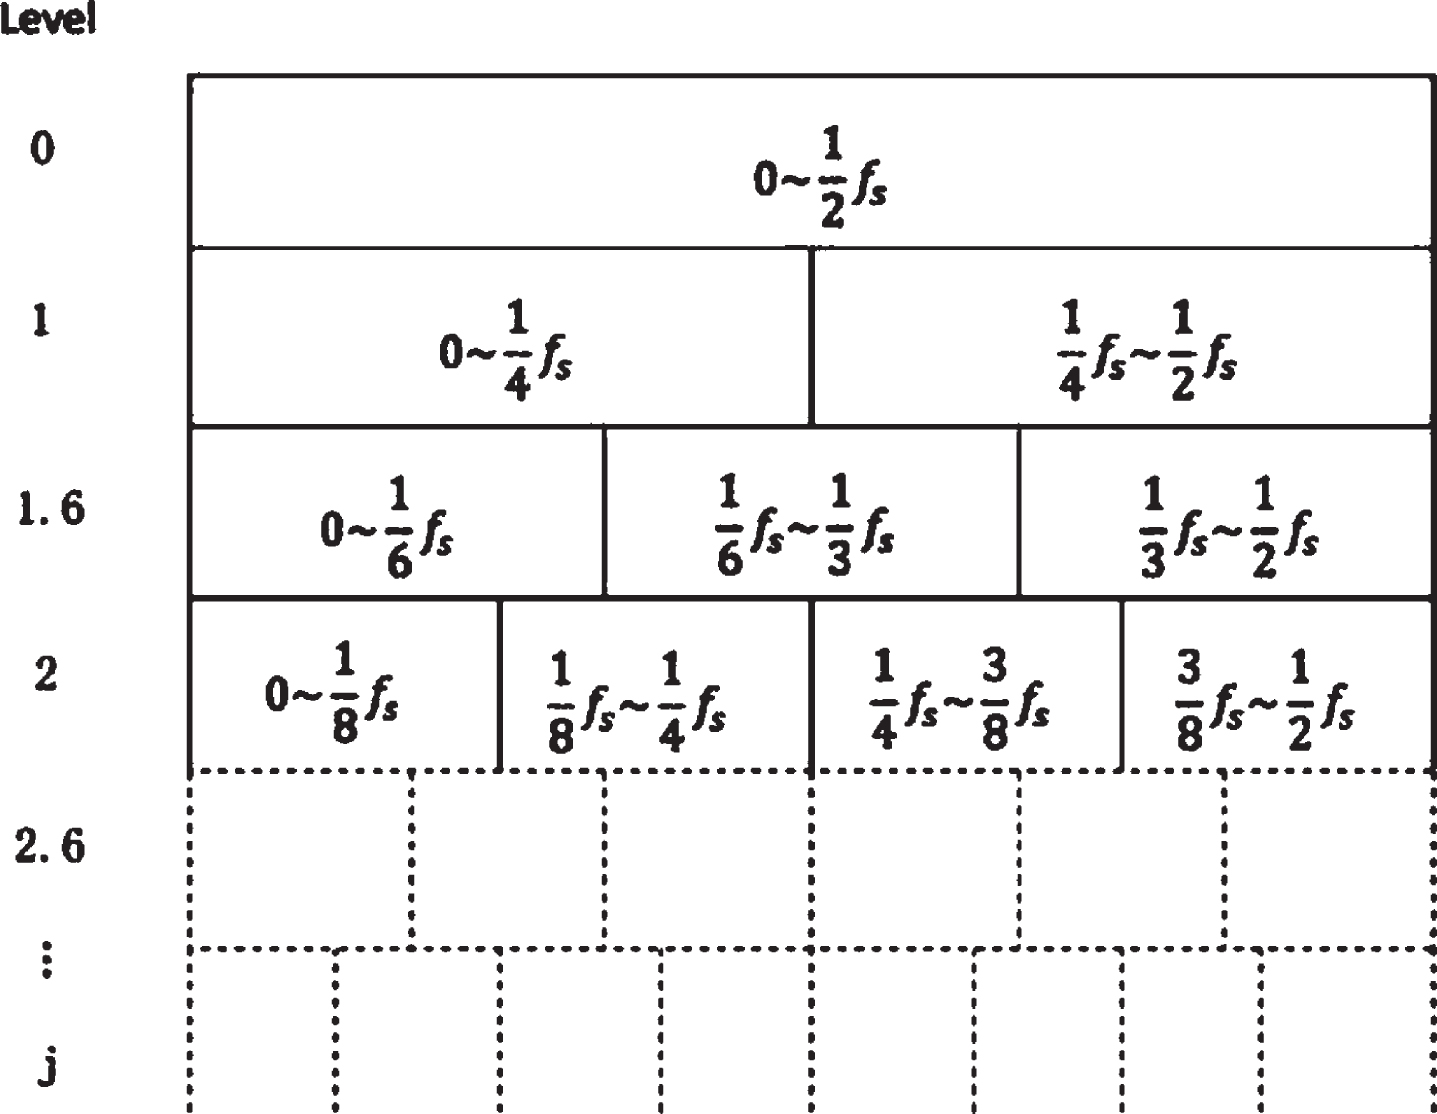
Frequency band division.
Feature calculation is a pre-processing step to express accuracy. A set of features in the signal segment is obtained through calculation. There are many measurement indexes for fault diagnosis of rotating machinery, such as kurtosis, root mean square, entropy and so on. Among these indexes, entropy is a general index to measure the degree of disorder of the system. Various types of entropy are widely used so far, such as frequency band entropy, fuzzy entropy, etc. Antoni proposed negentropy of the squared envelope (SE) and negentropy of the squared envelope spectrum (SES) to characterize transients [21]. Accugram applied these two features for feature calculation.
SE negentropy (denoted by NESE) and SES negentropy (denoted by NESES) are introduced as follows [21]:
The classification algorithm of k-nearest neighbor (kNN) [36] with standard n-fold cross validation is applied to obtain classification accuracy. In this paper, k is set by one according to [37] and n is set by 10 for cross validation. In n-fold cross validation, n–1 folds are used for training and the last fold is used for evaluation [24]. And accuracy can be calculated by the classification algorithm of kNN. After repeating n times, the average accuracy rate is further obtained. The details of the process are described as follows.
At level 0, there is only one frequency band. Both health and test data are divided into N segments by sliding segmentation. Then, two features of each segment are calculated. Inputting the 2 N points into n-fold cross validation, N accuracy rates are obtained from N kNN classification models. By taking the average of N accuracy rates, we can obtain accuracy rate of the first frequency band,
By repeating the above process, the frequency band is divided into a predesigned level. The accuracy rate matrix is displayed as shown in Fig. 2.
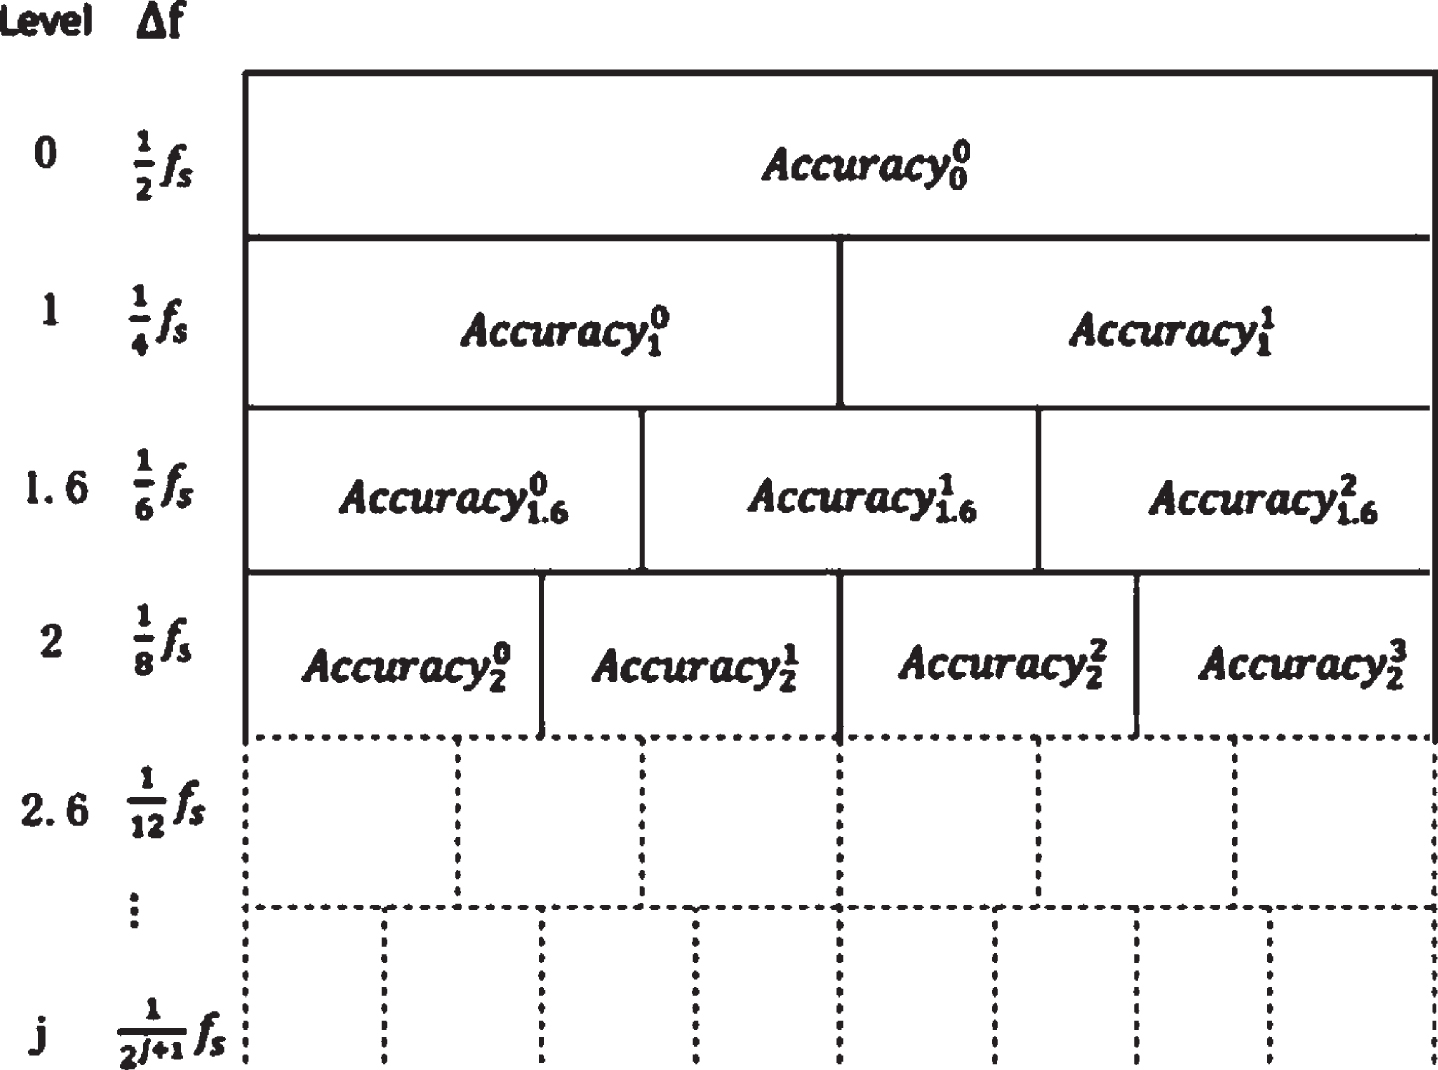
Accuracy rate matrix.
Frequency band selection is to find the frequency band that contains rich fault information. The frequency band with high accuracy rate is highlighted in accuracy diagram. Similar to fast kurtogram, the center frequency and bandwidth of the best frequency band are obtained and the test signal is filtered with the optimal parameter.
The squared envelope spectrum can highlight the fault characteristics in the spectrum. Therefore, the square envelope spectrum analysis is performed on the filtered signal to extract the characteristic frequency of the fault.
The proposed method
The proposed method is based on improved MED and accugram (IMEDA) in this paper. This method realizes parameter optimization by using the proposed indicator, which can effectively improve the noise reduction effect of MED. The Accugram method is applied to select the frequency band with rich fault information. The specific process is as follows: The step-length searching method is used to select the best MED filter length. Then the test signal is denoised by improved MED with the best parameter. The health and test signal are divided into n segments by sliding segmentation approach. Frequency band partition is applied in the full spectrum and the tree of filter bands is produced with a pyramidal manner. The two feature values of each segment are calculated for a successful accuracy representation. The n-fold cross validation and k-nearest neighbor classification algorithm are employed to obtain the accuracy rate. After comparing the accuracy values, the optimal frequency band is determined and band-pass filtering is used to obtain the filtered signal. The squared envelope spectrum is performed on the filtered signal to extract the fault characteristic frequencies.
Based on the above steps, a flowchart of the method is shown in Fig. 3.
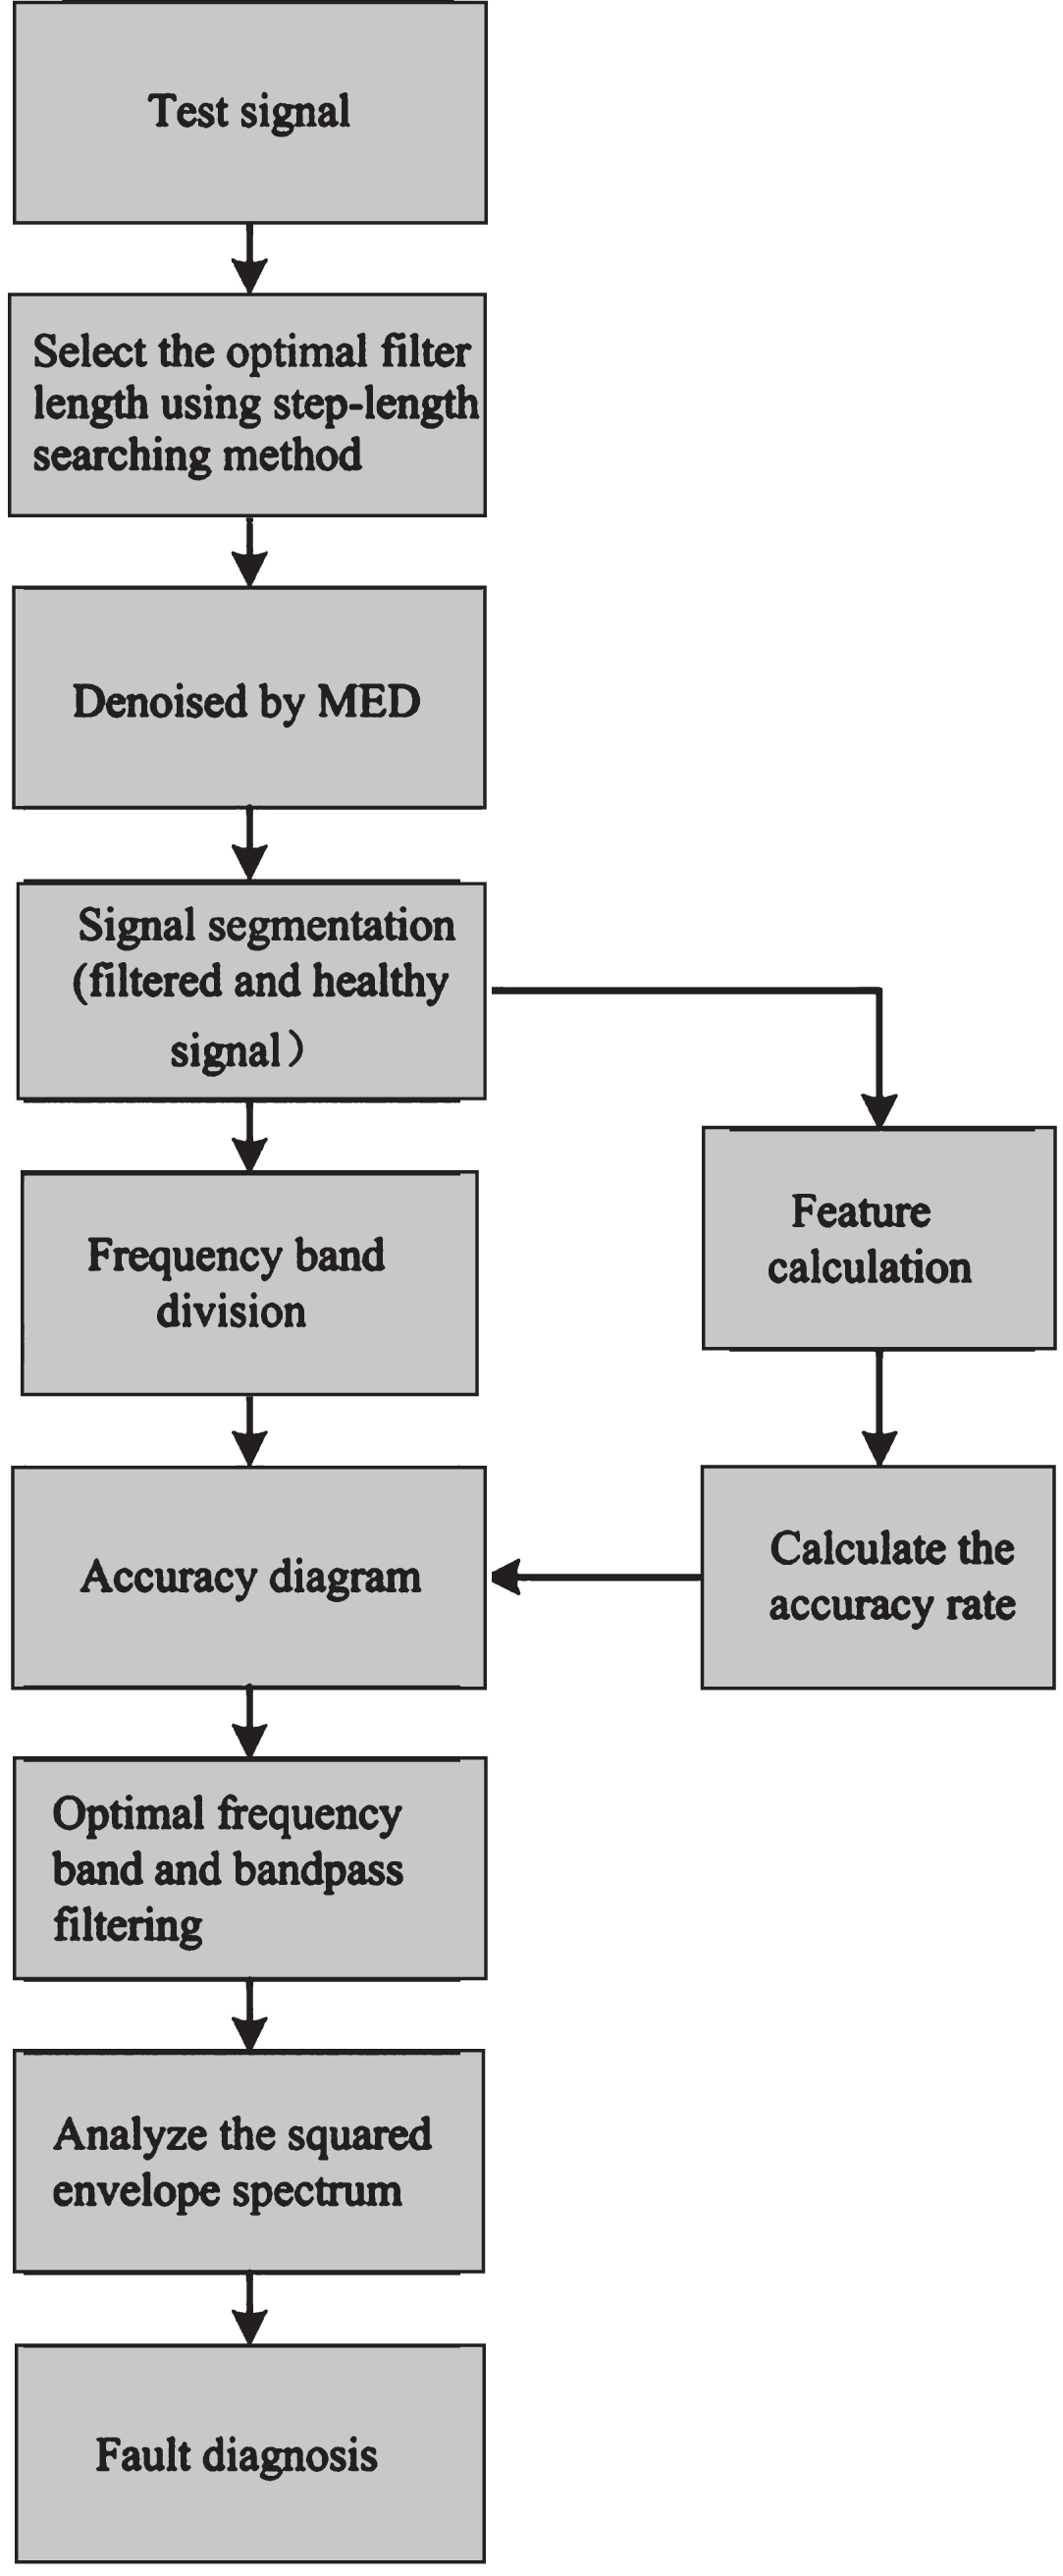
The flowchart of the proposed method.
Case 1: Gear wear data
The gear vibration data have been provided from CETIM, France [38, 39]. The one-stage gearbox consists of a pinion and a wheel with 20 and 21 teeth, respectively. The input shaft rotation speed is 1000 rpm, thus the input rotation frequency is fr1 = 16.67Hz, and the output rotation frequency fr2 = 15.87Hz. The meshing frequency is f m = 333.33Hz and the sampling frequency is 20KHz. Table 1 gives the details of the gear test parameters.
CETIM bench characteristics
CETIM bench characteristics
The gearbox kept running 24 hours a day, and the vibration signals were recorded every day. The test lasted for 12 days until destruction of the gear. During the experiment, the bench has been stopped every day in order to make a tooth damage assessment. Table 2 gives a description of the state of the gear.
Assessment Report
According to Table 2, the gear began to peel off after the 6th day. The recorded data of the 7th day is selected for experimental data. Figure 4 shows the time-domain waveform of the gear signal and its corresponding Fourier spectrum. In Fig. 4(a), no obvious impulse components and useful information about gear failure can be observed clearly. In Fig. 4(b), some harmonics and associated modulation sideband of gear meshing frequency are obvious. But the gear rotation frequency and its harmonics are not obvious. Therefore, gear failures cannot be diagnosed only by observing the Fourier spectrum.
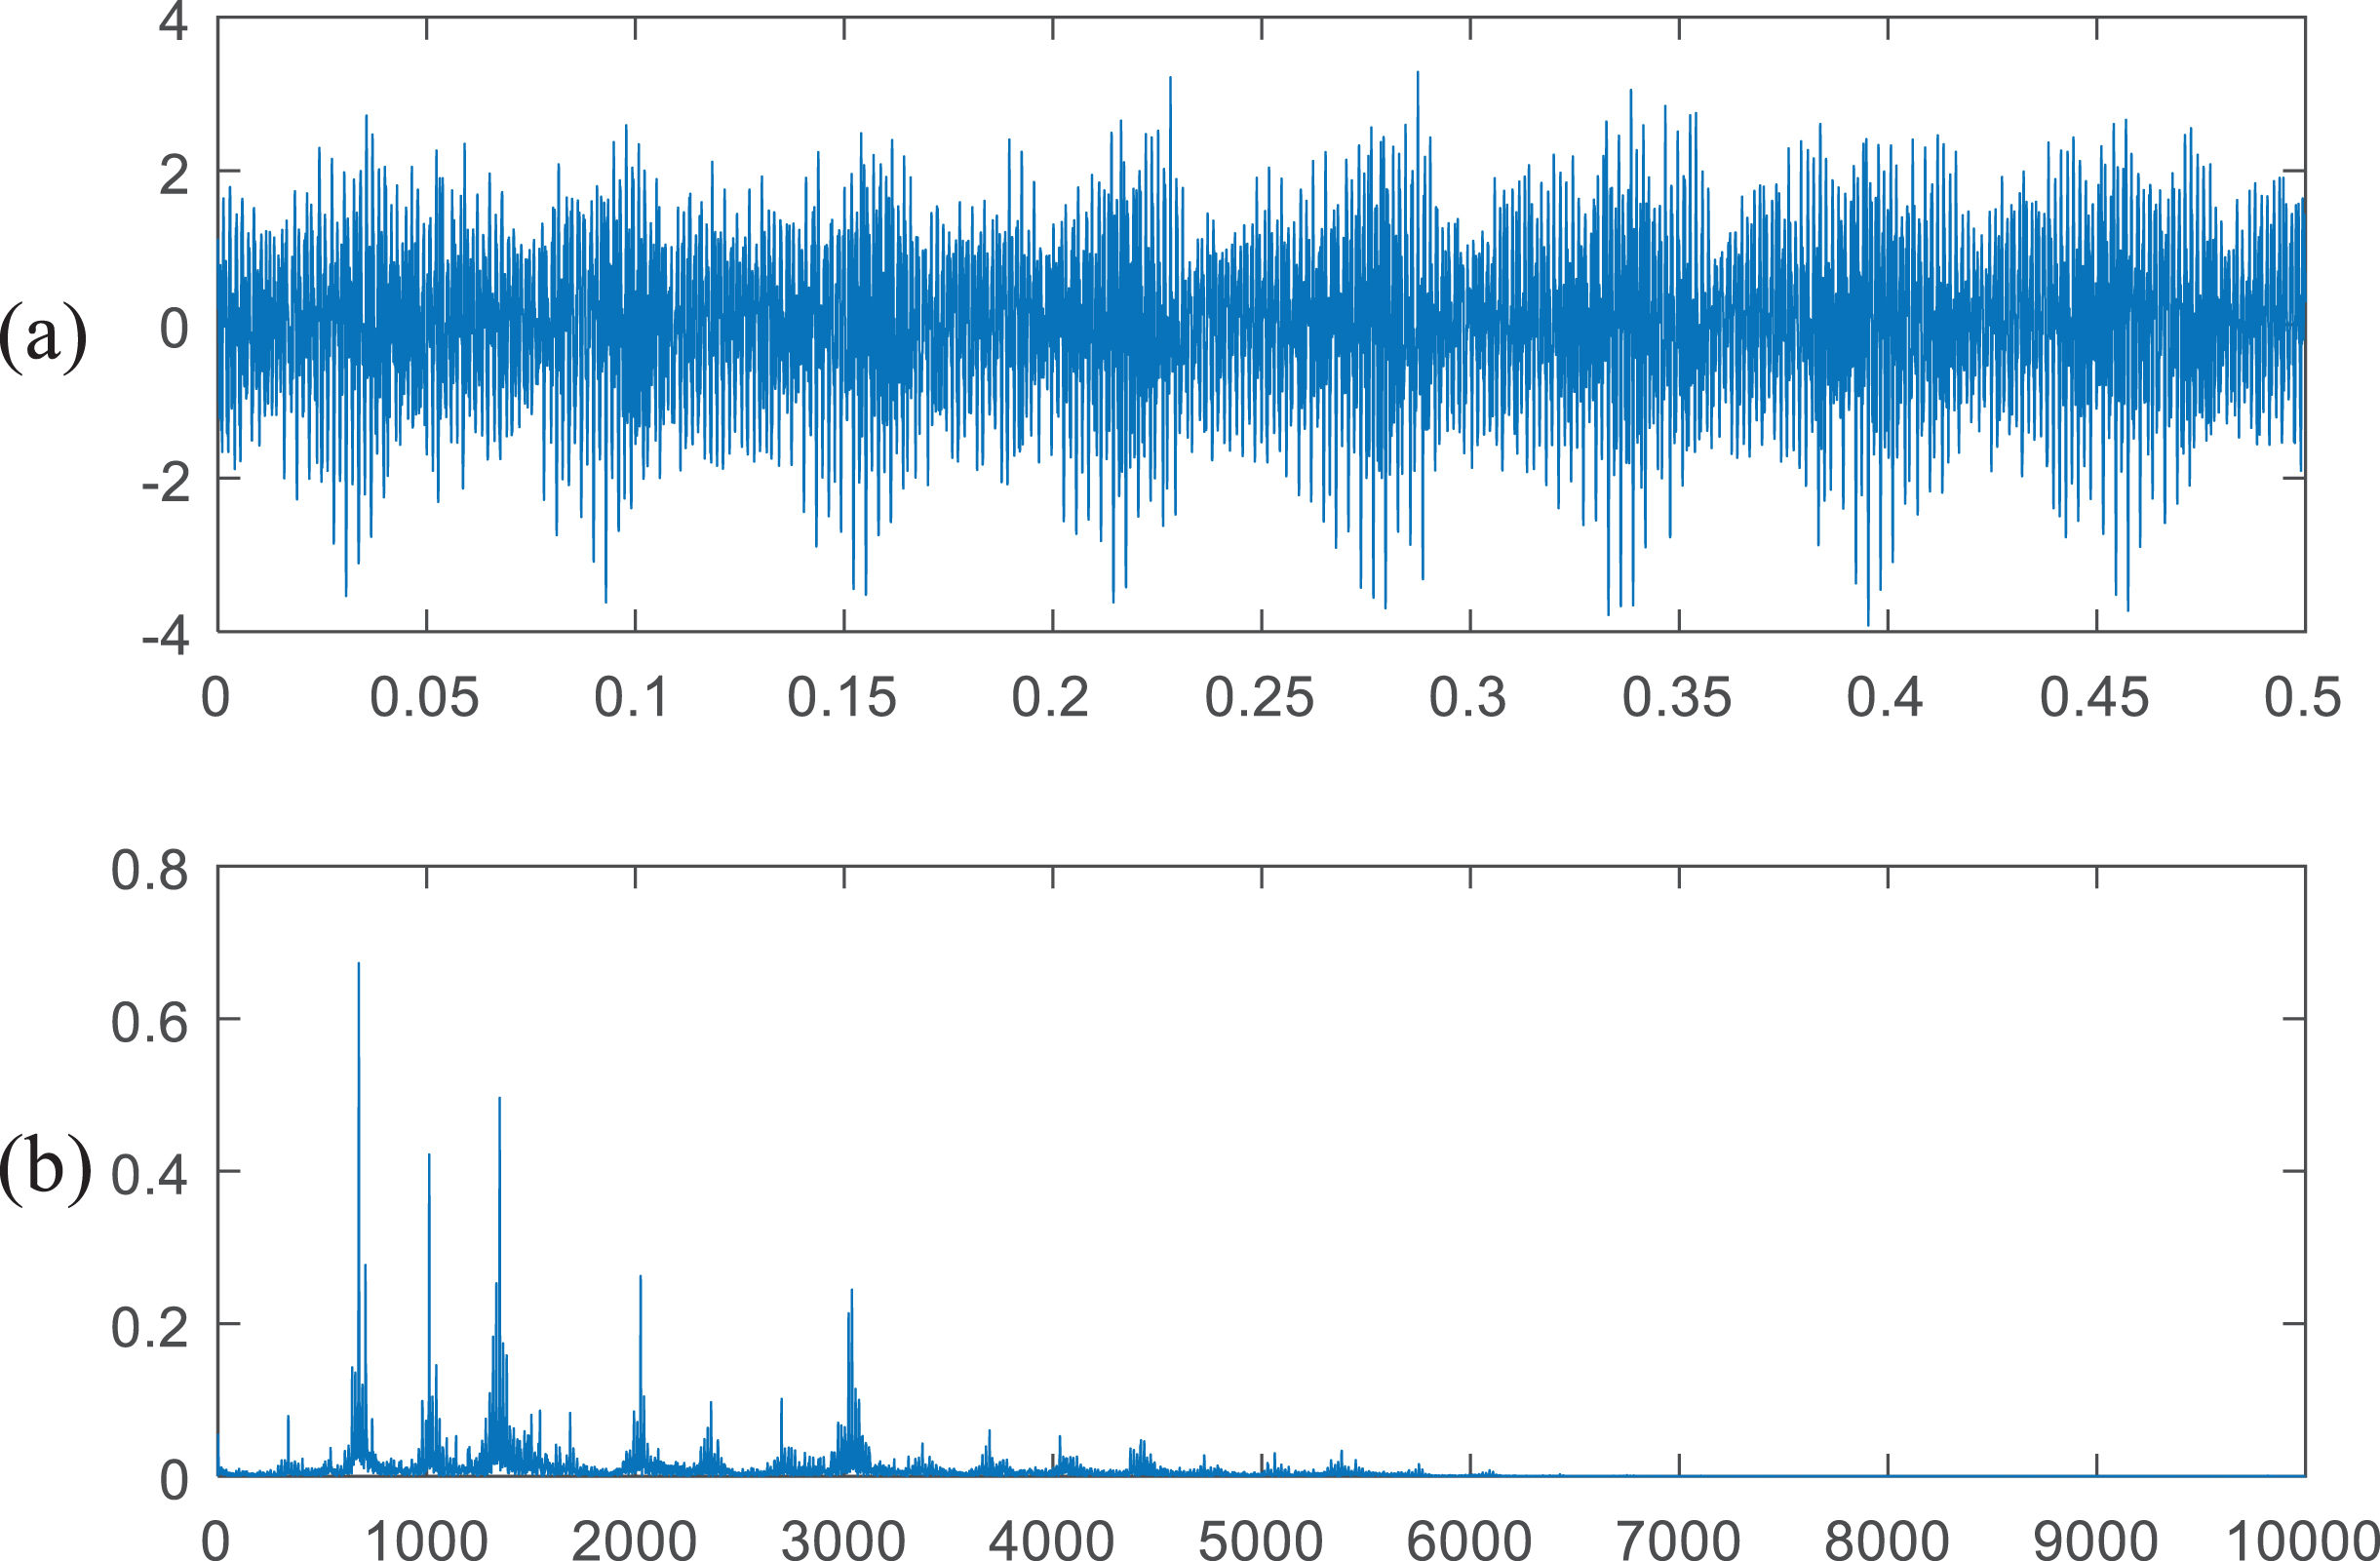
(a) Raw time signal, (b) Fourier spectrum.
The proposed method is applied to extract the fault characteristic frequencies. Firstly, the optimal filter length can be effectively selected by the step-length searching method using the proposed index as objective function. The filter length L takes an integer in the interval of [20,100], and the indicator values under different lengths are obtained by step-length searching method. When L = 32, the maximum value of the index is obtained. So the optimal filter length L is 32. The filtered test signal is shown in Fig. 5.

Signal filtered using MED.
The accugram algorithm is employed to process the filtered signal and health signal to obtain the optimal center frequency and bandwidth, and the results is shown in Figs. 6 and 7. In Fig. 6, it shows a maximum accuracy of 0.804, and the center frequency and bandwidth are 5000 Hz and 10000 Hz, respectively. The zoomed squared envelope spectrum (0–625 Hz) is shown in Fig. 7. The shaft rotating frequency and its harmonics (2fr1, 3fr1 and 4fr1) are clearly observed from the squared envelope spectrum. In addition, modulation sidebands appear on both sides of the meshing frequency and its harmonics. The spacing between two adjacent sideband peaks the characteristic frequency of gear failure, and the gear meshing frequency is dominant in the squared envelope spectrum. Therefore, it can be concluded that the gear has a fault which may be the gear spalling or the gear tooth broken. This is consistent with the experimental records. The proposed method successfully selects the best fault frequency band and effectively extracts the gear fault characteristic frequencies.

Accuracy diagram of the gear signal by the proposed method.
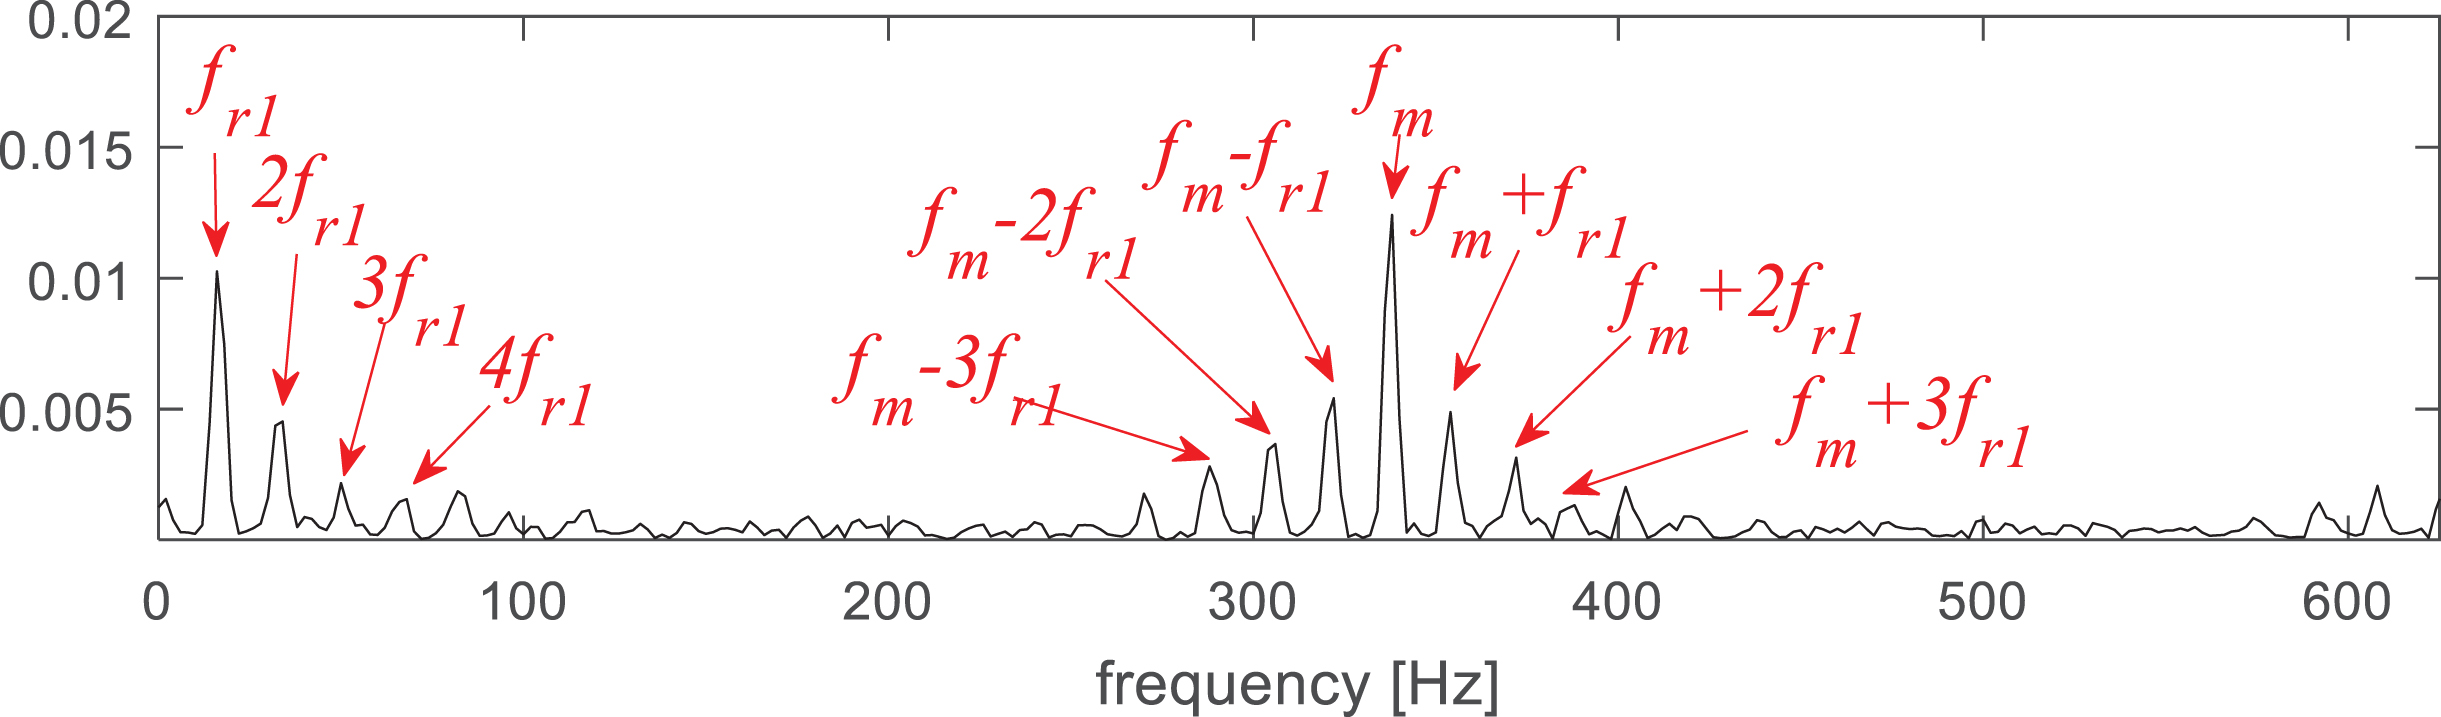
Squared envelope spectrum of the gear signal by the proposed method (0–625 Hz).
Then the fast kurtogram method is applied to the same signal, and its kurtogram is displayed in Fig. 8. The center frequency is 9166 Hz and its associated bandwidth is 1666 Hz. It clearly shows that the maximum kurtosis is 130.7. The squared envelope spectrum is shown in Fig. 9. The input shaft frequency fr1 and the gear meshing frequency f m cannot be found in the figure. Due to the strong background noises, it is difficult to identify the characteristic frequencies that are associated with the gear faults.
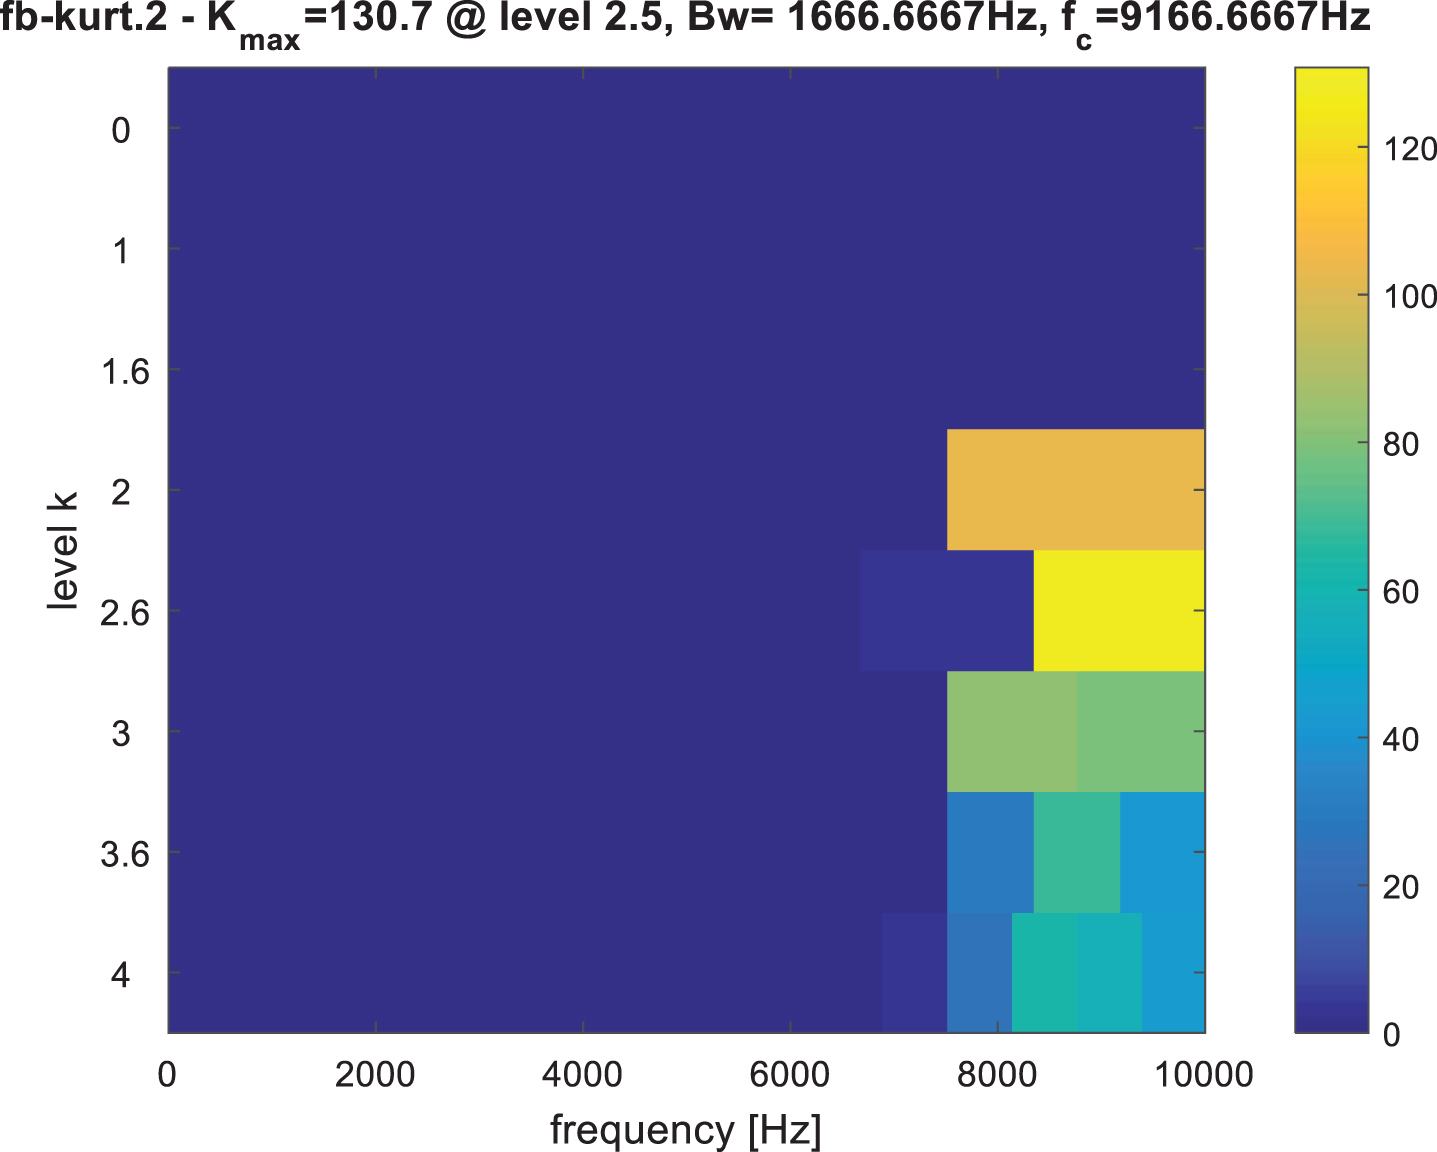
Kurtogram of the gear signal.

Squared envelope spectrum of the gear signal using FK.
To demonstrate the superiority of the proposed method, the fast kurtogram method is utilized to analyze the signal filtered by MED. The results are shown in Figs. 10 and 11. We can find that the maximum kurtosis is 104.2, and the selected frequency band with maximum kurtosis is located in {f c ; Δf} = { 9375Hz ; 1250Hz }. The corresponding squared envelope spectrum of fault signal is shown in Fig. 11. There are no dominant signals and we cannot find any fault characteristic frequency in the squared envelope spectrum. In short, MED-FK cannot determine the valid frequency band.
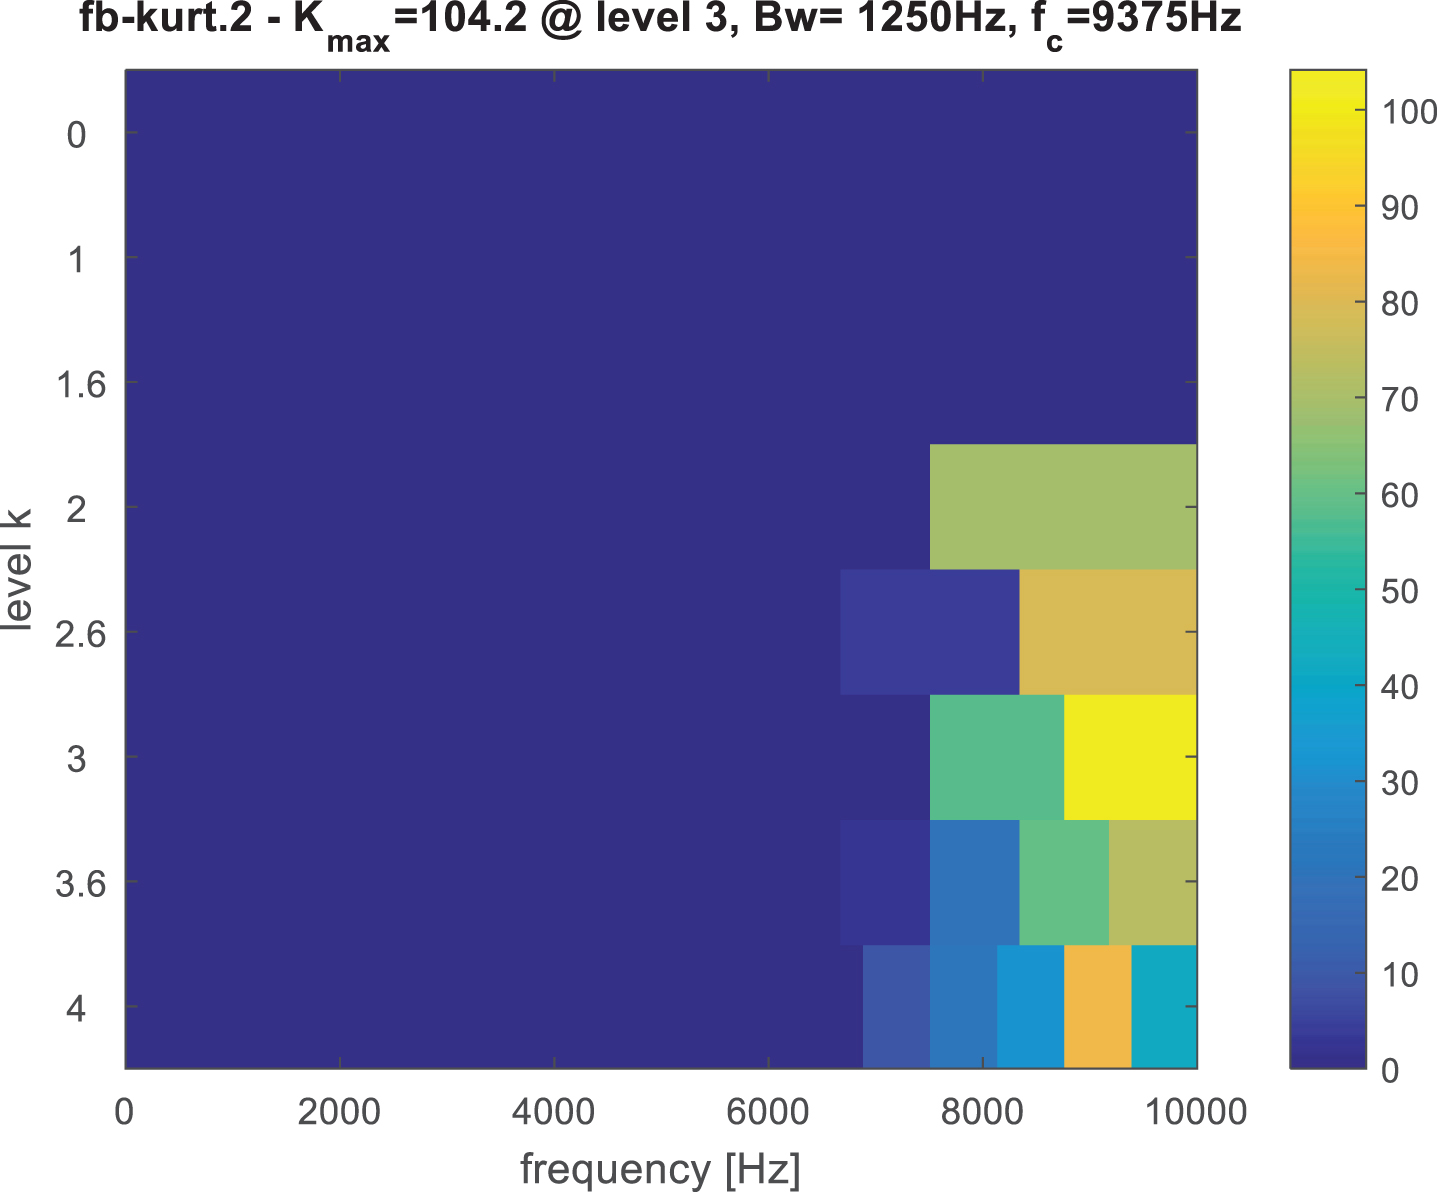
Kurtogram of the signal filtered by MED.
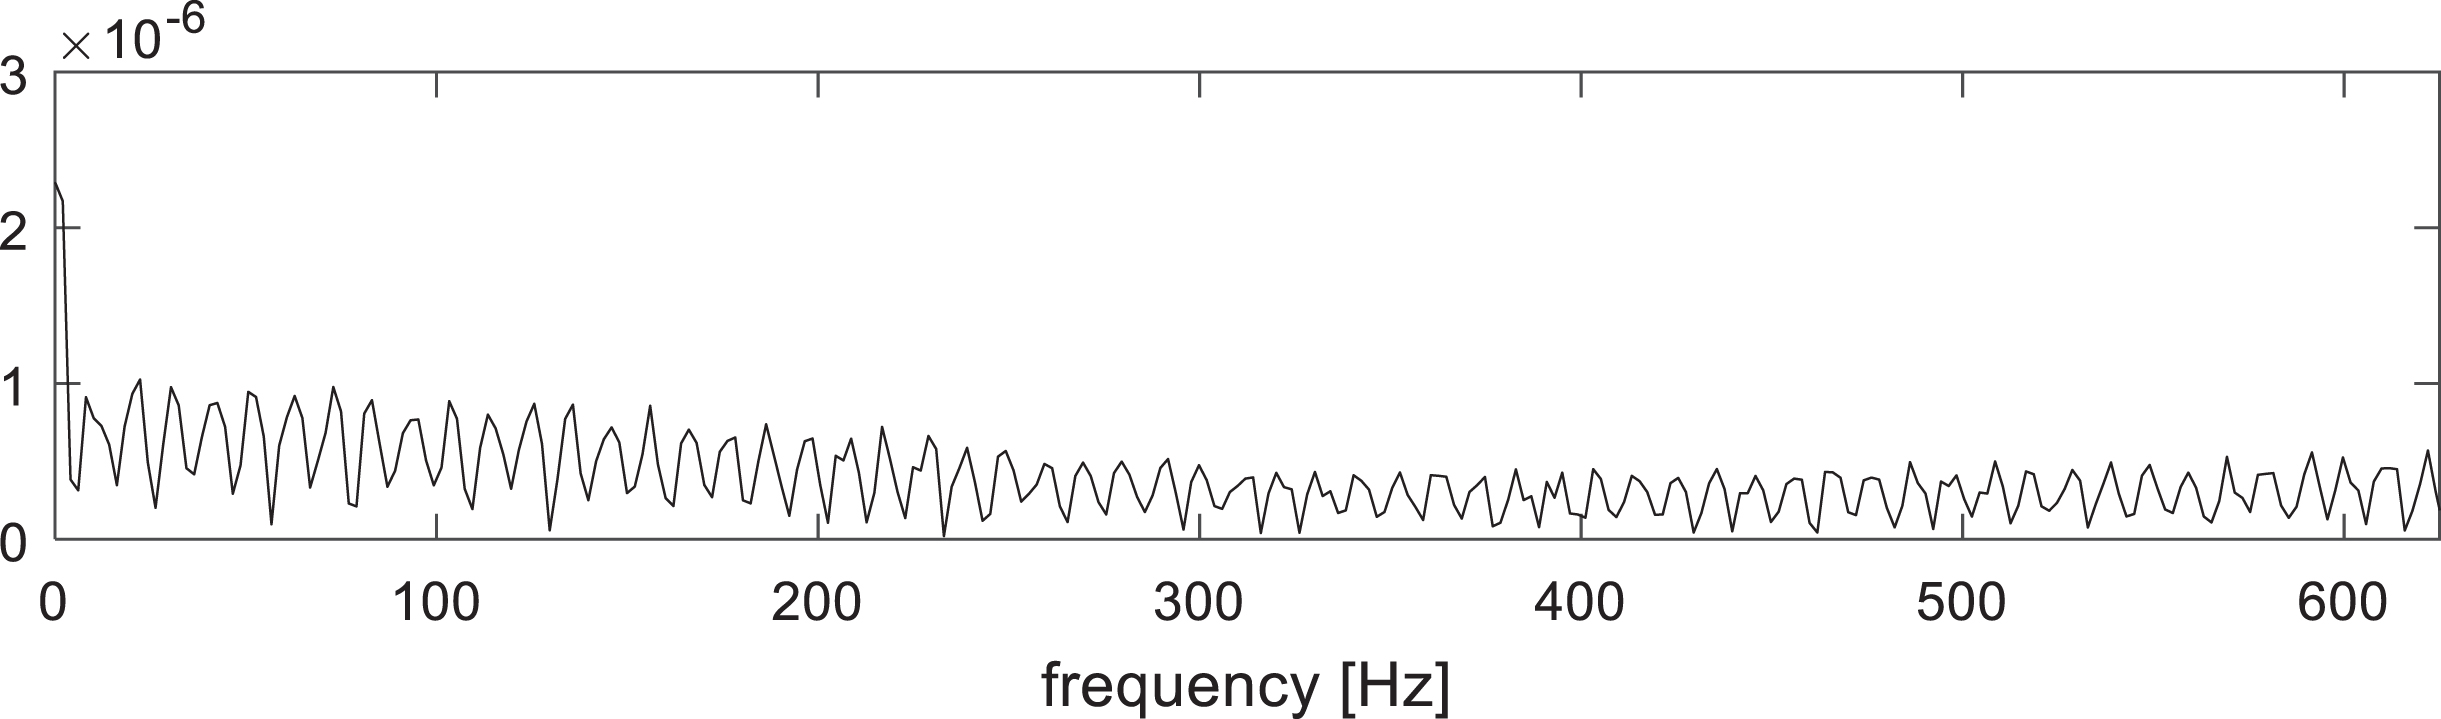
Squared envelope spectrum the signal filtered by MED-FK (0–625 Hz).
Then the accugram method is applied to the same signal, and the results are presented in Figs. 12 and 13. The accuracy diagram is shown in Fig. 12. It shows a maximum accuracy rate is at the level 4. The center frequency is f c = 5312.5 Hz and its bandwidth is B w = 625 Hz. The frequency band of the signal is obtained by filtering, and its squared envelope spectrum is shown in Fig. 13. We can find the characteristic frequency fr1 and its second and third order harmonics (2fr1 and 3fr1). However, it is hard to find the meshing frequency f m in Fig.13, and there are some irrelevant components in the figure.
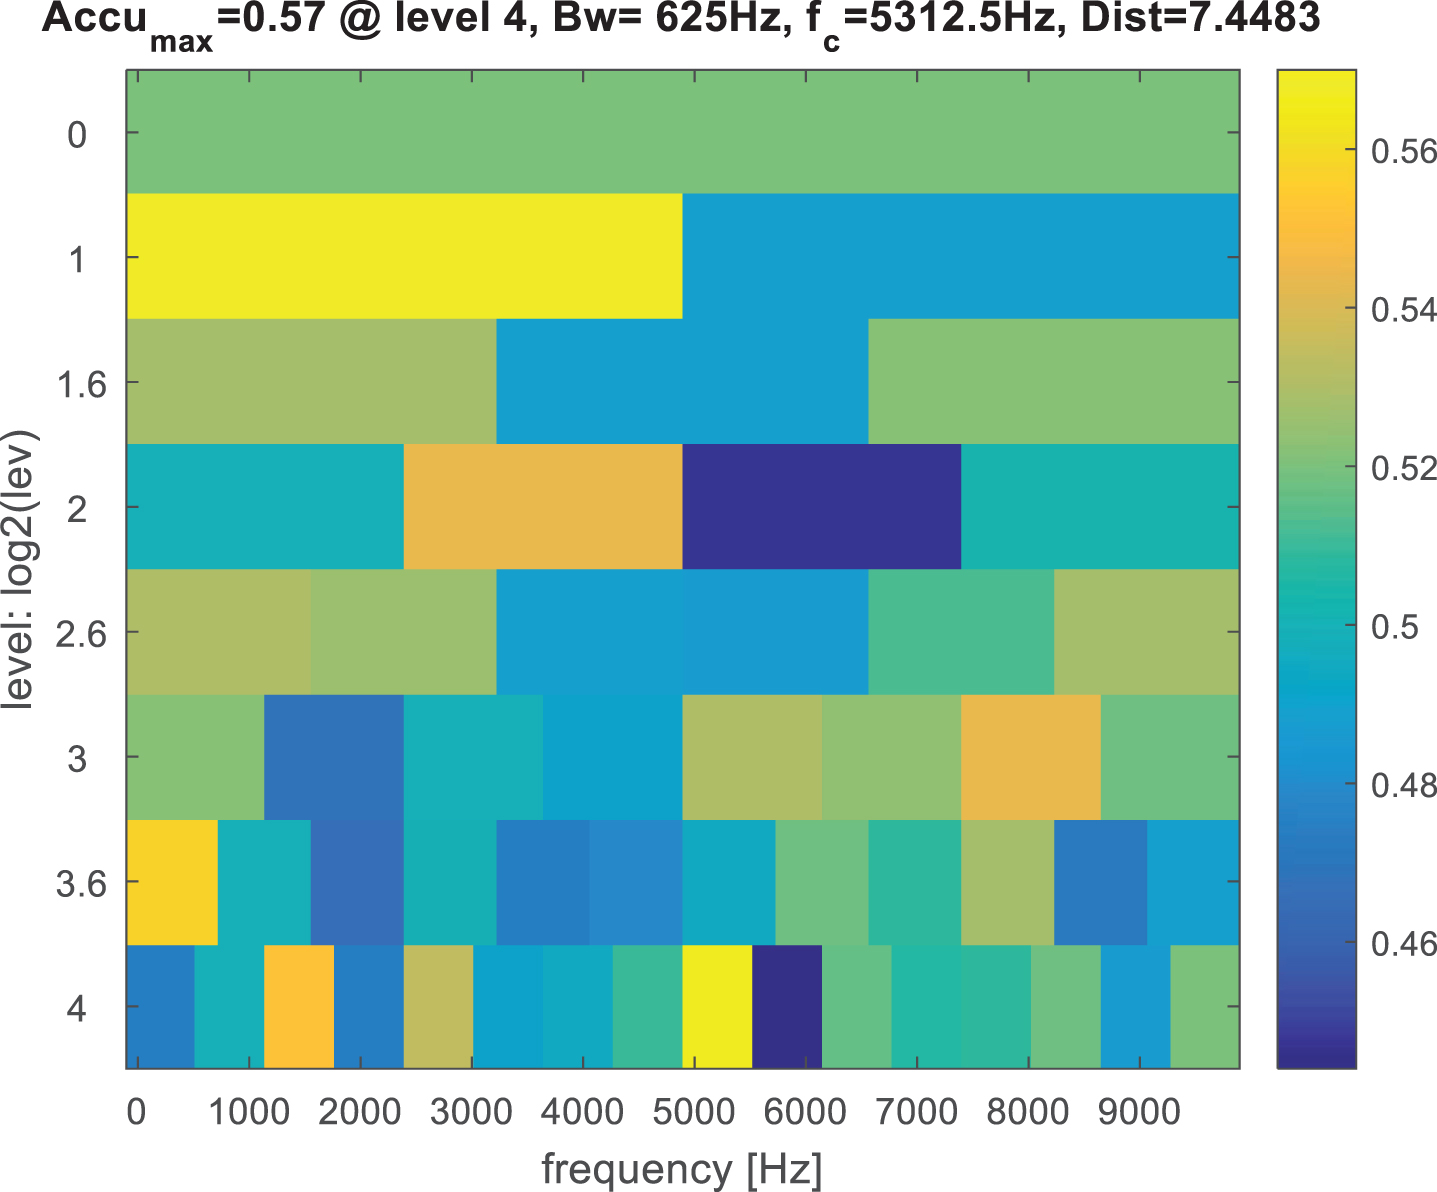
Accuracy diagram of the gear signal.

Squared envelope spectrum of the gear signal using accugram.
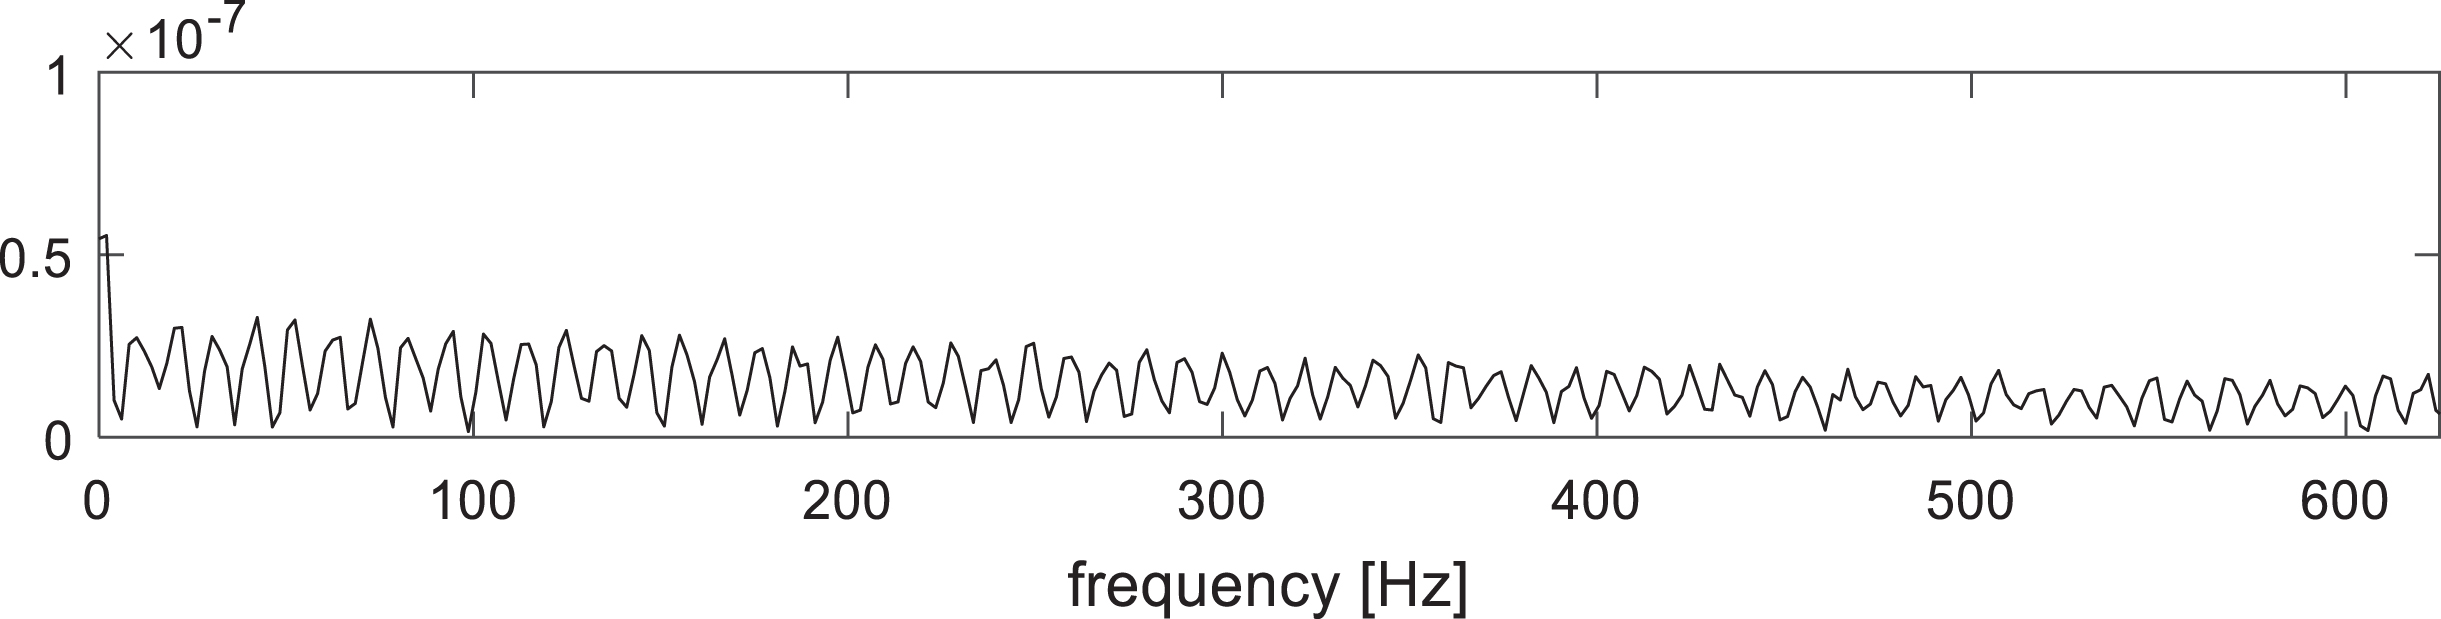
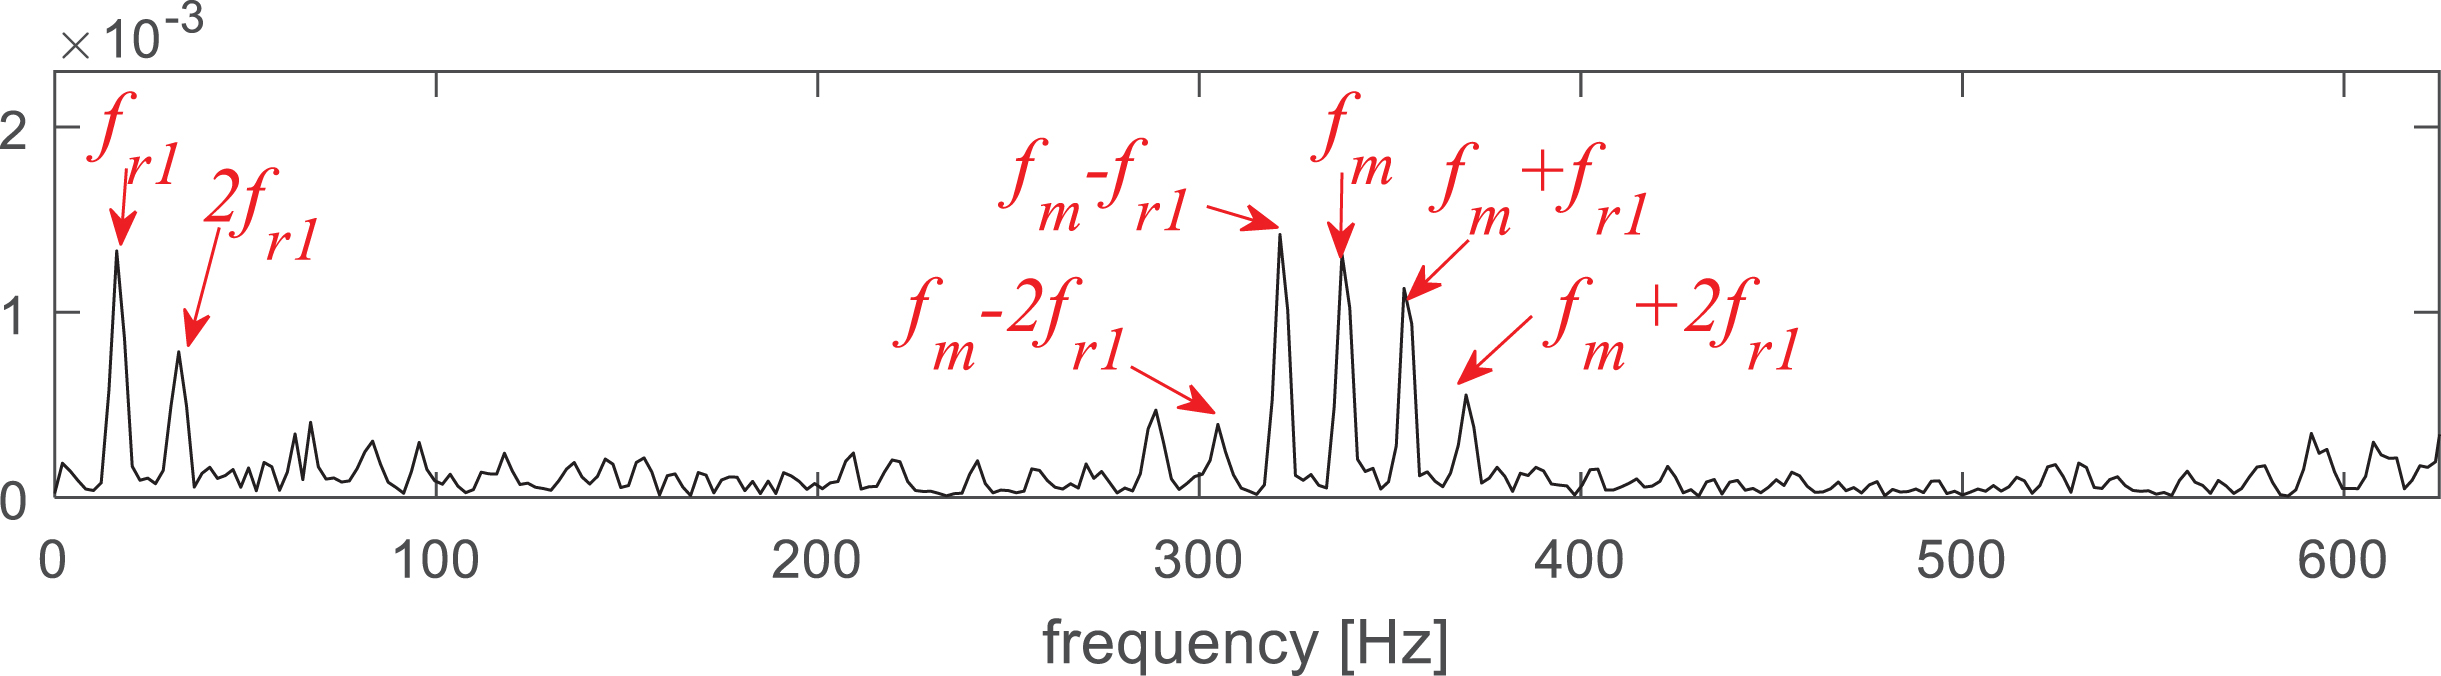
Figure 14 shows the analysis results using the infogram method. In this figure, the SE infogram, the SES infogram and the average infogram are displayed, and then their square envelope spectrum are obtained respectively. The fault characteristic frequency is not clearly displayed, and not much useful information can be found in the SE infogram (Fig. 15). In the SES infogram (Fig. 16), the shaft rotating frequency and its harmonics (2fr1) are clearly visible from the squared envelope spectrum. In addition, the gear meshing frequency and its sidebands appear a modulation which corresponds to the input shaft rotation frequency. Finally, no useful information can be found from the average infogram (Fig. 17).
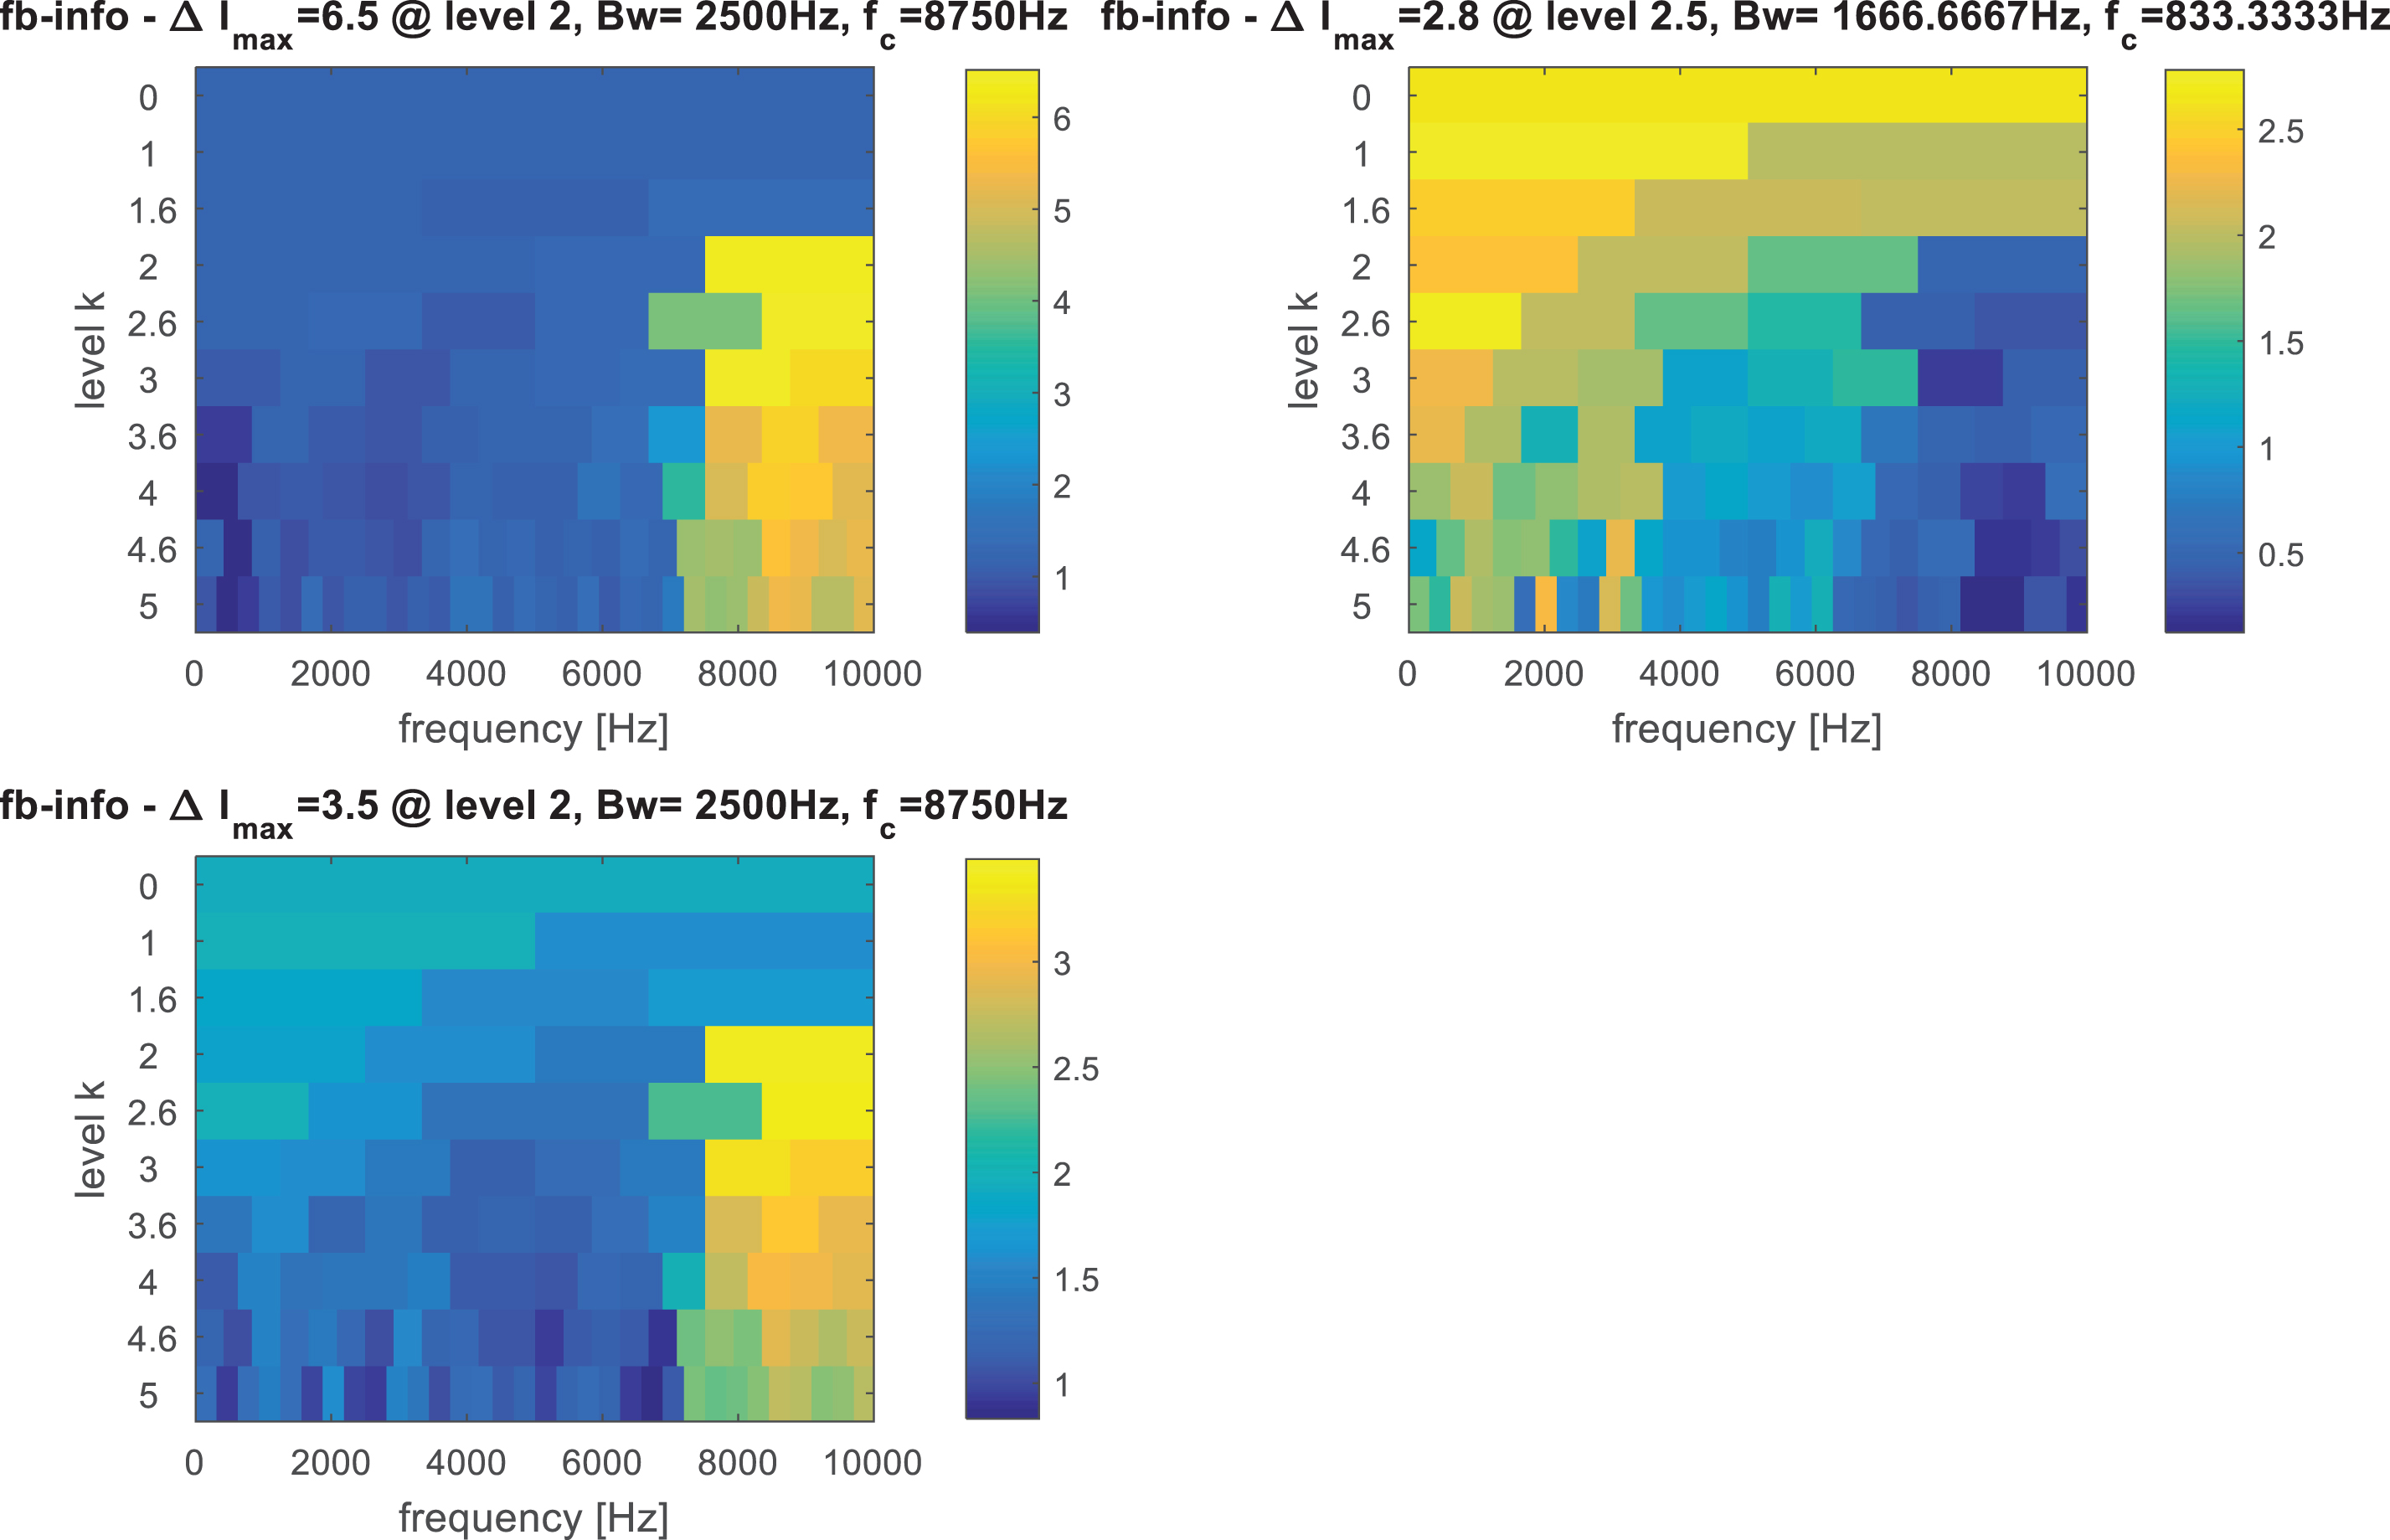
(a) SE infogram, (b) SES infogram, (c) average infogram.
Squared envelope spectrum with SE infogram.
Squared envelope spectrum with SES infogram.
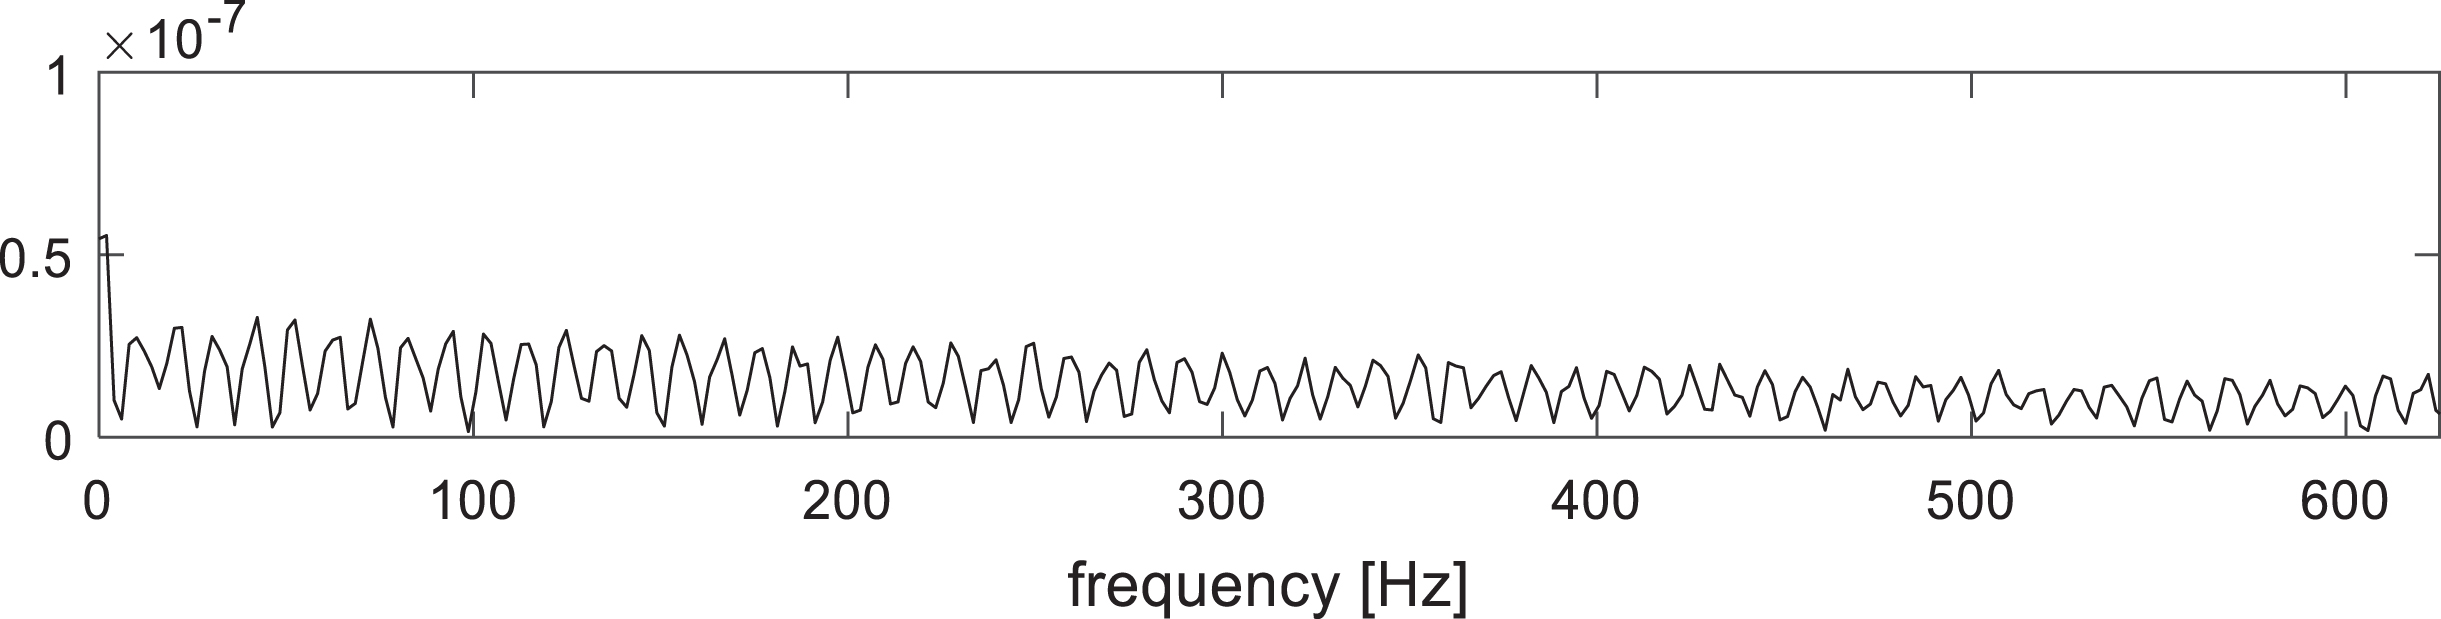
Squared envelope spectrum with average infogram.
These analysis results show that the proposed method is more effective than the original fast kurtogram, accgram and MED-FK methods in analyzing vibration signals and extracting fault features. The infogram method also achieves a good effect. However, the proposed method is a little better than it with more information. The comparison experiments highlights the superiority of the proposed method in the field of gear fault diagnosis.
In this case, the gear fault vibration data was collected from a two-stage gearbox that is driven by a motor and loaded through a magnetic brake. A 32-tooth pinion and an 80-tooth gear are installed on the first stage input shaft. The second stage consists of a 48-tooth pinion and 64-tooth gear. Vibration data was collected using accelerometers, and the sampling frequency is 20 KHz. More detailed information about the datasets are available in [40].
Some different gear conditions are introduced to the pinion on the input shaft, including healthy condition, missing tooth, and saplling. We choose the missing tooth defect data to analyze.
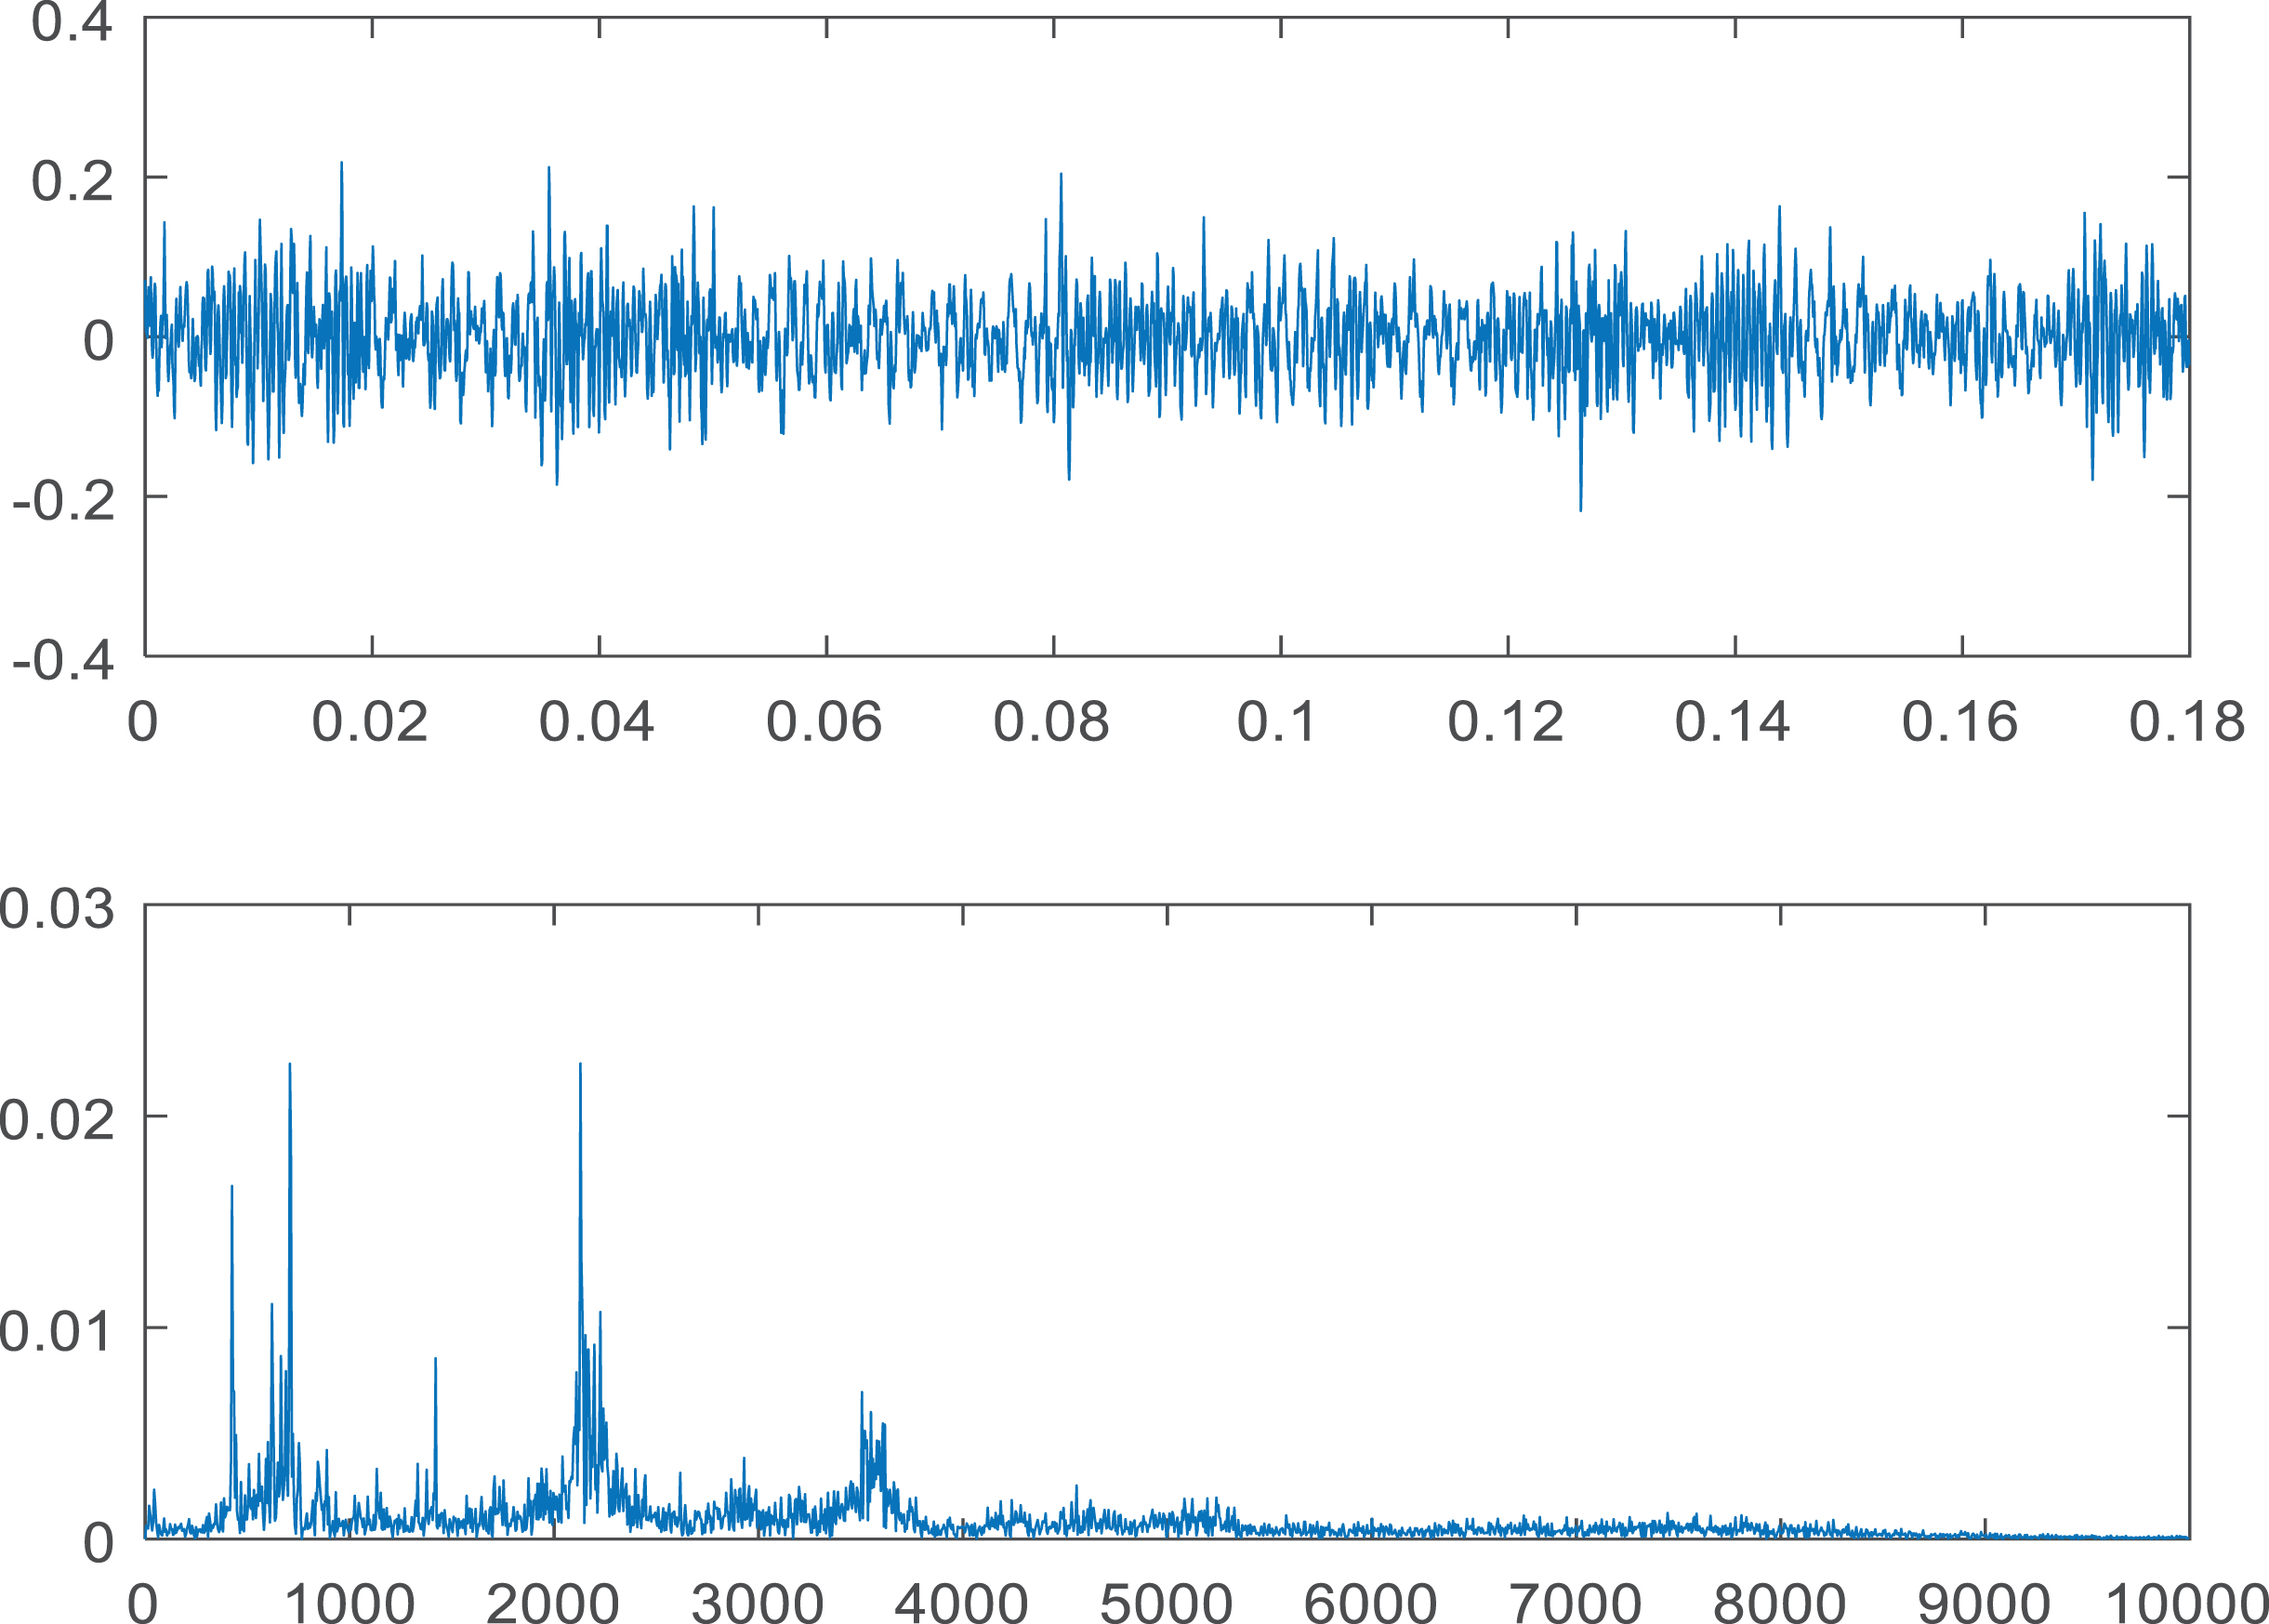
The time-domain waveform and frequency spectrum of the original fault vibration signal are shown in Fig. 18. No obvious impulse components and useful information can be observed in the time-domain waveform. In addition, interference components make the meshing frequency and its harmonics indistinct in the frequency domain. Due to the strong interferences of noises, the fault characteristics cannot be detected by only observing Fourier spectrum.
(a) Raw time signal, (b) Fourier spectrum.
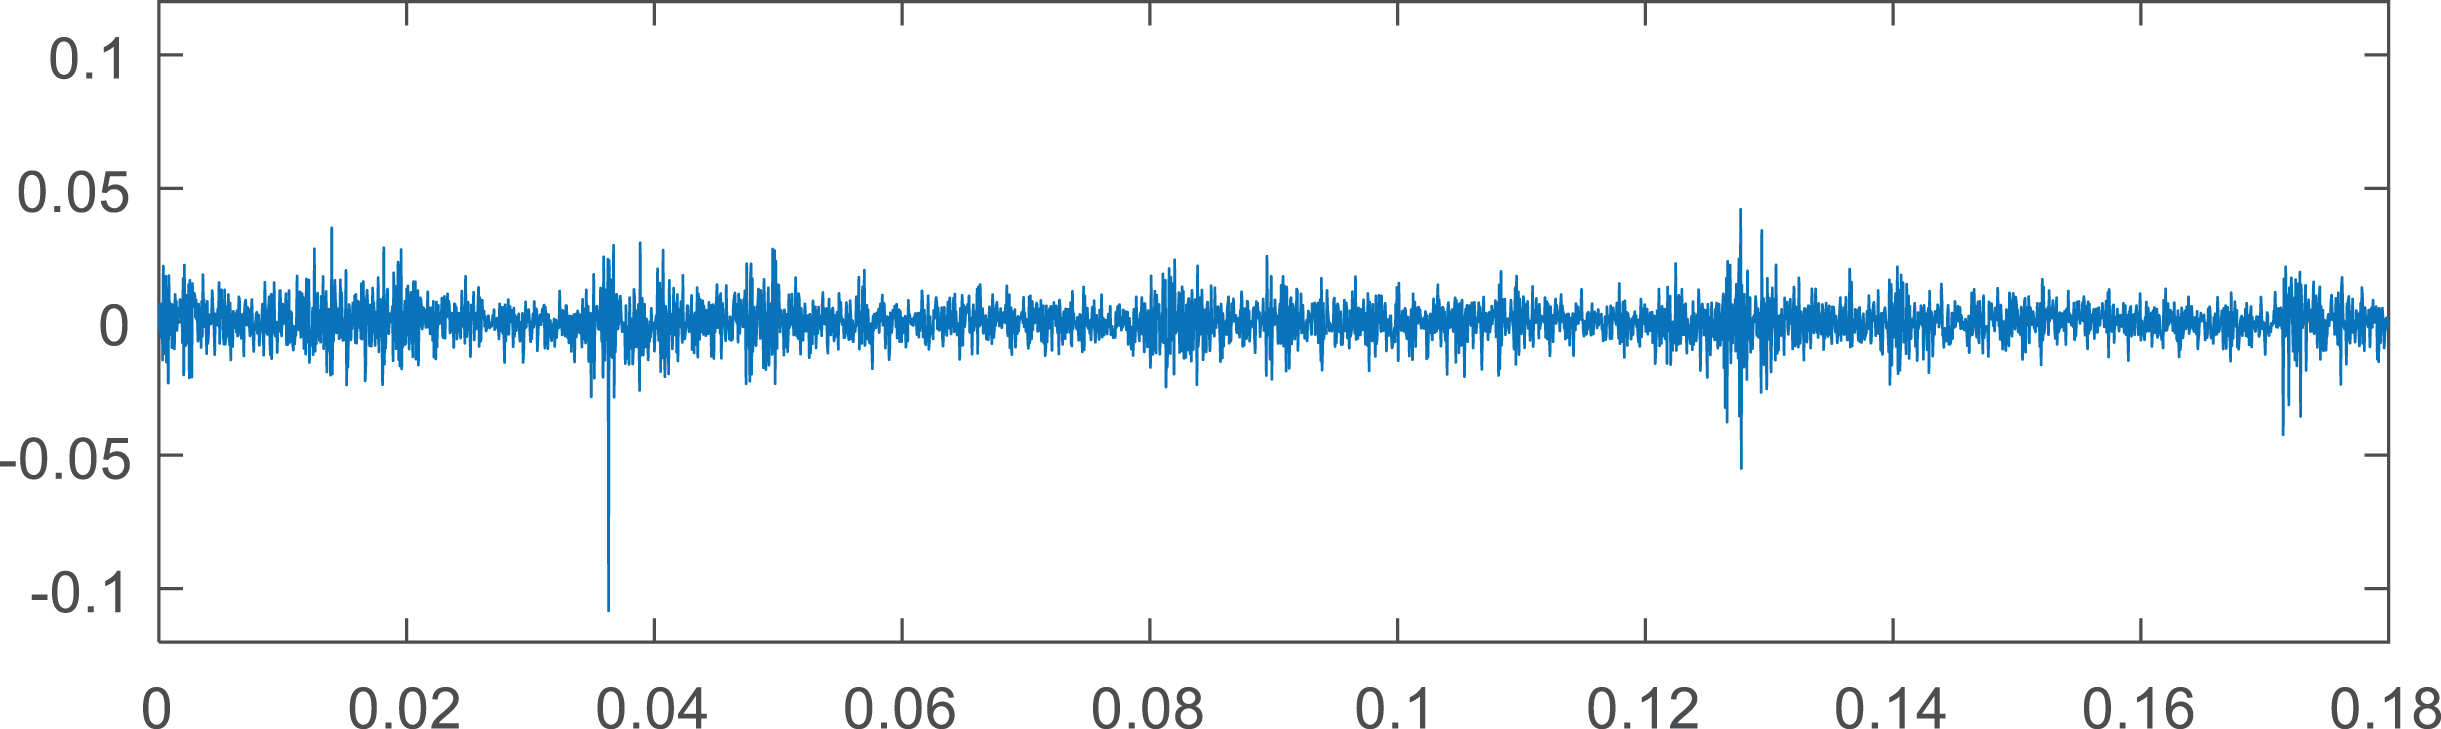
The proposed method is applied to analyze the same signals. Firstly, combining the step-length searching method with the proposed index, the optimal filter length L = 94 is taken. The filtered test signal is shown in Fig. 19.
Signal filtered using IMED.
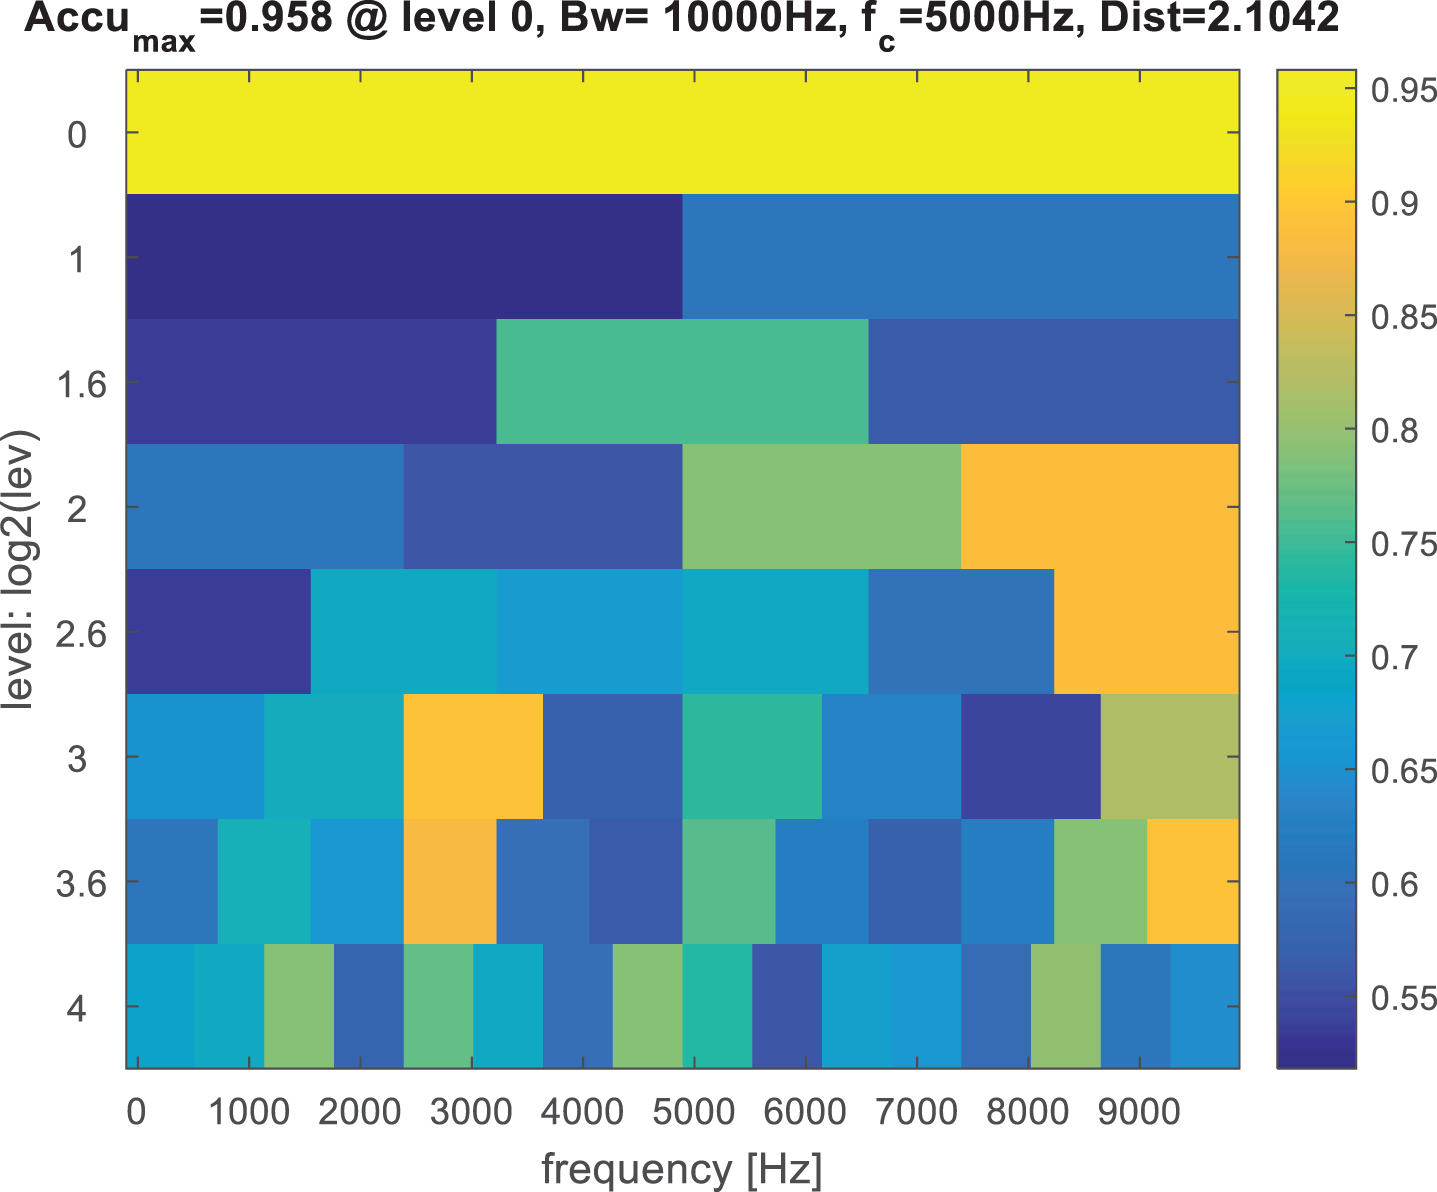
Figure 20 shows the corresponding accuracy diagram. The center frequency and bandwidth are 5000 Hz and 10000 Hz, respectively. The zoomed squared envelope spectrum is shown in Fig. 21. The gear fault characteristic frequency f s and its harmonics (2f s , 3f s , 4f s and 5f s ) can be clearly observed from the squared envelope spectrum. And the meshing frequency f m and its sidebands appear a modulation which corresponds to the fault characteristic frequency. For the gear fault characteristic frequency and its harmonics are dominant in the squared envelope spectrum, it can be inferred that the gear has a fault, possibly due to gear tooth fracture, which is consistent with the experimental scheme.
Accuracy diagram of the gear signal by the proposed method.
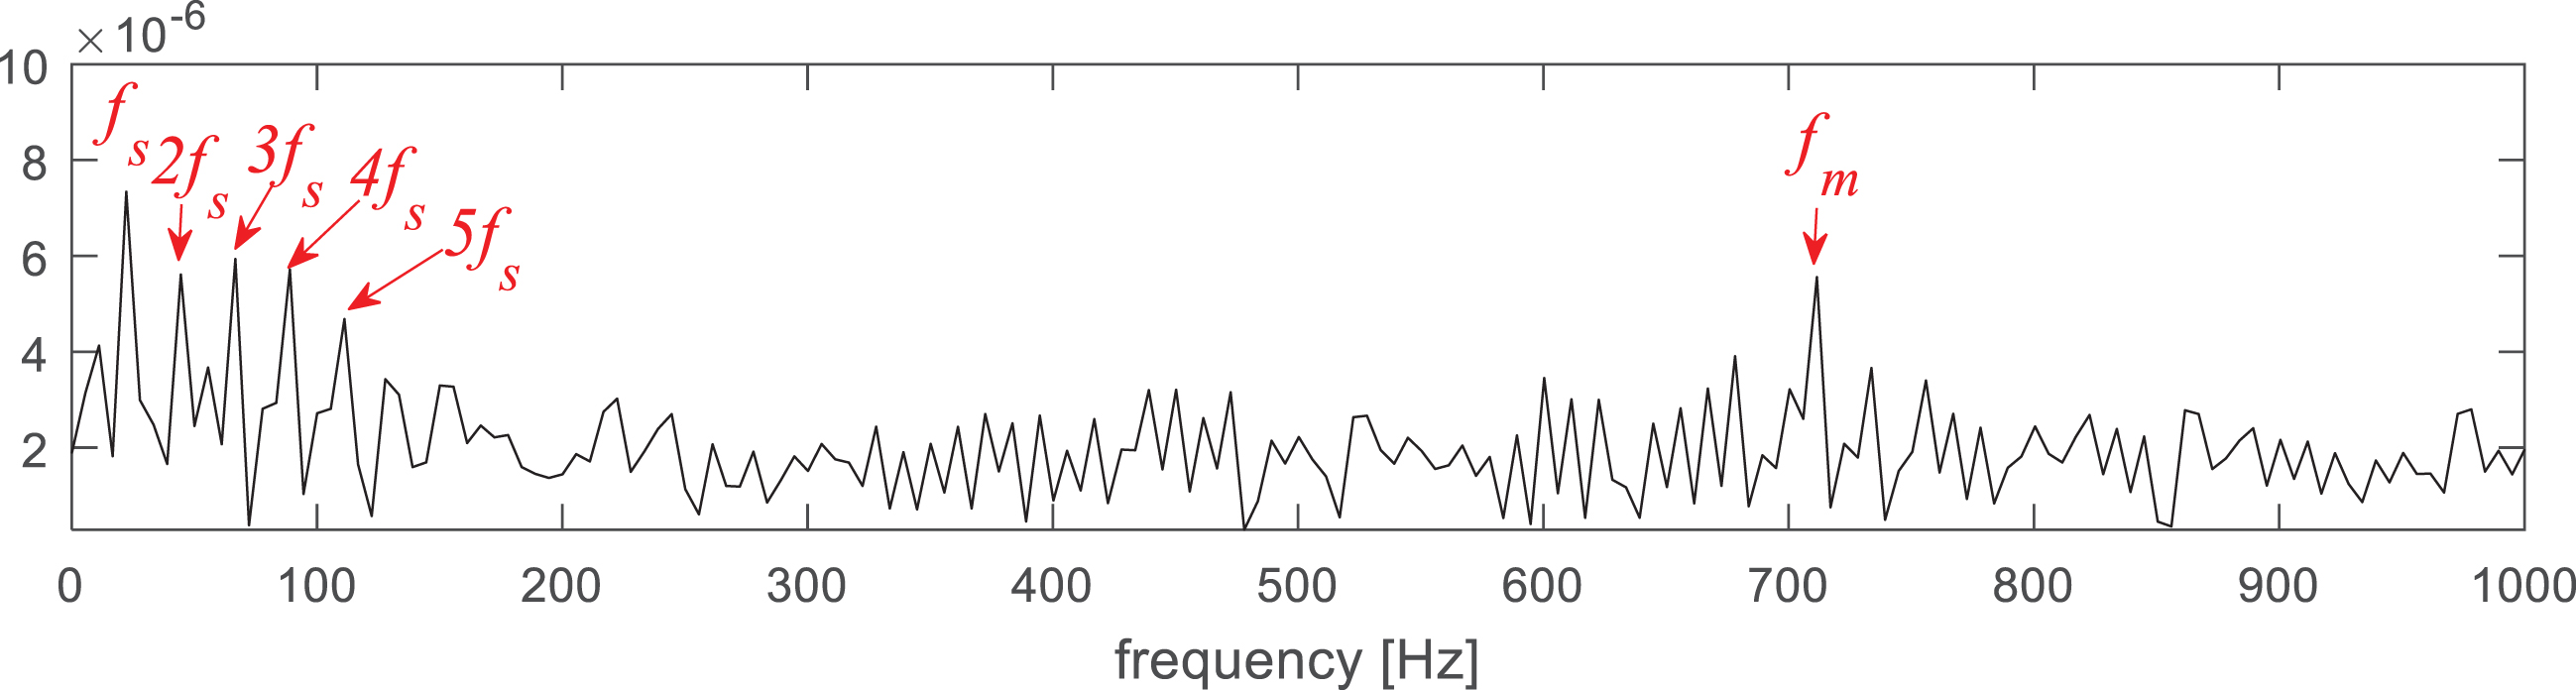
Squared envelope spectrum of the gear signal by the proposed method.
To further evaluate the advantages of the proposed method, the same comparative experimental methods as in Case 1 are used to process the above fault signals.
Figure 22 shows the analysis results of the fast kurtogram method, and Fig. 23 presents the corresponding squared envelope spectrum. Though the fault characteristic frequency f s and its harmonics can be identified, the amplitude of f s is not obvious. The meshing frequency f m is submerged by other interference frequencies.
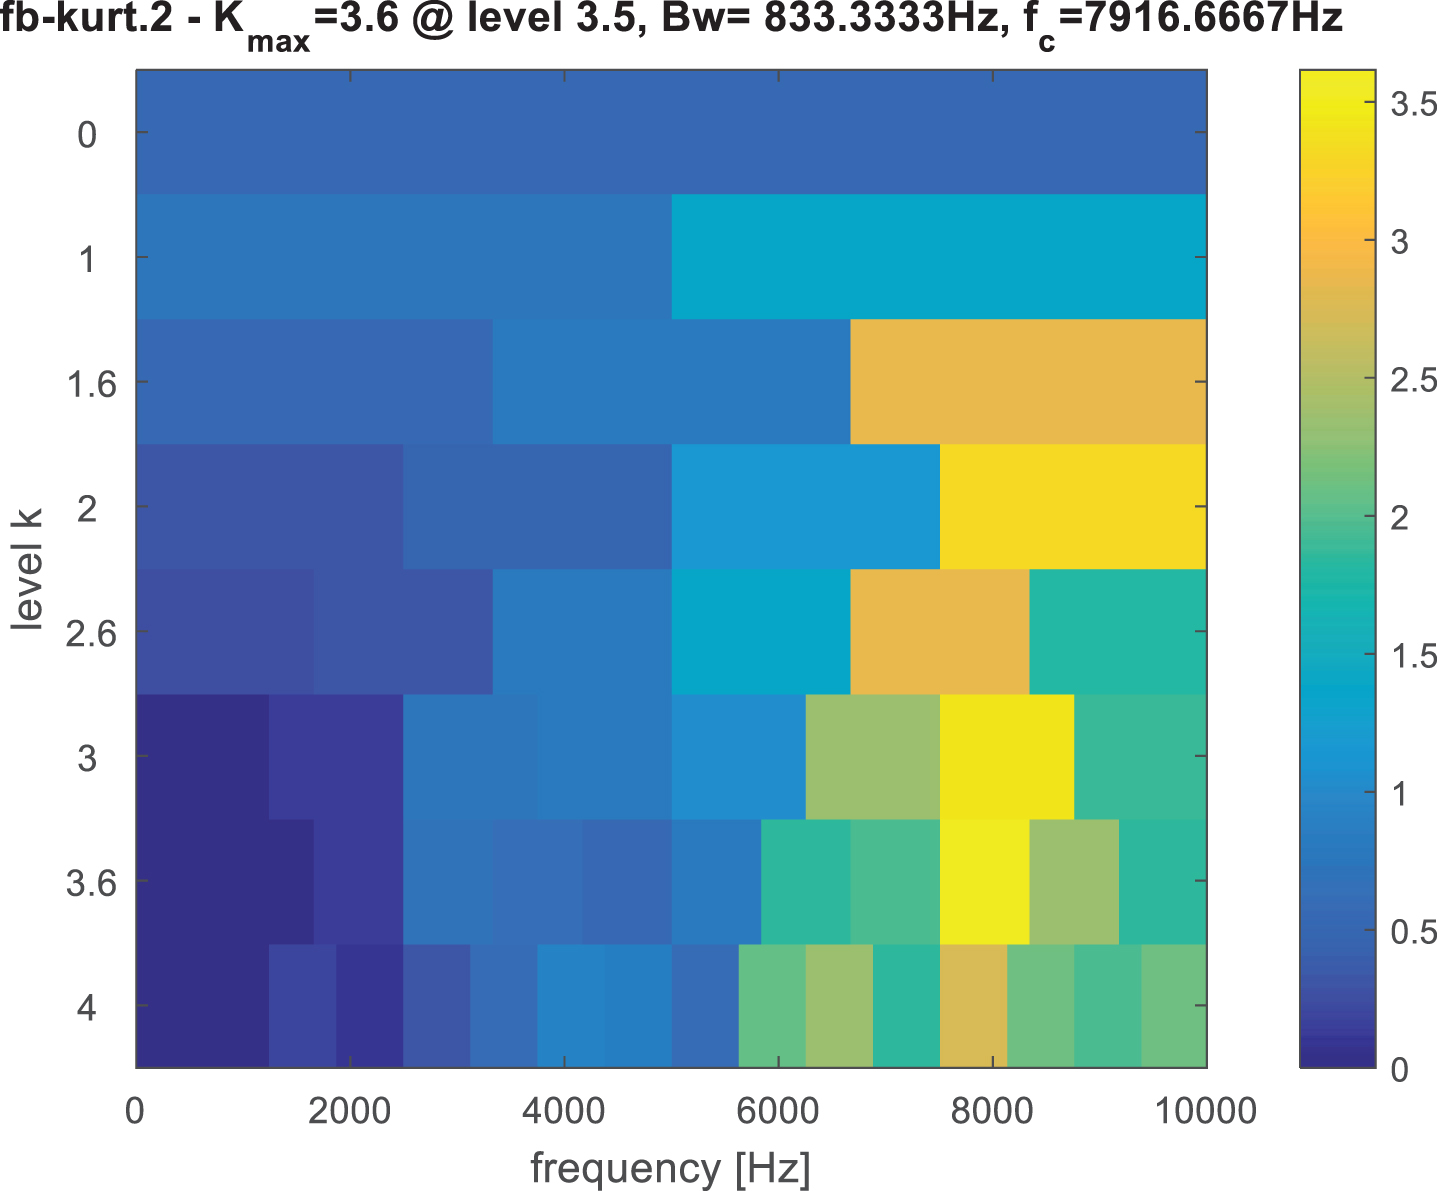
Kurtogram of the gear signal.
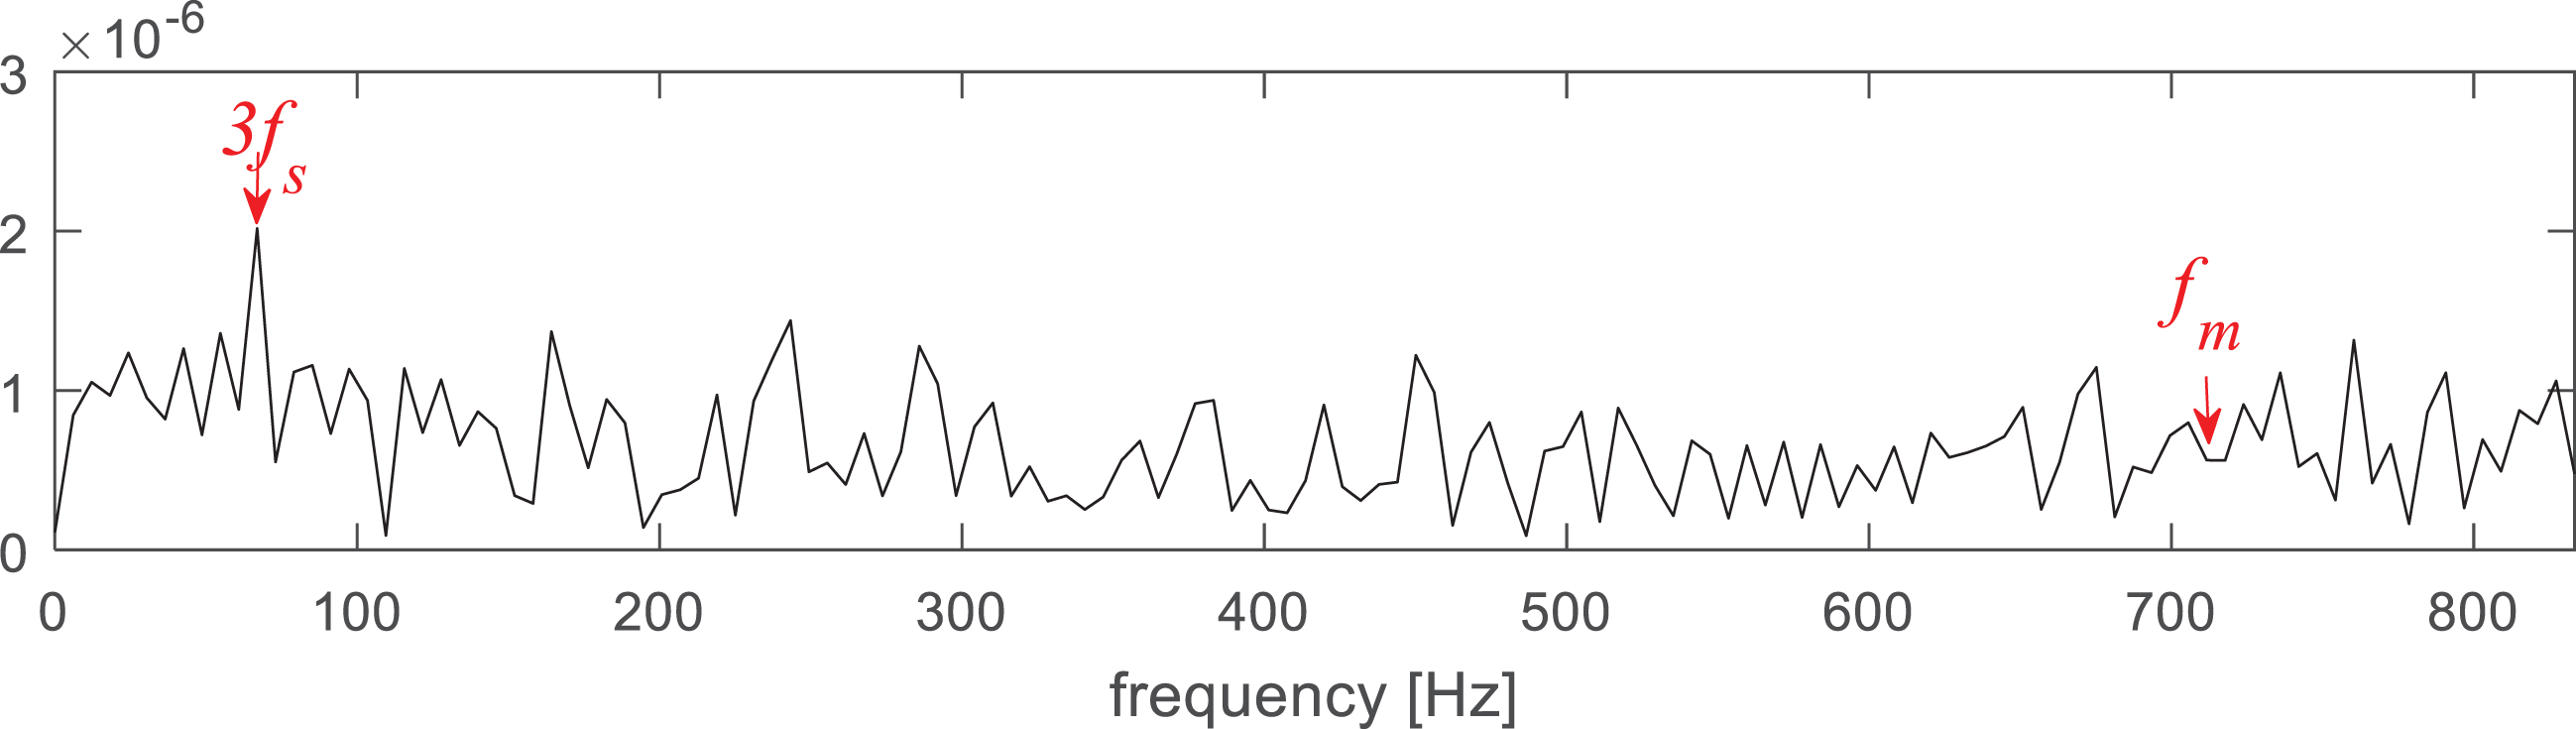
Squared envelope spectrum of the gear signal using FK.
Figure 24 shows the analysis results of the MED with FK method. We can find that the maximum kurtosis is 14.2, and the selected frequency band with maximum kurtosis is located in {f c ; Δf} = { 5000Hz ; 10000Hz } at the level 0. The corresponding squared envelope spectrum of fault signal is shown in Fig. 25. The squared envelope spectrum is same as the result of the proposed method. They contain the same fault information, so the same diagnostic result is obtained.
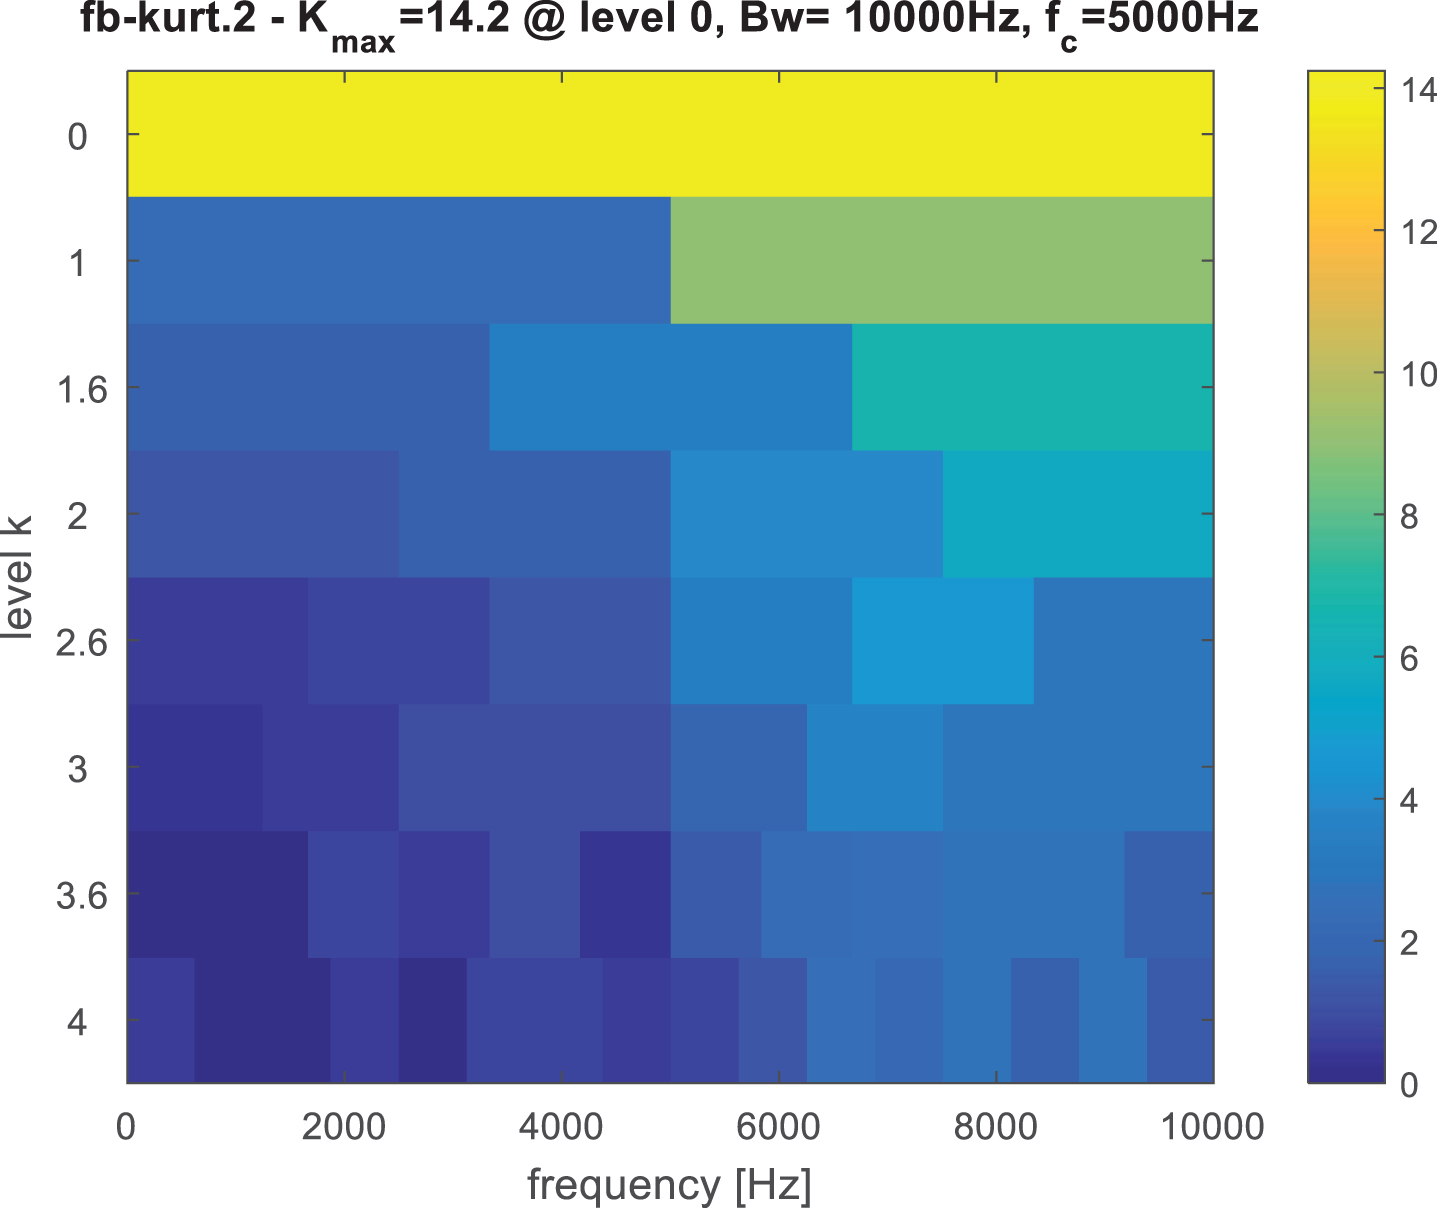
Kurtogram of the signal filtered by MED.
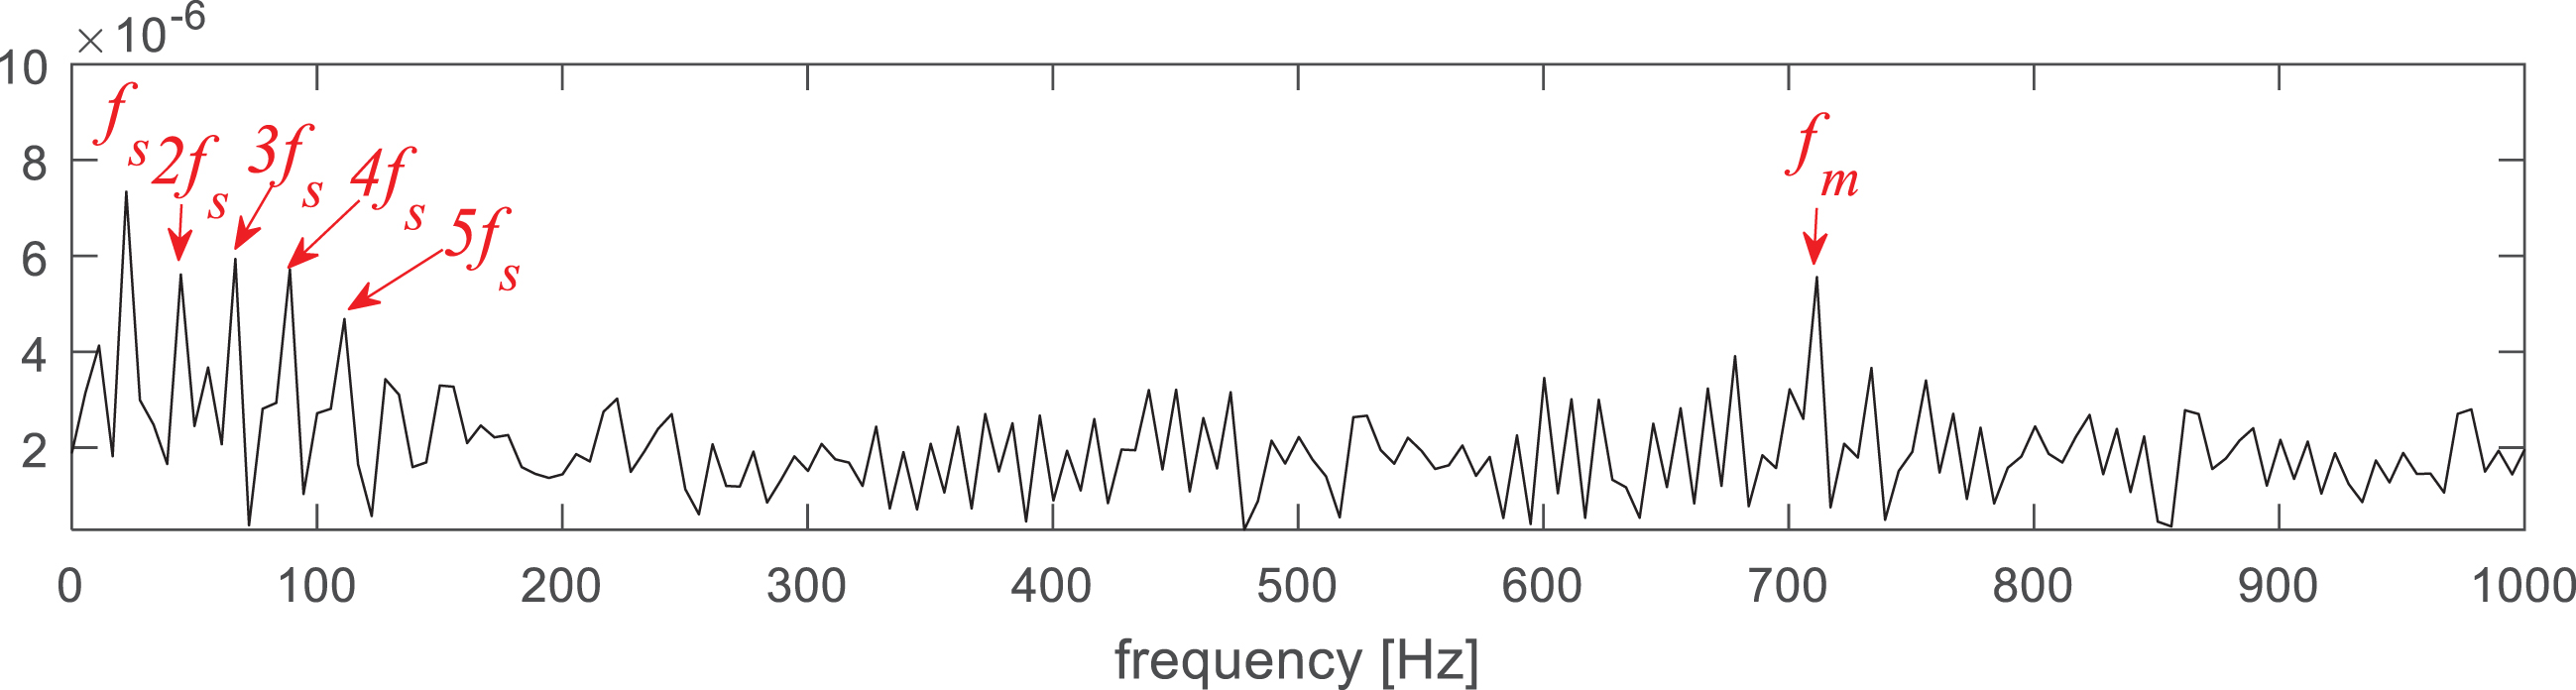
Squared envelope spectrum using MED-FK.
Then the accugram method is applied to process the same signal, and the results are presented in Figs. 26 and 27. The accuracy diagram is shown in Fig. 26. It shows a maximum accuracy rate is 0.584 at the level 3.6. The center frequency is f c = 7083Hz and its bandwidth is B w = 833Hz. The characteristic frequency f s and the meshing frequency f m cannot be identified clearly and are not dominant in the squared envelope spectrum.
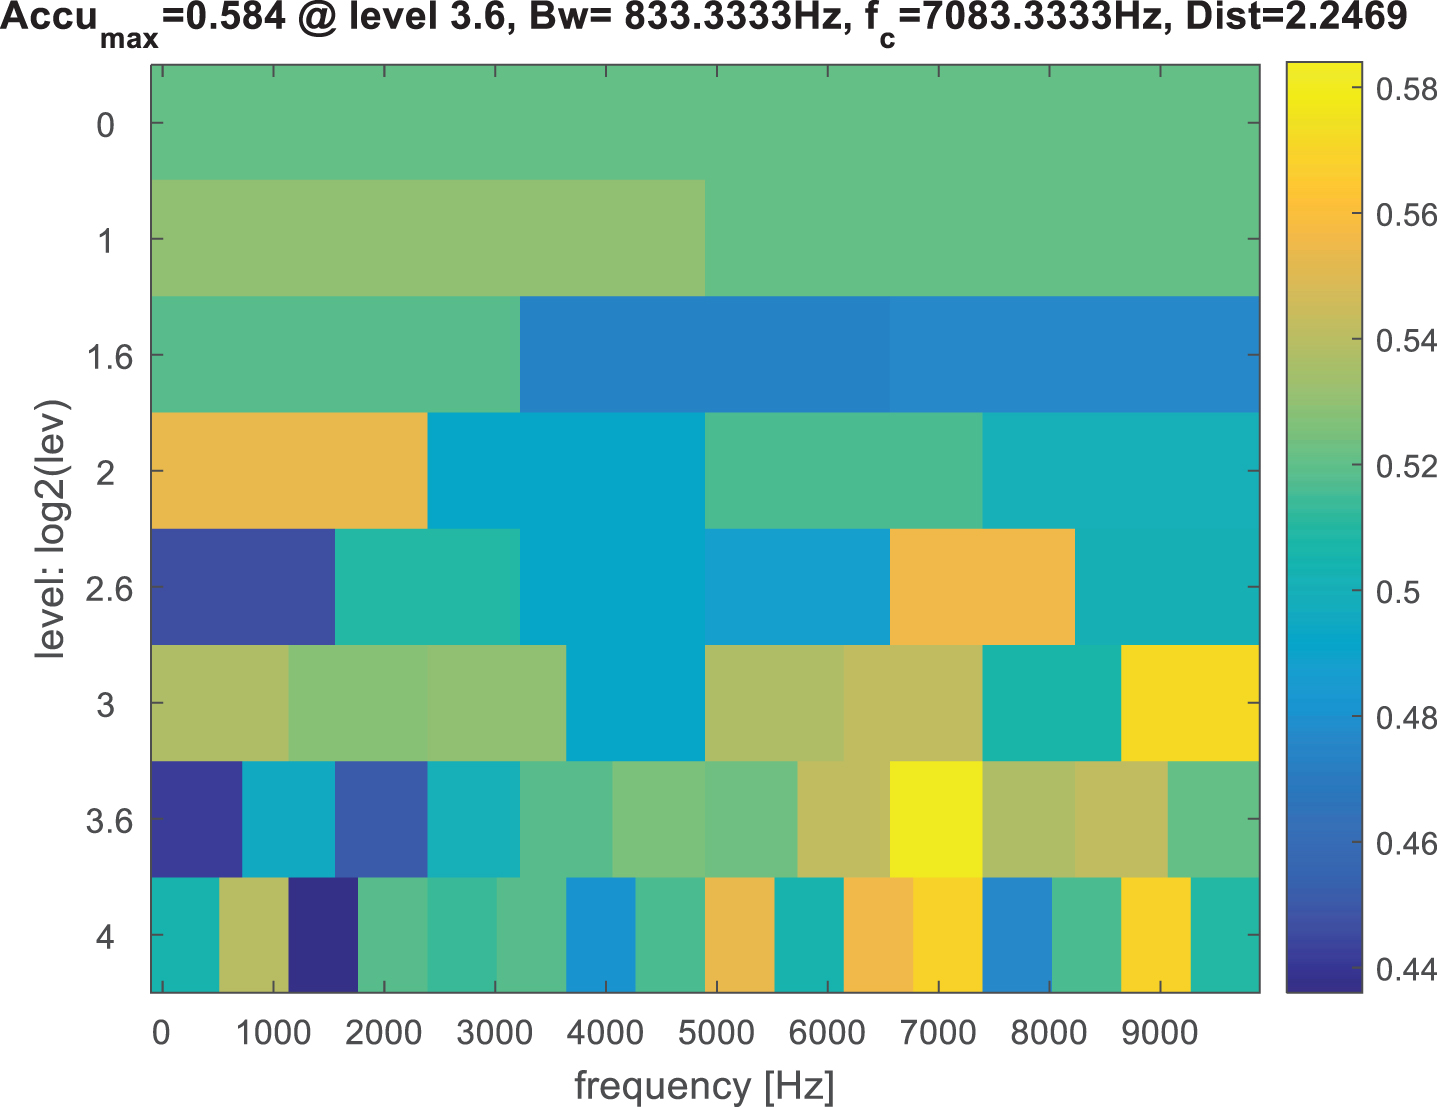
Accuracy diagram of the gear signal.
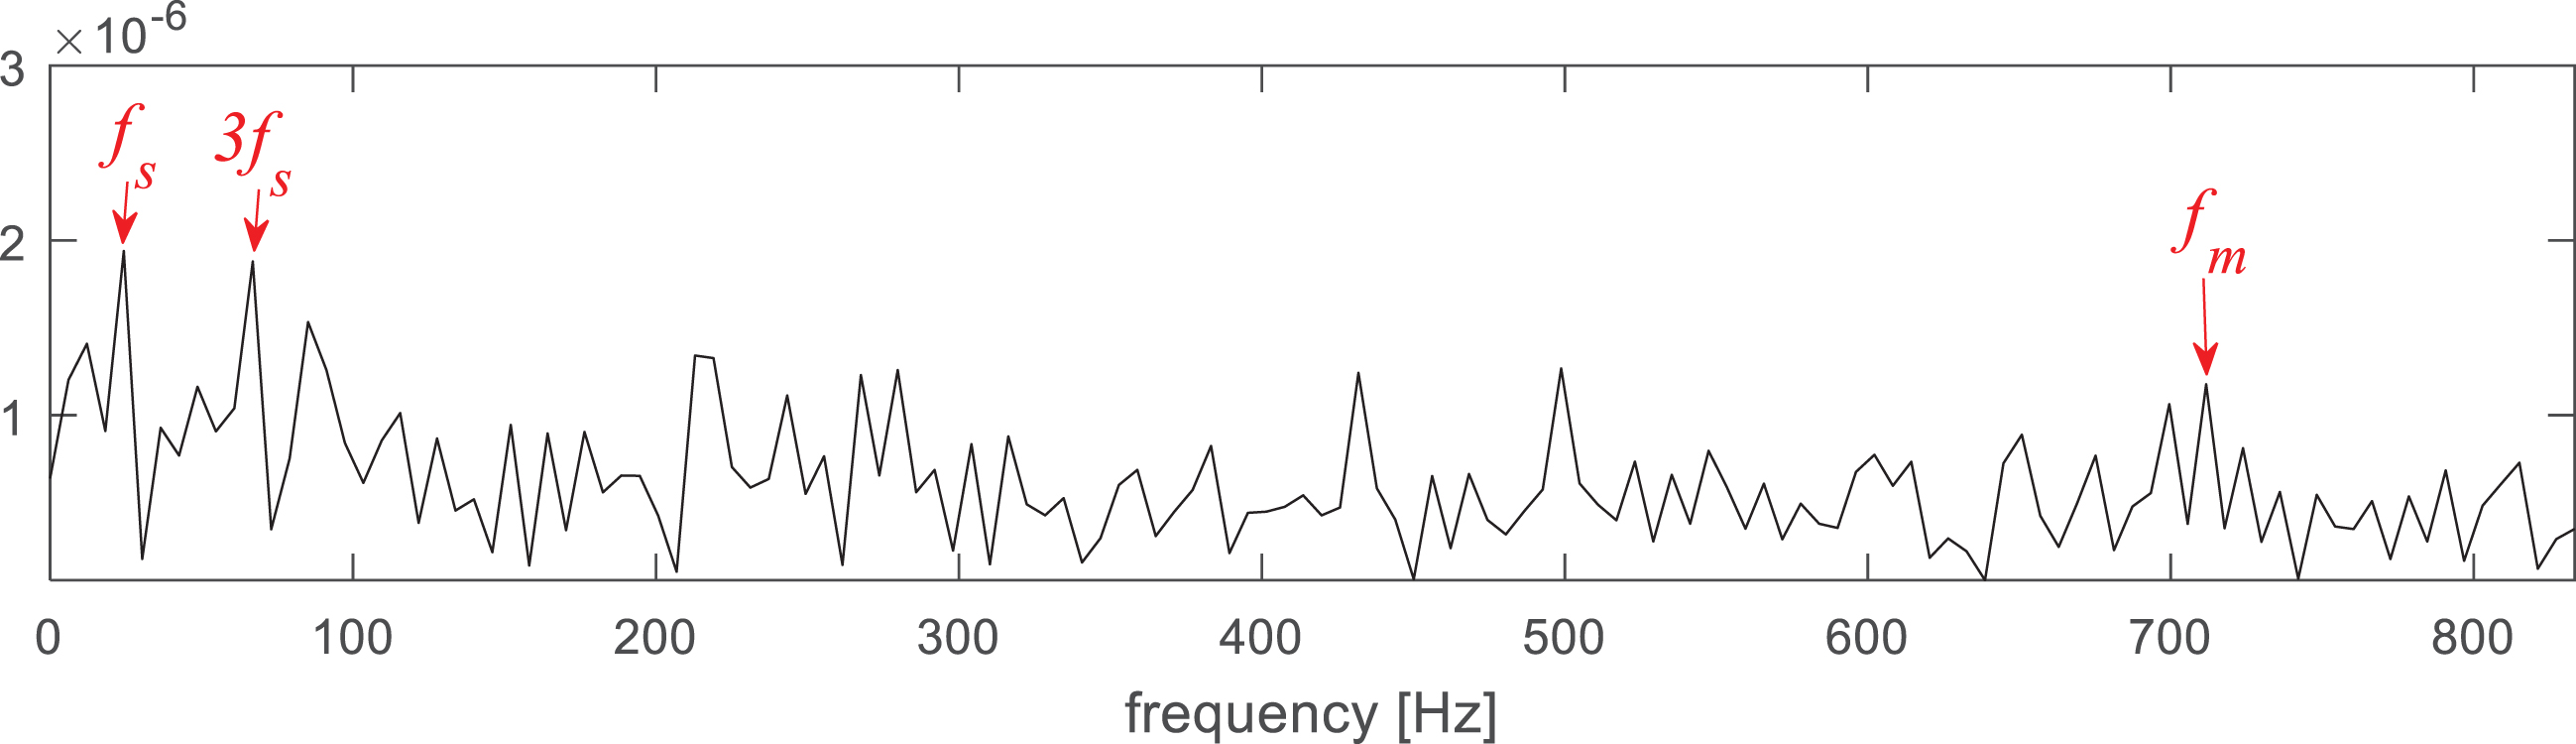
Squared envelope spectrum of the gear signal using accugram.
Figure 28 shows the analysis results using the infogram method. In this figure, the SE infogram, the SES infogram and the average infogram are displayed, and then their square envelope spectrum are obtained respectively. The fault characteristic frequency is indistinct, and not much useful information can be obtained in the SE infogram (Fig. 29). In the SES infogram (Fig. 30), the dominant frequency may be the second order harmonic (2f s ), and there are some interference frequencies that affect the real fault information. From the average infogram (Fig. 31), the small gear fault characteristic frequency f s as well as the meshing frequency f m can be observed. However, the interference components around the low-frequency band make f s and its harmonics as well as the sidebands at f m submerged.

(a) SE infogram, (b) SES infogram, (c) average infogram.
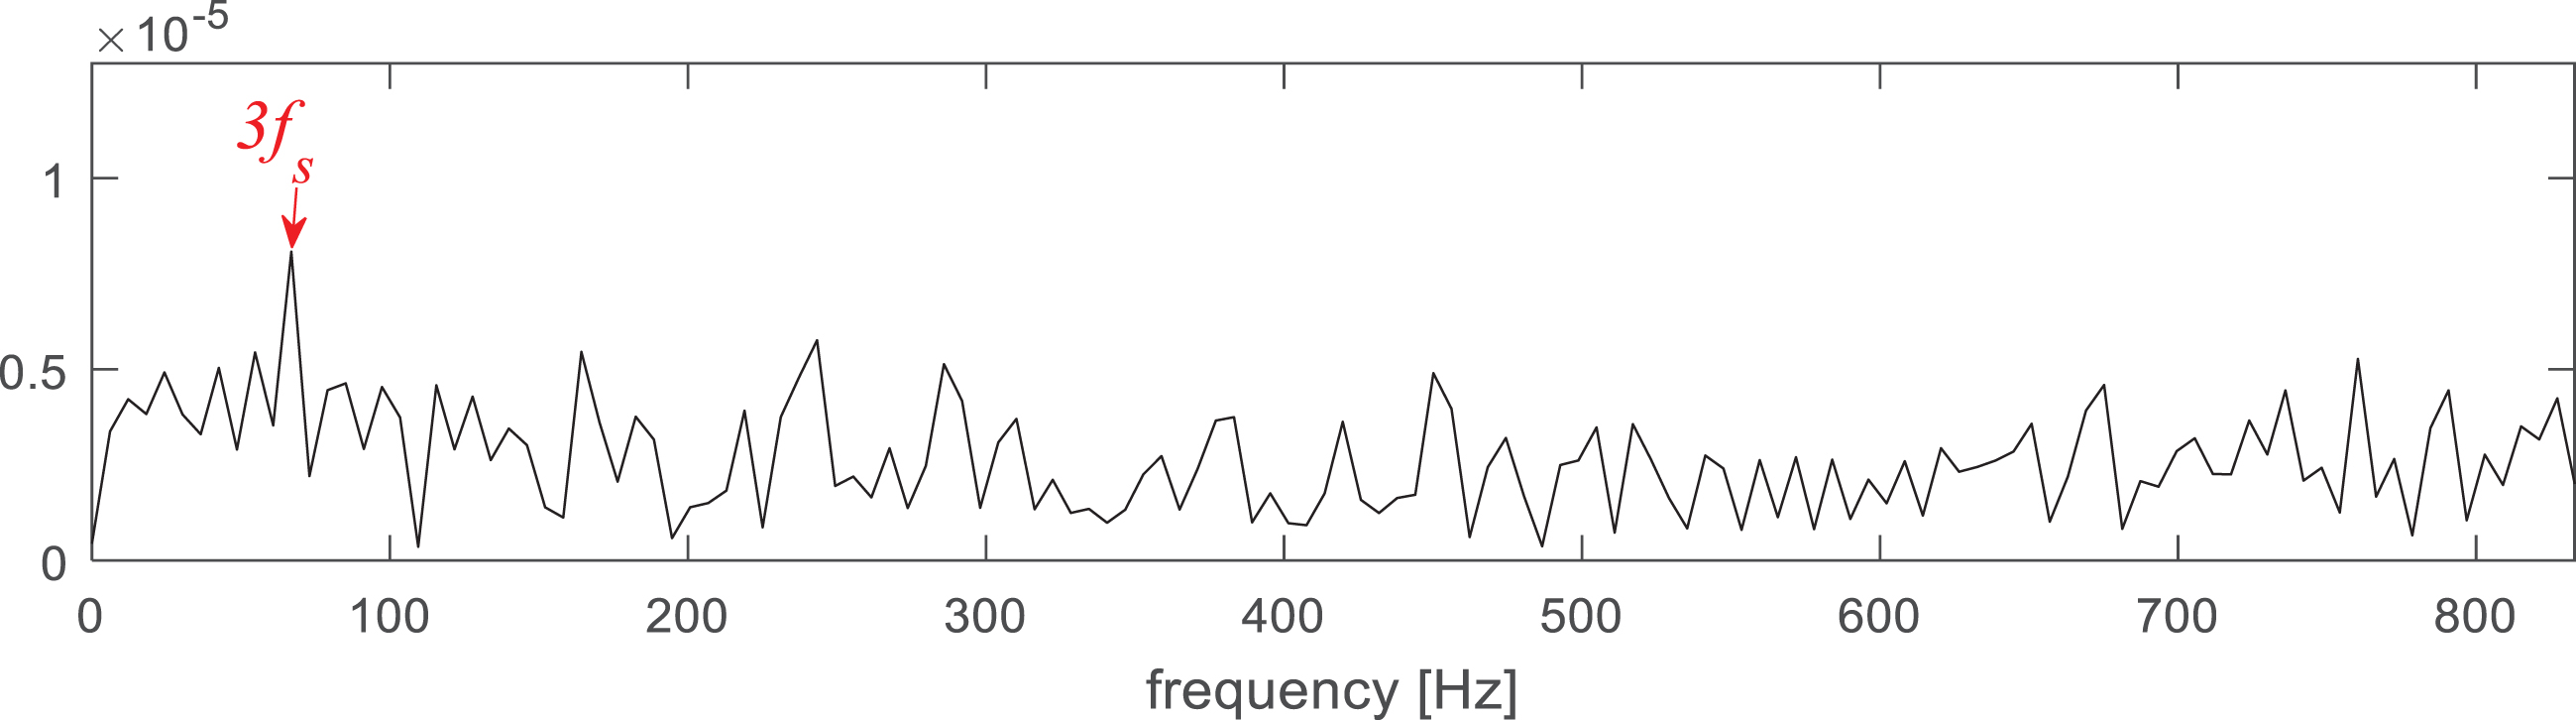
Squared envelope spectrum with SE infogram.

Squared envelope spectrum with SES infogram.
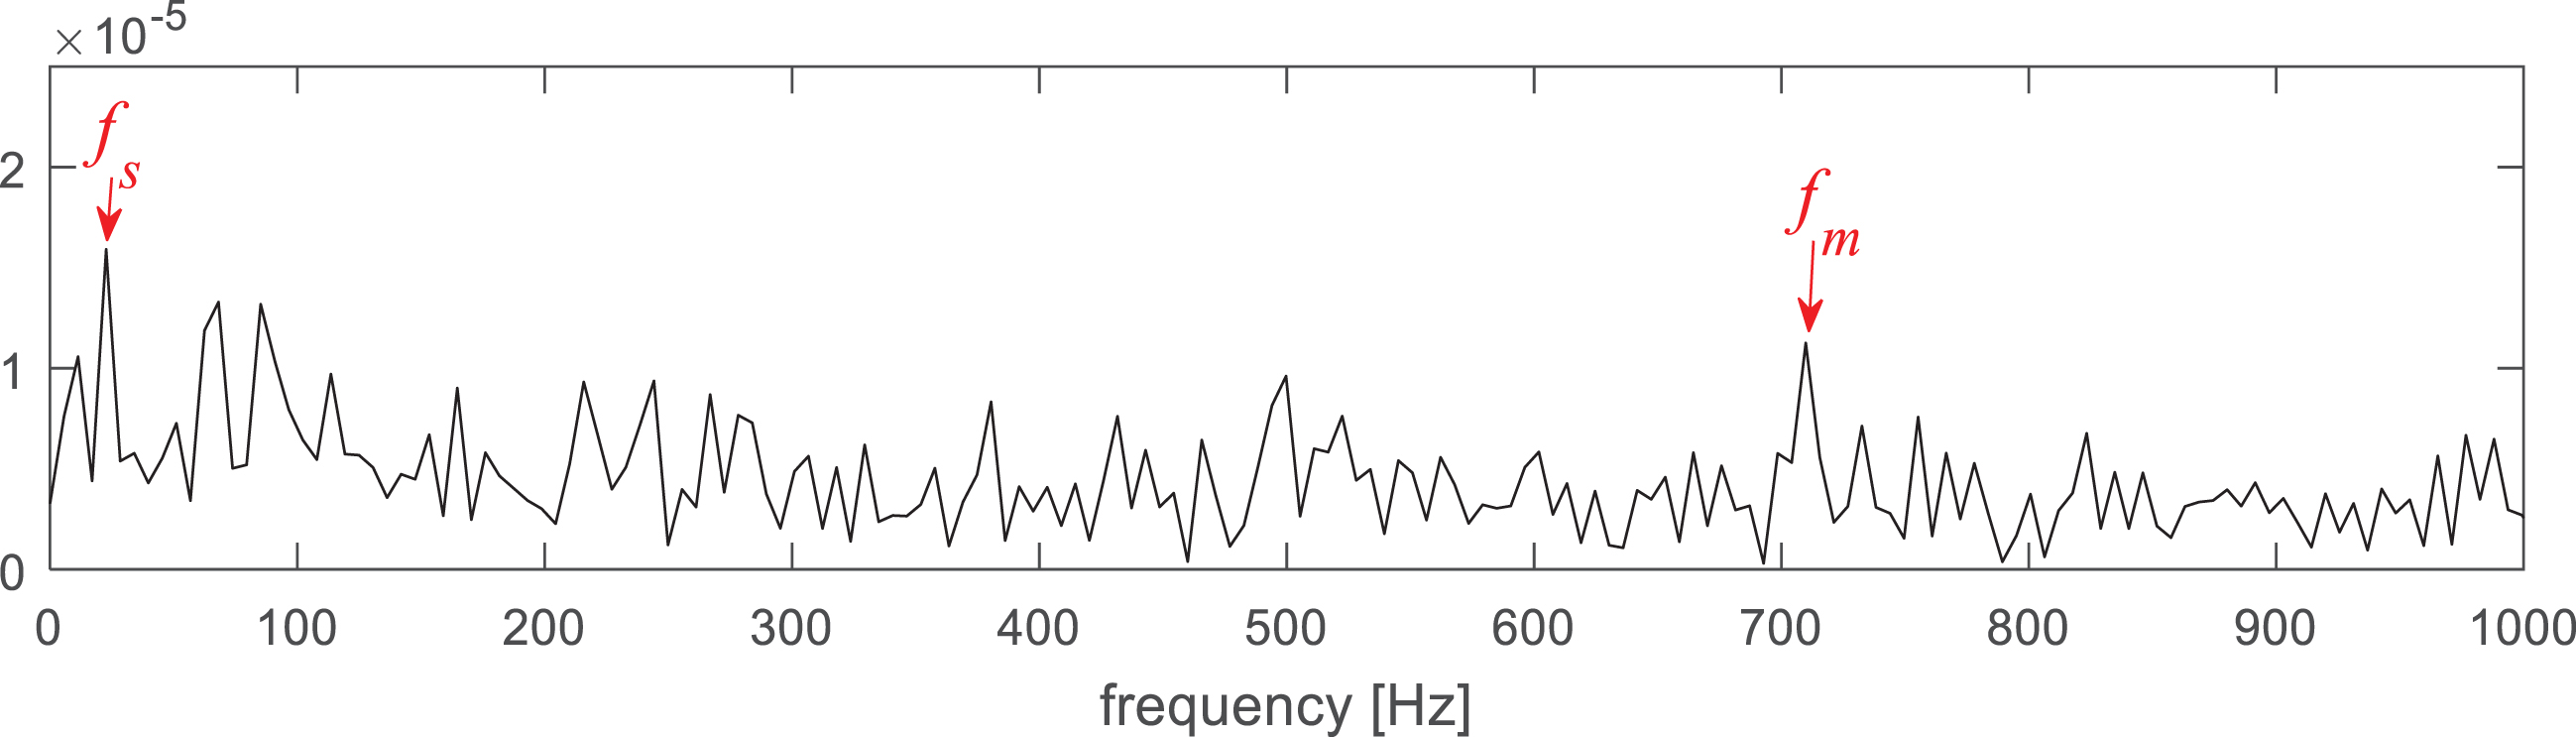
Squared envelope spectrum with average infogram.
In this case, MED-FK and the proposed method have a better effect for gear fault feature extraction than other methods. The gear fault characteristic frequency and its harmonic detected by MED-FK and the proposed method are much more obvious than those obtained by the original fast kurtogram, accugram and infogram method.
In summary, the proposed method can successfully detect the fault characteristic frequencies in both two cases. The proposed method demonstrates its effectiveness and superiority by the comparisons.
In this paper, a new method based on improved MED and accugram is proposed to extract gear fault features. Since the filtering effect of MED depends on the filter length, a new indicator based on PE and Pearson correlation coefficient is proposed. The optimal filter length can be effectively selected by the step-length searching method using the proposed index as objective function to achieve better noise reduction effect. Then the accugram method is applied to the filtered signals and the healthy signals. By the accugram algorithm, the optimal filtering band that contained the richest fault information can be found. Finally, squared envelope analysis is applied on the optimal selected frequency band to extract the fault features. The experimental results illustrate that the new method can successfully detect the fault characteristic frequency. In addition, the proposed method shows the superiority by comparing with other methods (namely FK, MED-FK, accugram and infogram).
The new index proposed in this paper only considers the permutation entropy and correlation coefficient. Future work should pay attention to the following aspects: exploring more suitable metrics to improve the frequency band division level; exploring more suitable noise reduction methods to improve the fault feature extraction performance of the accuracy algorithm.
Footnotes
Acknowledgments
The authors are grateful to the Editor-in-Chief, the Associate Editor, and anonymous reviewers for their constructive comments based on which the presentation of this paper has been greatly improved.
This work was supported by the National Natural Science Foundation of China (No.51975324), Hubei Key Laboratory of hydroelectric machinery design and maintenance (No.2020KJX11), Hubei Superior and Distinctive Discipline Group of “ Mechatronics and Automobiles” (No.XKQ2021033).
Conflicts of interests
The authors have no conflicts of interest to declare that are relevant to the content of this article.