
Abstract
Granaries should have good airtightness to reduce grain loss in storage. Prediction of granary airtightness at the design stage is beneficial in improving granary design. This paper proposes a method for the prediction interval (PI) of granary airtightness by using small sample data, which can guide designers with granary design. PI that the probability of the true target falling in it is markedly close or larger compared with the confidence level can be the decision basis of the granary design scheme. This study adopts support vector machine as the regression model trained by the airtightness data set of built granaries, and obtains the probability distribution of regression errors through information diffusion. The probability interval of errors is derived using a search algorithm, and PIs of granary airtightness can be acquired thereafter. Assessment indexes of PIs with confidence levels of 0.8 and 0.9 indicate that the proposed method can achieve confidence level and is superior to the comparative method using artificial neural network and bootstrap for PIs in cases of only a few samples. Thus, an innovative and feasible method is proposed for the computer-aided design of granary airtightness.
Introduction
Background and related studies
Although grain is an important resource, the loss of grain is heavy at the storage stage [22]. Accordingly, technical measures that reduce grain loss in storage should be adopted for global food security [20]. Reasons for grain loss include insect pests and mildew. Temperature, humidity, and other factors also affect grain quality in storage [22]. Available measures against pests include pesticide fumigation [20, 22] and carbon dioxide fumigation [36]. Some methods, such as temperature and humidity control and ozone fumigation, are effective in avoiding grain mildew during storage [10]. Moreover, reducing oxygen content and raising carbon dioxide level in the air also are effective at controlling pests [9]. Thus, strict requirements are imposed for air environment in grain storage, and grain storage facilities should have good airtightness [22, 36]. Pressure decay test (PDT), which is a technical index, has been used to evaluate the airtightness of grain storage facilities [6]. Chinese national standard in airtightness of warehouse also adopts PDT as airtightness index of granaries [12]. The testing processes are given as follows. First, air is compressed into a granary by a fan. Second, the fan is stopped when the pressure difference between the interior and exterior of the granary reaches the prescribed value (i.e., 500 Pa). Lastly, half-life of pressure difference is utilized to evaluate airtightness. The longer the half-life, the better the airtightness of the granary, and each granary grade has corresponding half-life requirements.
Evidently, a closed space is needed to ensure that granaries meet airtightness requirements. Granary airtightness considerably depends on architectural design schemes. The selection of granary type and structural measures to satisfy airtightness requirements in architectural design substantially affect granary airtightness. The prediction of granary airtightness at the design stage can guide designers, and some parts of the granary design will be modified if the prediction of airtightness cannot meet the requirements. Numerous factors influence granary airtightness, and a complex nonlinear relationship exists between influencing factors and airtightness index. Consequently, this study utilizes artificial intelligence methods to reveal the quantitative relationship between granary design scheme and airtightness and to predict granary airtightness at the design stage.
Neural networks, which are artificial intelligence methods, have been widely used in prediction because of their excellent learning ability [5, 32]. Singaravel et al. [34] applied deep neural network in civil engineering design to evaluate the energy saving of different design schemes. They reported that deep neural network can predict building energy consumption rapidly. In building design optimization, Liang et al. [24] proposed an architectural design optimization method based on BP neural network. In particular, they selected spacing coefficient, air outlet area, and height from the bottom of the window sill to the ground as the main design parameters of building ventilation, let the comprehensive performance of building ventilation design be the main optimization objective to optimize the building design. García Kerdan and Morillón Gílvez [11] proposed the integration of exergy analysis to improve building energy efficiency, specifically by utilizing artificial neural network and exergy-based surrogate modelling. Xu and Yuan [38] proposed a new green design method for energy-saving buildings employing a neural network. Input parameters of the neural work included the energy consumption quota values obtained from statistical data, thermal parameters, and energy system parameters in energy-saving standards. Thereafter, they obtained a design scheme of building shape through neural network technology. Bhamare et al. [4] developed a machine learning and deep learning-based model for the thermal performance prediction of PCM integrated roof building, and reported the good prediction performance of artificial neural network.
Neural networks are often used for point prediction. That is, the predicted result is a certain value. However, the point prediction of neural networks is unreliable in some cases owing to the defects of training data and uncertainties of neural network models; moreover, point prediction does not provide information on prediction accuracy [18]. To handle the deficiency of point prediction, prediction interval (PI) becomes another form of neural network prediction [18, 26]. PI is the prediction of a numerical interval comprising upper and lower bounds that bracket the true target of the predicted variable with a prescribed probability (i.e., confidence level) [18]. PIs can provide uncertain information for decision makers who can make decisions in accordance with the best and worst situations at a certain probability level. Thus, the risk of decision-making is considerably decreased.
Massive data are needed to train the neural network for prediction, and the number of training data affects the neural network’s calculation accuracy [2, 28]. Moreover, the prediction accuracy of neural network will decrease when the number of training data is small [30].
A large amount of data are necessary to predict granary airtightness using neural networks. To obtain data, investigators should consult the design drawings and various technical documents of built granaries. Such a consultation is costly. The costs of obtaining these data include time and money. In general, only a small amount of data can be obtained (i.e., small sample data). Uncertainties of point prediction increase when the number of sample data is small. Therefore, this study uses PIs for granary airtightness. Designers can decide whether or not to modify the airtightness designs of granaries in accordance with PIs at a nominal confidence level.
Support vector machine (SVM) based on statistical learning provides an efficient and novel model to improve generalization performance. Moreover, it can reach a global minimum. SVM can effectively solve problems with small sample data [35, 39]. Moreover, SVM can fulfill the tasks of classification, regression, and distribution estimation [7].
Information on prediction errors is also limited owing to the small sample data of granary airtightness. Information diffusion can maximize the information provided by small sample data to estimate the probability distribution of random variables. Theoretical studies and examples have proven that information diffusion is superior to classical statistical methods in processing small sample data [15, 17].
Originality and motivation
Owing to the scarcity of airtightness data of built granaries, traditional machine learning methods to predict granary airtightness at the design stage will have large errors, which cannot meet the requirements of optimizing the granary design. This study applies SVM and information diffusion to PI of granary airtightness to overcome the uncertainties of prediction results caused by small sample data, thereby making the proposed method unique.
The framework in this study is as follows. On the basis of the obtained granary airtightness data, the SVM regression model is adopted to establish mapping between the affecting factors and airtightness index. Thereafter, the probability distribution of regression errors is estimated by utilizing information diffusion. Upper and lower bounds of the probability interval of errors are acquired. Lastly, PIs of granary airtightness based on small sample data are obtained.
This paper is organized as follows. Sec. 1 deals with the background, studies related with application of neural network in civil engineering design, and small sample data processing methods. Sec. 2 elaborates the theoretical basis of this paper, assessment of PIs, and granary airtightness data set. Sec. 3 describes the calculation process and results of the proposed algorithm. Sec. 4 presents the comparative algorithm using artificial neural network (ANN) and bootstrap. Sec. 5 discusses the advantages and application conditions of the proposed algorithm. Lastly, Sec.6 concludes this paper.
Methodology
SVM model
Suppose that {(x1, t1) , …, (x
l
, t
l
)} are training vectors, where x
i
∈ R
N
is a feature vector (i.e., the model has N causal attributes) and t
i
∈ R1 is the target output (i.e., true target of the result attribute). Under given parameters C > 0 and ɛ > 0, the standard form of support vector regression [7] is as follows:
0 ⩽ α i , α i * ⩽ C, i = 1, ⋯ , l,
where Q ij = K (x i , x j ) ≡ φ (x i ) T φ (x j ), K (x i , x j ) ≡ φ (x i ) T φ (x j ) is the kernel function. In this study, K (x i , x j ) = exp(- γ ∥ x i - x j ∥ 2), γ > 0.
After solving problem (2), the approximate is function
Information diffusion
Information provided by the sample can be diffused to monitoring points by using information diffusion function.
Let E = (e1, e2, ⋯ , e
n
) be a sample, and V = (v1, v2, ⋯ , v
m
) is the monitoring space. The normal information diffusion function is as follows [16]:
Values of the diffusion coefficient [14]
Note:
Let
Thereafter, the probability distribution of monitoring space V = (v1, v2, ⋯ , v m ) can be acquired.
Let monitoring point v
L
be the lower bound of the probability interval and monitoring point v
U
be the upper bound. Ideally, the interval length should be as small as possible; that is,
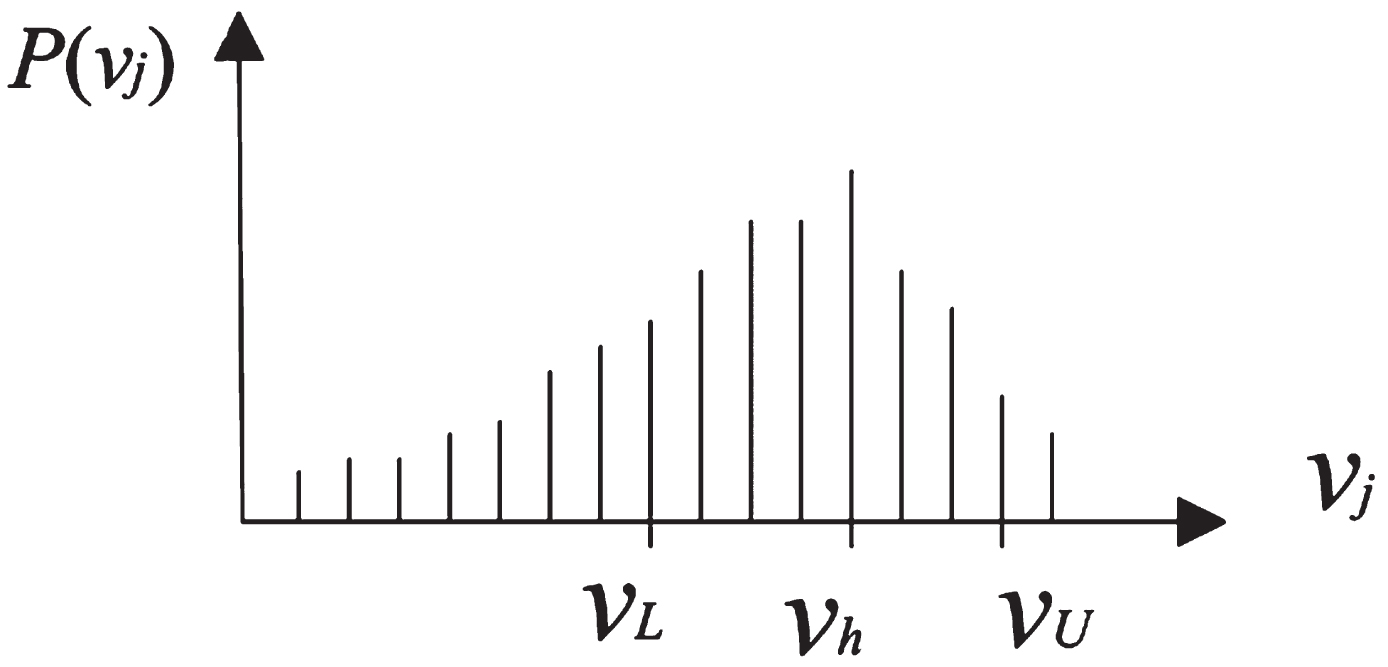
The number of monitoring points is finite. Thus, v L and v U can be found by the search algorithm. A feasible strategy is to take the monitoring point v h of the maximum probability as the center and search v L , v U from v h to both sides, as shown in Fig. 1.
The algorithm to find v L and v U is as follows:
Upper and lower bounds of the probability interval.
Suppose that f (x) is a regression function established by SVM. Thus, n instances exist in the data set, which is {(x1, t1) , …, (x
n
, t
n
)}, where x
i
∈ R
N
is the feature vector and t
i
∈ R1 is the target output. The following equation is obtained as follows [33]:
If the probability distribution of E
i
is known, then the following can be acquired:
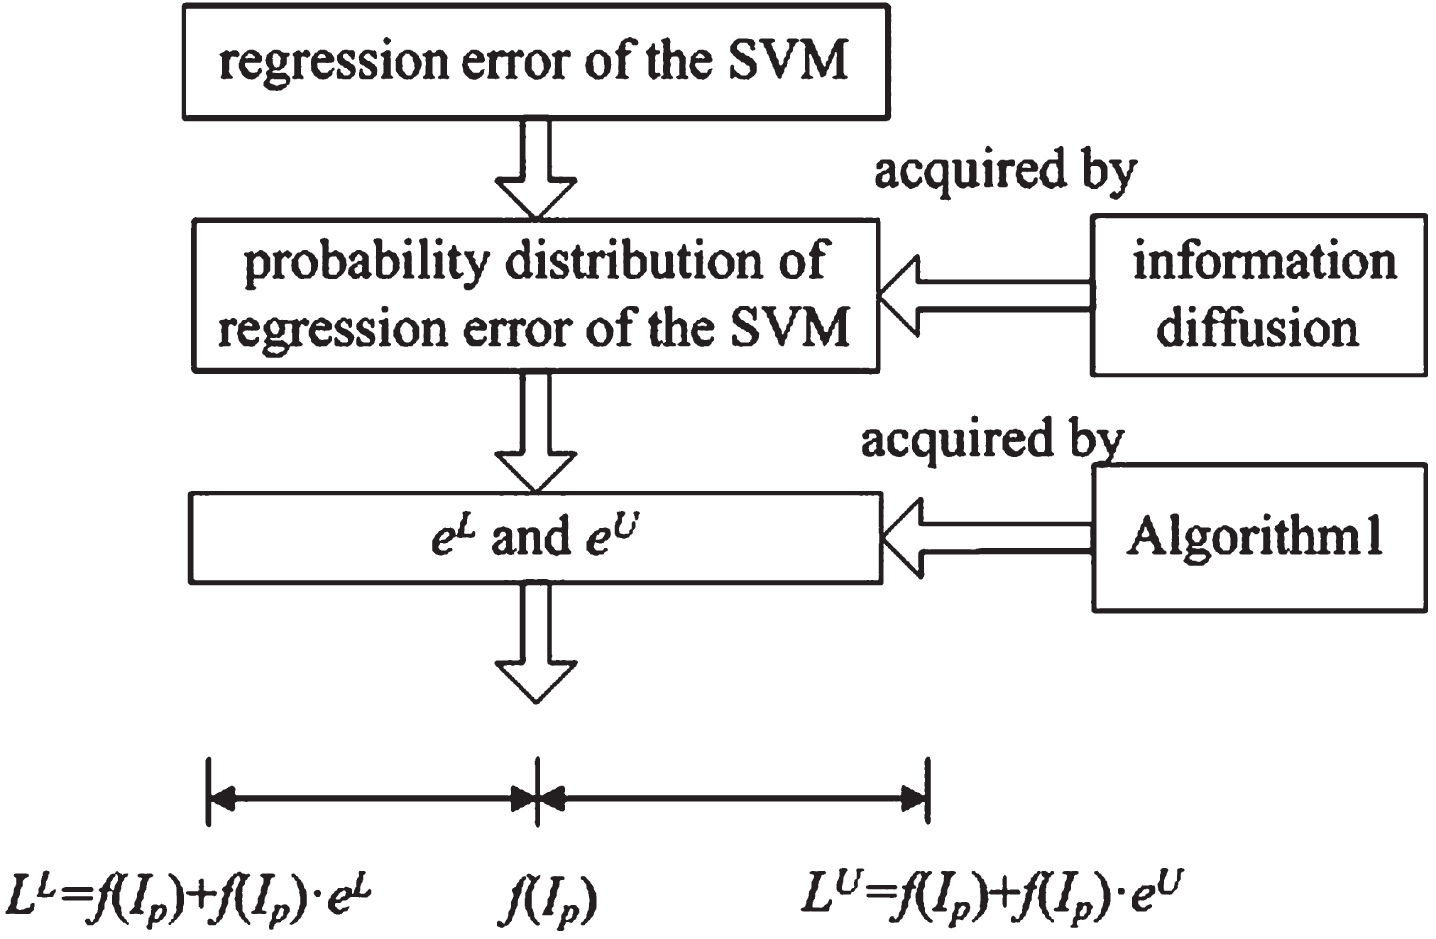
If n instances exist, then (e1, …, e n ) can be obtained using Equation (9), where is the observed value of E i . Thereafter, the probability distribution of monitoring points can be obtained by utilizing information diffusion, where e L and e U can be derived by Algorithm 1.
Thereafter, the following is obtained:
Several instances are input into the trained SVM to obtain the prediction values and errors. Thereafter, probability distribution of errors is obtained through information diffusion. Probability interval of errors at a certain confidence level can be acquired using Algorithm 1. Moreover, PI of the instance to be predicted is determined according to its point prediction and the upper and lower bounds of the probability interval of errors. The schematic of the preceding process is shown as Fig. 2.
Schematic for calculating PI according to the probability distribution of error ratio.
Reliability and width are involved in assessing PIs [18].
Reliability of PIs, which involves whether or not the probability of the true target falling within the PI can achieve the confidence level, is vital for decision makers. Reliability of PIs can be evaluated using the PI coverage probability (PICP).
A satisfactory PICP should be close to or greater than the confidence level for PI [18]. Interval width is closely related to PICP. A large interval width indicates a high PICP, and vice versa. However, if the interval width is considerably large, then minimal or no help will be brought to the decision makers. Therefore, interval width should be as narrow as possible on the premise of ensuring that PICP can meet the requirement. Consequently, the following measure to evaluate PI (i.e., mean PI width (MPIW)) is used:
Moreover, a comprehensive index is needed to evaluate PI quality. Coverage width-based criterion (CWC) can combine PICP and NMPIW into a single index [18]:
Description of the granary airtightness data set
Sample data of built granaries are derived from several provinces in China. A total of 112 instances are found in the sample data, which are of 18 causal attributes and one result attribute (i.e., half-life of 500 Pa pressure). The form of this data set is a matrix, in which each column corresponds to an attribute and each row is an instance. The data set is called GAS. Causal attributes are selected according to experts in granary design and operation management. The result attribute is the half-life of 500 Pa pressure [12]. Table 2 describes the cause and result attributes.
Attribute description of the granary airtightness data set
Attribute description of the granary airtightness data set
Note: Attribute with * is the result attribute.
Data preprocessing can improve the efficiency, accuracy, and generalization ability of the machine learning model. The two types of attributes are numerical and categorical. Numerical attributes are comparable and ordered, whereas categorical attributes are neither comparable nor ordered. Data preprocessing methods adopted in this study include data normalization of numerical attributes and one-hot encoding of categorical attributes [27].
(1) In the data normalization procedure, data are scaled as follows:
Data can be mapped to [0, 1] by utilizing Equation (19).
(2) One-hot encoding is applied to categorical attributes, which encodes categorical attributes into binary vectors. For example, three types are preprocessed by utilizing one-hot encoding. Thereafter, types 1, 2, and 3 are encoded into (1,0,0), (0,1,0), and (0,0,1), respectively.
Algorithm using SVM and information diffusion for PIs
The data set D l is divided into D t and D d , where D t is used to train SVM and D d is employed to acquire the probability distribution of SVM’s prediction error. PI of a new instance to be predicted can be worked out thereafter on the basis of the point prediction of the trained SVM and probability distribution of error.
The process of the algorithm using SVM and information diffusion for PIs is shown in Fig. 3.
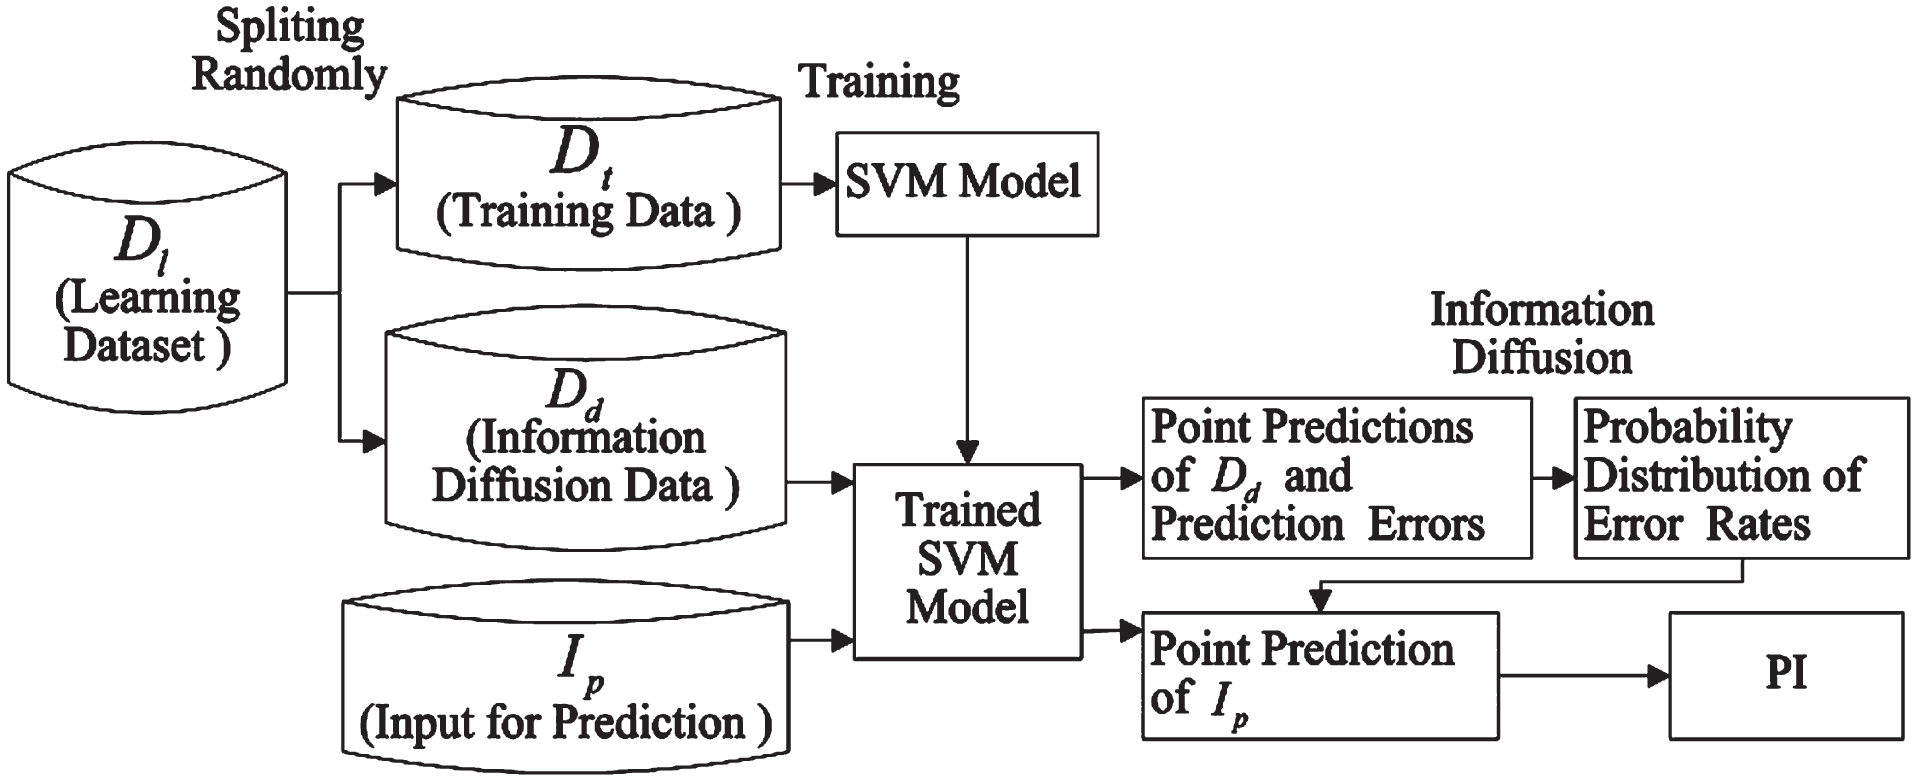
Process of the algorithm using SVM and information diffusion for PIs.
The algorithm is summarized as follows:
Cross validation
Cross validation is a typical method for verifying the machine learning model [1]. The leave-one-out cross validation is adopted in this study. That is, an instance is taken from the data set at a time in order as validation data, the remainder of the data set is used for training the model. This step is repeated several times until all instances of the data set are validated. In the leave-one-out cross validation, the test set includes every instance in the data set. The process is shown as follows:
Results of Algorithm 3 using GAS
Let m = 22, n = 33, l = 78, and the confidence levels be 0.8 and 0.9. A total of 112 instances are available in GAS, and the data set is preprocessed as input of Algorithm 3. PIs of the 112 instances in GAS are acquired as shown in Fig. 4.
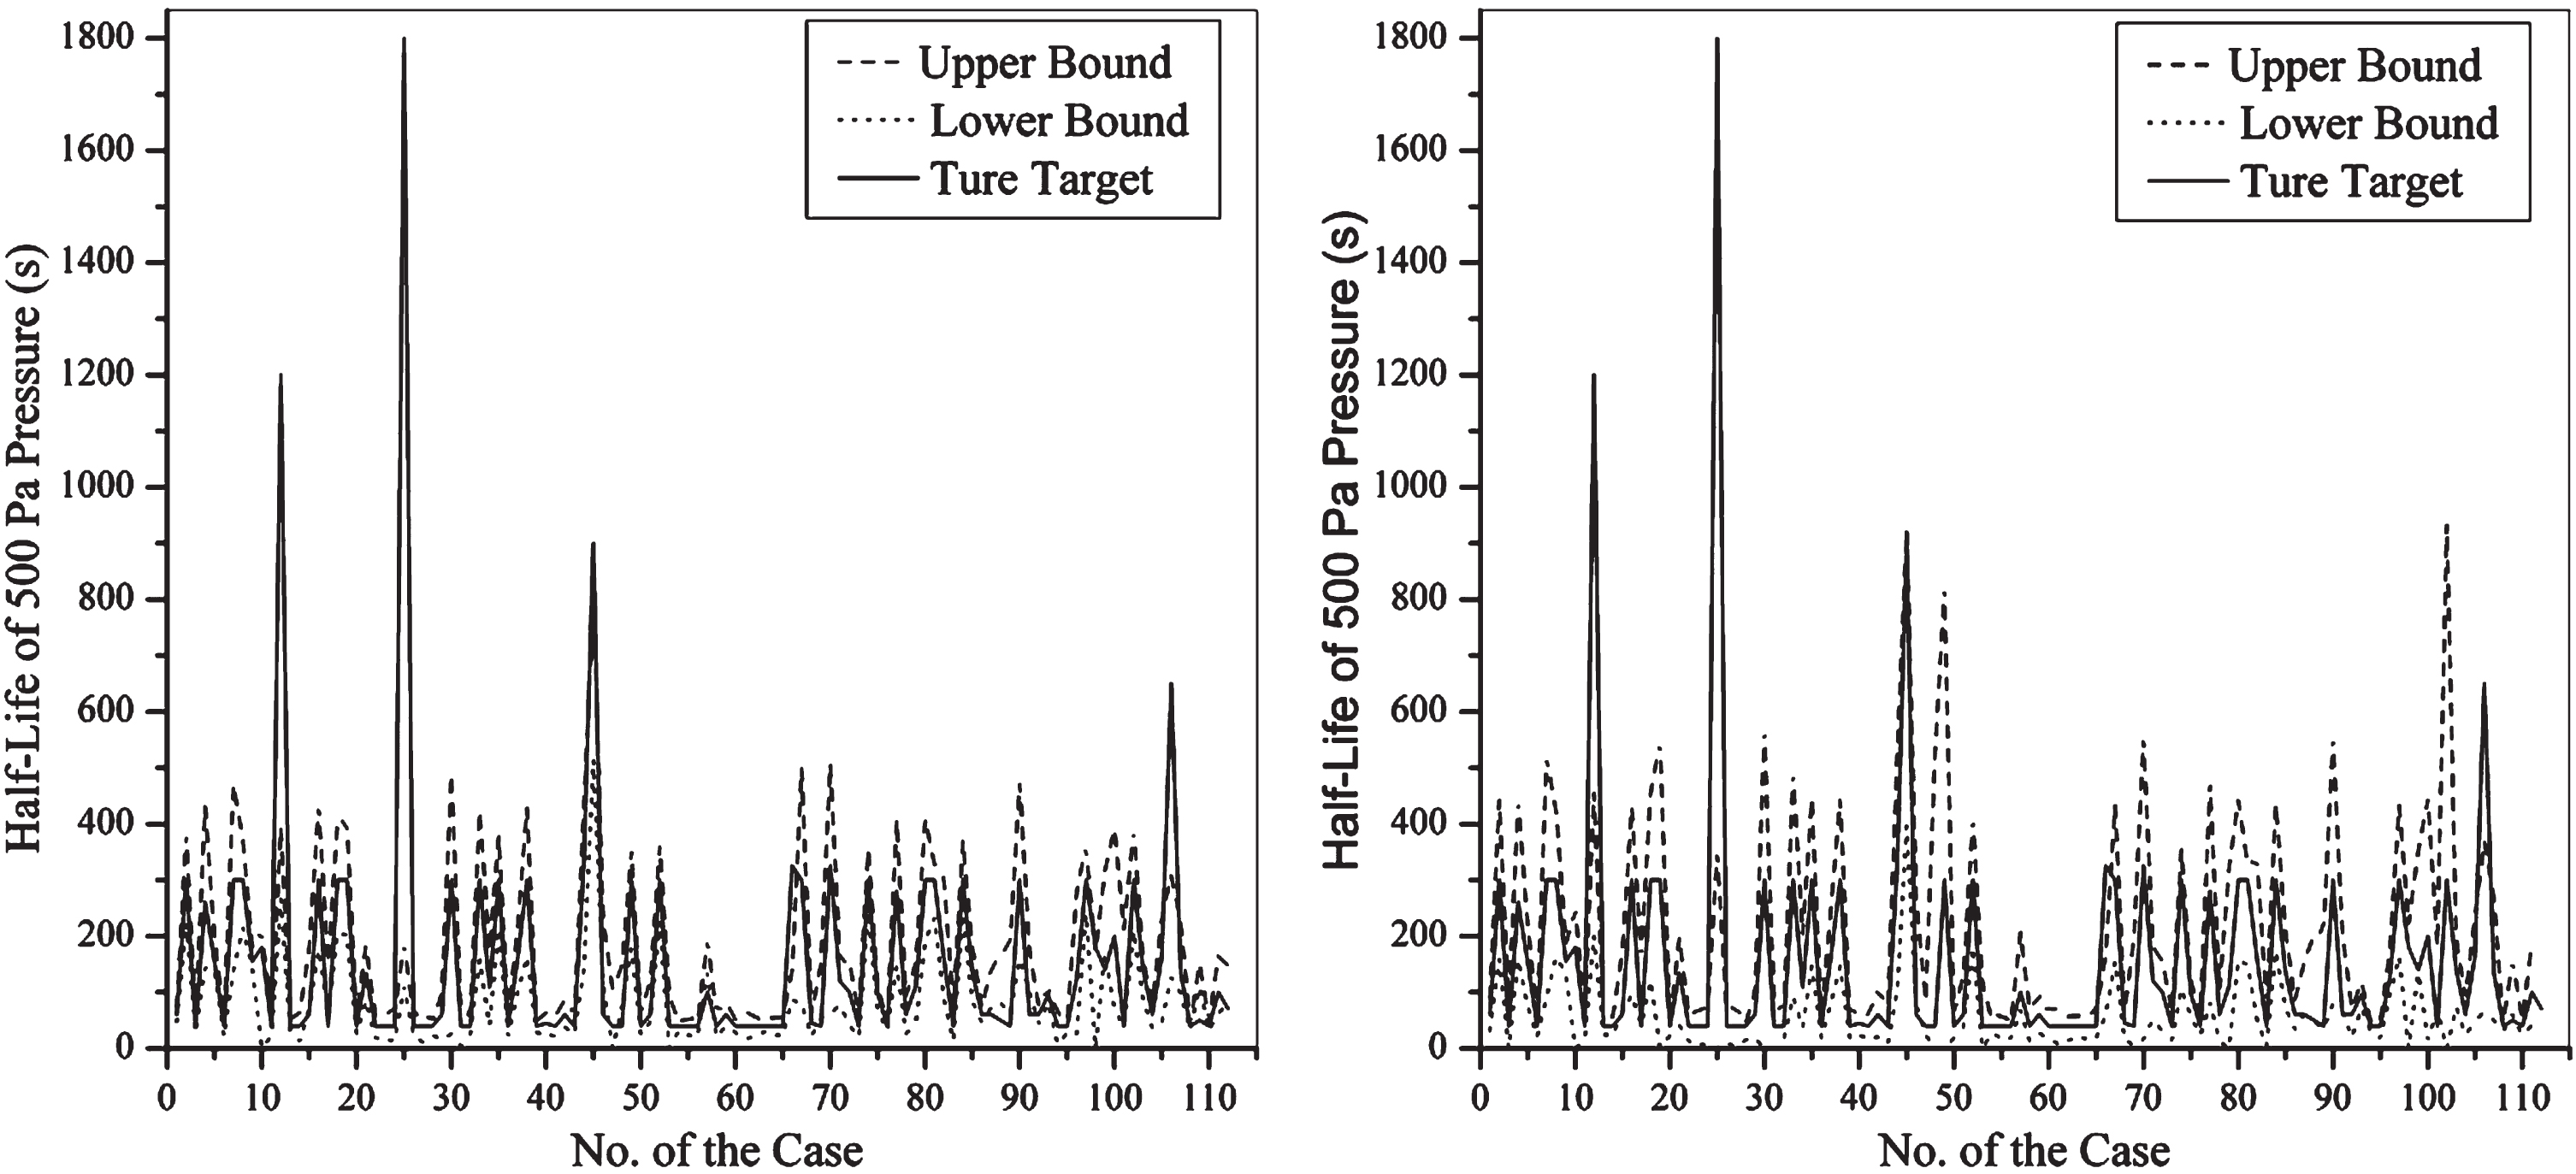
PIs of granary airtightness by Algorithm 3. The left and right parts are PIs with confidence levels of 0.8 and 0.9, respectively.
Assessment index values of PIs are obtained using Equations (14), and (17), as listed in Table 3.
Assessment index values of PIs of GAS by Algorithm 2
Evidently, PICPs can achieve satisfactory confidence levels, and NMPIWs are small.
Algorithm using ANN and bootstrap for PIs
As a statistical sampling method, bootstrap uses a data-resampling technique to approximate an unknown distribution on the basis of an empirical distribution [3]. Previous studies have employed combinations of ANN and bootstrap to acquire PIs [18, 31]. Compared with PIs acquired using SVM and information diffusion, the following algorithm for PIs of granary airtightness is based on ANN and bootstrap. ANN is trained using the error backpropagation algorithm [1].
The leave-one-out cross validation, which is the same as that in Subsection 3.2, is employed to assess Algorithm 4. The cross validation procedure replaces Algorithm 2 in Algorithm 3 with Algorithm 4. The preprocessed 112 instances of GAS constitute data set D, which is the input of Algorithm 3. Let B = 1000 [29] and confidence level 1 - α be 0.8 and 0.9. The numbers of neurons in the input, hidden, and output layers of ANN are 18, 10, and 1, respectively. PI of every instance in data set D is acquired using Algorithm 4.
The assessment index values of PIs are determined using Equations (14), and (17). The results are listed in Table 4.
Assessment index values of the PIs of GAS by Algorithm 4
Assessment index values of the PIs of GAS by Algorithm 4
PIs based on ANN and bootstrap cannot achieve the confidence level. Moreover, the accuracy of ANN is lower than that of SVM owing to the small size of sample. Consequently, NMPIWs of PIs based on ANN and bootstrap are considerably greater than those of PIs based on SVM and information diffusion, thereby substantially reducing the values of PIs in practice.
The airtightness data of built granaries, which are necessary for training a machine learning model, are scarce because investigation and testing of built granaries are costly. Furthermore, causal attributes of the granary airtightness data consist of numerical and categorical attributes. Hence, data preprocessing is essential for improving the generalization capability of the algorithm.
In accordance with the assessment index values of PIs of GAS by Algorithms 2 and 4, the proposed method based on SVM and information diffusion is better than the method based on ANN and bootstrap. The proposed method shows its superiority in processing small sample data, which is due to SVM’s excellent performance in regression [35] and information diffusion’s advantage in estimating probability distribution by using small sample data [15].
Compared with the PI methods based on bootstrap [19, 25] or optimization algorithm [13, 37], the proposed method is simpler and more easily conducted, while good-quality PIs are acquired using small sample data. The calculation cost of the proposed method is also considerably low.
The proposed method is based on SVM and information diffusion. This method utilizes small sample data to obtain the probability distribution of SVM’s point prediction errors. PIs can be obtained by assuming that the point prediction error of the instance to be predicted is subject to the same probability distribution.
As far as a data set is concerned, only the appropriate machine learning method can obtain good results. The results show that the proposed method is suitable for a granary airtightness data set and practicable.
Conclusions
Granary airtightness is important for grain storage safety and closely related to the granary design. It is significant for improving granary airtightness that the data of built granaries are utilized to predict the airtightness of granaries in design. Moreover, designers can amend granary designs in accordance with the predicted results. If the predicted airtightness of granaries in design does not meet the requirements, then designers can modify the designs to enhance airtightness. The prediction can also help designers avoid waste caused by excessive airtightness redundancy.
The application of machine learning based on massive data to optimize structure design is a rapidly developing field. However, obtaining massive data on the airtightness of built granaries is difficult. Therefore, providing designers with beneficial design guidance utilizing small sample data is a topic that should be considered seriously. PIs can offer ranges of true targets with certain confidence levels. Moreover, PIs are more useful than the point prediction of considerable uncertainties [18]. Lower and upper bounds of PIs can be used as pessimistic and optimistic prediction results, respectively, of granary airtightness, which can be used to design granary airtightness complying with different requirements. To improve the quality of PIs, SVM predicting well by using small sample data is utilized in this study, and the probability distribution of regression errors is acquired through information diffusion. Thus, high-quality PIs can be obtained.
The results show that the proposed method can generate good PIs on the basis of a granary airtightness data set. Therefore, this method provides a new way to obtain PIs of granary airtightness, which is helpful to the granary design.
As for future work, several methods can be adopted in next research to improve the prediction of granary airtightness. First, additional granary airtightness data need to be collected, and these data should include more granary types and come from different regions. Sufficient and high-quality data can better train machine learning models and get more accurate predictions. Second, ensemble learning can be employed to reduce regression errors. Lastly, using attribute selection algorithm to determine the optimal causal attribute set is also an important way to improve the performance of the prediction model. Therefore, considerable work should continue to apply machine learning to the granary airtightness design.
Footnotes
Acknowledgments
This work was supported by the Special Scientific Research Fund of Grain Public Welfare Profession of China (No. 201513001-03).