
Abstract
Aiming at predicting the purity of the extract and raffinate components in the simulated moving bed (SMB) chromatographic separation process, a soft-sensor modeling method was proposed by adoptig the hybrid learning algorithm based on an improved particle swarm optimization (PSO) algorithm and the least means squares (LMS) method to optimize the adaptive neural fuzzy inference system (ANFIS) parameters. The hybrid learning algorithm includes a premise parameter learning phase and a conclusion parameter learning phase. In the premise parameter learning stage, the input data space division of the SMB chromatographic separation process and the initialization of the premise parameters are realized based on the fuzzy C-means (FCM) clustering algorithm. Then, the improved PSO algorithm is used to calculate the excitation intensity and normalized excitation intensity of all the rules for each individual in the population. In the conclusion parameter learning phase, these linear parameters are identified by the LMS method. In order to improve population diversity and convergence accuracy, the population evolution rate function was defined. According to the relationship between population diversity, population fitness function and particle position change, a new adaptive population evolution particle swarm optimization (NAPEPSO) algorithm was proposed. The inertia weight is adaptively adjusted according to the evolution of the population and the change of the particle position, thereby improving the diversity of the particle swarm and the ability of the algorithm to jump out of the local optimal solution. The simulation results show that the proposed soft-sensor model can effectively predict the key economic and technical indicators of the SMB chromatographic separation process so as to meet the real-time and efficient operation of the SMB chromatographic separation process.
Keywords
Introduction
SMB chromatographic separation technology is a new separation technology developed on the basis of traditional fixed bed adsorption operation and real moving bed (TMB) chromatographic separation technology [1]. In the cyclical operation of continuous production, the SMB system fully reflects its non-linear, non-ideal and non-equilibrium characteristics. This multi-degree-of-freedom system is difficult to achieve the optimal stability of the product, such as product purity, yield, mobile phase consumption and other important performance indicators. Due to the limited field conditions and the lack of mature detection devices, the key economic and technical indicators of chromatographic separation in the actual production process are difficult to obtain in real time, so it is difficult to achieve the direct quality closed-loop control. ANFIS is an artificial intelligence inference technology with the advantages of fuzzy logic and neural network. The strength of a neuro-fuzzy system involves two conflicting requirements in fuzzy modeling: approximation accuracy and interpretability. Improving the approximation accuracy and interpretability of fuzzy systems in fuzzy system theory or application is an important problem [2]. ANFIS based on TSK model is a special branch of neural modeling, whose structure is similar to the general neuro-fuzzy system. Data attributes are obtained from data sets and system parameters are adjusted according to given error criteria [3]. But in the rule layer, it has many nodes that automatically generate all possible fuzzy rules of the neuro-fuzzy structure, and the automatic generation rules have the opportunity to generate redundant rules. Therefore, it is necessary to study a synchronization technique to generate the accuracy and effective rules.
PSO algorithm is a new evolutionary algorithm (EA) developed in recent years, which has been developed by researchers because it is easy to implement and requires few parameters to be adjusted [4]. As a stochastic optimization algorithm based on swarm intelligence theory, PSO algorithm has been widely used in optimization problems such as neural networks and fuzzy control [5, 6]. Tthrough designing rules, PSO algorithm was used to solve the conflict problem of fuzzy neural networks (FNN) [7]. In order to improve the local optimization ability and accelerate the convergence speed of PSO algorithm, various improved PSO algorithms are proposed, such as PSO algorithms with improved inertia weights [8, 9], adaptive inertia weight chaotic PSO algorithm [10], improved momentum particle swarm optimization algorithm [11] and so on. PSO algorithm was used to optimize BP neural network and SVM for modeling RF power amplifier respectively, which have the disadvantages of slow convergence and low precision [12, 13]. ANFIS and PSO algorithm were combined to predict the key parameters of pressure-assisted semi-solid processing parameters, mining and tunnel engineering of A360 aluminum-based nanocomposites and the kinetic constants of lignocellulosic pyrolysis [14–16]. An improved PSO algorithm combining simulated annealing (SA) method with an nonlinear decrement inertia weight was proposed [17]. A chaotic alternating PSO algorithm based on cloud model inertia weight was proposed. According to the iterative variation of particles, the cloud model theory was used to intelligently adjust the inertia weight to balance its global and local search ability and prevent the algorithm from local optimum [18]. In order to improve the searching ability of the basic PSO algorithm, a strategy based on the change of iteration times to select the fixed inertia weight was proposed [19]. Considering the dynamic characteristics of practical applications, a new parameter automation strategy in PSO algorithm was proposed, that is to say a random inertia weighting factor was adopted [20]. The standard PSO algorithm is prone to premature convergence, slow search speed and low precision, a simplified PSO algorithm based on stochastic inertia weight was proposed, which removed the velocity term to simplify the PSO algorithm structure and proposed the randomly distributed inertia weight to balance the local search and global search ability [21]. In order to describe the characteristics of RF power amplifier with memory effect more accurately, an improved simplified PSO algorithm was proposed based on ANFIS. The simplified PSO algorithm uses linear decreasing inertia weights and introduces Laplacian coefficients novelly, which increases population diversity, speeds up convergence, and avoids falling into local optimum [22]. Aiming at the problem that the cluster head distribution of LEACH algorithm is unreasonable and the network energy consumption is uneven, a clustering routing protocol optimization method based on inertial weight sinusoidal adjustment PSO algorithm (S-PSO) was proposed for wireless sensor networks [23]. Based on the linear decreasing strategy, a nonlinear decreasing dynamic inertia weighting strategy was proposed [24]. A nonlinear exponential inertia weight PSO (EIW-PSO) algorithm was proposed for overcoming the shortcomings of slow convergence, low search accuracy and algorithm performance depending on the selection of parameters [25]. An modified adaptive calculation inertia weight (MACIW) was proposed to construct a set of inertia weight calculation set that keeps the magnitude relationship constant, and establishes the mapping relationship between the set and the particle concentration factor. The relationship adaptively calculates the inertia weight by monitoring the particle concentration factor [26]. An adaptive individual inertia weight that considers global and individual analysis in each iteration was proposed, namely the best, worst and individual characteristics [27].
In this paper, for predicting the purity of the extract and raffinate components in the SMB chromatographic separation process, a soft-sensor modeling method by adopting the hybrid learning algorithm based on the proposed NAPEPSO algorithm and LMS method was proposed to optimize the ANFIS parameters. The structure of the paper is described as follows. The second section introduces the SMB chromatographic separation technique and the soft-sensor model structure. The third section describes the basic principle of ANFIS. The fourth section discusses the basic principle of PSO algorithm and the inertia weight adjustment methods. The fifth section introduces a new adaptive group evolution particle swarm optimization algorithm. The sixth section is the simulation experiments and the result analysis. Conclusion ends this paper.
SMB chromatography separation technology and soft-sensor modeling
SMB chromatography separation technology
The operation schematic diagram of SMB chromatographic separation process is shown in Fig. 1 [28, 29]. The entire device is divided into four different functional areas that are connected end to end to form a loop. Each column has different functions according to its location at different times. The countercurrent contact movement of the stationary phase adsorbent and the mobile phase liquid are simulated by the periodic flow of the liquid and the adsorption process of each component as shown in the feed and discharge sequence of the current cycle in the direction of the arrow. The region between the inlet of the eluent (D) and the outlet of the extract is zone I, and its function is to desorb the strong adsorption component (B) from the stationary phase adsorbent by using the eluent (D) to obtain an extract. The area between the extract outlet and the feed (A, B is a mixture) port is zone II, which acts to desorb the weakly adsorbed component (A), then with the flowing liquid and fresh feed (A, B is Mixture) into the next zone together. Zone III is the zone between the feed inlet and the raffinate outlet. Its function is to adsorb the strong adsorption component (B), and the raffinate is discharged from the outlet. The IV region is the region between the raffinate and the eluent (D) inlet. Its function is to adsorb the weakly adsorbed component (A) to achieve regeneration and continuous separation of the eluent (D).

Working principle of SMB cinematographic separation process.
In the actual production of SMB chromatography adsorption separation process, because there are many factors affecting the separation process, the component purity measurement problem as a quality indicator is difficult to achieve. Therefore, the establishment of a soft-sensor model for the purity of components in the separation process has theoretical significance and application value [30]. As a new indirect measurement method, soft-sensor technology uses the easy-to-obtain relevant auxiliary variable information to realize the modeling estimation of difficult-to-detect variables. Therefore, the model establishment and the appropriate selection of relevant auxiliary variables in the modeling process are all influential. The soft-sensor model can be expressed as:
Based on the process mechanism and prior knowledge of the SMB chromatography separation process, the following variables shown in Table 1 were selected as the dominant and auxiliary variables. The auxiliary variables are the soft-sensor model inputs, the purity of the target in the effluent of the E port and the purity of the impurity in the R port effluent are the model outputs, and PSO algorithm based ANFIS was used to fit the nonlinear relationship between them to establish a predictive model of the corresponding economic and technical indicators. The historical data of the SMB chromatographic separation process were collected, and 1000 sets of historical data with uniformity and representativeness are shown in Table 2 as the soft-sensor modeling data.
Unit and range of the process variables
Data of SMB chromatography separation process
Basic principles of ANFIS
Considering that the soft-sensor model of the SMB chromatographic separation process is a multi-input single-output network model, the first-order Sugeno-type ANFIS proposed by J.-S. R. Jang was used [31]. The typical structure of the ANFIS is shown in Fig. 2 [32]. Assume that the fuzzy inference system under consideration has two inputs x and y, a single output f.

Structure diagram of typical ANFIS.
Layer 1: This layer node fuzzifies the input signal.
Layer 2: Multiply all input signals passed in the previous layer as the output of this layer.
Layer 3: For the normalized layer, calculate the normalized excitation strength for each node.
Layer 4: All nodes in this layer are used as adaptive nodes with the node functions.
Layer 5: The last layer sums all the signals to calculate the system output.
In essence, the prototype structure of ANFIS uses the grid method to divide the input space. If the input is complex nonlinear data, on the one hand, it will inevitably lead to exponential growth of the number of fuzzy rules, which will inevitably bring about the problem of dimensionality disaster. In addition, the linear division of the grid method can not accurately reflect the spatial distribution of the input data. Therefore, the FCM clustering algorithm is used to realize the segmentation of the input space and the determination of the premise parameters.
The FCM clustering algorithm [33] divides the feature points in the feature space X = (x1, x2, ⋯ , x
n
) into c classes (2 ⩽ c ⩽ n), and the cluster center of the i-th class is represented by v
i
, where any feature point x
j
belongs to the membership degree u
ij
of the i-th class, and u
ij
(0 ⩽ u
ij
⩽ 1) satisfies the following conditions.
The objective function of the FCM clustering algorithm is described as:

Initial membership function of three input variables.
Standard PSO algorithm
The particle swarm optimization algorithm is inspired by the behavior of birds foraging, and uses the search mechanism that changes speed and position to find the optimal solution in practical problems. It treats each particle as a foraging bird. The particle compares its fitness value (determined by the fitness function) with the population extreme value gBest and the individual extreme value pBest
i
, and then changes the flight speed and position during the movement, where gBest is the location of the particle in the entire population where the optimal fitness value is found, and pBest
i
is the location where the individual is found to find the optimal fitness value up to the current evolutionary algebra [34]. Each time the particle is evolved, the fitness value is calculated once, and the positions of gBest and pBest
i
are updated once. Assuming that the search space (foraging space) is M-dimensional, initialize n particles to form a population, denoted as X1, X2, … X
n
, and each particle is treated as a M-dimensional solution vector:
It is worth remembering that the pBest
i
and gBest velocities of the ith particle are described as follows:
During the evolution process, particles update their own flight speed through pBest
i
, gBest, change position, and generate new particles.
With the deepening of the research on PSO algorithm, it is found that the algorithm has the following problems in the optimization process. Under the action of large coefficient, the whole particle swarm flyes to the optimal solution according to the individual experience of the particle and the experience of the population, and it is likely to miss the optimal solution and result in poor convergence of the algorithm. With the iterative operation of the algorithm, the flying speed of the particles becomes smaller and smaller, which will cause all the particles in the population to become more consistent, resulting in slower convergence, poor diversity, low precision and easy in the later stage of the algorithm. Premature phenomenon occurs and falls into local optimum.
It seems that in the late stage of the algorithm iteration, the diversity of the population is lost, and the flight speed of the individual particles is rapidly reduced, resulting in insufficient local development ability of the algorithm and cannot converge to the global extremum. At this time, if some strategy is adopted to increase the diversity of the population, re-adjust the flight speed and direction of the particles, strengthen the local development ability of the algorithm in the later stage of operation, the convergence accuracy of the algorithm should be improved. Therefore, the improved PSO algorithm based on adaptive population activity to optimize ANFIS parameters was proposed to overcome the shortcomings of standard PSO algorithm.
According to the different types of inertia weights, this paper divides them into three types: random inertia weights, inertia weights based on iterative function, and inertia weights based on feedback information function.
Random inertia weights
1) A improved constant inertia weight PSO (CWPSO) algorithm was proposed based on variation of iteration times to determine the inertia weight [19]. This inertia weight ω is a real number, and the change in the magnitude of ω has a large impact on the performance of the PSO algorithm. Through repeated experiments, it is found that if ω changes according to the following rules, PSO performance will be greatly improved.
2) In order to effectively control local search and convergence to the global optimal solution, considering the dynamic characteristics of practical applications, a new random inertia weighting factor was proposed to track the system dynamics [20]. This random inertia weigh PSO (RWPSO) algorithm is described as:
3) A stochastic inertia weight based simplified PSO (SIWSPSO) algorithm was proposed to obtain the inertial weight by random distribution [21]. The weighted value is generated by the random distribution method. According to the above analysis, this random inertia weight ω is generated as follows:
1) A linearly decreasing inertia weight PSO (LDWPSO) algorithm was proposed by adopting dynamic asynchronous variation learning factor and Laplace coefficient novelly so as to increases the diversity of the population, accelerates the convergence speed, and avoids falling into local optimum [22]. This PSO algorithm with linear decreasing inertia weight shown in Equation (18) has stronger global convergence ability and stronger local convergence ability in the early stage as the number of iterations increases.
2) In the PSO algorithm, the inertia weight ω plays a role in regulating the influence of the historical speed of the particle on the current velocity, and also plays the role of balancing the global search and local search of the particles. The sinusoidal function was introduced to adjust the inertia weight in standard PSO algorithm, which is shown in Equation (19) and forms the sinusoidal adjustment PSO (S-PSO) algorithm.
3) Based on the linear decreasing strategy, an improved nonlinear decreasing inertia weight PSO (INDWPSO) algorithm was proposed so as to enhance the local and global search ability [24]. The new inertia weight can be expressed as:
1) An exponential inertia weight PSO (EIW-PSO) algotihem was proposed to calculate the inertia weight based on the behavior of the particles in the iterative process [25]. This inertia weight is adjusted by the exponential function of the maximum and minimum fitness values of the particles in the iterative process to ensure the diversity of the population, which is shown in Equations (22).
2) By using particle aggregation degree as the population feedback parameter, a method for adaptively computing inertia weight (MACIW), namely population feedback parameter, was proposed to be adaptively adjusted based on the particle concentration factor according to the mapping relationship. The population feedback parameter defines the evolution rate factor h and the particle concentration factor s, which are described in Equations (24), respectively.
3) The basic idea of the adaptive inertia weighting mechanism shown in Equation (28) is to set the inertia weight of each particle according to the relative fitness and the best and the worst global fitness, namely the proposed adaptive individual inertia weight PSO (PAWPSO) algorithm [27].
Based on the analysis of the convergence of PSO algorithm, the population evolutionary function is defined firstly. According to the relationship between population diversity, population fitness function and particle position change, an novel adaptive populatin evolution PSO (NAPEPSO) algorithm is proposed. The inertia weight is adaptively adjusted according to the population evolution and the change of the particle positions, thereby improving the population diversity and the ability of the algorithm to jump out of the local optimal solution.
Population diversity measurement function
Population diversity reflects the distribution of particles in the searching space. The higher diversity indicates that the particles are scattered in the searching space and has the strong global searching ability. The closer the particle is to the optimal position, the better the population state. Therefore, the population diversity can be reflected by the degree of the population. The degree of the particle’s particle can be quantified as the relationship between the current location of the particle and the optimal position of the population. Therefore, by studying the population evolution, the current state of the whole population can be well understood and grasped. The definition of the population evolution degree can be described as follows.
The above definitions indicate that the population evolution degree D (t) can reflect the degree of “aggregation” of all particles in the population, namely the diversity of the particles in the population. The smaller D (t) is, the smaller the particles diversity in the population is. On the contrary, the diversity is larger.
The iterative search of particles is a nonlinear optimization process. Population diversity is not only related to population evolution, but also related to particle fitness function. The activity level of a particle can be expressed by the current fitness function. The higher the activity level, the larger the search range of the population. So the diversity of the population can be reflected by the activity of the population. We find that the relationship between the particle fitness function and its variance is a good indicator of population activity. Therefore, by studying the change of the fitness function of the population and the magnitude of the variance difference, the current state of the whole population can be well understood and grasped, which is defined as “Average population fitness”, and it is calculated by:
In the iterative searching process of particles, the current iteration number t of particles can be regarded as a certain moment in the particle searching process. Since the inertia weight in the PSO algorithm is located between [0, 1], the population diversity measurement function can be calculated by:
The value of FD (t) in Equation (35) is the diversity measure of the population at the moment t, which reflects the degree of convergence of all particles in the population. It can be seen from Equation (35) that when FD (t) is small, the particle population tends to converge; when FD (t) is large, the particle population is under the random searching process; That it tends to zero indicates that the diversity of the population is decreasing. Consistently, it can be proved that the size of the population diversity measurement function representing the difference between the particles in the population is completely feasible.
Studies have shown that with the operation of the PSO algorithm, the individual particles in the whole population will eventually become consistent, and the value of the function F (t) will become smaller and smaller, so it cannot be used to represent the population diversity effectively. To this end, a adjustment function φ (t) is introduced, which is shown in Equation (36):
It can be seen that if the size of FD (t) can be used to measure the degree of consistency of the particles in the whole population. On the basis of F (t) - φ (t), the important parameter inertia factor in the PSO algorithm can be adaptively adjusted dynamically, which is beneficial to avoid the defect that the PSO algorithm is easy to fall into the local extremum, and it is beneficial to speed up the convergence speed and greatly improve the convergence precision of the algorithm. Therefore, the inertia weight is dynamically adaptively adjusted with the change of the population diversity measurement function and the adjustment function value. The adjustment mechanism of inertia weight is shown in Equation (37).
In the proposed NAPEPSO algorithm, the inertia weight adopts the adaptive adjustment mechanism, which makes it adaptively adjust dynamically with the group diversity function and the adjustment function, so that the particle search can better adapt to the complex non-linear environment and the global search ability and local development ability of the algorithm is balanced more flexibly, which will prevent the algorithm from premature convergence, and speed up the searching speed in the later stage of the algorithm.
Figure 4 shows the algorithm flowchart of the NAPEPSO-LMS algorithm to optimize the ANFIS parameters. All The premise parameters of ANFIS are adjusted by increasing or decreasing the number of fuzzy rules in the ANFIS structure through the proposed improved PSO algorithm.
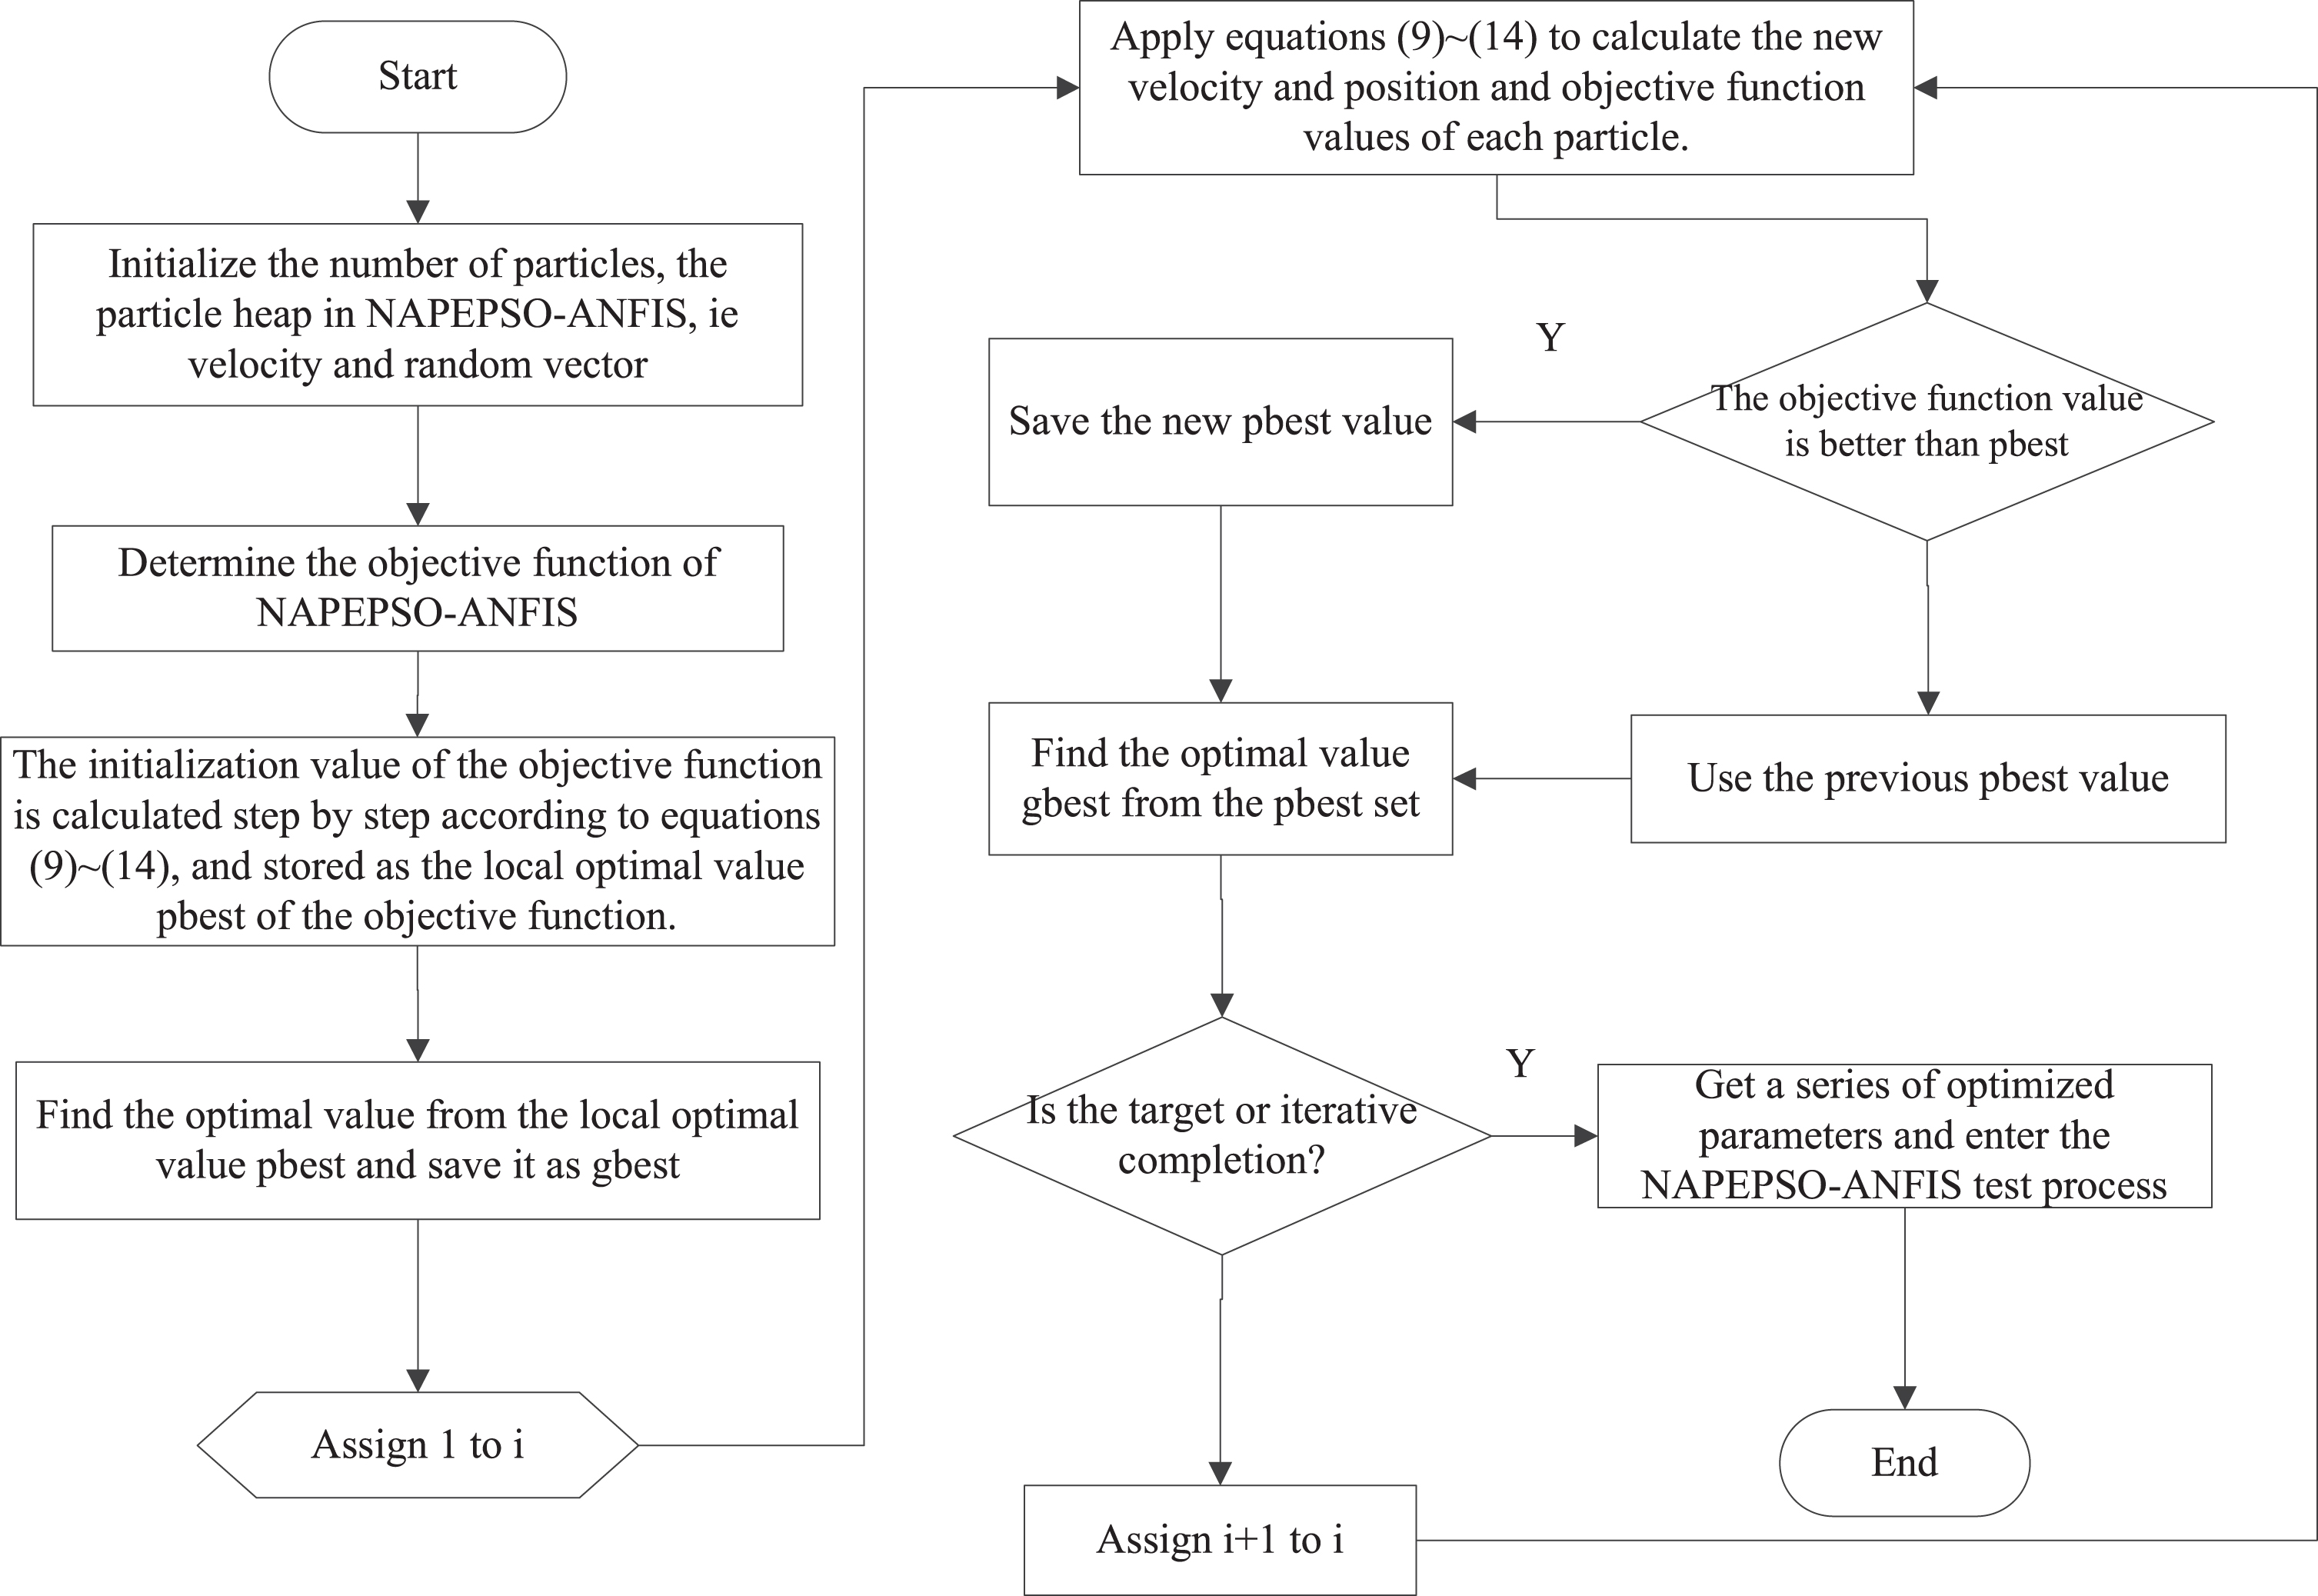
NAPEPSO-LMS algorithm flowchart to optimize ANFIS parameters.
Each learning process of the hybrid learning algorithm includes a premise parameter learning phase and a conclusion parameter learning phase. In the premise parameter learning phase, the improved PSO algorithm is used to calculate the excitation intensity and normalized excitation intensity of all rules for each individual in the population. In the conclusion parameter learning phase, these linear parameters are identified by LMS method. After obtaining model parameters, the output error of input data can be calculated. The specific algorithm flowchart is described as follows.
Step1: Initialize the number of iterations, randomly initialize the particle population, set the position vector of the ith particle as
Step 2: Initialize the particle position using velocity and M dimension, and calculate the fitness function f (i). The fitness function is the objective function of ANFIS.
Step 3: The position vector of each particle is sequentially used as the premise parameter of ANFIS, and then the excitation intensity w
j
and the normalized excitation intensity
Step 4: Compare the current fitness value
Step 5: Compare the fitness value
Step 6: Update the velocity
Step 7: Check if the optimization end condition is met. If the preset precision or the set maximum number of iterations is reached, the optimization is ended and the optimal solution is obtained. Otherwise, go to Step 3 and continues to the next iteration process.
In this paper, a soft-sensro model was established to predict the purity and yield of E-port and R-port in the SMB chromatography separation process based on the proposed NAPEPSO-LMS algorithm. The FCM clustering algorithm was used to divide the input data space of ANFIS model. The Gaussian function is selected as the membership function. The ANFIS network has an input dimension of 3 and an output dimension of 1, and the output unit uses the linear activation function. The 1000 sets of historical data with uniformity and representativeness of the SMB chromatographic separation process was collected. Then the preprocessed data is divided into two parts. The first 800 sets of data are used as the training data, and the last 200 sets of data are used to verify the performance of the soft-sensor model. According to the reference data, we found that the purity of the target in the E effluent and the yield of the impurity at the R port are correlated, and the purity of the impurity in the R effluent and the yield of the target at the E port are also correlated. Therefore, in the experimental simulation stage, the purity of the target in the E effluent and the purity of the impurities in the R effluent are selected as the output variables. In order to measure the performance of the predictive models, several performance indicators are defined in Table 3, where
Definition of model performance indicators
Definition of model performance indicators
According to the different types of inertia weights, they are divided into the random inertia weights, the inertia weights based on the iterative function, and the inertia weights based on the feedback information function. In the three sets of inertia weights, different inertial weights are compared with the inertia weights proposed in this paper. By realizing the prediction of the purity of the target in the E effluent and the purity of the impurities in the R effluent, it is comparatively analyzed which inertial weight makes the PSO algorithm optimizing ANFIS model better in the SMB chromatography separation process.
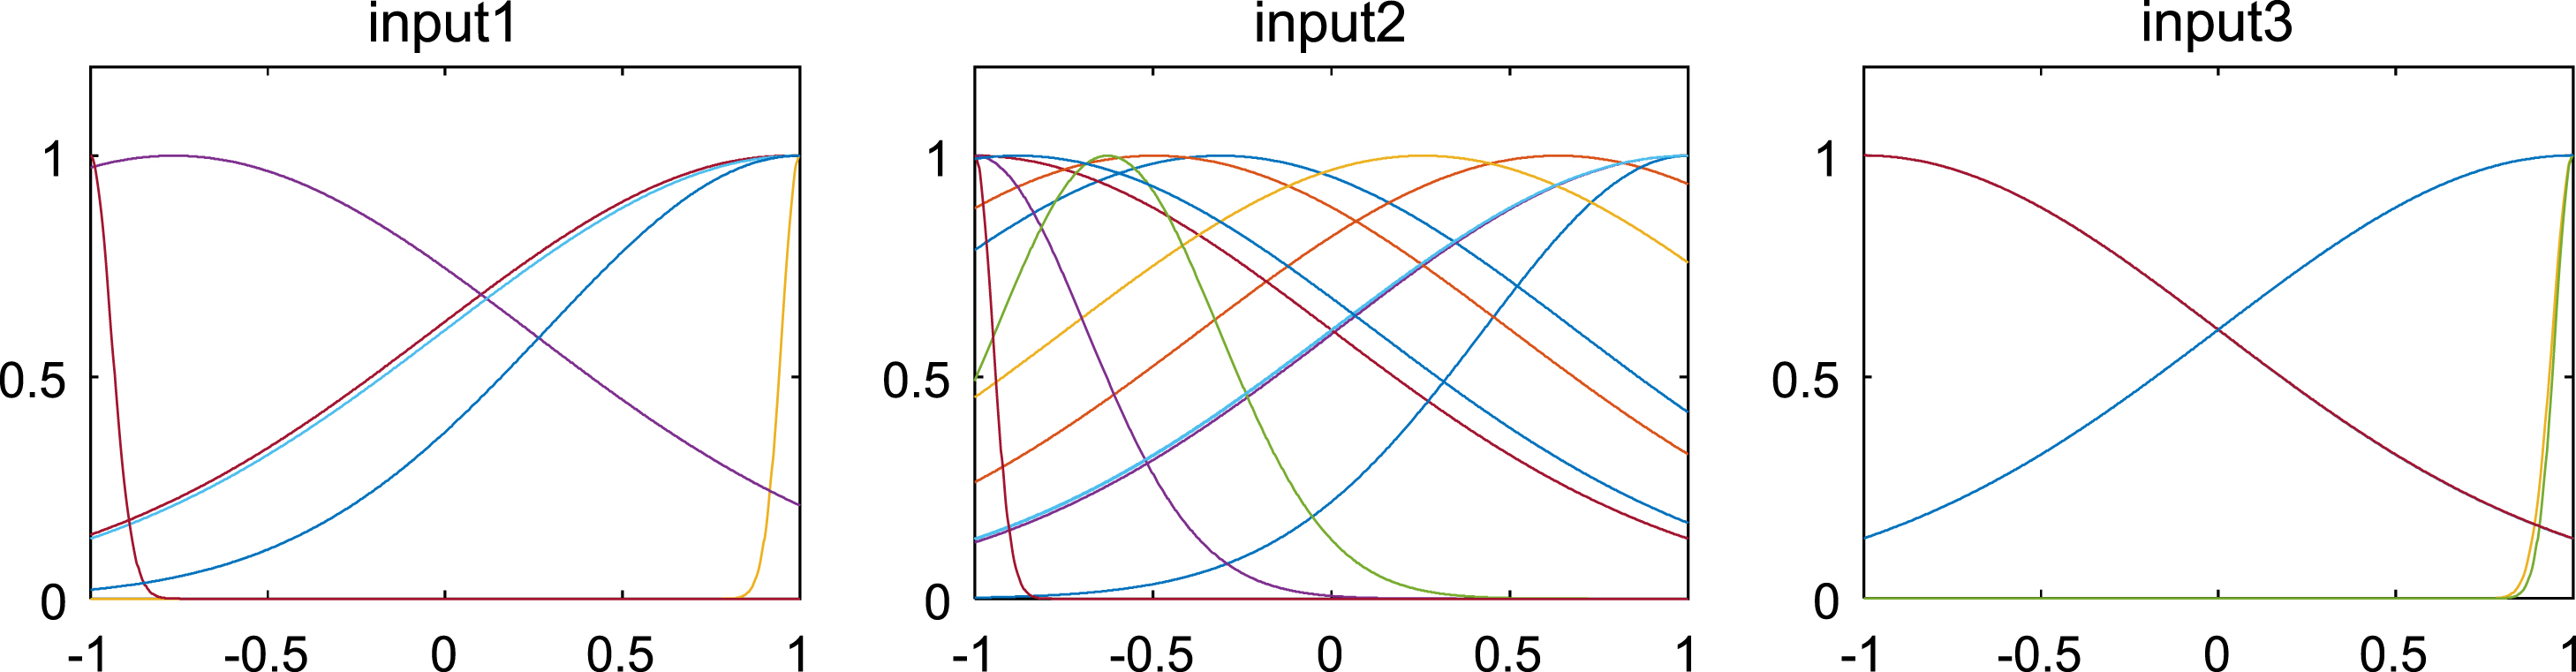
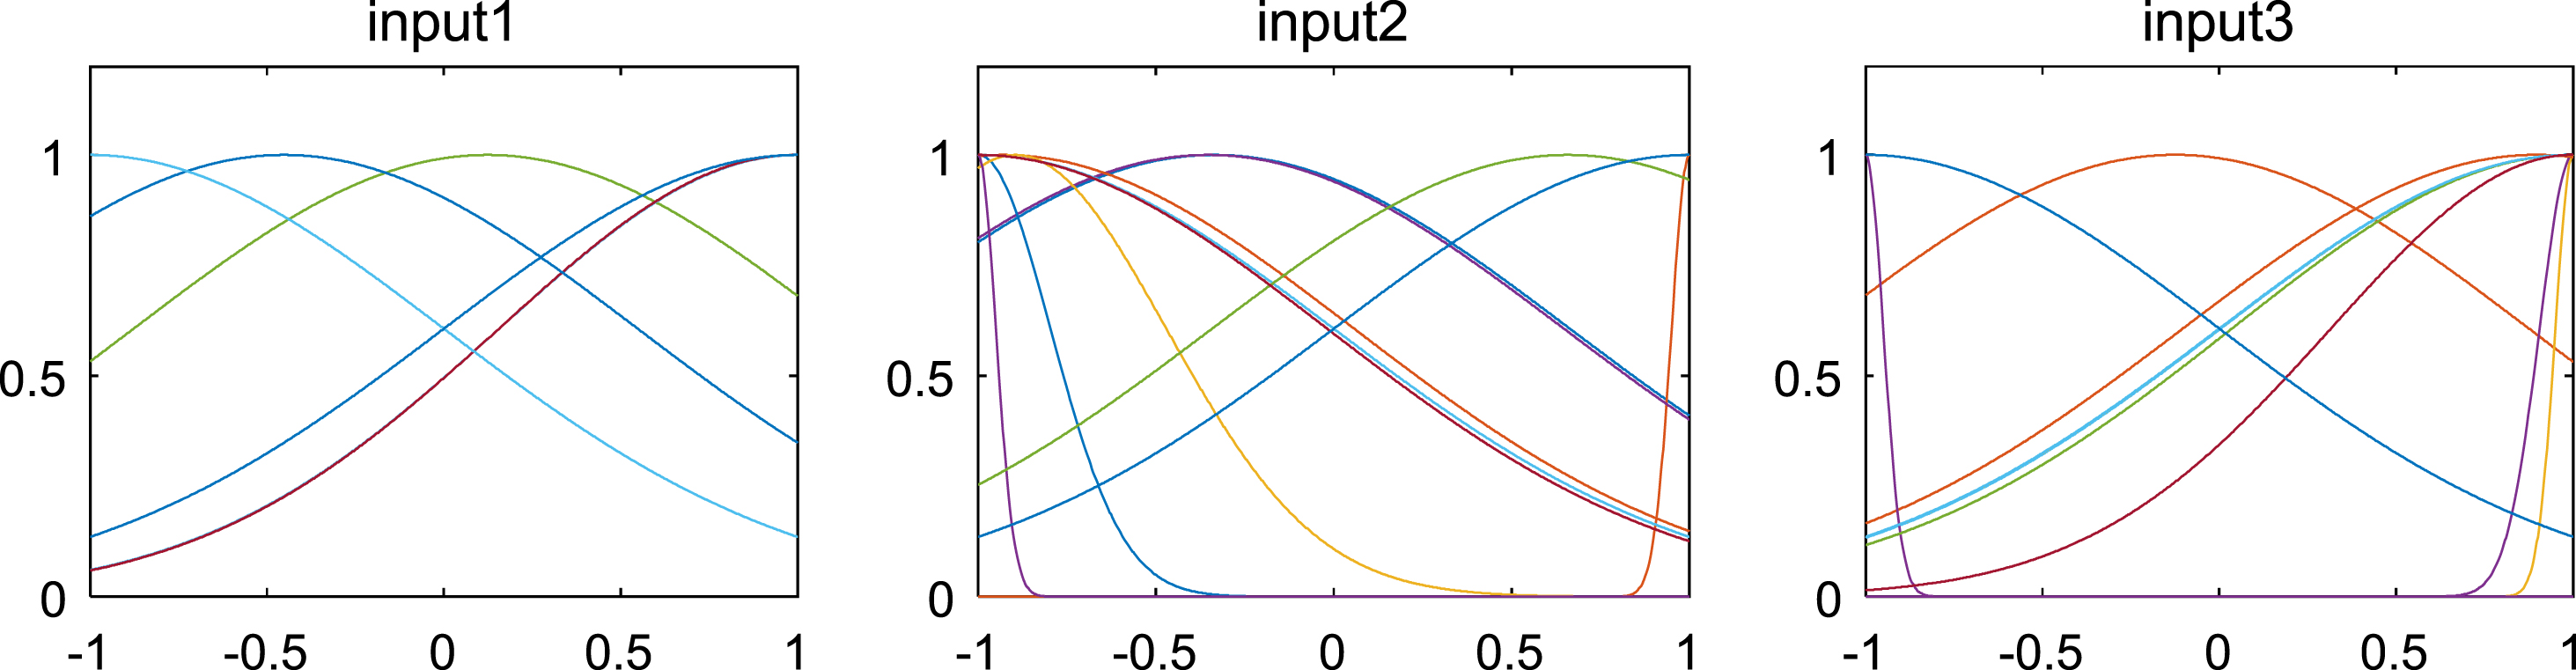
When establishing the PSO-ANFIS soft-sensor models based on random inertia weights, the membership function selects the Gaussian function, and Fig. 5–8 show the membership functions of three input variables based on PSO algorithm with different stochastic inertia weights to optimize the Sugeno-type ANFIS model parameters. The number of training iterations of the soft-sensor model is 500, and the model is tested with 200 sets of data with average and representativeness. The predicted simulation results are shown in Fig. 9–12. Figure 9 shows the purity of the target in the E-flow effluent in the SMB chromatographic separation process by adopting CWPSO-ANFIS model, RWPSO-ANFIS model, SIWSPSO-ANFIS model, PSO-ANFIS model and NAPEPSO-ANFIS model. Figure 10 shows the error comparison curves. Figure 11 shows the output contrast curves of the purity of the impurity in the R port effluent by using CWPSO-ANFIS model, RWPSO-ANFIS model, SIWSPSO-ANFIS model, PSO-ANFIS model and NAPEPSO-ANFIS model. Figure 12 shows the error comparison curves. Figure 13 is a comparison of the training RMSE curves. Figure 14 shows five inertia weight changing curves. Table 4 compares the predicted performance indicators of the established soft-sensor models.
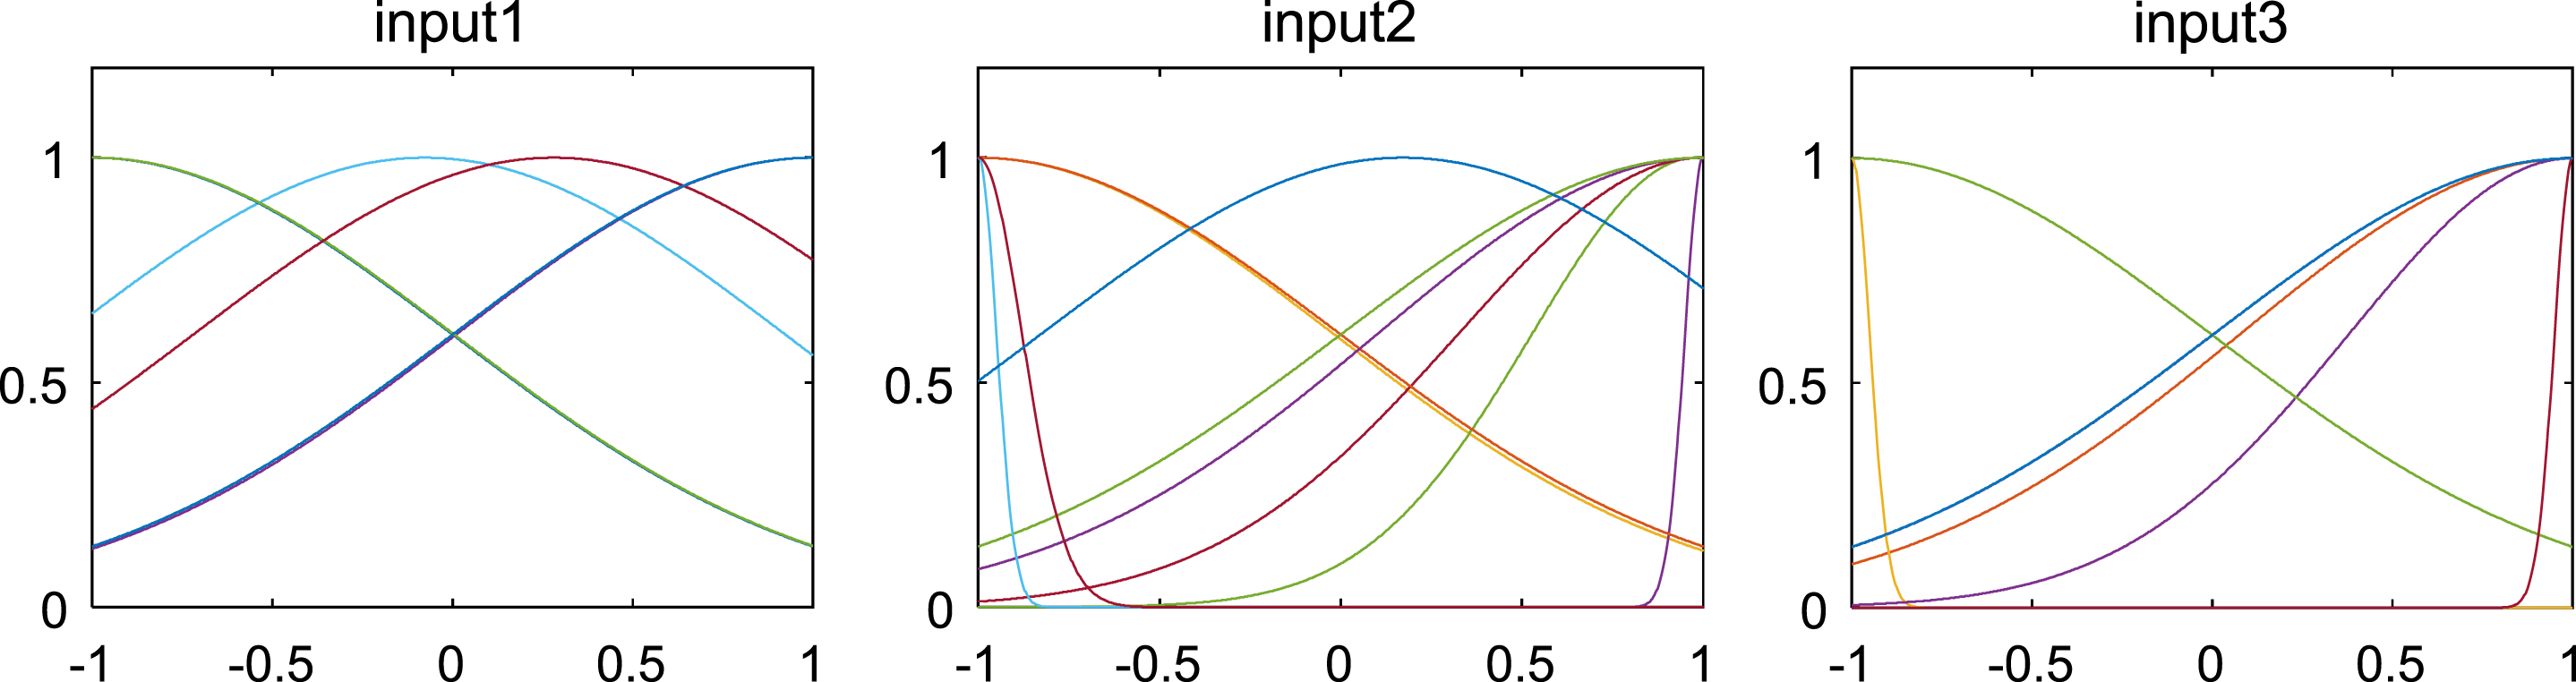
Membership function of three input variables based on CWPSO-ANFIS learning strategy.

Membership function of three input variables based on RWPSO-ANFIS learning strategy.
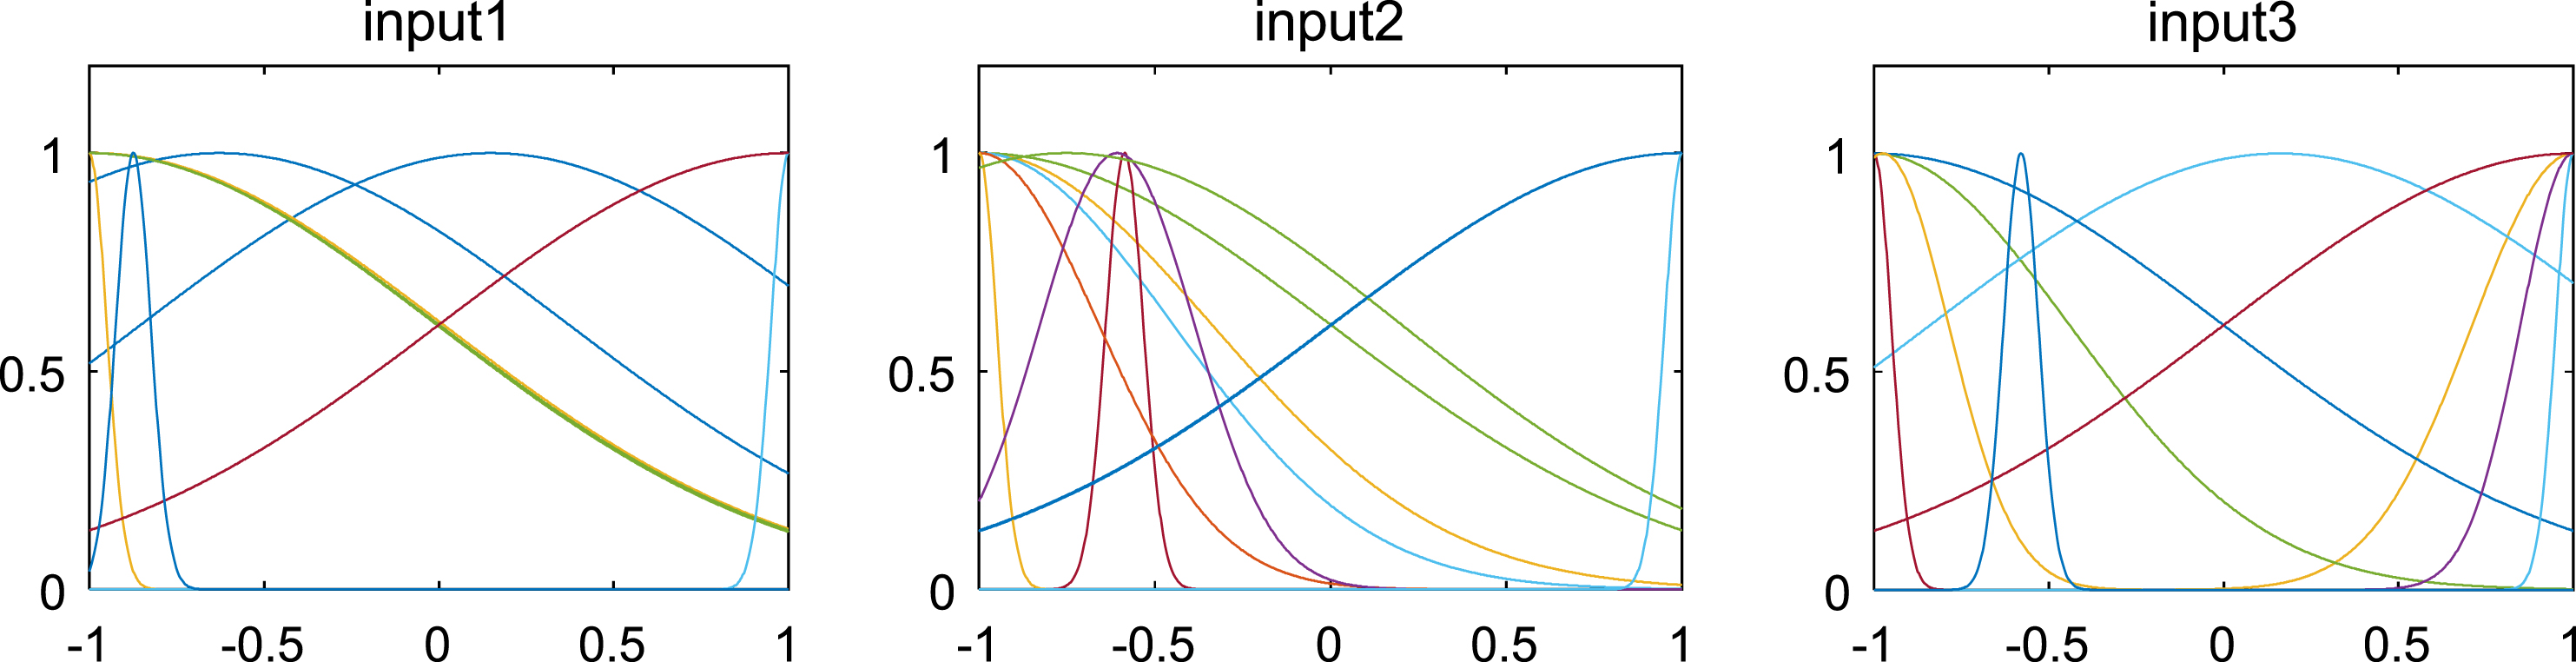
Membership function of three input variables based on SIWSPSO-ANFIS learning strategy.
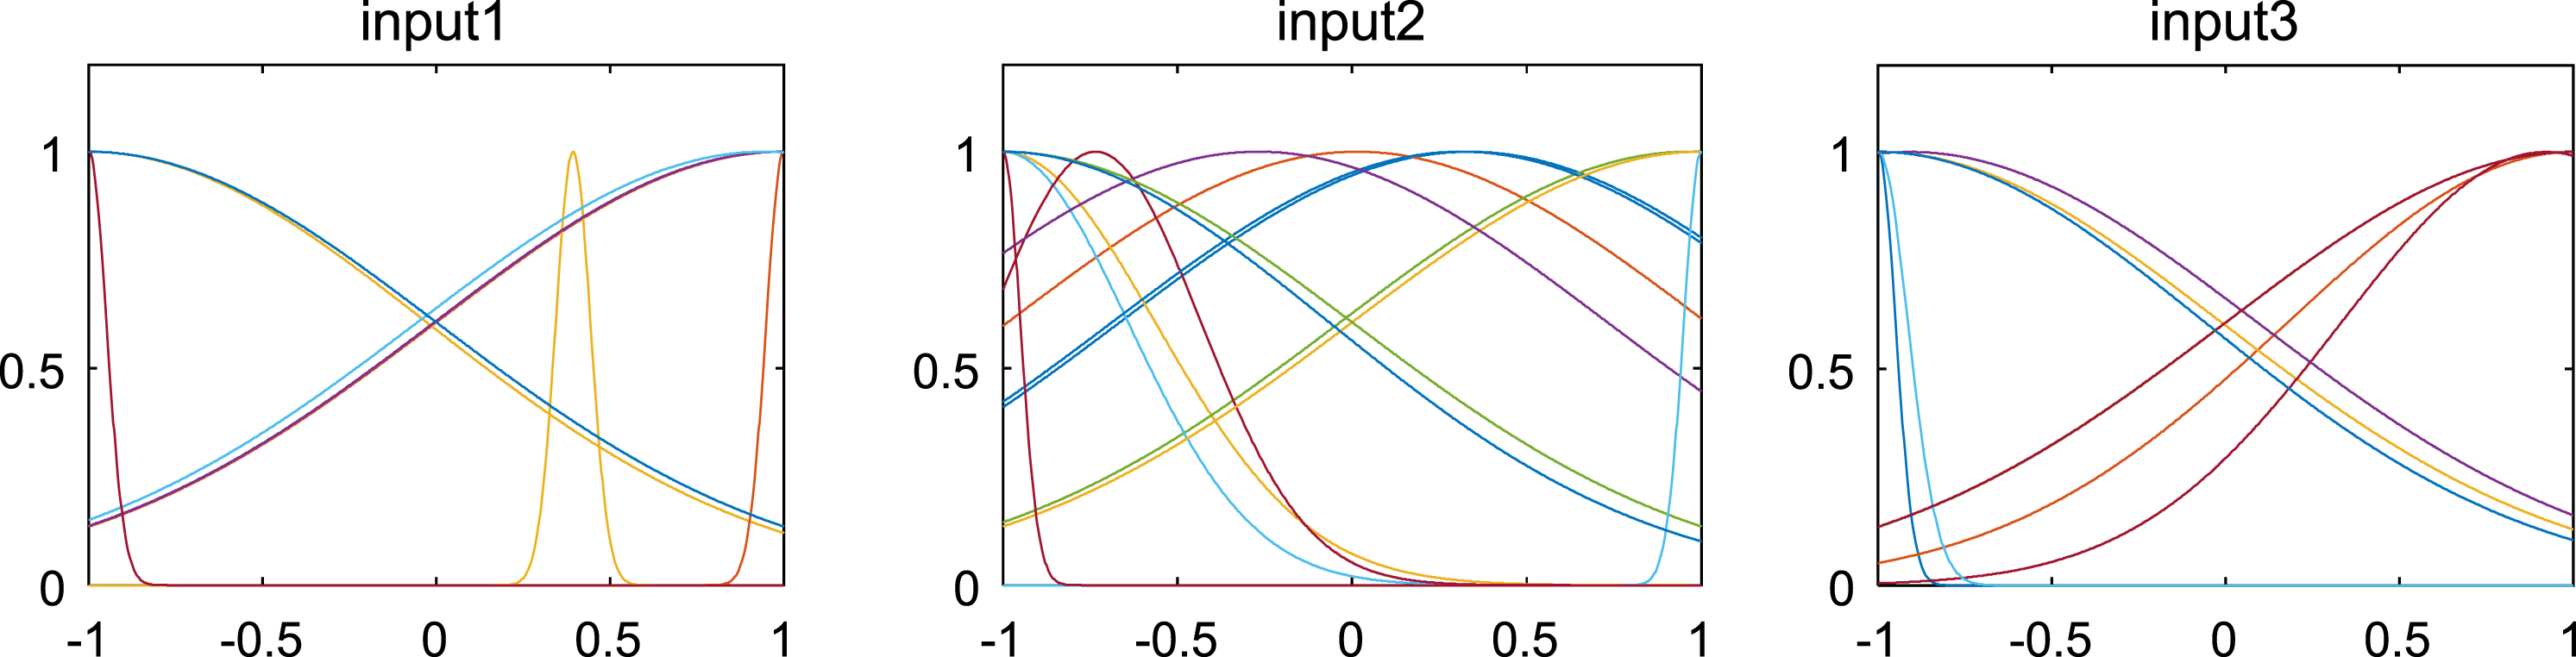
Membership function of three input variables based on NAPEPSO-ANFIS learning strategy.

Effluent purity prediction results in E port.

Effluent purity prediction error in E port.

Prediction results of impurity purity in R port.

Prediction error of impurity purity in R port.
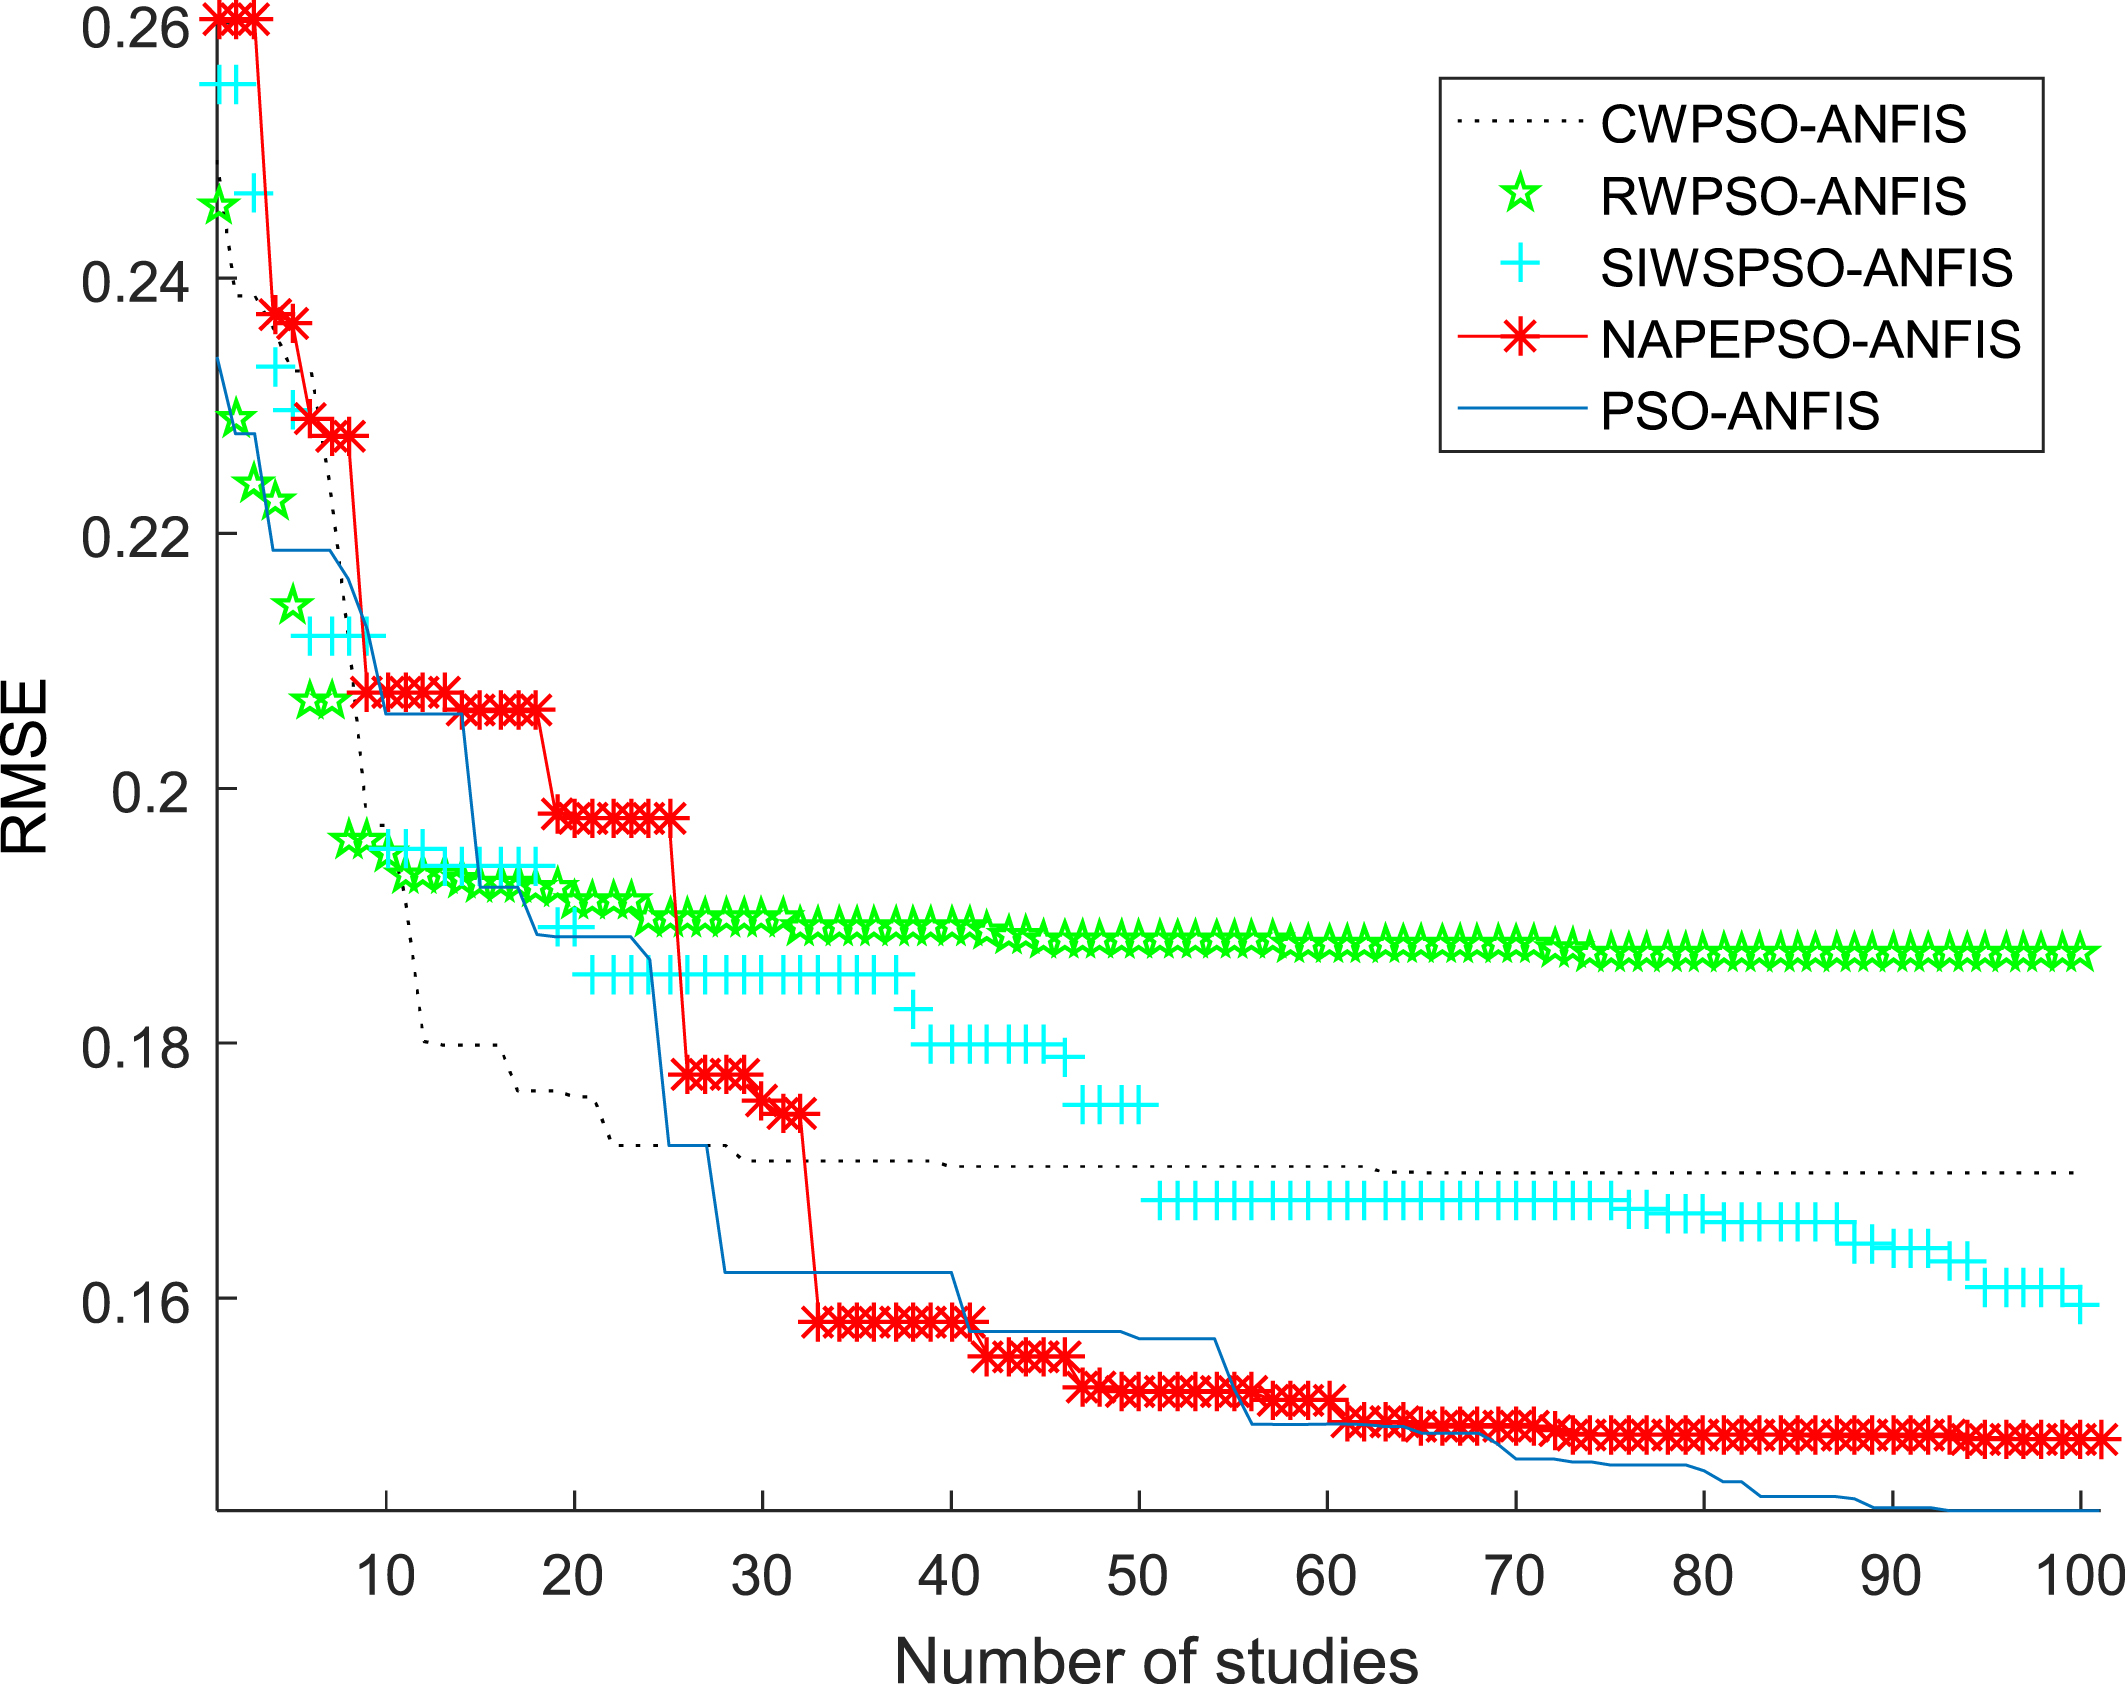
Comparison of training RMSE curves.
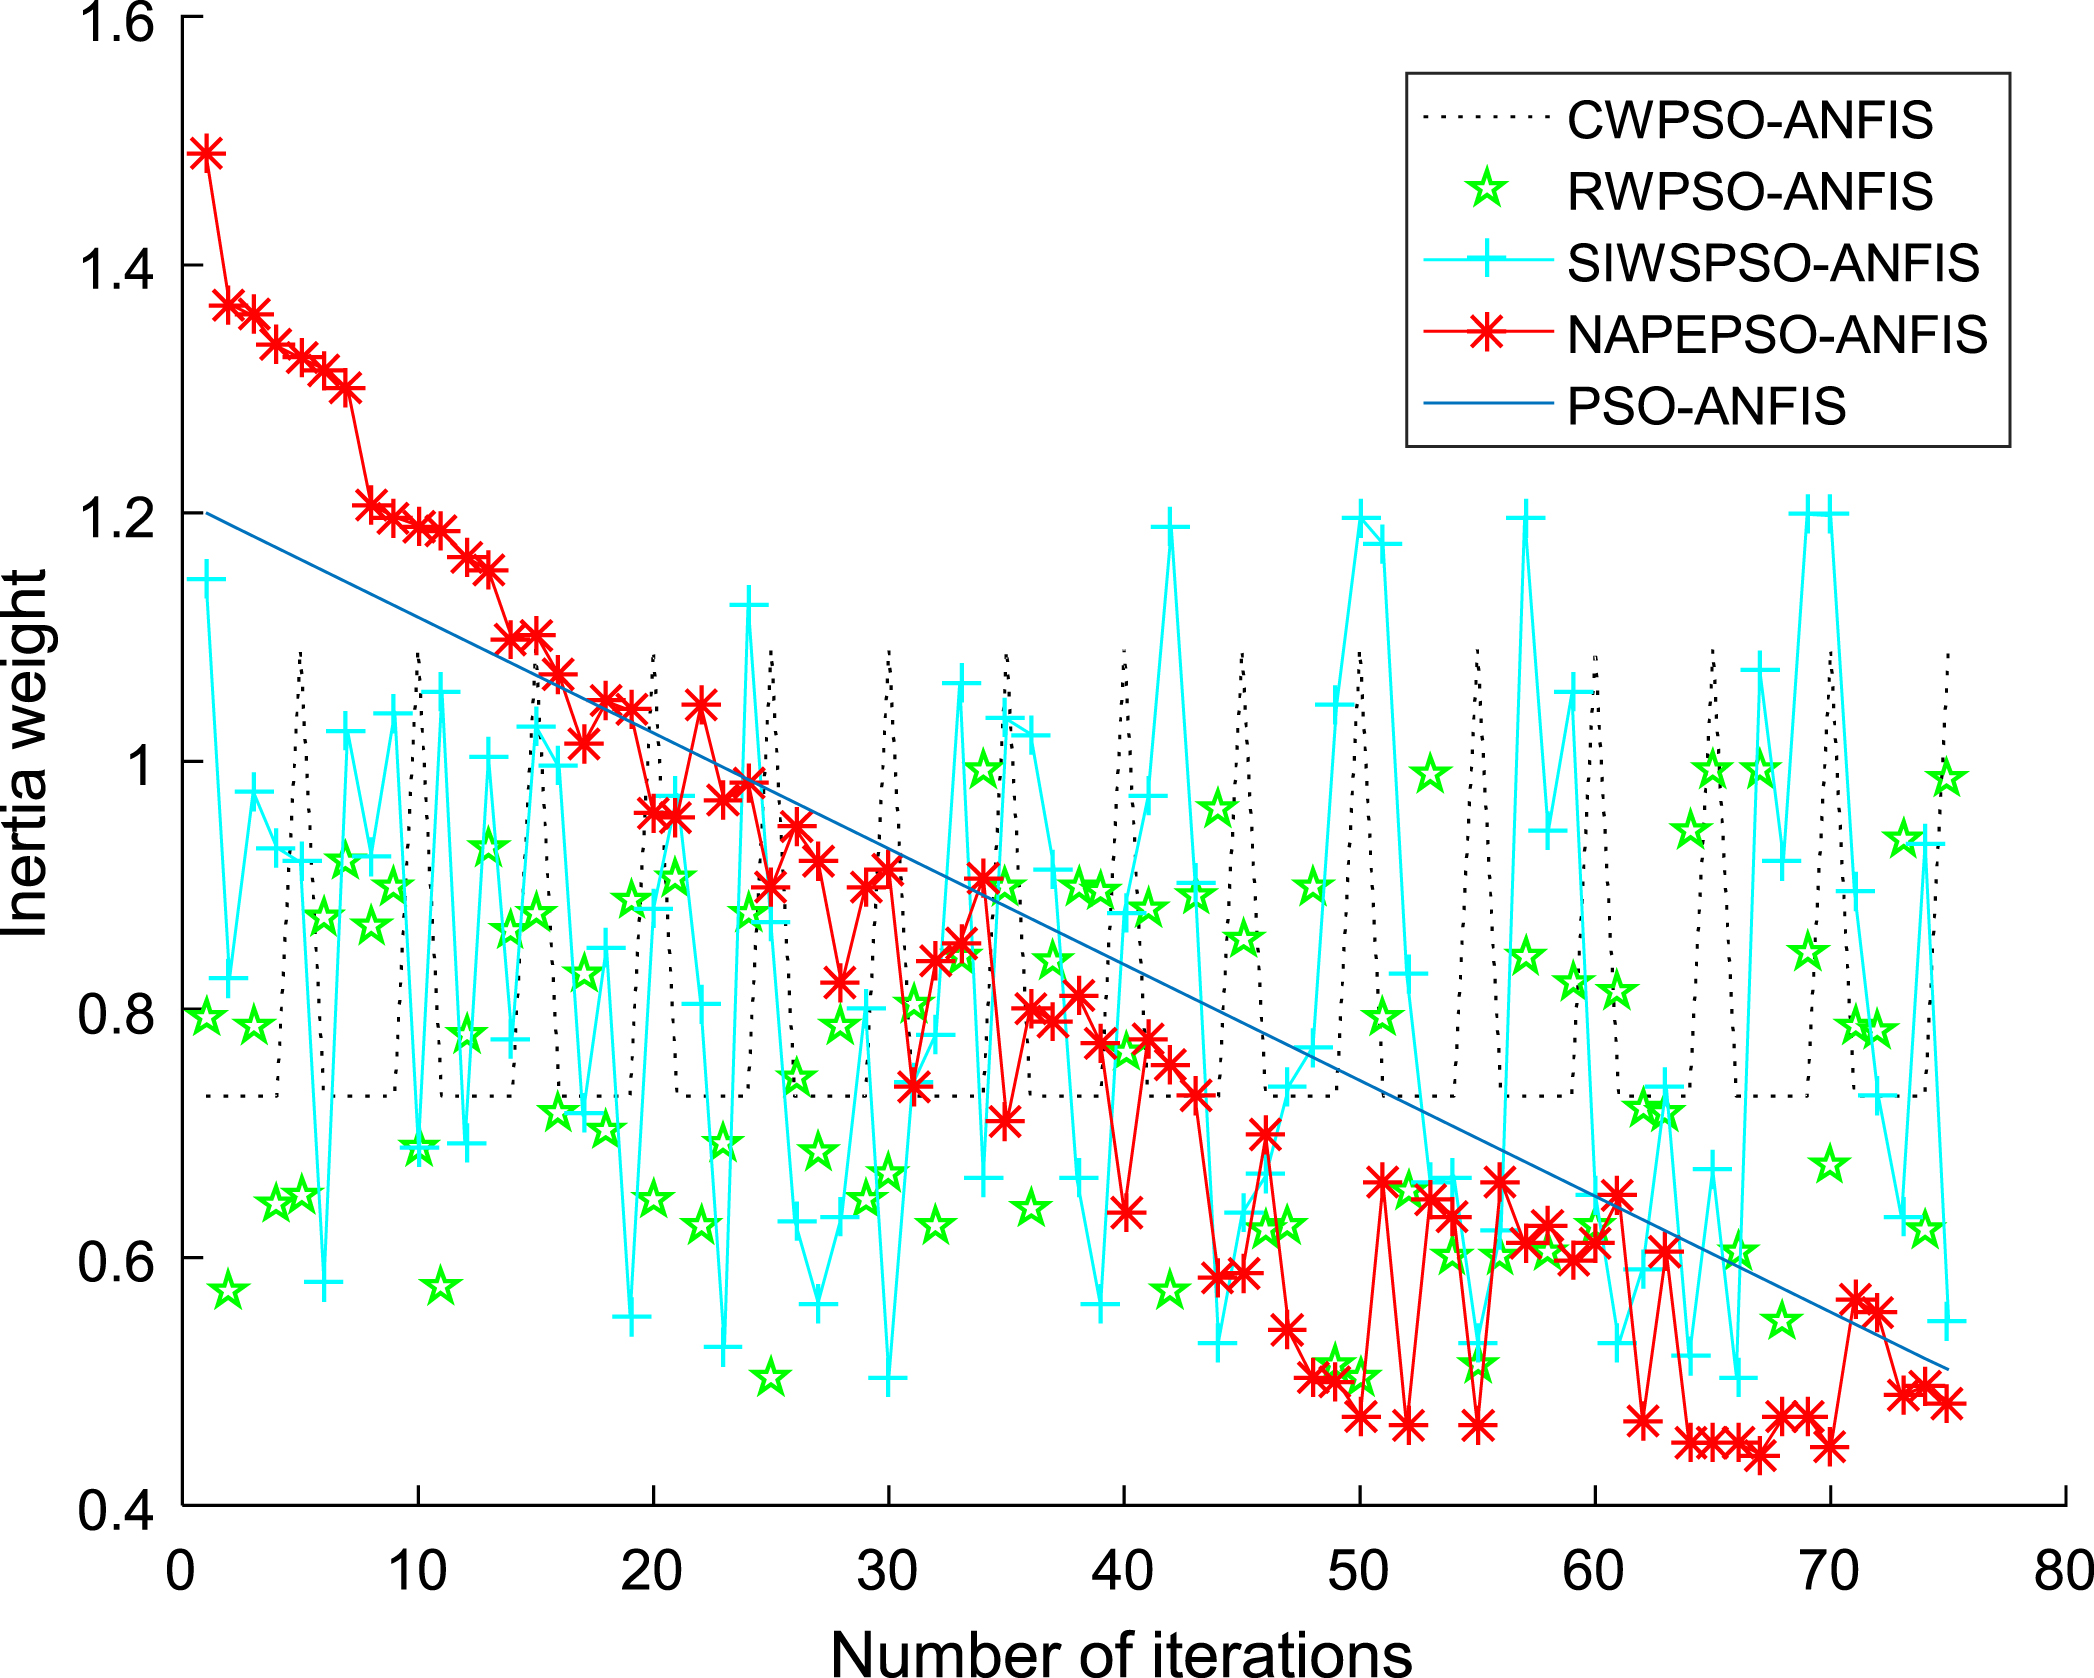
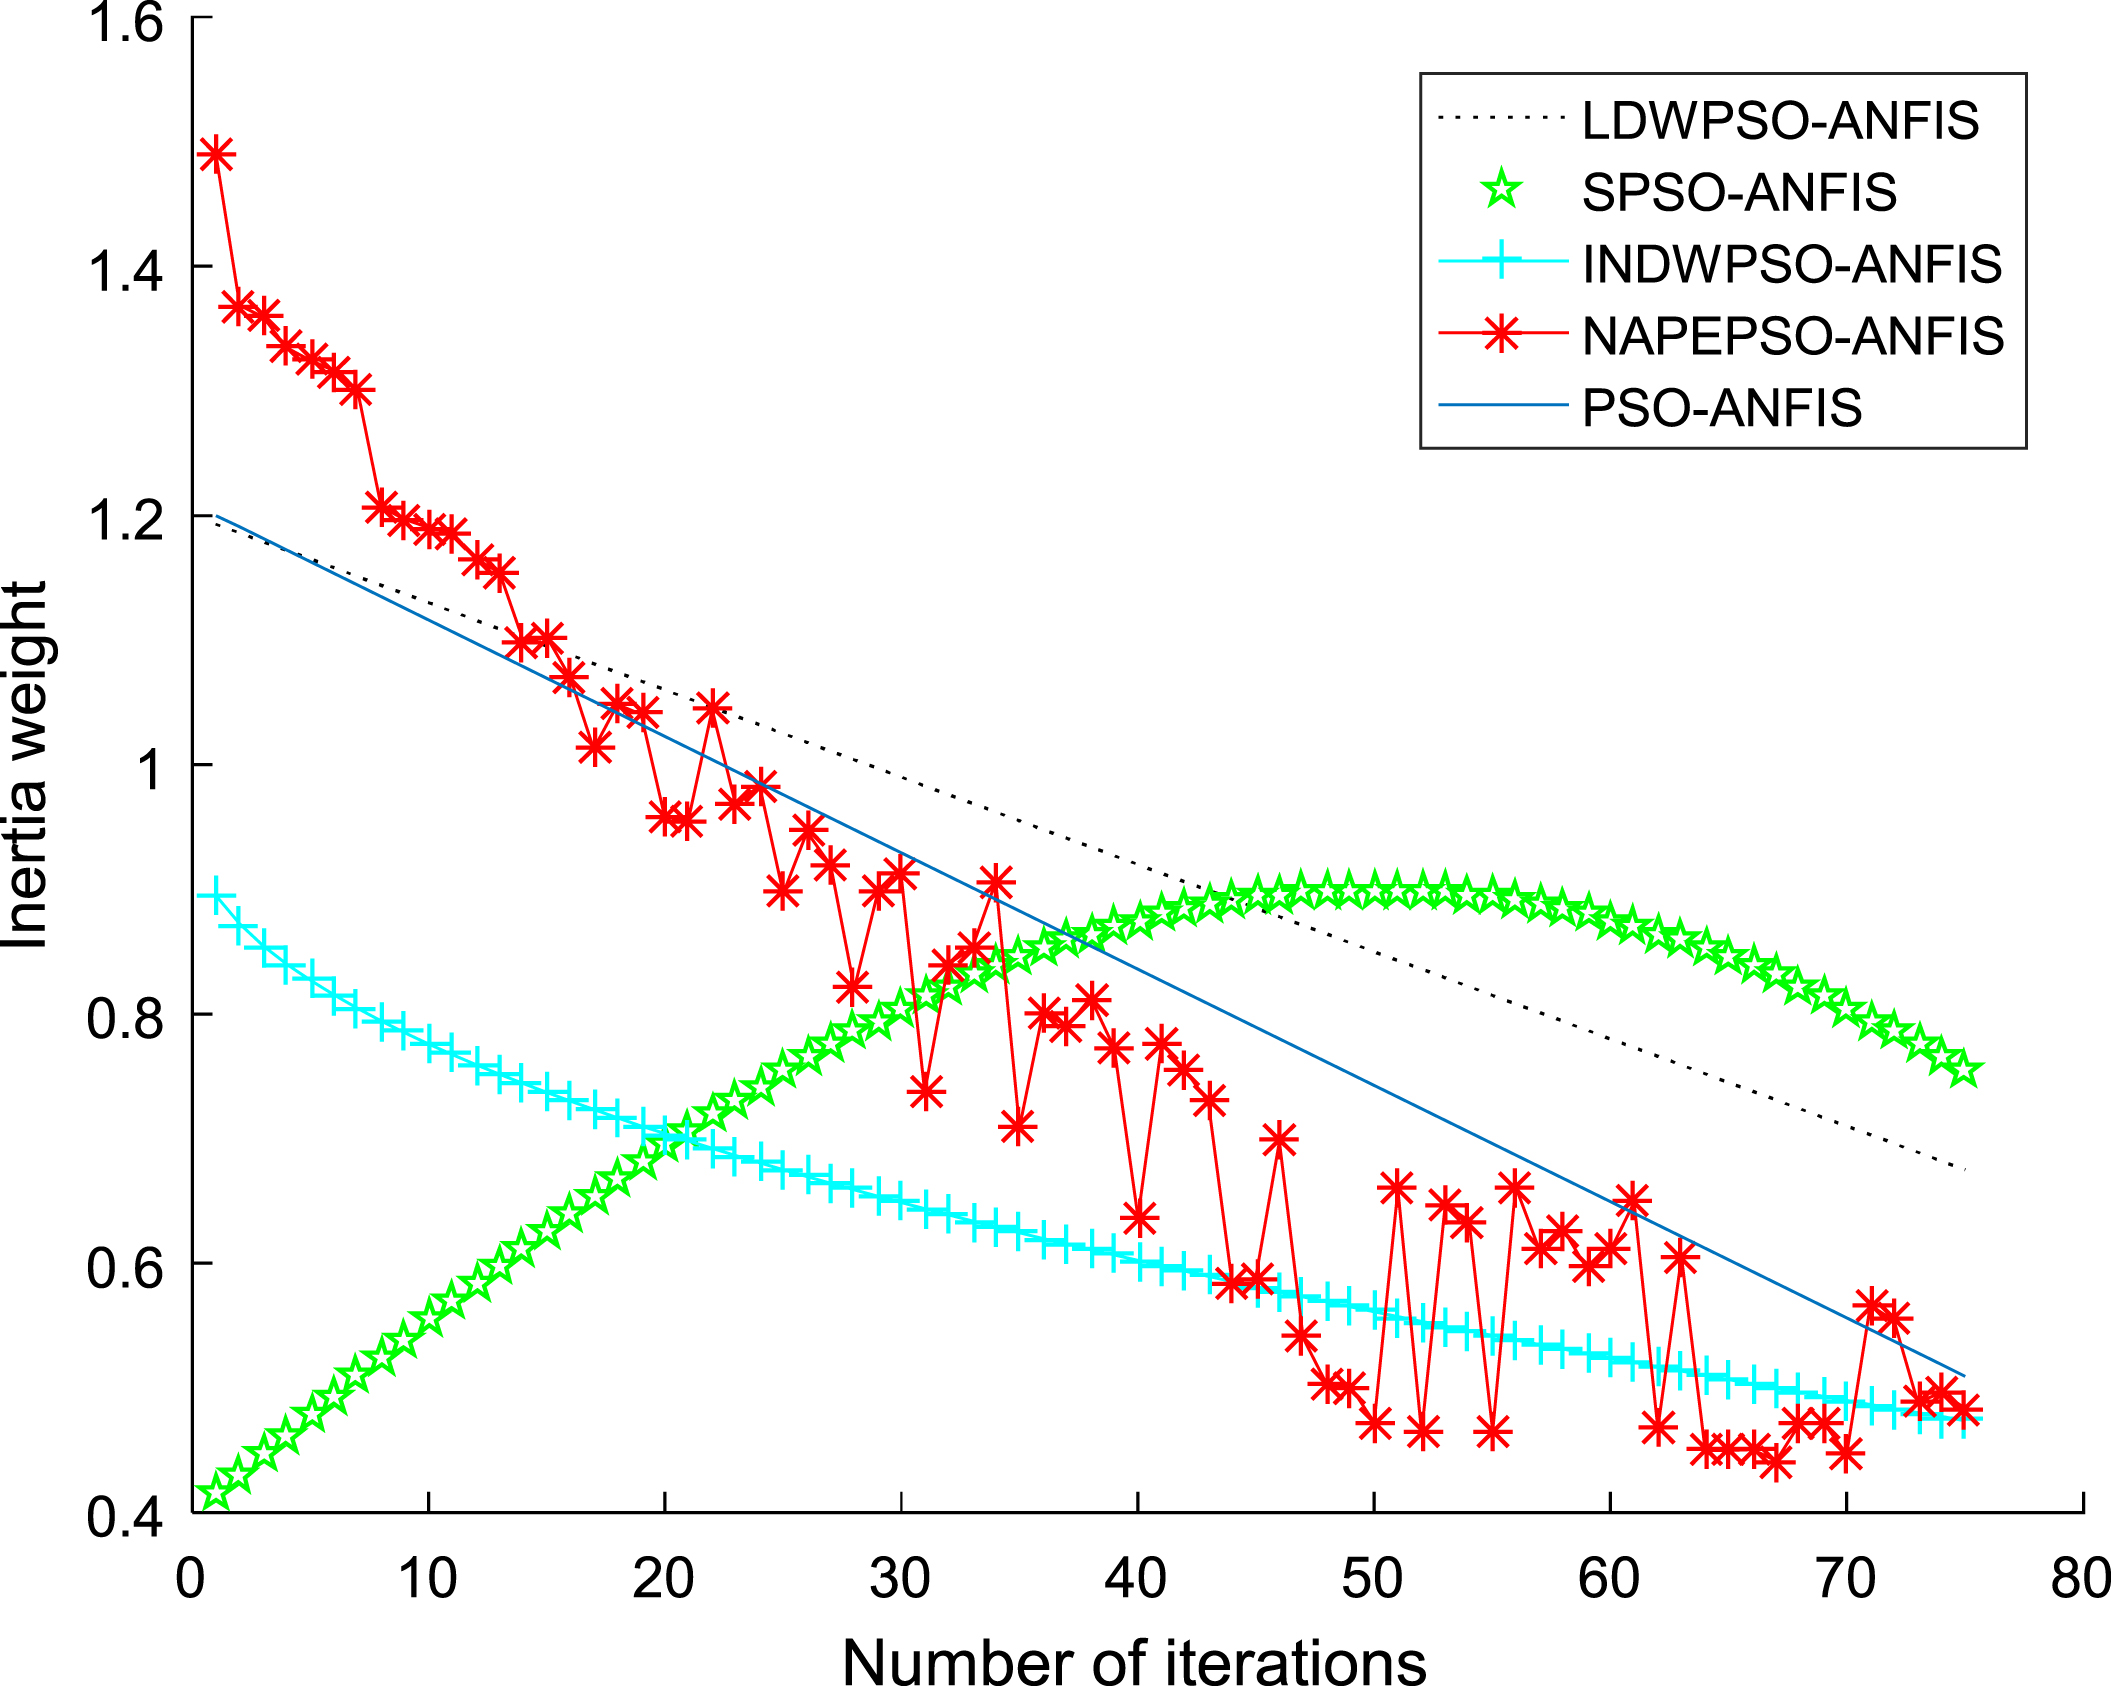
Comparison of inertia weights curves.
Performance Indexes Comparison of PSO-ANFIS Soft-sensor models based on random inertia weights
According to the above simulation results, it can be seen that the ANFIS soft-sensor model based on NAPEPSO algorithm has a good effect on the prediction results of key economic and technical indicators in the SMB chromatographic separation process, and the degree of fitting is highest. In order to distinguish the optimization performance of the four algorithms, according to the four performance indicators introduced, the RWPSO-ANFIS model has a poor performance than the other four algorithms. In conclusion, the ANFIS soft-sensor model based on NAPEPSO algorithm is superior to the other algorithms and has higher prediction accuracy.
When establishing the PSO-ANFIS soft-sensor models based on inertia weights with iterative function, the membership function selects the Gaussian function, and Fig. 15–17 show the membership functions of three input variables based on PSO algorithm with inertia weights with different iterative function to optimize the Sugeno-type ANFIS model parameters. The number of training iterations of the soft-sensor model is 500, and the model is tested with 200 sets of data with average and representativeness. The predicted simulation results are shown in Fig. 18–21. Figure 18 shows the purity of the target in the E-flow effluent in the SMB chromatographic separation process by adopting LDWPSO-ANFIS model, SPSO-ANFIS model, INDWPSO-ANFIS model, PSO-ANFIS Model, and NAPEPSO-ANFIS model. Figure 19 shows the error comparison curves. Figure 20 shows the output contrast curves of the purity of the impurity in the R port effluent by using LDWPSO-ANFIS model, SPSO-ANFIS model, INDWPSO-ANFIS model, PSO-ANFIS Model, and NAPEPSO-ANFIS model. Figure 21 shows the error comparison curves. Figure 22 is a comparison of the training RMSE curves. Figure 23 shows five inertia weight changing curves. Table 5 compares the predicted performance indicators of the established soft-sensor models.
Membership function of three input variables based on LDWPSO-ANFIS learning strategy.

Membership function of three input variables based on SPSO-ANFIS learning strategy.
Membership function of three input variables based on INDWPSO-ANFIS learning strategy.

Effluent purity prediction results in E port.

Effluent purity prediction error in E port.

Prediction results of impurity purity in R port.

Prediction error of impurity purity in R port.

Comparison of training RMSE curves.
Comparison of inertia weight curves.
Performance Indexes Comparison of PSO-ANFIS Soft-sensor models based on iterative number function inertia weights
According to the above simulation results, it can be seen that the ANFIS soft-sensor model based on NAPEPSO algorithm has the bett prediction performance on the key economic and technical indicators in the SMB chromatographic separation process, and the degree of fitting is highest. According to the performance of the adopted four performance indicators, the optimization performance of the four algorithms is compared. The SPSO-ANFIS model has a large error in the prediction of R port. The ANFIS soft-sensor model based on NAPEPSO algorithm has better prediction results than other three models, which has higher prediction accuracy and is slightly better than other models.
When establishing the PSO-ANFIS soft-sensor models based on inertia weights with feedback information function, the membership function selects the Gaussian function, and Fig. 24–26 show the membership functions of three input variables based on PSO algorithm with inertia weights with different feedback information function to optimize the Sugeno-type ANFIS model parameters. The number of training iterations of the soft-sensor model is 500, and the model is tested with 200 sets of data with average and representativeness. The predicted simulation results are shown in Fig. 27–30. Figure 27 shows the purity of the target in the E-flow effluent in the SMB chromatographic separation process by adopting EIWPSO-ANFIS model, APSOM-ANFIS model, PAWPSO- ANFIS model, and PSO-ANFIS model, and NAPEPSO-ANFIS model. Figure 28 shows the error comparison curves. Figure 29 shows the output contrast curves of the purity of the impurity in the R port effluent by using EIWPSO-ANFIS model, APSOM-ANFIS model, PAWPSO-ANFIS model, and PSO-ANFIS model, and NAPEPSO-ANFIS model. Figure 30 shows the error comparison curves. Figure 31 is a comparison of the training RMSE curves. Figure 32 shows five inertia weight changing curves. Table 6 compares the predicted performance indicators of the established soft-sensor models.
Membership function of three input variables based on EIWPSO-ANFIS learning strategy.

Membership function of three input variables based on APSOM-ANFIS learning strategy.
Membership function of three input variables based on PAWPSO-ANFIS learning strategy.

Effluent purity prediction results in E port.
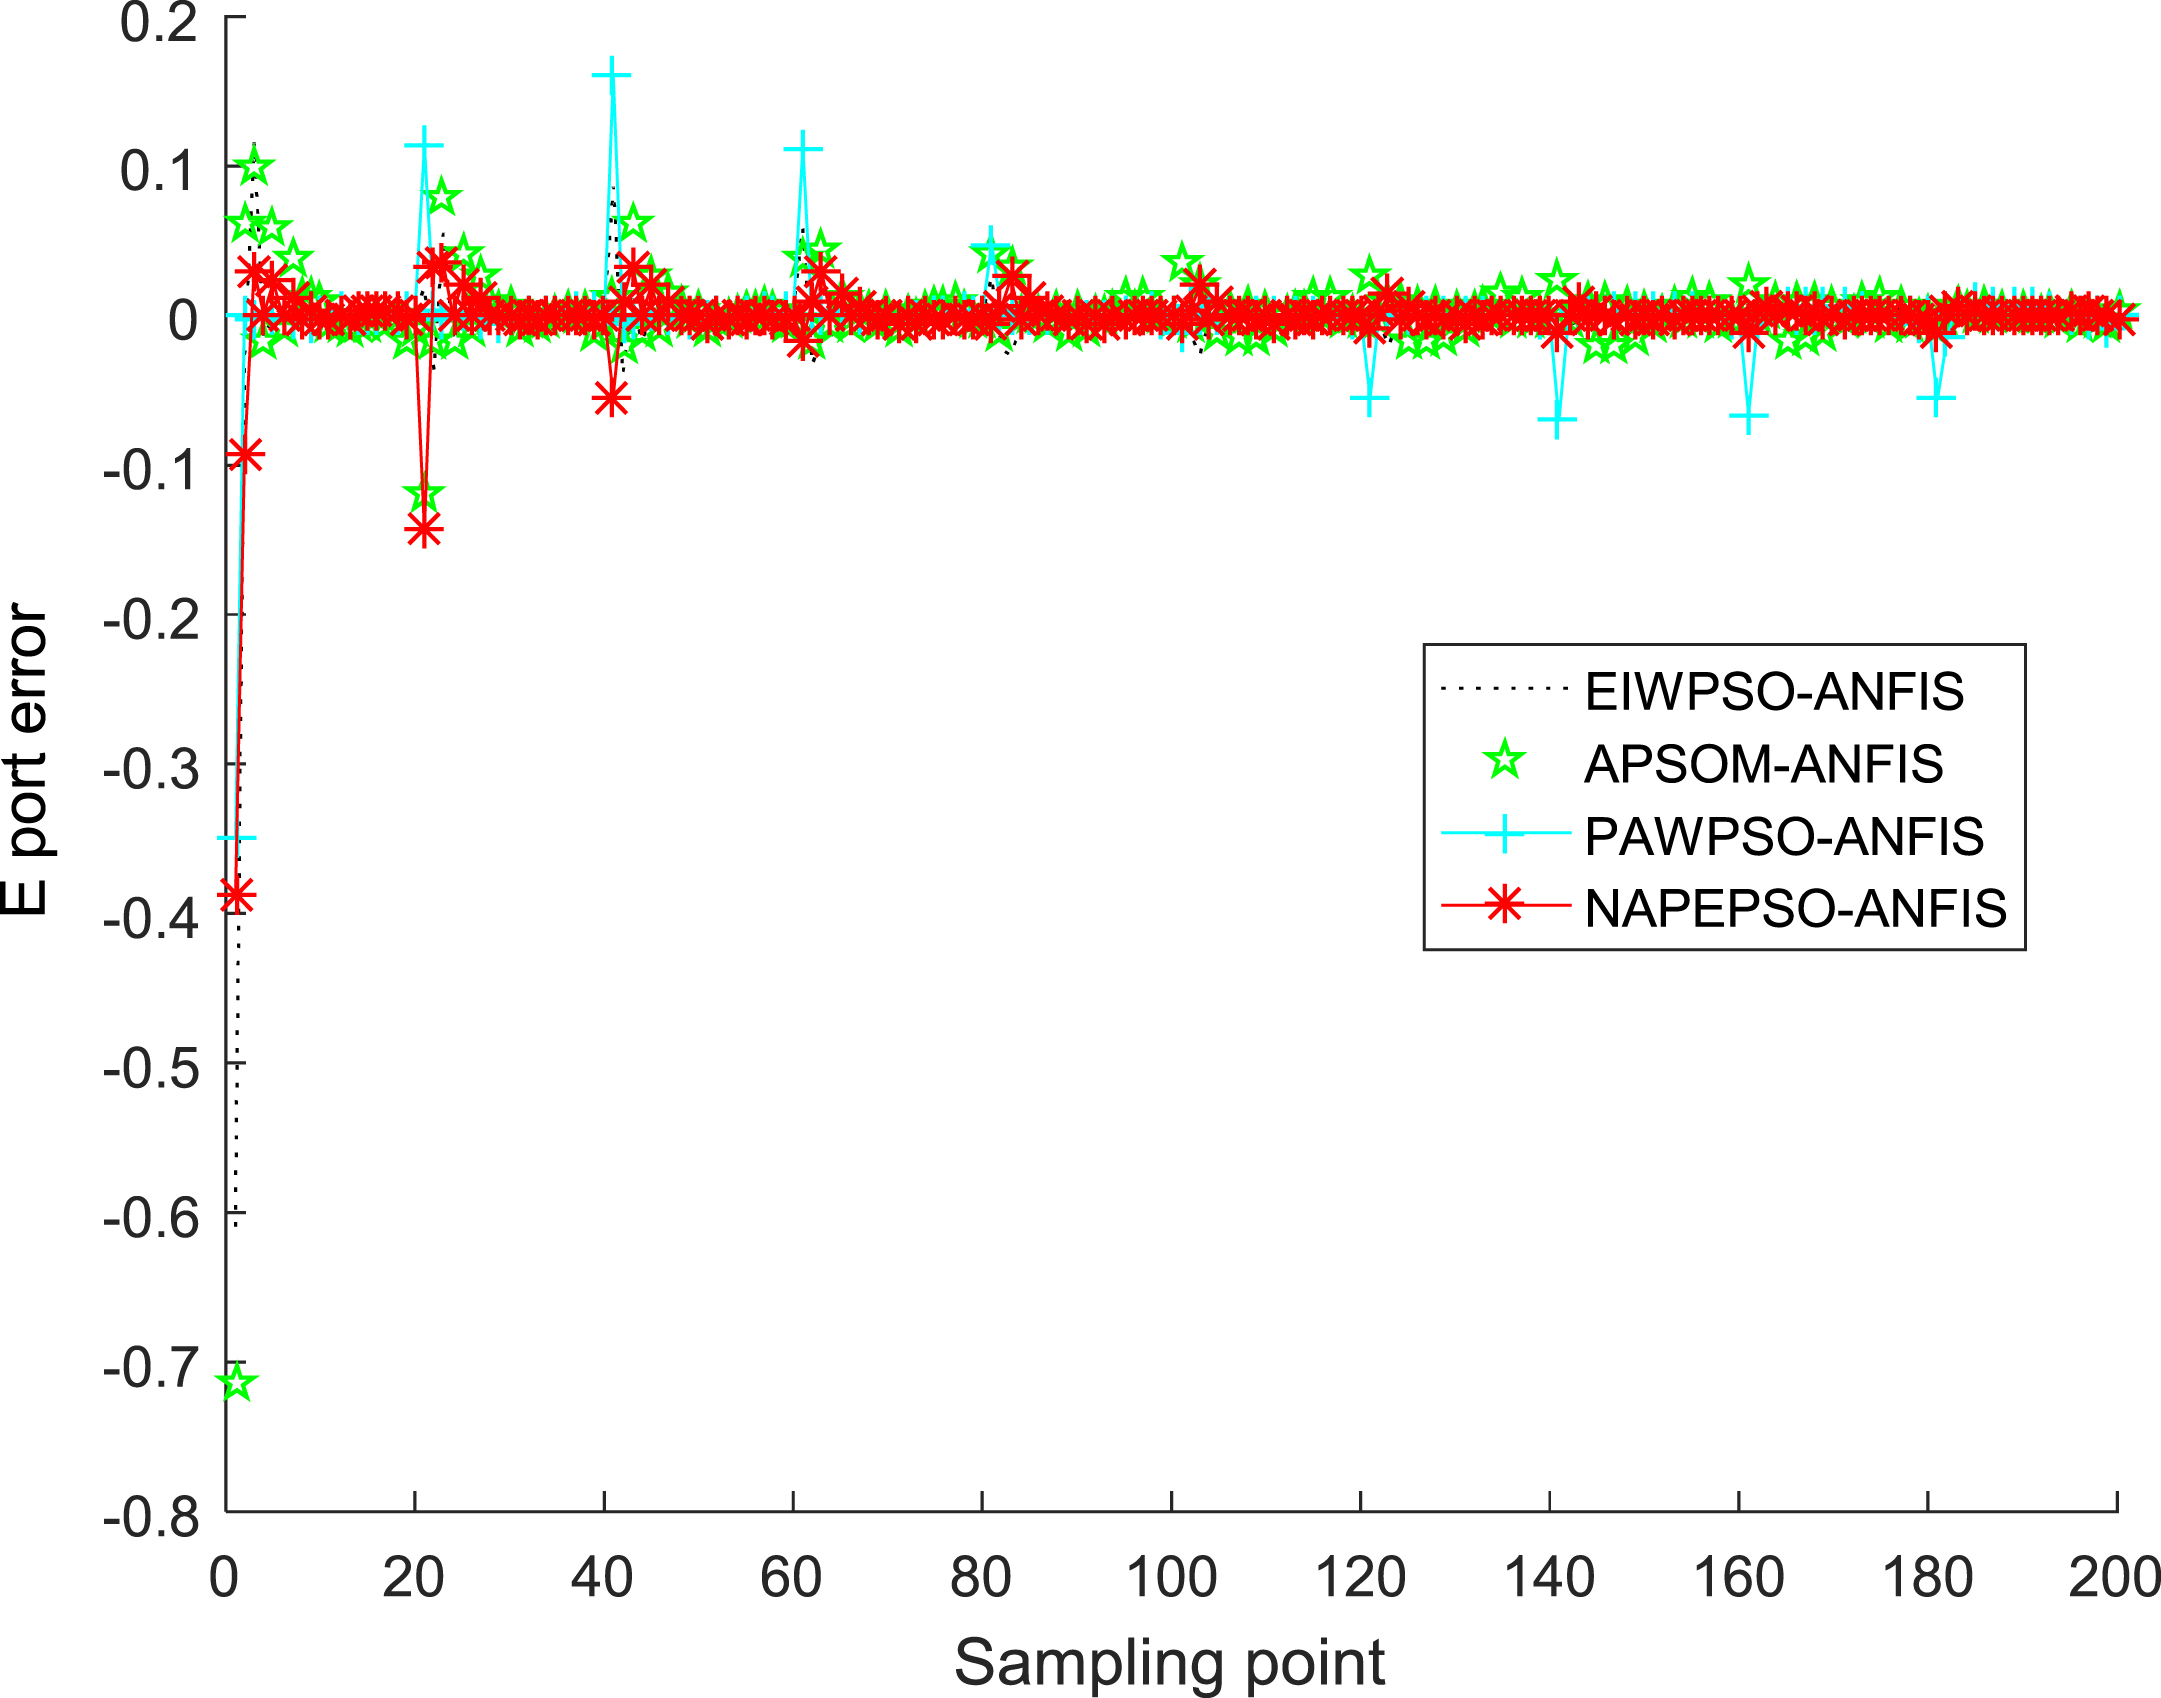
Effluent purity prediction error in E port.
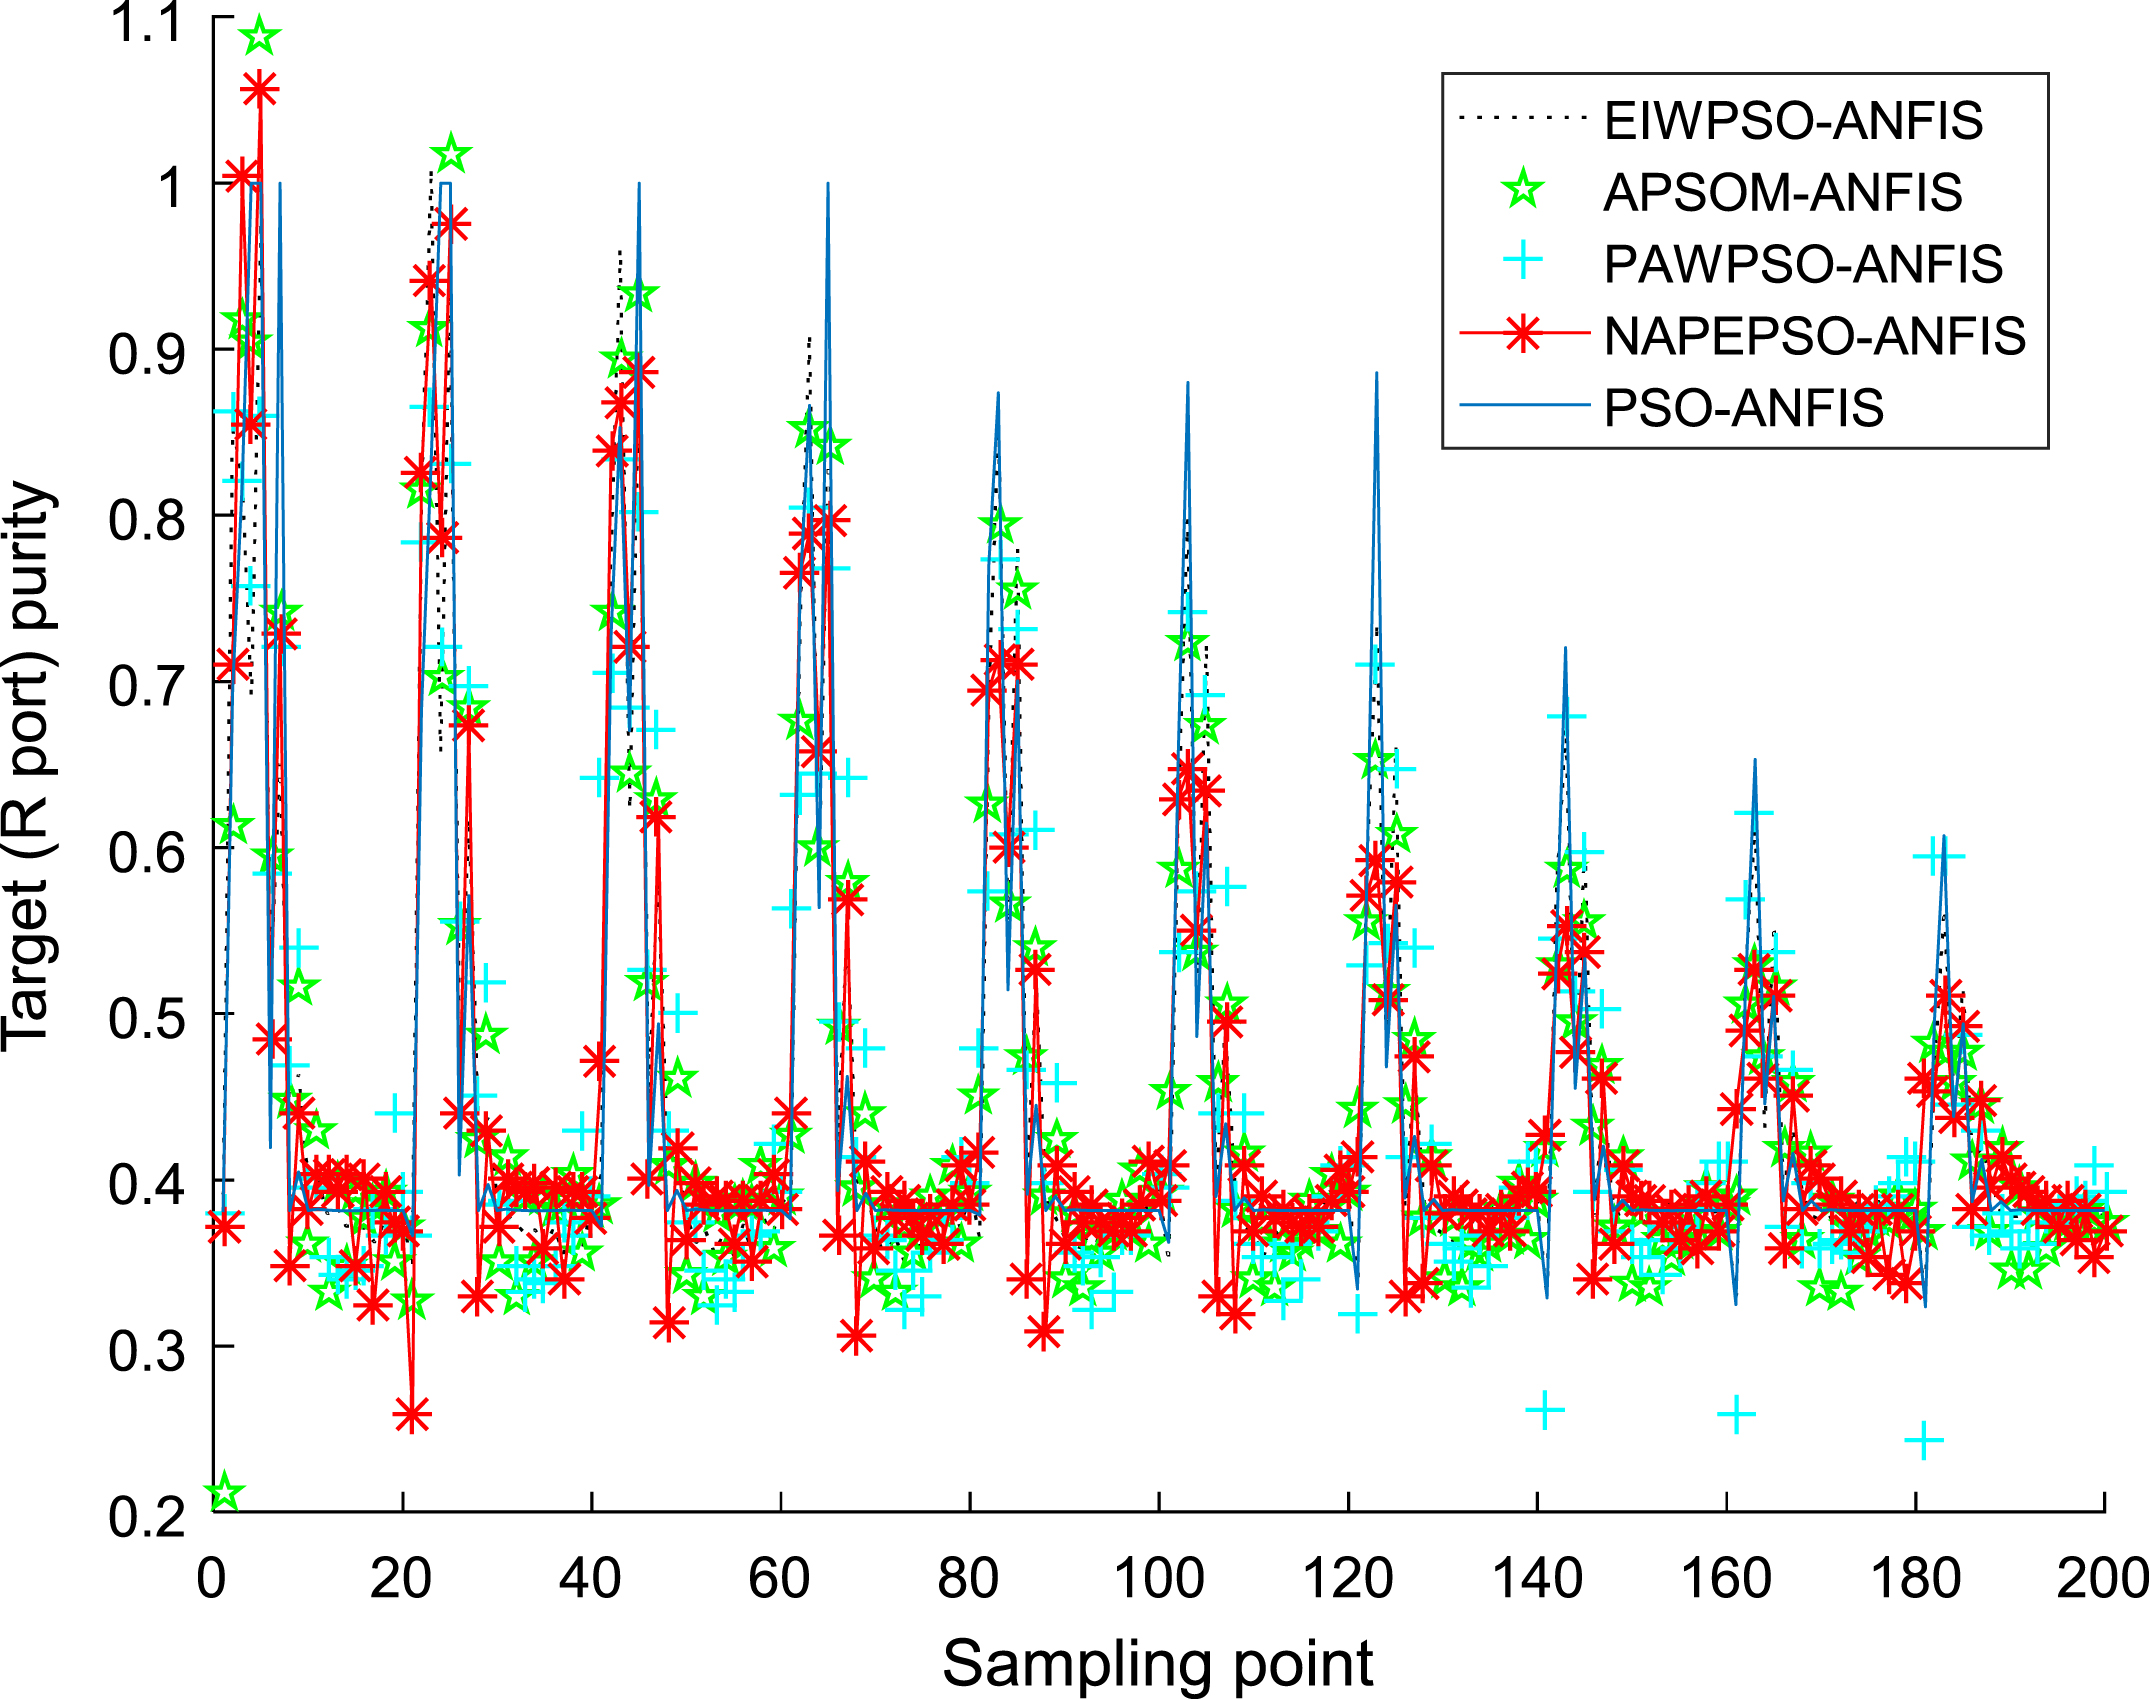
Prediction results of impurity purity in R port.

Prediction error of impurity purity in R port.

Comparison of training RMSE curves.
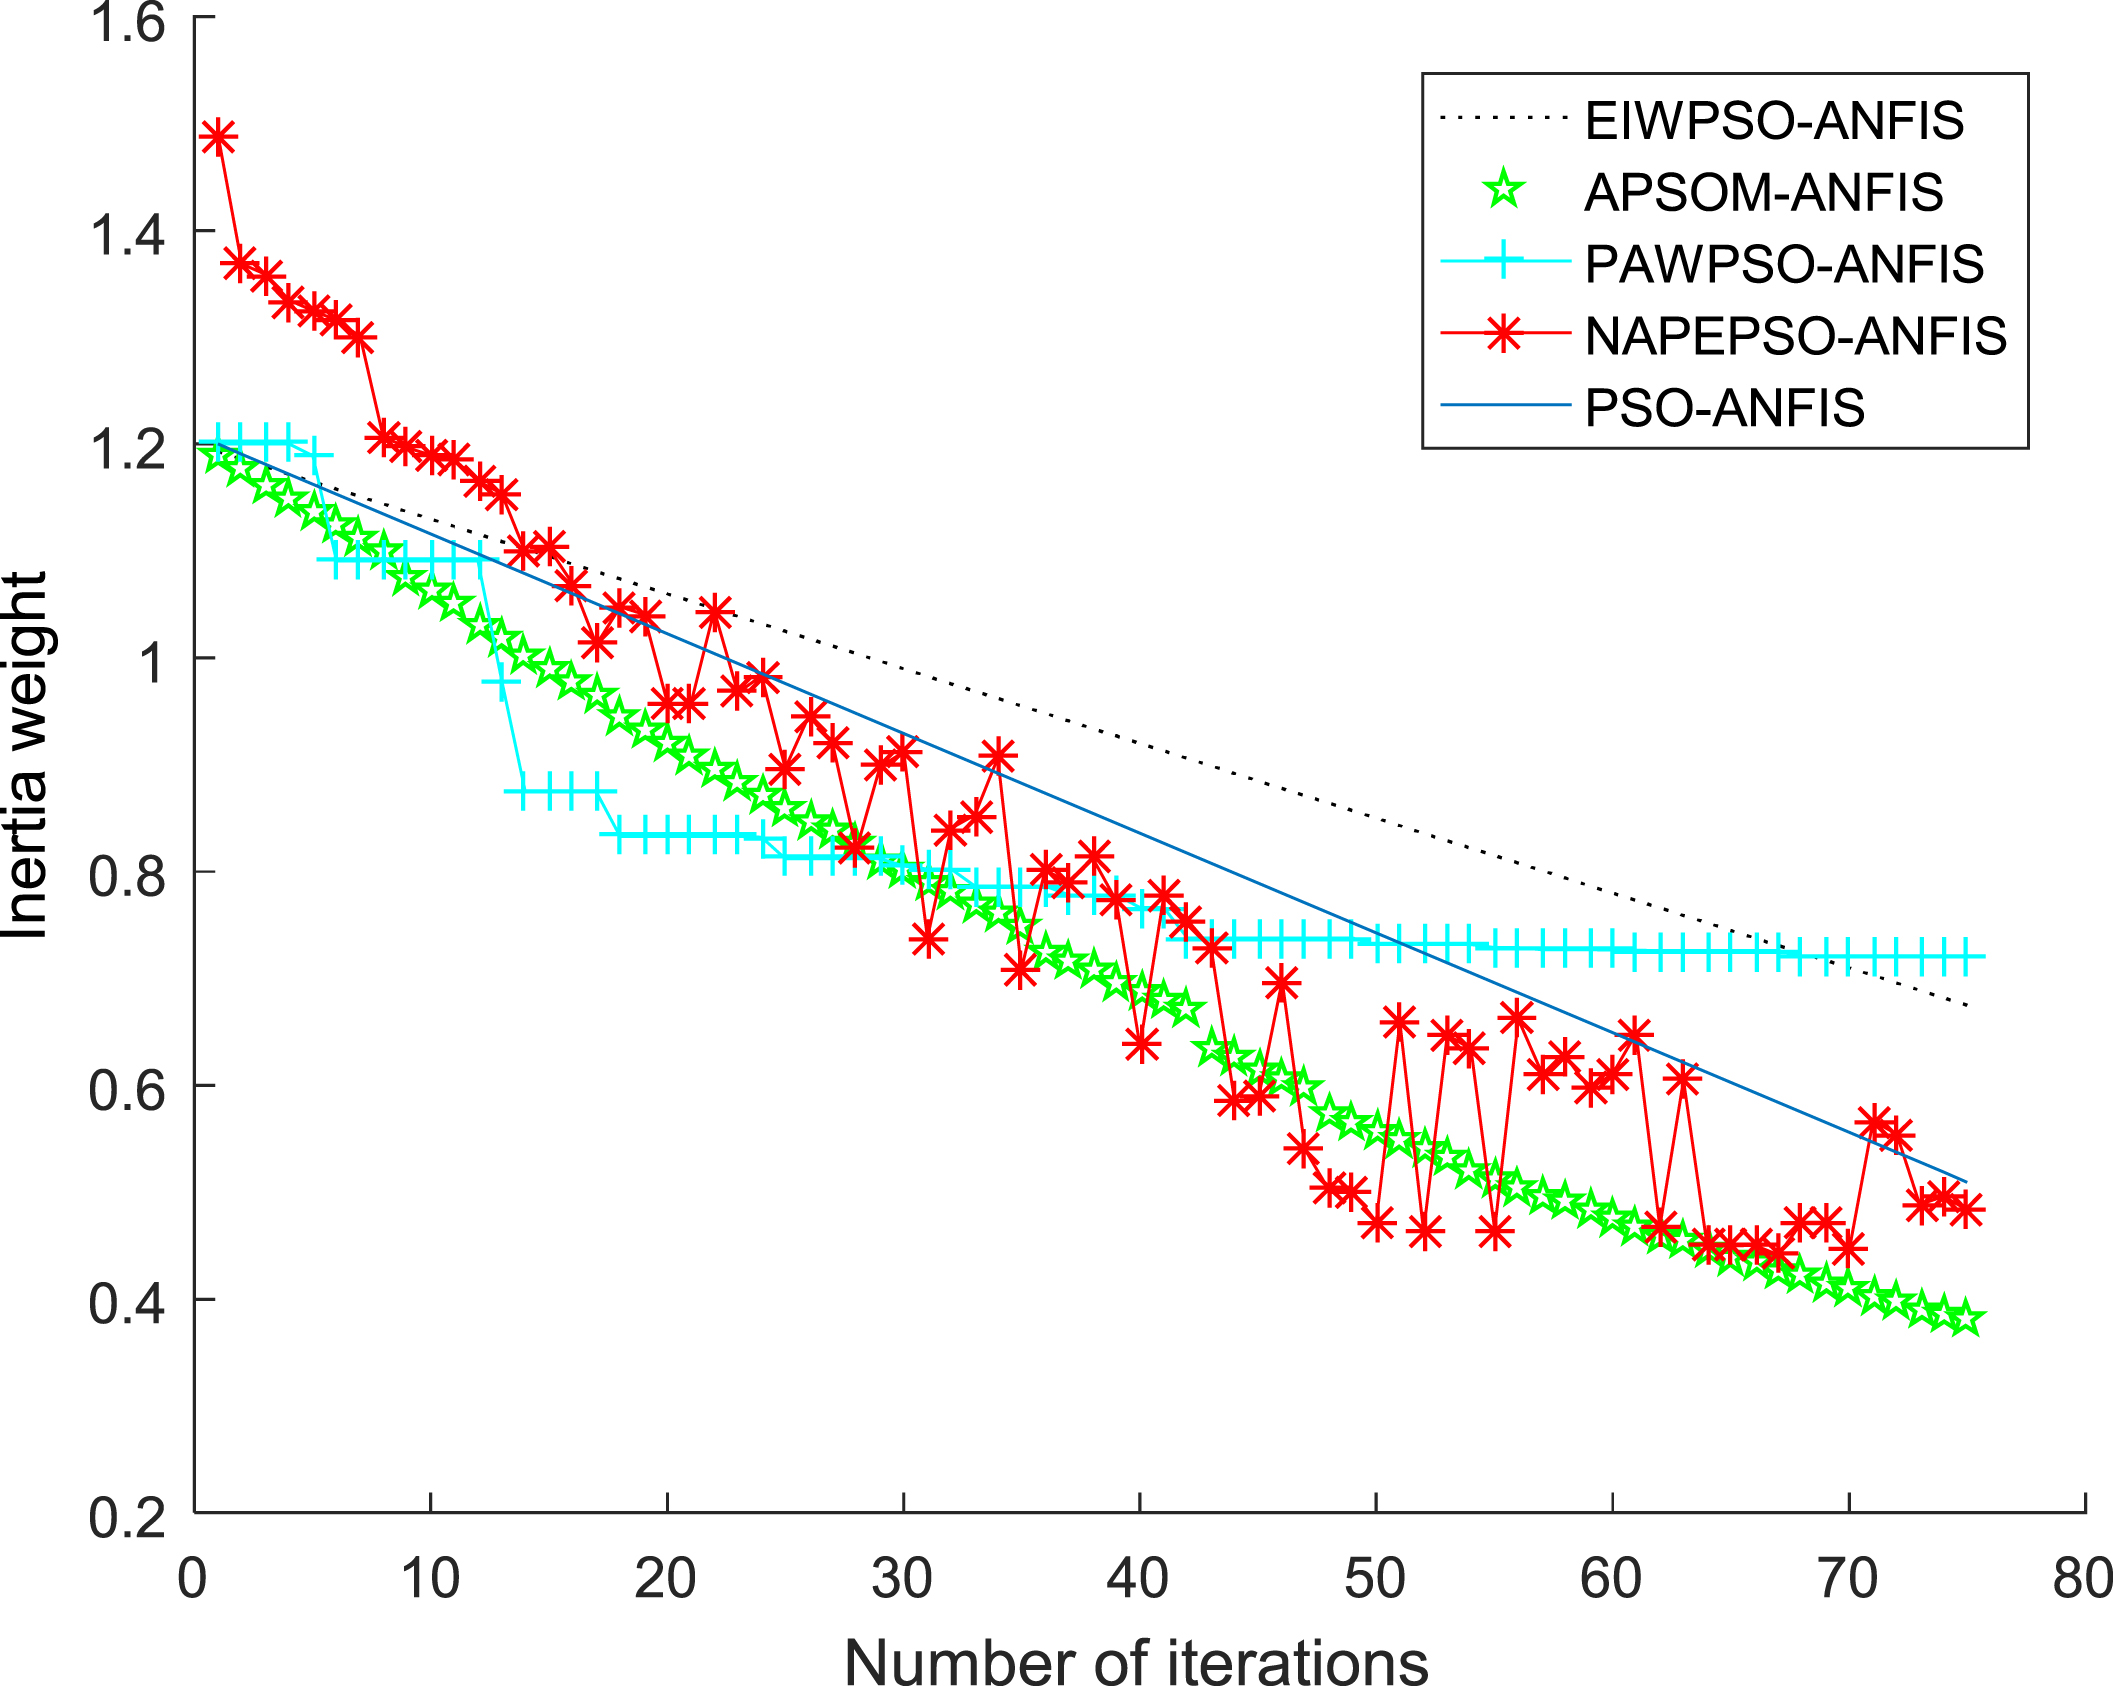
Comparison of inertia weight curves.
Performance Indexes Comparison of PSO-ANFIS Soft-sensor models based on feedback information function inertia weights
According to the above simulation results, it can be seen that the ANFIS soft-sensor model based on NAPEPSO algorithm has a better prediction results on key economic and technical indicators in the SMB chromatographic separation process, and the degree of fitting is highest. Seen from the E-port and R-port model output curves, the ANFIS soft-sensor model based on NAPEPSO algorithm is better than other modles. In order to distinguish the optimization performance of the four models, according to the adopted four performance indicators, the performance index of the ANFIS soft-sensor model based on NAPEPSO algorithm is better than other three models and has highest prediction accuracy.
In this paper, the soft-sensor modeling of SMB chromatographic separation process based on PSO-ANFIS with improved inertia weight is established. The PSO algorithm is improved by using three different types of inertia weights compared with the NAPEPSO algorithm proposed in this paper. The PSO-ANFIS model based on improved inertia weight is applied to the soft-sensor model for predicting the purity of the target (E and R) in the SMB chromatographic separation process.The simulation results are used to verify that the model can obtain better fitting prediction results. The proposed NAPEPSO algorithm has significantly improved the search speed, convergence precision and robustness compared with the existing improved initeria weights, and has the ability to get rid of the local optimal solution. Because of the sufficient training data, the training of fuzzy neural network parameters is also very sufficient. The simulation results show that the soft-sensor model established by this method can accurately predict the purity of components.
Footnotes
Acknowledgments
This work is partially supported by the Project by National Natural Science Foundation of China (Grant No. 21576127).
Author contributions
A substantial amount of Dan Wang’s contributions participated in the algorithm simulation and the draft writing. Jie-Sheng Wang ’s contributions participated in the concept, design and critical revision of this paper. Shao-Yan Wang participated in the interpretation and commented on the manuscript. Cheng Xing and Xu-Dong L’s contributions participated in the data collection and analysis.
Conflicts of interest
The authors declare no conflict of interest.