
Abstract
In order to solve some optimization problems with multi-local optimal solutions, a plague infectious disease optimization (PIDO) algorithm is proposed by the dynamic model of plague infectious disease with pulse vaccination and time delay. In this algorithm, it is assumed that there are several villagers living in a village, each villager is characterized by some characteristics. The plague virus is prevalent in the village, and the villagers contract the infectious disease through effective contact with sick rats. The plague virus attacks is the few characteristics of the human body. Under the action of the plague virus, the growth status of each villager will be randomly transformed among 4 states of susceptibility, exposure, morbidity and recovery, thus a random search is achieved for the global optimal solution. The physical strength degree of villagers is described by the human health index (HHI). The higher the villager’s HHI index, the stronger the physique and the higher the surviving likelihood. 9 operators (S_S, S_E, E_E, E_I, E_R, I_I, I_R, R_R, R_S) are designed in the PIDO algorithm, and each operator only deals with the 1/1000∼1/100 of the total number of variables each time. The case study results show that PIDO algorithm has the characteristics of fast search speed and global convergence, and it is suitable for solving global optimization problems with higher dimensions.
Keywords
Introduction
When solving global optimal solutions with a large number of local optimal solution optimization problems, the swarm intelligence optimization algorithm has unique advantages [1]. When an optimization problem is solved in this kind of algorithm, many trial solutions are started at the same time, and iterative calculations are implemented. Some very difficult multi-local optimization problems can be solved by this “group attack” method. Unfortunately, there is no swarm intelligence optimization algorithm that can solve all types of optimization problems [2]. People have proposed a lot of swarm intelligence optimization algorithms, such as genetic algorithm [3], ant colony algorithm [4, 5], particle swarm algorithm [6–8], biogeographic algorithm [9], differential evolution algorithm [10, 11], bee colony algorithm [12].
There are a large number of local optimal solution optimization problems to solve global optimal solutions. Multi Access Interference (MAI) is the main source limiting the capacity and quality of the Multiple-Input Multiple-Output Ortho-gonal Frequency Division Multiplexing (MIMO-OFDM) system which fulfills the demand of high-speed transmission rate and high quality of service for future underwater acoustic (UWA) communication. Multi User Detection (MUD) is needed to overcome the per-formance degradation caused by MAI. Both local and global optimal solutions are obtained in Bionic Binary Spotted Hyena Optimizer (BBSHO) algorithm using the Position Coordinate Vectors (PCVs) of the social behavior of spotted hyenas to achieve MUD [13]. Further, Extremal Optimization (EO) is introduced in BBSHO algorithm to improve the local search ability within the search space. With the measurement of the Earth’s magnetic field, magnetic compass can provide high frequency heading information. However, it suffers from local magnetic interference. An intelligent ellipsoid calibration method based on the grey wolf is proposed to generate optimal parameters for magnetic compass to generate high performance heading information [14]. With the analysis of the projection relationship among the navigation coordinate frame, the body frame and the local horizontal frame, the heading ellipsoid equation is constructed. Time evolutionary optimization (TEO) is a novel population-based meta-heuristic optimization algorithm, inspired by natural selection and evolution of creatures over time. Time and the environment are two main factors of evolution at TEO. Enhanced time evolutionary optimization (ETEO) is presented [15]. ETEO is the new version of TEO which modifies time evolutionary factor and applied population clustering. Population clustering amplified environmental factor to increase the efficiency of ETEO. For this purpose, a memory is used to save some best designs and ETEO can escape from local optimal points. The algorithm was validated by solving several constraint benchmarks and engineering design problems. The material 20MnMoNi55 reactor pressure vessel (RPV) steel has safety-critical applications and may experience cyclic loading during atypical operating conditions. Simulation of the material behaviour subjected to cyclic loading requires suitable kinematic hardening rules and accurate material parameters. The determination of Chaboche kinematic hardening parameters from experimental data is not well defined and the same is true for the cyclic yield stress. These parameters are interdependent and need optimization, maintaining the same hierarchy of dependence. Evolutionary search algorithms are implemented in nested applications to find the material parameters phenomenologically [16]. The optimum material parameters offer good simulation of the actual material behaviour in cyclic plastic loading.
Many-objective optimization problems (MaOPs) contain four or more conflicting objectives to be optimized. A number of efficient decomposition-based evolutionary algorithms have been developed in recent years to solve them. However, computationally expensive MaOPs have been scarcely investigated. Typically, surrogate-assisted methods have been used in the literature to tackle computationally expensive problems, but such studies have largely focused on problems with 1–3 objectives. An approach called hybrid surrogate-assisted many-objective evolutionary algorithm is presented to solve computationally expensive MaOPs [17]. The key features of the approach include: (1) the use of multiple surrogates to effectively approximate a wide range of objective functions; (2) use of two sets of reference vectors for improved performance on irregular Pareto fronts (PFs); (3) effective use of archive solutions during offspring generation; and (4) a local improvement scheme for generating high-quality infill solutions.
In the swarm intelligence optimization algorithm, each trial solution is compared to an individual with biological characteristics. Therefore, some special biological activity scenarios are used to construct swarm intelligence optimization algorithms. However, the biological activity scenarios that have been proposed for swarm intelligence optimization algorithms are very simple and have weak mathematical foundations, such as genetic algorithm, ant colony algorithm, biogeographic algorithm, and bee colony algorithm. Some swarm intelligence optimization algorithms do not even have biological activity scenarios, such as particle swarm algorithm and differential evolution algorithm. If a swarm intelligence optimization algorithm has a clear and vivid biological activity scene, and the scene can be accurately described by mathematical theory, then this scene is extremely conducive to constructing a swarm intelligence optimization algorithm. Because the swarm intelligence optimization algorithm is based on good mathematics, its performance is easy to be analyzed. The plague infectious disease optimization (PIDO) in this paper is based on such a biological activity scenario.
Plague is a powerful infectious disease transmitted by Yersinia pestis through rodent fleas[18], it has a very high fatality rate. Plague has been three pandemics in human history. It is a natural foci disease that is widespread among wild rodents. In order to control the plague’s hazards, tremendous efforts has been spent in the world, and a large number of mathematical models are built to study the transmission mechanism of the plague. It is mainly manifested in the following four aspects: Differential equations are used to establish the spreading dynamics model of the plague between the rats and human, the model is used to describe the epidemic characteristics of the plague and analyze the relationship between the various parameters in the model and the development of the epidemic [19–22]. Statistical mathematical models are used to study the correlation between natural factors (such as climate, temperature, rainfall.) of the plague foci and rodent density, vector density, plague infection rate and other parameters, and their hysteresis characteristics [23, 24]. The biological characteristics of the plague rat is studied from the aspects of ecological adaptability, reproduction, growth and development, blood biochemistry, hibernation and its own pathogen spectrum, and a plague animal model is established, basis is provided to reveal the pathogenic mechanism, evaluate the vaccine effect, and treat the plague for program selection [25, 26]. Screen out the monitoring indicators that are most relevant to the epidemic of animal plague, construct a forecast and early warning model of plague epidemic in plague foci, these are used to control the large-scale outbreak of plague [27, 28].
When solving the optimization problem, a heuristic search strategy is used in the swarm intelligence optimization algorithm, and a large number of individuals are started to search at the same time. The behavior of individuals and the synergy between individuals have become very important. Individual behavior can be described by operators, and the synergy between individuals is the logical structure of the swarm intelligence optimization algorithm. The PIDO algorithm is based on a time-lag plague infectious disease model with impulse vaccination [18], where the biological meaning of an individual is a human individual in a certain ecosystem. The synergy between individuals is reflected by the transmission mechanism of the plague infectious disease, and the individual’s behavior is reflected by the individual’s random transition between the four states of susceptibility, exposure, disease, and cure.
The PIDO algorithm adopts a different design idea from the existing swarm intelligence algorithm, and the time-delay plague epidemic model of impulse vaccination is transformed into a method that can solve a large number of local optimal solution optimization problems, and the constructed operator can be sufficient reflecting the interaction relationship of the time-delayed plague epidemic model of impulse vaccination, thus the basic idea of the plague epidemic dynamics theory is reflected, the algorithm has global convergence.
Optimal algorithm design method for plague infectious disease
Suppose the optimization problem to be solved is Equation (1):
In the Equation (1), R n is the n-dimensional Euclidean space, n is the total number of real variables which are included in the optimization problem; X = (x1,x2,...,x n ) is an n-dimensional solution vector; f(X) is the objective function, The mathematical expression of f(X) has no restrictions; H is the search space.
Suppose there are N villagers living in a village Z, and each villager is represented by a number as 1,2,...,N; each villager is represented by n features, and one feature is equivalent to a certain organ of the villager, namely for the i-th villager, its characteristic is expressed as (xi,1,xi,2,...,xi,n), i = 1∼N; the plague is prevalent in the village Z, and villagers make effective contact with rats carrying the plague virus, such as being bitten by a rat, eating rat meat, or accidentally eating food contaminated by rat feces, they will be infected with the plague, which will spread among the villagers; the plague virus attacks certain organs of the villagers. Villagers who are infected with the plague are called susceptible. After they are infected with the plague, they will not immediately become ill, and the virus in their bodies enters the incubation period; the villagers who have the plague virus in the incubation period are called as the exposed persons, and they will also pass the virus to other villagers effectively in contact; those exposed after the incubation period will become ill. These villagers are called the sick, and they will pass the virus in their bodies to other villagers who are in effective contact with them; the sick and exposed people can be cured through medical treatment. Those who are cured and exposed are called cured; in order to prevent the plague virus from harming the villagers, the villagers will be vaccinated every once in a while. After vaccination, the villagers will not be 100% successfully immunized; the villagers who are successfully immunized will not be infected with the plague virus for a period of time; the villagers who have not been successfully immunized are still susceptible; the immunity of the successfully immunized villagers will automatically disappear and lose immunity after a period of time; villagers who have not been immunized or have lost immunity will be infected with the plague virus again. Under the influence of the plague virus, the growth status of each villager in the village will switch between the four states of susceptibility, exposure, disease, and cure. This conversion is mapped to the H of the optimization problem Equation (1), which is equivalent to each trial solution jumping from one position to another in H, so the purpose of random search for H is achieved. The physical strength of each villager is determined by the characteristics of the villager. A villager with a strong physique can continue to grow, while a villager with a weak physique stops growing.
The above scene is projected into the search for the global optimal solution of the optimization problem Equation (1), the meaning is as follows:
The H of the optimization problem corresponds to the village Z. A villager in this village corresponds to a tentative solution of the optimization problem Equation (1). The set of tentative solutions corresponding to N villagers is X = {X1,X2,...,X
N
}, X
i
= (xi,1, xi,2 ... ,xi,n), i = 1∼N. A feature j of villager i corresponds to a variable xi,j of solution X
i
. Therefore, the villager i is equivalent to the trial solution X
i
. The physical strength of the villagers is represented by the HHI (human health index, HHI) index, and the HHI index of the villager i is calculated by the following formula (2):
HHI is an index for evaluating the quality of the solution.
For the convenience of discussion, the villagers living in a village are divided into 4 categories: Susceptible (category S): all villagers who are not infected with the plague. If the S category villagers effectively contact the villagers with the plague virus, they may be infected with the plague. Exposed persons (Category E): namely, villagers who have been infected with the plague virus but have not yet developed the disease, and they are potential patients. Those who are sick (Class I): Villagers who have been infected with the plague virus and have become ill. Class I villagers who have effective contact with Class S villagers may transmit the virus to Class S villagers. Cure (category R): the healer of E or I villagers. This group of villagers will not get the disease temporarily, but after a period of time, if they effectively contact the E or I disease villagers, they will return to sick.
The delayed plague infectious disease model with impulse vaccination is shown in formula (3) [18].
S(t) is the proportion of susceptible people at time t; E(t) is the proportion of exposed persons at time t; I(t) is the proportion of sick people at time t; R(t) is the proportion of cure people at time t. In formula (3), t is the period; R(t), I(t), E(t), and S(t) are the proportions of people belonging to R, I, E, and S respectively in period t, and R (t)≤0, I(t)≤0, E(t)≤0, S(t)≤0, R(t) + I(t) + E(t) + S(t) = 1. Others’ parameters are shown in Table 1 [18]. In the table, Rand(A,B) means to generate a uniformly distributed random number in the interval [A,B]; INT(w) means to round the real number w to integer.
Meanings of parameters and method of taking value
At period t, because any person can only be in one of R, I, E, and S, R(t), I(t), E(t), S(t) are actually the probability that a person belongs to R, I, E, or S; when a person belongs to R, I, E, or S, it means that a person is in R state, I state, E state or S state. The following Equations (4–16) are contributed in this paper.
Therefore, Equation (3) can be applied to any person in the crowd, namely:
Equation (4) is used to calculate the probability that each person is in the R state, I state, E state and S state during the period t.
The values of the t parameters b, r, p, q, v, β, and μ are respectively b t , r t , p t , q t , v t , β t , μ t ; for the convenience of calculation, the formula (4) is changed to recursive discrete expression (5):
In Equations (5) and (6), R i (t), I i (t), E i (t), and S i (t) are the probability that individual i belongs to the R, I, E, and S groups, respectively, at period t. R i (t)≤0, I i (t)≤0, E i (t)≤0, S i (t)≤0, R i (t) + I i (t) + E i (t) + S i (t) = 1; The values of parameters b t , r t , p t , q t , v t , β t , μ t , τ i are shown in Table 1.
At period t, randomly generated villagers’ b t , r t , p t , q t , v t , β t , μ t , τ i , and formulas (5) and (6) are used to calculate villagers i’s R i (t), I i (t), E i (t) and S i (t). In the period t, the villager i is in R state, I state, E state and S state. Which of the four states is he in? This is determined by the probability of R i (t), I i (t), E i (t) and S i (t), that is, which of R i (t), I i (t), E i (t) and S i (t) is larger, the probability that the corresponding state is selected is also greater. Table 2 shows the spread of plague virus among villagers.
Transformation of legal states of plague virus transmission
The nine legal state transitions shown in Table 2 can be represented in Fig. 1, where each arc in the figure corresponds to an operator. The 9 legal state transitions shown in Table 2 can be described by 9 operators: S_S, S_E, E_E, E_I, E_R, I_I, I_R, R_R, R_S.
The generation method of the dominant villager set PS
s
: L villagers are randomly selected from the villagers in state s. These villagers have a higher HHI index than the current villager i, forming the dominant villager set PS
s
, s∈{R,I,E,S}; L is called the number of villagers exerting influence. The generation method of category villager set CS
s
: L villagers are randomly selected from the villagers in state s to form category villager set CS
s
, s∈{R,I,E,S}.
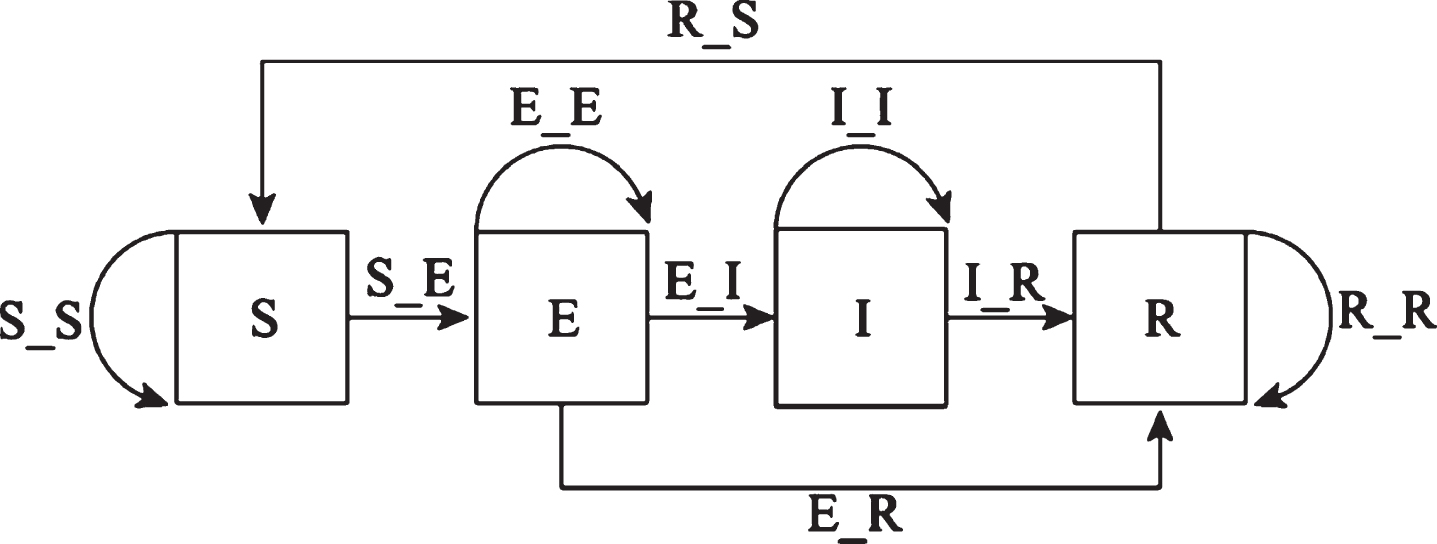
9 legal state transitions.
In formula (16), X i (t) = (xi,1(t),xi,2(t),...,xi,n(t)), V i (t + 1) = (vi,1(t + 1), vi,2(t + 1),...,vi,n(t + 1)). HHI(X i (t)) and HHI(V i (t + 1)) are calculated according to formula (2).
Equations (7)–(15) are the four state transition metrics, that is, the process of each step of the algorithm. Equation (16) is to ensure that each step of the algorithm solution will not be worse than the previous step.
Let t = 0. The number of evolutionary periods G = 8000 ∼60000, the error requirement ɛ= 10–5∼10–10, N = 50∼500, the probability of successful vaccination of villagers Q0 = 0.5∼0.9, the probability of villagers being affected E0 = 1/1000∼1 /100, L = 3∼6, T = 3∼10. Randomly select the trial solution [X1(0), X2(0),..., X
N
(0)] corresponding to N villagers in H. Let V(i) = 0, i = 1∼N. V(i) = 0 means that the vaccination of villager i is unsuccessful or not; V(i) > 0 means that the vaccination of villager i is successful. Randomly select the global optimal solution Y* initial value.
Features of PIDO algorithm
Markov characteristics. From Equations (7) to (15) defined by the operators of S_S, S_E, E_E, E_I, E_R, I_I, I_R, R_R, R_S, etc., any new trial solution X(t + 1) is only related to its state X(t) in period t, and it has nothing to do with its previous evolution to the current state, indicating that the evolution process of PIDO algorithm has Markov characteristics. From the definition of growth operator (16), it is known that the HHI index of any villager in period t + 1 will never be lower than its HHI index in period t, it shows that the evolution process of PIDO algorithm has the characteristic of “not bad step by step".
Time complexity table for PIDO algorithm
Time complexity table for PIDO algorithm
According to PIDO algorithm, the village Z is equivalent to the search space H, and the N villagers {X1 (t) , X2 (t) , . . . , X
N
(t)} in the village are arranged into a sequence Xt1, Xt2,..., XtN. The number of villagers is N, a villager is equivalent to a trial solution, and its objective function value is f(Xti), and the set of the states of all villagers is F:
Without loss of generality, F1 is also desired to make the global optimal solution. From the subscript of formula (17), the set U = {1,2,...,N} can be obtained:
∀i∈U, i is the state that villager i may be in when performing random search. Suppose that the best objective function value found by villager i in period t is F i , and its corresponding state is i. Obviously, from Equation (17), when the villager i searches at time t + 1, if it transitions to a better state k, it should satisfy k < i; on the contrary, if it transitions to a worse state k, it should satisfy k > i, as shown in Fig. 2.

State transition of PIDO algorithm in random search.
∀X∈H, F1≤F(X)≤F
N
, H is divided into subsets:
Let Xi,j(i = 1,2,...,N,j = 1,2,...,|X
i
S
|) denote the j-th state in X
i
S
. During the evolution of the villagers, the transition from one state (i,j) to another state (k,l) can be expressed as Xi,j⟶Xk,l. Assumptions: the transition probability from Xi,j to Xk,l is pij,kl, the transition probability from Xi,j to any state in X
k
S
is pij,k. From any state in X
i
S
to any one of X
k
S
, the transition probability of the state is pi,k, then the following formula:
The proof of lemma (19): suppose state i is the state of villager i in period t, and its corresponding position in H is X
t
. From Section 2.6, the random search process of PIDO algorithm has not bad characteristic of step by step. Therefore, in period t + 1, villager i will not transfer to any worse state, as shown in Fig. 2, with the following formula:
The proof of lemma (20): Suppose state i is the state of villager i at period t. In period t + 1, villager i randomly chooses S_S, S_E, E_E, E_I, E_R, I_I, I_R, R_R, R_S operator to evolve, it is moved to a better state k. At this time, there are two situations as follows: If state i is the global optimal state, i.e. i = 1, the next transition will remain in the original state, i.e. k = i = 1. This is because from Section 2.6, villager i will not move to another state worse than the original state, so they must stay in the original state i with the probability p1,1 = 1. Because p1,1 = 1 > 0, the proposition is proved. If state i is not the global optimal state, there must be at least one intermediate state k between state 1 and current state i, as shown in Fig. 2, making F1≤F
k
< Fi, that is, 1≤k < i, At that time, villager i can move from the current state i to a new and better state k, that is, pi,k > 0. The proposition is proved.
In summary, available ∃k < i, pi,k > 0.
The above matrix is a stable random matrix,
The proof process of Theorem 1 can be found in literature [29].
From Equation (18), the sum of the probabilities of each row in
It can be seen from the above that
Since
The above formula shows that when k⟶∞, pi,1 = 1, i = 1,2,...,N, that is, regardless of the initial state of each villager, it can finally transfer to the global optimal state 1 with probability 1. So there is the formula:
Therefore, PIDO algorithm has global convergence.
The hardware environment is used in the EBDO algorithm test experiment: The CPU is Intel Core™ I5, M520@ 2.40 GHz, the memory is 8 GB, and the operating system is Windows 10. The optimization termination condition has a maximum criterion and a norm criterion. In high-dimensional optimization problems, the norm criterion is used. The greater the adaptability, the better the solution. The method of judging whether the approximate global optimal solution has been obtained is the termination condition of the random algorithm. Within the range of the maximum number of iterations, one of the following conditions can be selected as the termination condition: (1) The maximum fitness value and the average fitness value change little and tend to be stable; (2) The distance between adjacent generation populations is less than the acceptable value. The PlatEMO test platform (https://github.com/BIMK/PlatEMO) is used for testing [30].
Analysis of the influence of the number of villagers on PIDO algorithm performance
The following takes the famous Bump optimization problem and the Michalewicz optimization problem as examples to analyze the performance of PIDO algorithm under different villagers’ number settings. These two optimization problems are very difficult to solve.
Bump optimization problem:
Michalewicz optimization problem:
The PIDO algorithm is used to solve the Bump optimization problem and the Michalewicz optimization problem. The calculation results are shown in Table 4. When calculating, G = 107, ɛ= 10–7, Q0 = 0.9, L = 3, T = 3.
Comparisons of calculation results under different parameter settings
Comparisons of calculation results under different parameter settings
It can be seen from Table 4: When N increases, the CPU time consumed greatly increases. For a given n, if N increases, the CPU consumption time also increases greatly, but the accuracy of the average optimal objective function value increases at the same time. For a given n and N, if E0 increases, the accuracy of the average optimal target function value also increases, but the CPU consumed time may increase or decrease.
Therefore, if n > 500, N = 100∼200 is sufficient; if n < 500, N = 200 is sufficient.
In this paper, six benchmark function optimization problems provided by the internationally universal intelligent optimization algorithm test package CEC2019 [31] are used to test the performance of the PIDO algorithm, as shown in Table 5. The test includes 28 well-designed benchmark function optimization problems.
6 benchmark function optimization problems
6 benchmark function optimization problems
In Table 5, O is the theoretical global optimal solution that can be set arbitrarily. The theoretical global optimal solutions of F14, F25, and F28 have not yet been found. The global optimal objective function value in Table 5 is the best objective function value found by the algorithm so far. In this paper, PIDO algorithm is used to solve the 6 function optimization problems in Table 5. The parameters are N = 200, n = 50, G = 107, ɛ=10–7, Q0 = 0.9, E0 = 0.01, L = 3, T = 3. The seven intelligent optimization algorithms compared with PIDO algorithm are all selected from the algorithms published in recent international journals. These algorithms are shown in Table 6, namely RCGA (real-coded genetic algorithm), DASA (differential ant-stigmergy algorithm), NP -PSO (non-parametric particle swarm optimization), MpBBO (metropolis biogeography-based optimization), MDE-LiGO (modified differential evolution with locality induced genetic operators), SLADE (symmetric Latin-based adaptive differential evolution), ABC (artificial bee colony) algorithm). The termination conditions for these seven algorithms are: evolutionary algebra G = 107 or optimal solution error ɛ= 10–7.
Parameters setting of compared intelligent optimization algorithms
The meaning of each parameter in Table 6 can be found in related literature. Aiming at the 6 optimization problems listed in Table 5, PIDO algorithm and the 7 algorithms listed in Table 6 are used to solve them, and each algorithm is solved 51 times independently. Table 7 shows the average, standard deviation, median, minimum, maximum, and fitness evaluation times of the optimal objective function values obtained by the eight algorithms.
Optimal solutions obtained by 8 compared algorithms
Note: The color word indicates that the global theoretical optimal solution has been reached.
Overall ranking 1 is the ranking of these algorithms based on the average optimal objective function value, and overall ranking 2 is the ranking of these algorithms based on the average optimal objective function value and the number of fitness evaluations. Final overall ranking 1 and final overall ranking 2 are based on rankings based on overall ranking 1 and overall ranking 2, respectively.
The non-parametric Friedman test [32, 33] is a non-parametric test based on the results obtained from the PIDO algorithm and the results obtained from the seven compared algorithms. The results of the Friedman test are shown in Table 8. Significance = 1 means that PIDO algorithm performance is 99% statistically different from the compared algorithm, and significance = 0 means that there is no significant difference. In Table 8, the number of cases with significance = 1 and the number of cases with significance = 0 respectively represent the number of the PIDO algorithm and the seven compared algorithms that are significantly different and not significantly different from the number of benchmark function optimization problems.
Results comparison of Friedman test (α= 0.01)
It can be seen from Table 7 that PIDO, RCGA, DASA, NP-PSO, MpBBO, MDE-LiGO, SLADE, ABC are sorted according to the accuracy of the average optimal objective function value and the results are as follows: PIDO > SLADE = MDE-LiGO > ABC > NP-PSO > DASA > RCGA > MpBBO
The results of sorting according to the average optimal objective function value and the number of fitness evaluations are as follows: PIDO > MDE-LiGO > SLADE > ABC > NP-PSO > DASA > RCGA > MpBBO
It can be seen from Table 8 that the total number of significant cases for the PIDO algorithm to solve the 6 benchmark function optimization problems is 39, which is significantly larger than the total number of insignificant cases of 3, indicating that the performance of PIDO algorithm is significantly better than that of the seven compared algorithms.
Figure 3 (a)∼Fig. 3 (f) illustrate the sample convergence curve of PIDO, RCGA, DASA, NPPSO, MpBBO, MDE-LiGO, SLADE, ABC algorithm to solve the 6 benchmark function optimization problems in Table 5, where the level and the vertical axis adopts a logarithmic scale. It can be seen from Fig. 3 and Table 7 that when PIDO algorithm solves the 6 benchmark function optimization problems, it can find the best global optimal solution. From a comprehensive point of view, the comprehensive performance of PIDO algorithm is better than that of the seven compared algorithms, indicating that it has high solution accuracy and fast calculation speed.
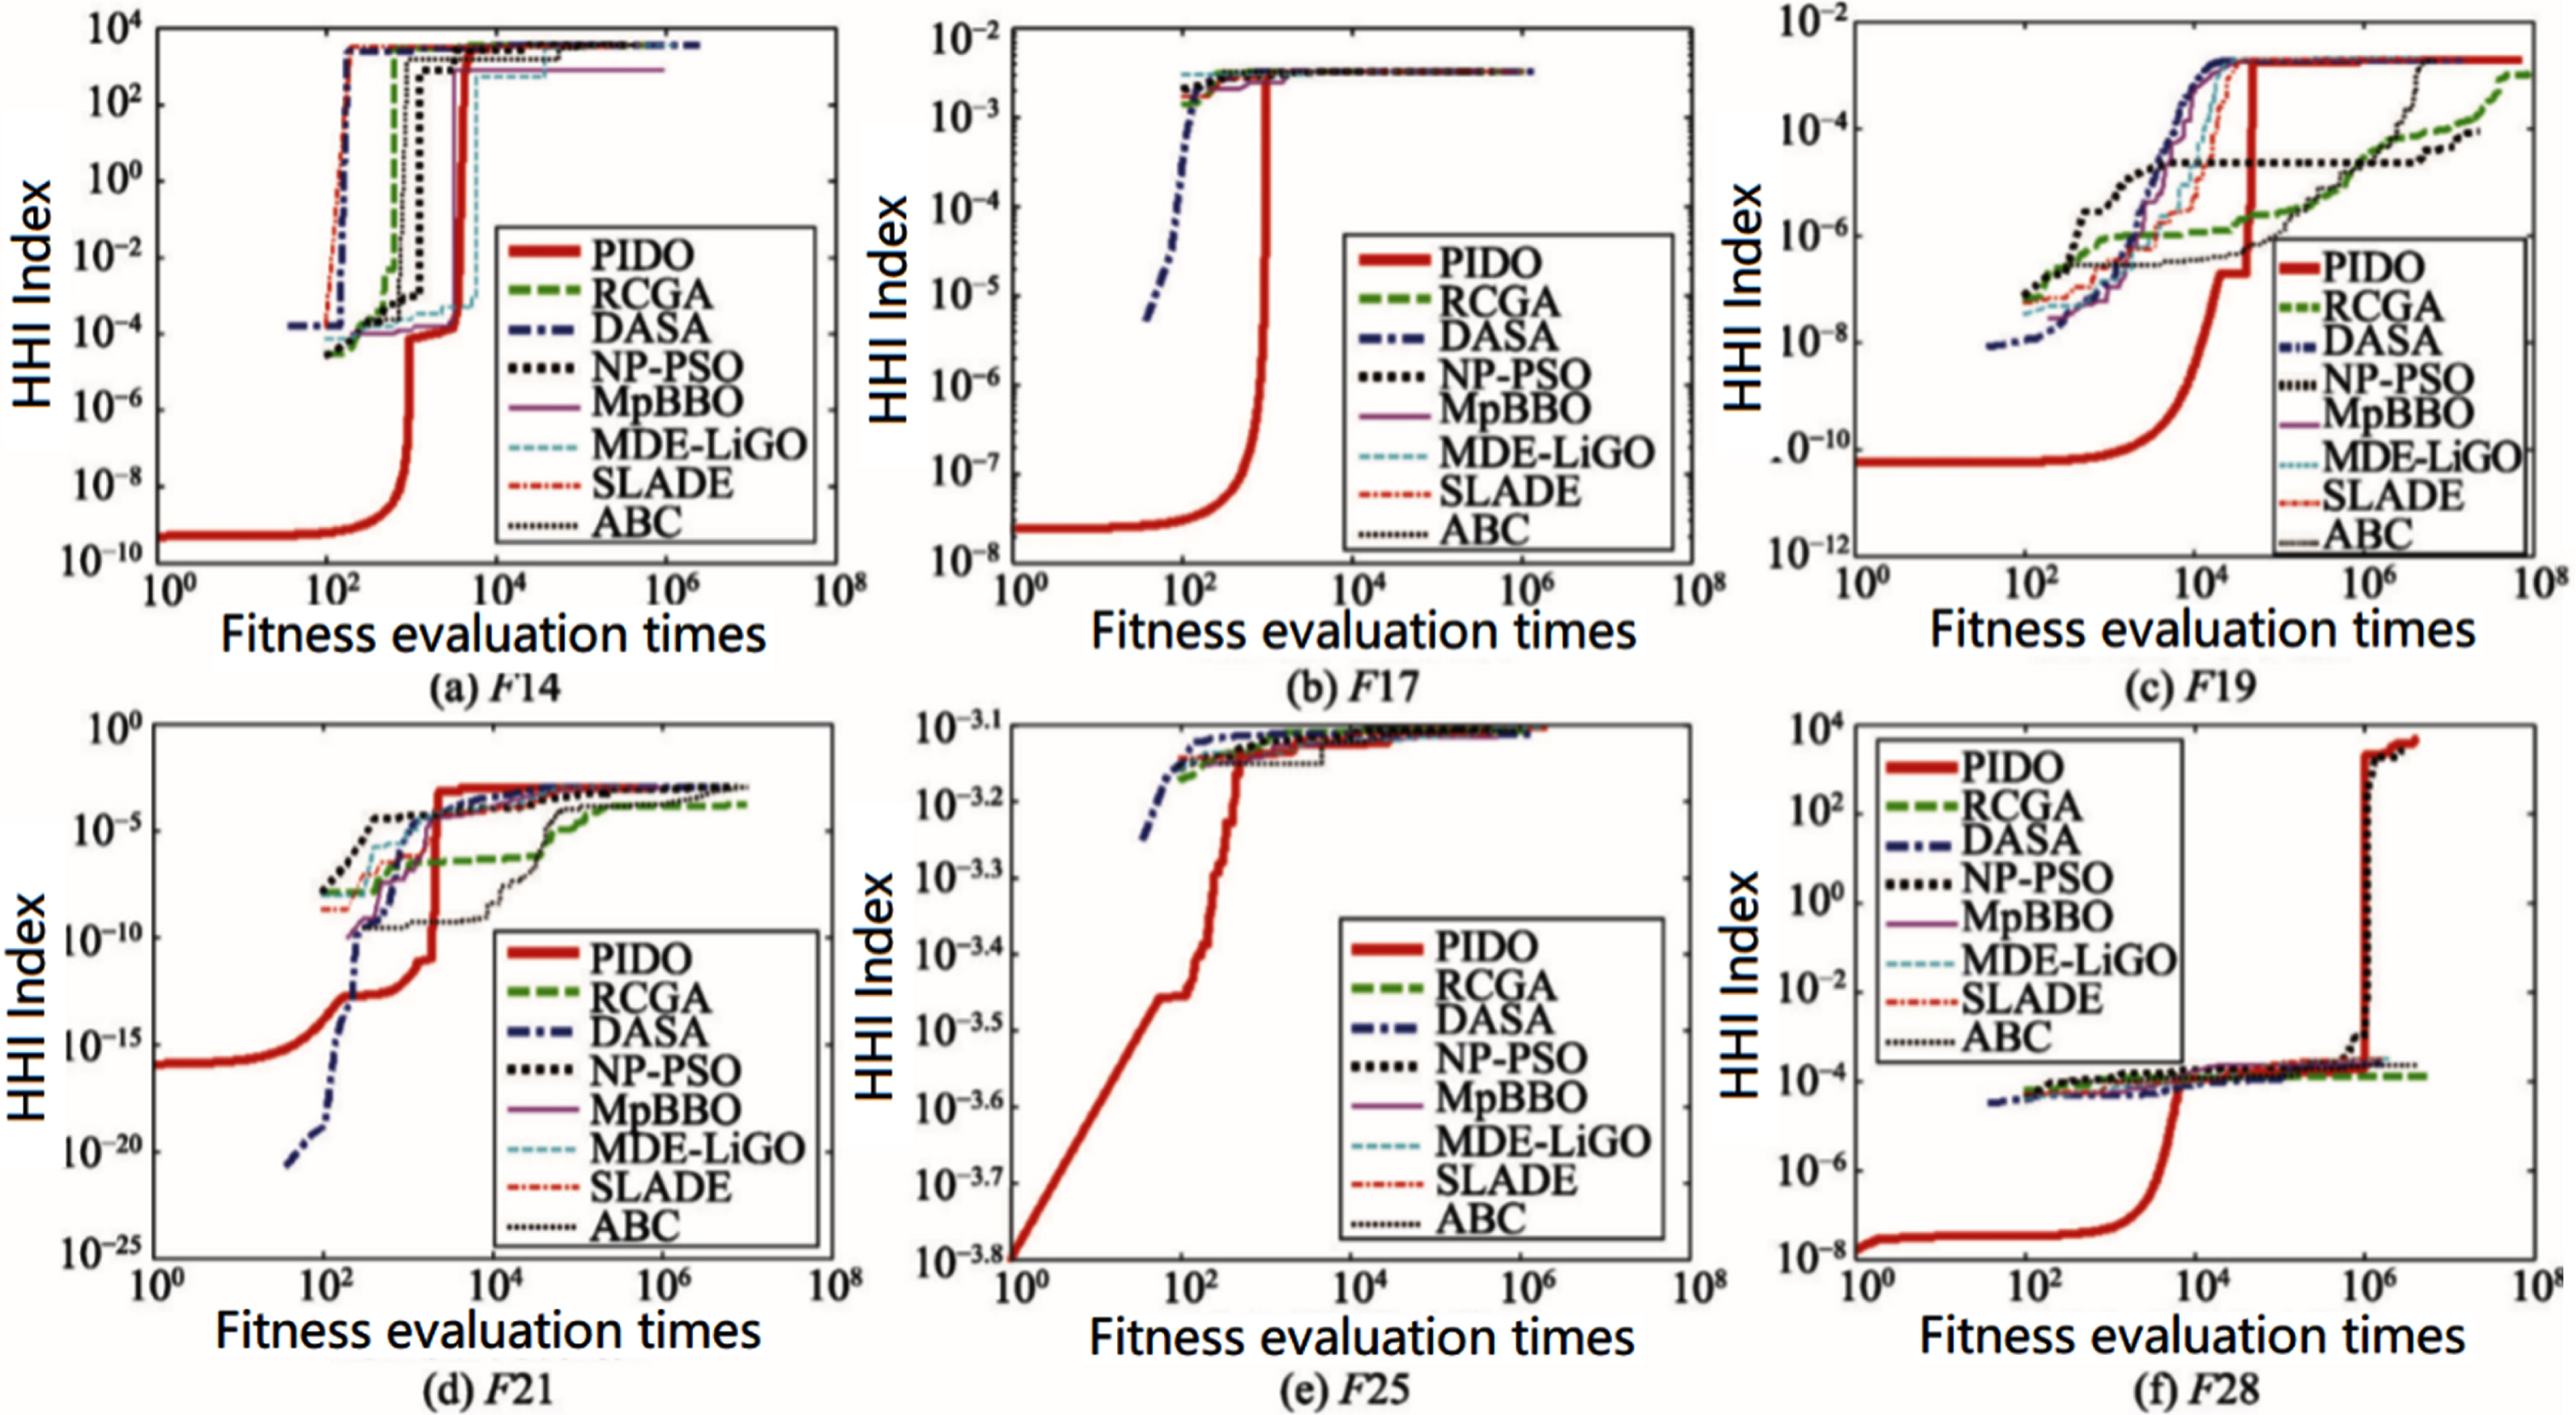
Convergence curves of samples.
Three real-world engineering design optimization problems ie, a 3-objective car impact (CSI) problem [34], a 5-objective water resource management (WRM) problem [35] and a 10-objective general avaition aircraft (GAA) problem [36] are solved.
Inverted generational distance (IGD) [37] is used as the metrics for benchmarking. The reference sets for IGD calculation are obtained from the PlatEMO framework. For the engineering design problems, the reference sets have been taken from [38]. Performance of the proposed algorithm is compared with cK-RVEA1 (the best performing approach reported in [39]) on constrained engineering design problems. The statistics of the IGD metric across 25 independent runs are presented in Table 9. Here, ↑, ↓ and ≈ are indicates whether the proposed algorithm is statistically better, worse and equivalent to cK-RVEA1. From Table 9, it can be observed that the proposed method comprehensively outperforms cK-RVEA1 in the problem instances.
Test results for IGD metric obtained by the proposed method and cK-RVEA1 for constrained engineering problems
Test results for IGD metric obtained by the proposed method and cK-RVEA1 for constrained engineering problems
In this paper, the method in [40] is used to analyze the balance between the local and global optimization capabilities of PIDO algorithm. The penetration behavior is used to illustrate the global optimization capability of the PIDO algorithm, and the expansion behavior is used to illustrate the local optimization capability of the PIDO algorithm.
Figure 4 shows the coordination relationship between penetration and expansion behaviors in the time intervals [0,694] and [0,966] when the PIDO algorithm solves the benchmark optimization problem F3 [31]. It can be seen from Fig. 4 that the penetration behavior is dominant from 0 s to 120 s, and the expansion behavior is dominant after 120 s.
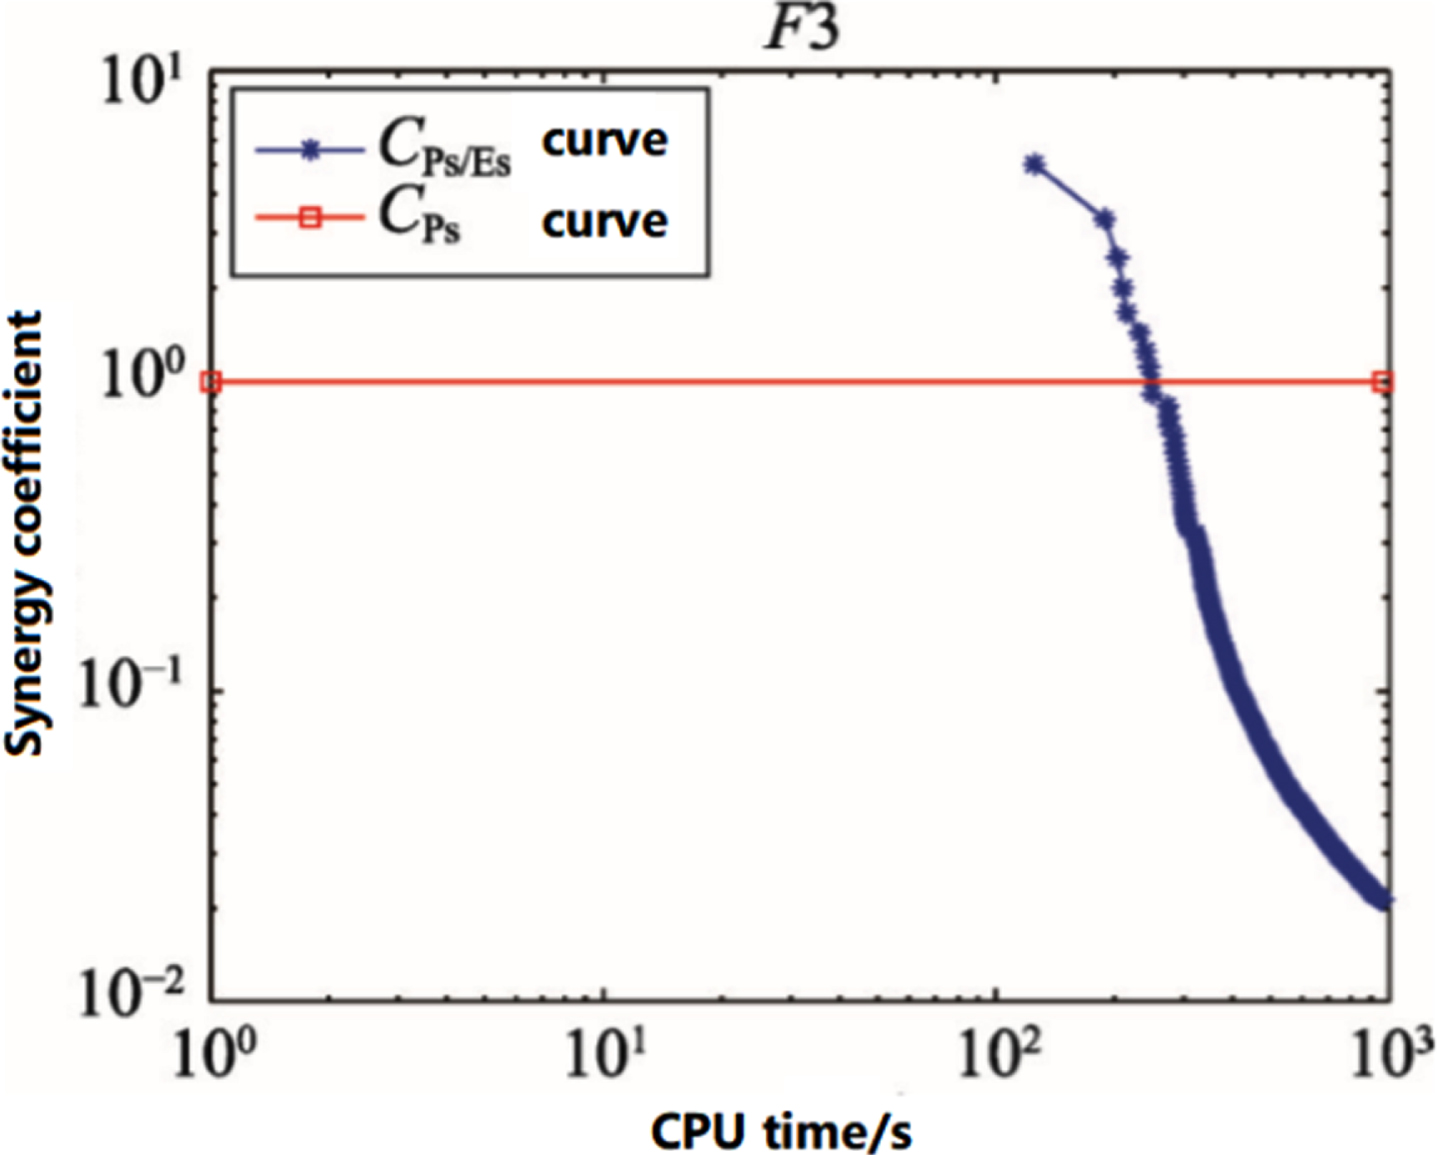
Coordination of penetration and expansion behavior.
Figure 5 illustrates the coordination between the expansion and sticky behaviors in the time intervals [0,694] and [0,966] when the PIDO algorithm solves F3. It can be seen from Fig. 5 that the expansion behavior is always dominant, and the sticky behavior is not dominant at all, but the dominance of the expansion behavior decreases with the passage of time; on the contrary, the number of occurrences of the sticky behavior increases with time.
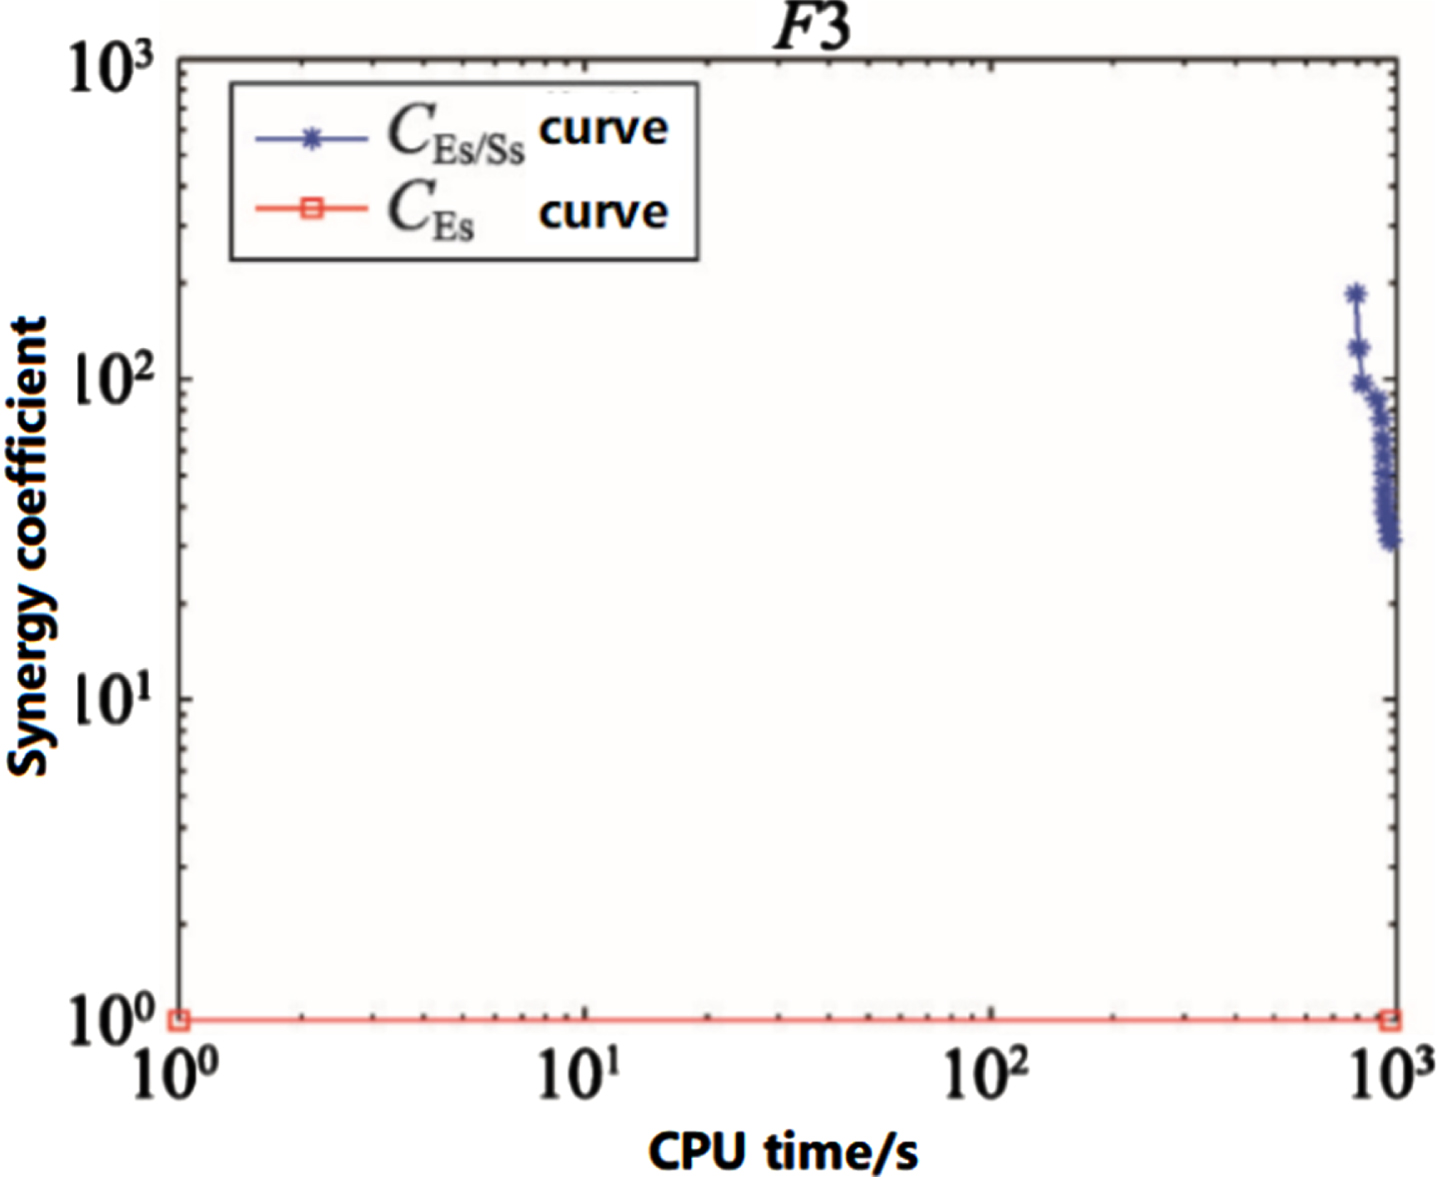
Coordination of expansion and stickiness behavior.
In order to solve some optimization problems with multi-local optimal solutions, a plague infectious disease optimization (PIDO) algorithm is proposed by using a dynamic model of plague epidemic with impulse vaccination and time delay. The approach includes constraint handling which is often overlooked in contemporary algorithms. The performance of the approach is benchmarked extensively on a set of unconstrained and constrained problems with regular and irregular PFs (Pareto fronts). A statistical comparison with the existing techniques highlights the efficacy and potential of the approach. Pareto frontier analysis, the pareto frontier is the solution closest to the true value in the feasible region of the pareto. The solution requires: (1) The distribution is as uniform as possible; (2) The more within a certain range, the better. There are two ways to solve the feasible solution of pareto: (1) According to the importance of the constraint function, it is weighted to synthesize a single function (sometimes with a penalty factor) to solve it. (2) Using some common evolutionary algorithms (EA) to solve the problem, the current common There are GA, PSO, etc. The algorithm idea here has Pareto optimal characteristics. It refers to an ideal state of resource allocation. Assuming that an inherent group of people and allocable resources change from one state of distribution to another, without making anyone worse off, at least a person becomes better, this is Pareto improvement or Pareto optimization. Improving economic efficiency means reducing waste. If no one in the economy can make his own situation better without making others worse off, then this state has reached the optimal allocation of resources. The efficiency defined in this way is called the Pareto optimal efficiency. In other words, if a person can improve his own situation without harming the interests of others, he has achieved a Pareto improvement in resource allocation.
There are the following characteristics in PIDO: PIDO algorithm includes 9 operators such as S_S, S_E, E_E, E_I, E_R, I_I, I_R, R_R, R_S, etc. These operators can significantly increase the search capability of the algorithm. The random method is used to select the parameters of the plague epidemic model in PIDO algorithm and the relevant parameters in each operator, which can not only make the model better express the actual situation, but also greatly reduce the number of input parameters. The operators S_S, S_E, E_E, E_I, E_R, I_I, I_R, R_R, R_S in the PIDO algorithm are constructed by using the plague epidemic model, and they do not need to be related to the problem to be solved, so the PIDO algorithm is universal. In PIDO algorithm, the operators S_S, E_E, I_I, and R_R can enable villagers with high HHI index to transmit strong feature information to villagers with low HHI index, so that the latter can develop in a good direction. Operators S_E, E_I, E_R, I_R and R_S not only enable villagers in different states to exchange information, but also enable villagers to obtain the processed characteristic information of other villagers, reducing the probability of villagers falling into local optimal traps, thereby increasing PIDO Algorithm’s local exploitation ability. Pulse vaccination has the characteristic of making villagers jump out of the local optimal trap. Therefore, PIDO algorithm can realize information exchange between villagers from multiple angles, which is meaningful to improve the exploration ability of PIDO algorithm. When the PIDO algorithm is used for evolutionary calculation, since only a small part of the villagers’ features are attacked by the plague virus, each time the villagers exchange information, only a small part of the features participate in the calculation, so when solving the optimization of higher dimensionality, the convergence speed of PIDO algorithm can be significantly improved, and PIDO algorithm is suitable for solving optimization problems with higher dimensions. The evolution process of PIDO algorithm has Markov characteristics and “not bad at every step” characteristics, so as to ensure that the algorithm has global convergence.
The future improvement directions of the PIDO algorithm are as follows: The plague infectious disease dynamic model is used to optimize the relevant parameters of PIDO algorithm to make these parameter settings more reasonable. In-depth study of the dynamic characteristics of operators such as S_S, S_E, E_E, E_I, E_R, I_I, I_R, R_R, R_S, etc. In-depth study of the dynamic characteristics of the villagers in the process of PIDO algorithm solving.
Footnotes
Acknowledgments
This work was supported by the Scientific Research Project (NO.20B337) of Hunan Provincial Education Department, China & Hunan Natural Science Foundation (Grant No: 2019JJ40154), Hunan Province, China.