
Abstract
Neural networks can approximate data because of owning many compact non-linear layers. In high-dimensional space, due to the curse of dimensionality, data distribution becomes sparse, causing that it is difficulty to provide sufficient information. Hence, the task becomes even harder if neural networks approximate data in high-dimensional space. To address this issue, according to the Lipschitz condition, the two deviations, i.e., the deviation of the neural networks trained using high-dimensional functions, and the deviation of high-dimensional functions approximation data, are derived. This purpose of doing this is to improve the ability of approximation high-dimensional space using neural networks. Experimental results show that the neural networks trained using high-dimensional functions outperforms that of using data in the capability of approximation data in high-dimensional space. We find that the neural networks trained using high-dimensional functions more suitable for high-dimensional space than that of using data, so that there is no need to retain sufficient data for neural networks training. Our findings suggests that in high-dimensional space, by tuning hidden layers of neural networks, this is hard to have substantial positive effects on improving precision of approximation data.
Introduction
Neural networks have ability of approximation both data and the internal linear representation of nonlinear system [1–3], since they possess many non-linearity layers to represent highly nonlinear complex mapping [4, 5]. Although neural networks have excellent approximation capability, they become quite difficult to approximate data in high-dimensional space. Because the “curse of dimensionality” is a big trap for models and methods, causing their inefficiencies and low precision [6].
Data resided inside high-dimensional space gets more sparse as dimensionality goes up. The instability and over-fitting of model are easy to be caused by sparse data [7]. Obviously, it is a hard task to eliminate data sparsity effects while analyzing data. To handle data sparse caused by the curse of dimensionality, Taylor expansion is used to deal with data in high-dimensional space [8]. During approximation data, the precision of solution is hard to be sufficiently considered by Taylor expansion.
Using good neural networks to deal with data has more advantages than that of using other models [9]. However, in extremely sparse or high-dimensional space, a neural network approximates nonlinear data, whose measured outputs are easily perturbed by stochastic disturbances [10], thereby generating the larger approximation error. For instance, in [11], to improve the precision of approximation, the neural network adding the Kachmazh’s algorithm (hybrid network) is used for medical data approximation, instead of direct using a single neural network. Although the introduction of the Kachmazh’s algorithm increases the complexity of the neural network training, the approximated precision is guaranteed. Similarly, it has been shown in [12] that to reduce approximation error, the neural network merging convex functions is used to approach the data of a diet for a patient with type-2 diabetes. Beyond that, to approximate high-dimensional data, the methods that project the data first into a lower dimension and then build the neural network approximation over this lower dimensional projection data space are usually selected [13], rather than direct approximation high-dimensional data using neural networks. Overall, it can see from these studied results that this is a hard challenge to train a neural network of being suitable for high-dimensional space, so that the trained neural network approximates high-dimensional data in high quality.
High-dimensional functions act as an useful tool in complex engineering or multi-dimensional data analysis, such as, analysis multi-sensor data [14], calculation the risk associated with complex investment portfolios [15], approximation over high-dimensional data (e.g., data with more than 10 dimensions, and possibly with 100 dimensions or even higher) [16, 17]. In high-dimensional space, definition high-dimensional functions of approximation data means that these approximation error are also large as the amount of data is large [18], so that high-dimensional functions suffer from serious negative effects when they directly approach data. Although this is not easy to approach directly data in high-dimensional space using high-dimensional functions, we can approach data in high-dimensional space through the neural networks trained using high-dimensional functions. This is because neural networks can theoretically approximate any finite-dimensional continuous function uniformly on compact sets arbitrarily well [19, 20], allowing researchers not to do beforehand any hypothesis [21]. Furthermore, universal approximation capability of neural networks also states that any continuous function defined on a closed set can be uniformly approximated to an arbitrary degree of accuracy using neural networks [22].
Related studies as regards the approximation capacity of neural networks using functions are presented in [23–27]. Their approaches use polynomials to approximate functions and then approximate these polynomials by neural networks. Smooth functions are approximated reasonably well by using polynomials, meanwhile, neural networks are known to be able to approximate monomials in high quality[23–27]. In addition, function approximation theory incorporates into neural networks, the training process and the precision of network adaptation are controlled well by using the order of polynomials [28]. For example, in [29], the capability of approximation any high-order function using neural networks is fully verified, showing that the approximation error is lower. Zahra [30] solves the drawbacks both the slow convergence of first-order learning algorithms and inverse hessian calculation of second-order learning algorithms using multi-layer neural networks approximation function. To induce both the best approximation performance and the most stable internal state of neural networks, the Gaussian function is adopted during the adaptive adjustment of neural networks [31]. As a result, it can be seen that this is valuable to study neural networks to approximate high-dimensional functions.
In this work, our primary goal is approximation data in high-dimensional space by neural networks. However, we aim at proving that in high-dimensional space, the neural networks trained using high-dimensional functions outperform that of trained using data in terms of approximation ability. More importantly, we look at demonstrating that as long as the neural networks trained by high-dimensional functions are sufficiently good, so there is no need to retain sufficient data for neural networks training. Consequently, to ensure that the neural networks trained using high-dimensional functions are suitable for high-dimensional space, we derived the two deviation, i.e., the deviation of the neural networks trained using high-dimensional functions, and the deviation of high-dimensional functions approximation data. The further meaning for the two deviations are that they provide a reference for neural networks training and approximation data in high-dimensional space.
We summarize the main contributions of this work as follows: To train the neural networks of being suitable for approximation high-dimensional space, the two deviations, i.e., the deviation of the neural networks trained using high-dimensional functions, and the deviation of high-dimensional functions approximation data, were derived. The neural networks trained using high-dimensional functions are more suitable for high-dimensional space than that of using data, so that there is no need to retain sufficient data for neural networks training. In high-dimensional space, by tuning hidden layers of neural networks, this is hard to have substantial positive effects on improving precision of approximation data.
Theory
In Section 2.1, several formal definitions are firstly given in order to detailed description our approach. Then, we review the Lipschitz condition of being beneficial to derive the two deviations. In Section 2.2, the proposed method is described. Firstly, the two deviations are derived. Then, we explain the role and selection of candidate functions. This purpose is to provide some suggests for exploring high-dimensional functions.
Preliminary
Some formal definitions in this work are firstly given. Symbols of appearing and their meaning in the theory are listed in Table 1.
Table1 Symbol table
Table1 Symbol table
Before deriving the two deviations, the Lipschitz condition and related lemmas are given.
Lipschitz condition. As for f(x) defined on the domain D, there is a constant k, and k > 0. For any x1∈ D and x2∈ D, this is true |f(x1)-f(x2)|≤k|x1-x2|. So, f(x) satisfies the Lipschitz condition on the domain D, where, k is the Lipschitz constant. If the |f(x1)-f(x2)|≤k|x1-x2| m holds, f(x) satisfies the m-order Lipschitz condition on the domain D.
A. Two deviations
Let us assume that f
t
is Lipschitz smooth with respect to the Euclidean norm, for any x1 and x2, which means that
Equation (10) indicates that the deviation of f t approximation data in high-dimensional space should not be defined as strictly greater than that of f n # trained using f t . Overall, Equations (2) and (10) are the two deviations.
Next following, we discuss the item Δ in Theorem 1. Let Δ depend on the distances between pairs of points within the Ω, i.e., let the range of Δ maintains within the range of distances between points within Ω. The advantage of doing this is that Δ can trade-off the data region of s . tx i ∈Ω covered in Ω based on the position of pairs points in Ω. Certainly, here has many measurement approaches in regard to the distances between pairs of points in Ω, e.g., Hausdorff metric, Riemann metric, etc.
The Gaussian function in [18] is adapted as a candidate function. m is data dimensionality, having
Noting that there are many ways to opt for candidate functions, e.g., higher-order function, etc. In this research, we do not conduct the comparisons between different way of candidate function selection. Because that is not what we are focused on in this work. Nevertheless, the value of candidate functions is to provide a valid way of verifying our approach.
In this section, a neural network is developed to verify our approach. For the proposed neural network, we do not more focus on their architectures, since it is just used to verify the proposed method. Further meaning, we more hope that the proposed method fits universal neural networks, not limited to a specific neural network architecture. In section 3.1, the architecture and hyper-parameters of the proposed neural network are given. In section 3.2, the training and testing of the proposed neural network are described.
Architecture and hyper-parameters
The designed neural network owned two hidden-layers, namely NN-Tt, is as shown in Fig. 1. It can be seen in Fig. 1 that the second deviation, i.e.,
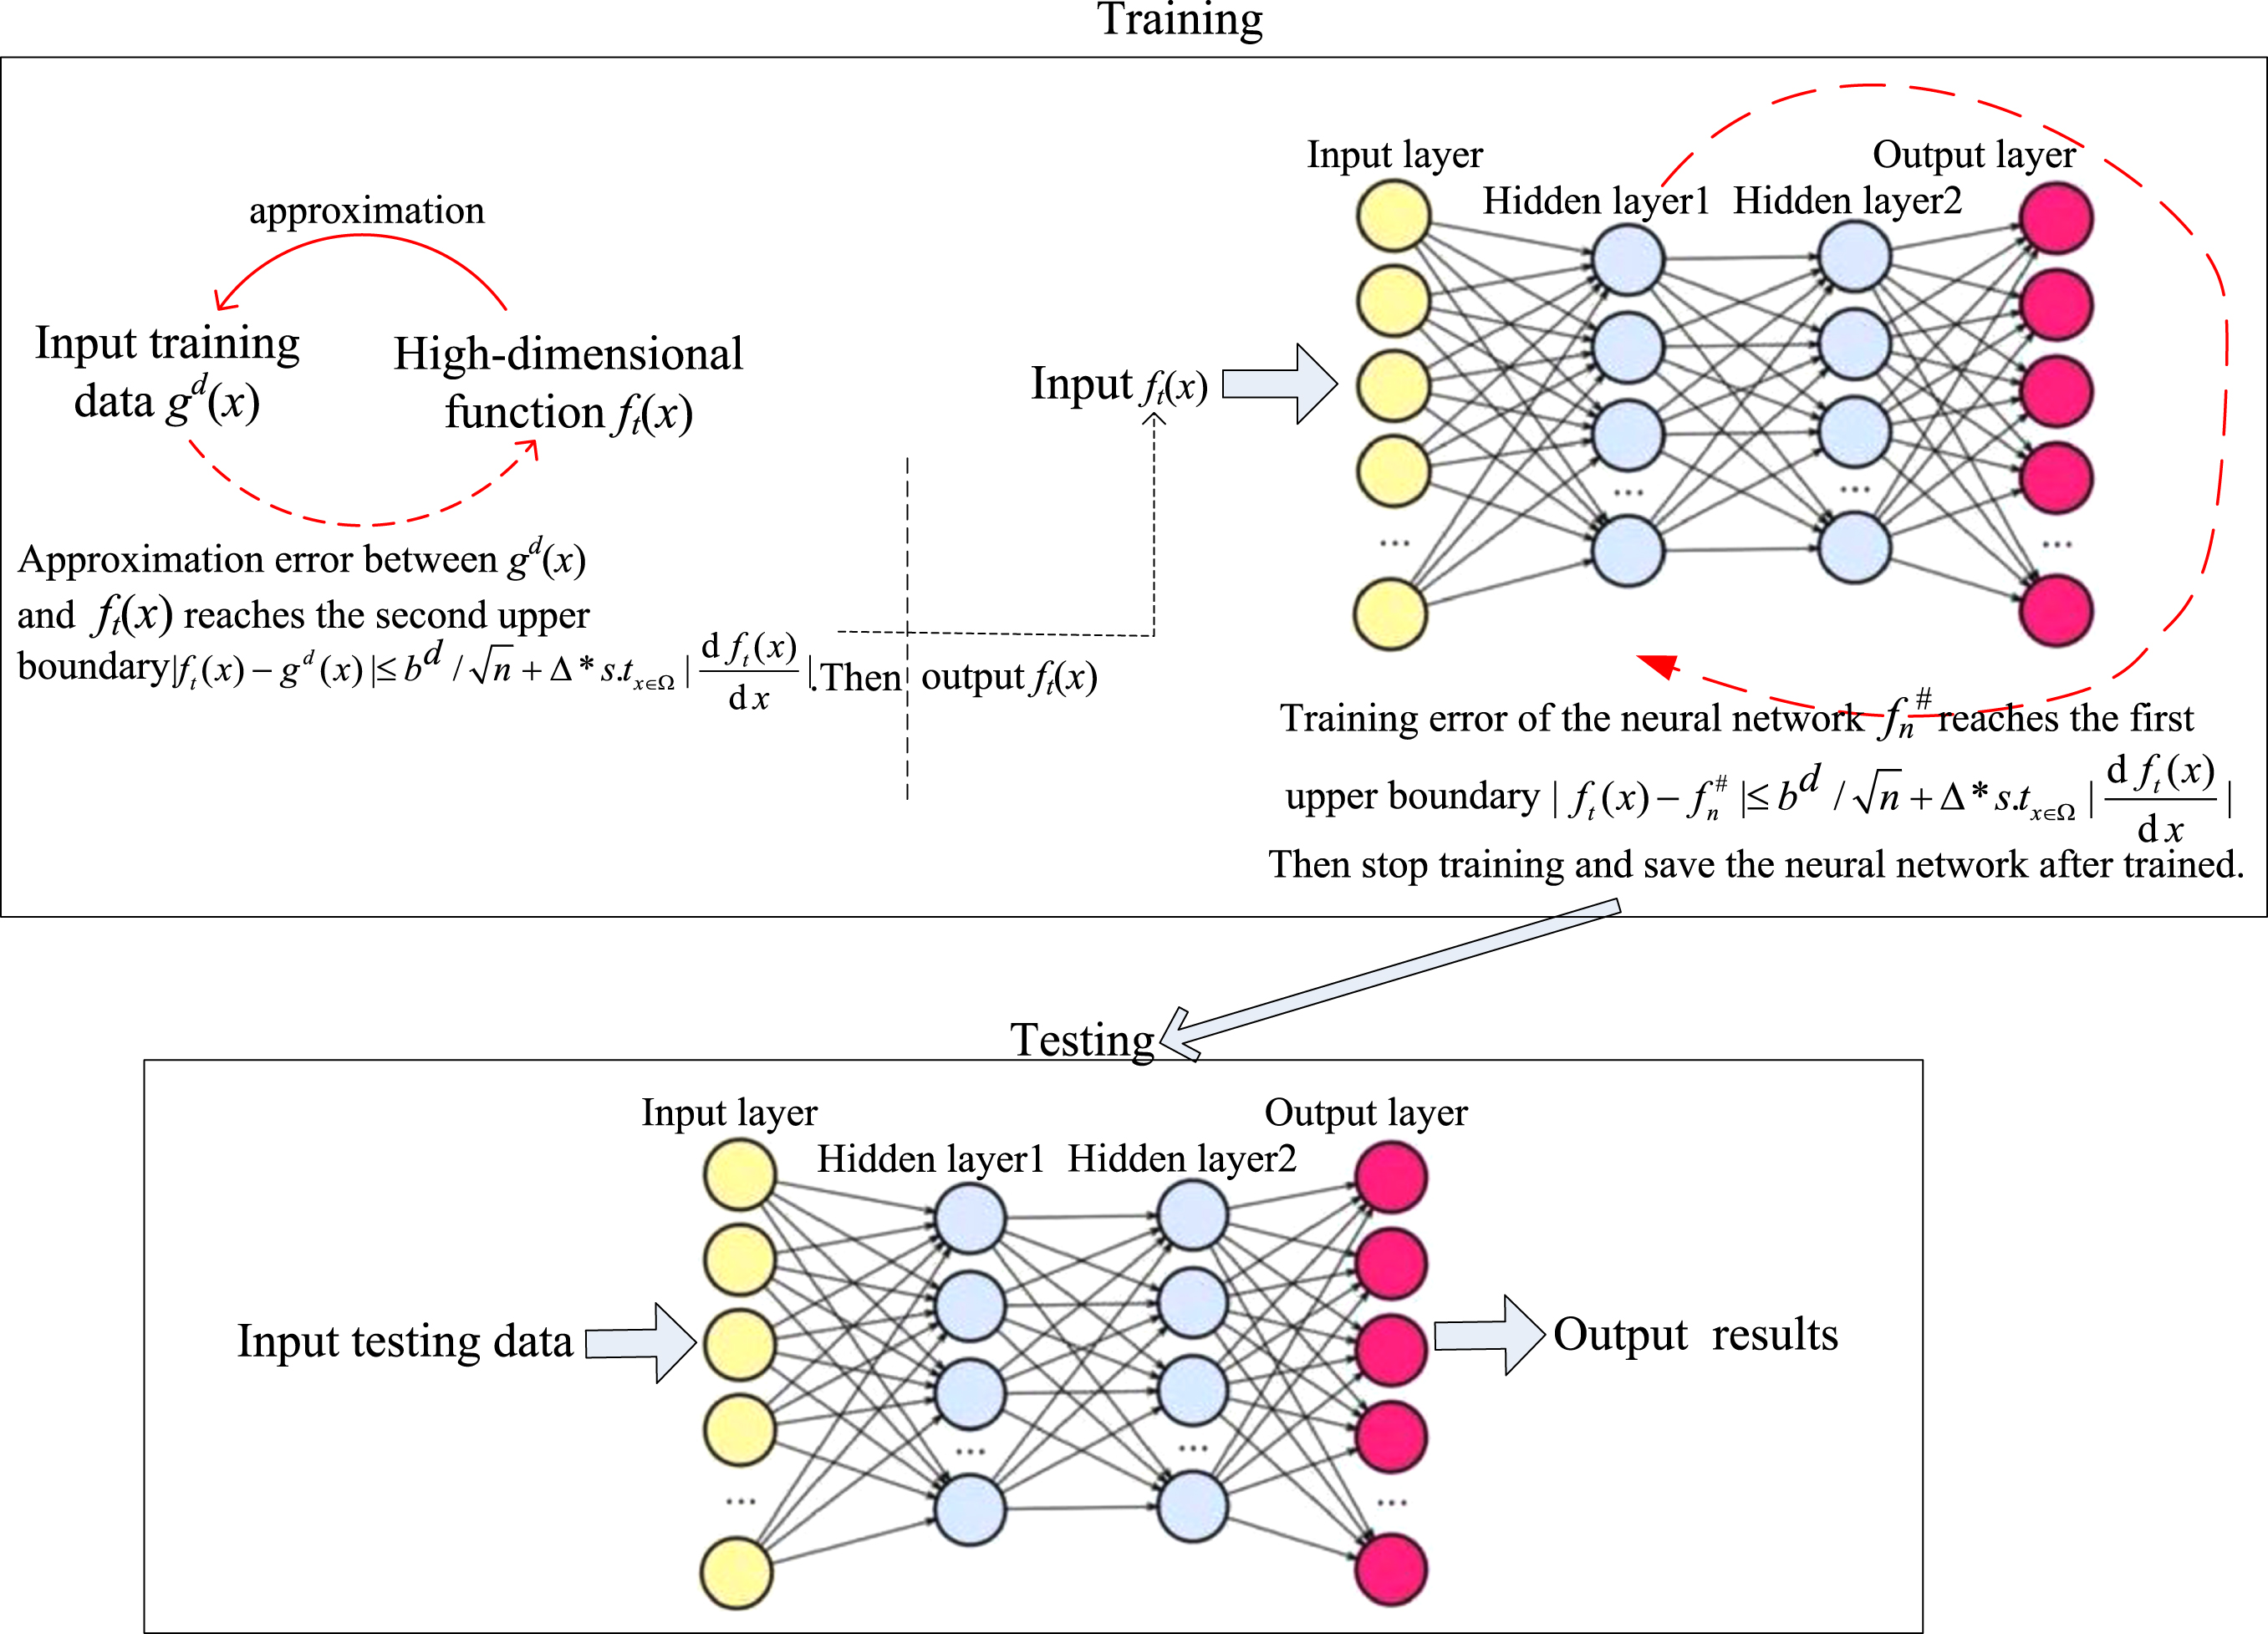
Architectures of the proposed neural network.
Activation function ReLu, i.e.,
All datasets (see Section 4.4 for detail) are into two parts, i.e., training dataset and test dataset. In the same dataset, 80% of the data is randomly chosen as training dataset for training, the left 20% of data is then used as test sample for testing.
Training. The high-dimensional function f
t
(x) approximates the inputting data g
d
(x), until the approximation error between f
t
(x) and g
d
(x) is lower than the
Training algorithm
Training algorithm
Testing. After completing NN-Tt training, the ability of approximation data in high-dimensional space is testing by using testing datasets.
In Section 4.1, to evaluate the precision of neural networks approximation high-dimensional data, assessments metrics are given. In addition, we also analyze the statistical significance of the difference between the proposed neural network and the competitor using t-test. In Section 4.2, the competitor and its parameters are presented. In Section 4.3, assessment metric of data sparsity is also given to quantify data sparsity. In Section 4.4, from the three perspective of data sparsity, high dimensionality and data volume, 8 synthetic datasets are generated, as well as 4 real-world datasets are selected.
Assessment metrics
The receiver operating characteristic curve (ROC) and corresponding area under curve (AUC) are used to assess the accuracy of approximation high-dimensional data using neural networks. In addition, mean square error (mse) and standard deviation (sd) are applied to analyze the approximation error. The calculation formulas of mse and sd are as follows.
Compared the proposed NN-Tt with the feed-forward Neural Network (NN) [34] owned five hidden-layers, in order to address a fair comparison and to achieve a convincing conclusion, the same activation function (see section 3.1) is used for the NN-Tt and NN. As for NN-Tt and NN, the number of neurons in each hidden unit is 50, respectively. Given that data dimensionality and data volume, the number of neurons is considered to be sufficiently large, but not too large. Unless otherwise stated, the NN-Tt and NN ran on a GPU using the same default hyper-parameters, e.g., regularization parameter, learning rate, etc.
Data sparsity assessment
Through calculating the relationship between norm-1 and norm-2, Patrik [35] quantifies data sparsity. In this work, data sparsity is calculated using the formula given by Patrik, having that
Several high-dimensional synthetic datasets and high-dimensional real-world datasets are considered. As for the synthetic datasets, we consider three different aspects, the first one is data volume. Then, the last two aspects are data dimensionality and data sparsity, which are used to discuss the capability of approximation high-dimensional sparse data using NN and NN-Tt. Based on this, the 8 synthetic datasets (generated method refers to [36]) are generated. In the case of a fixed data volume and dimensionality, data sparsity gradually augments from 0.6 to 0.97 (calculation of data sparsity refers to Equation (13)).
For the real-world datasets, the 4 sparse high-dimensional datasets (http://archive.ics.uci.edu/ml/) are selected. Details of the 8 synthetic datasets and the 4 real-world datasets are listed in Table 3.
Description of the synthetic and real-word datasets
Description of the synthetic and real-word datasets
Experimental results, including mse, sd and the precision performance, are presented in this section. We also analyzed the experimental results with statistical significance of test dataset by of t-test (p-value<0.05 for mse).
All experimental results show that the approximation performance of NN-Tt is significantly better than that of NN in all considered cases. These results do not show in general a difference between the ability of approximation data in high-dimensional space for NN-Tt and NN. Hence, these together confirm our expectation that in high-dimensional space, the neural networks trained using high-dimensional functions suffer less negative effects of data sparsity during approximation data than the neural networks trained using data. Section down below detailed the experimental results.
Experiments on synthetic datasets
The results show that the mse and sd gotten by NN-Tt all are lower than that of obtained by NN in Table 4. These statistical results in Table 4 do not indicate in general a difference between the accuracy of approximation high-dimensional data as for the proposed NN-Tt and the competitor NN. To intuitively clarify this process, we visualized the results on the 8 synthetic datasets for NN-Tt and NN in Fig. 2. The accuracy of approximation data using NN-Tt and NN are displayed in Fig. 3.
Results of mse and sd on synthetic datasets. mse for t-test (p < 0.05). The experiments were carried out independently 500 times. mse, {sd}. mse, {sd}. [Significant at p-values for t-test]
Results of mse and sd on synthetic datasets. mse for t-test (p < 0.05). The experiments were carried out independently 500 times. mse, {sd}. mse, {sd}. [Significant at p-values for t-test]
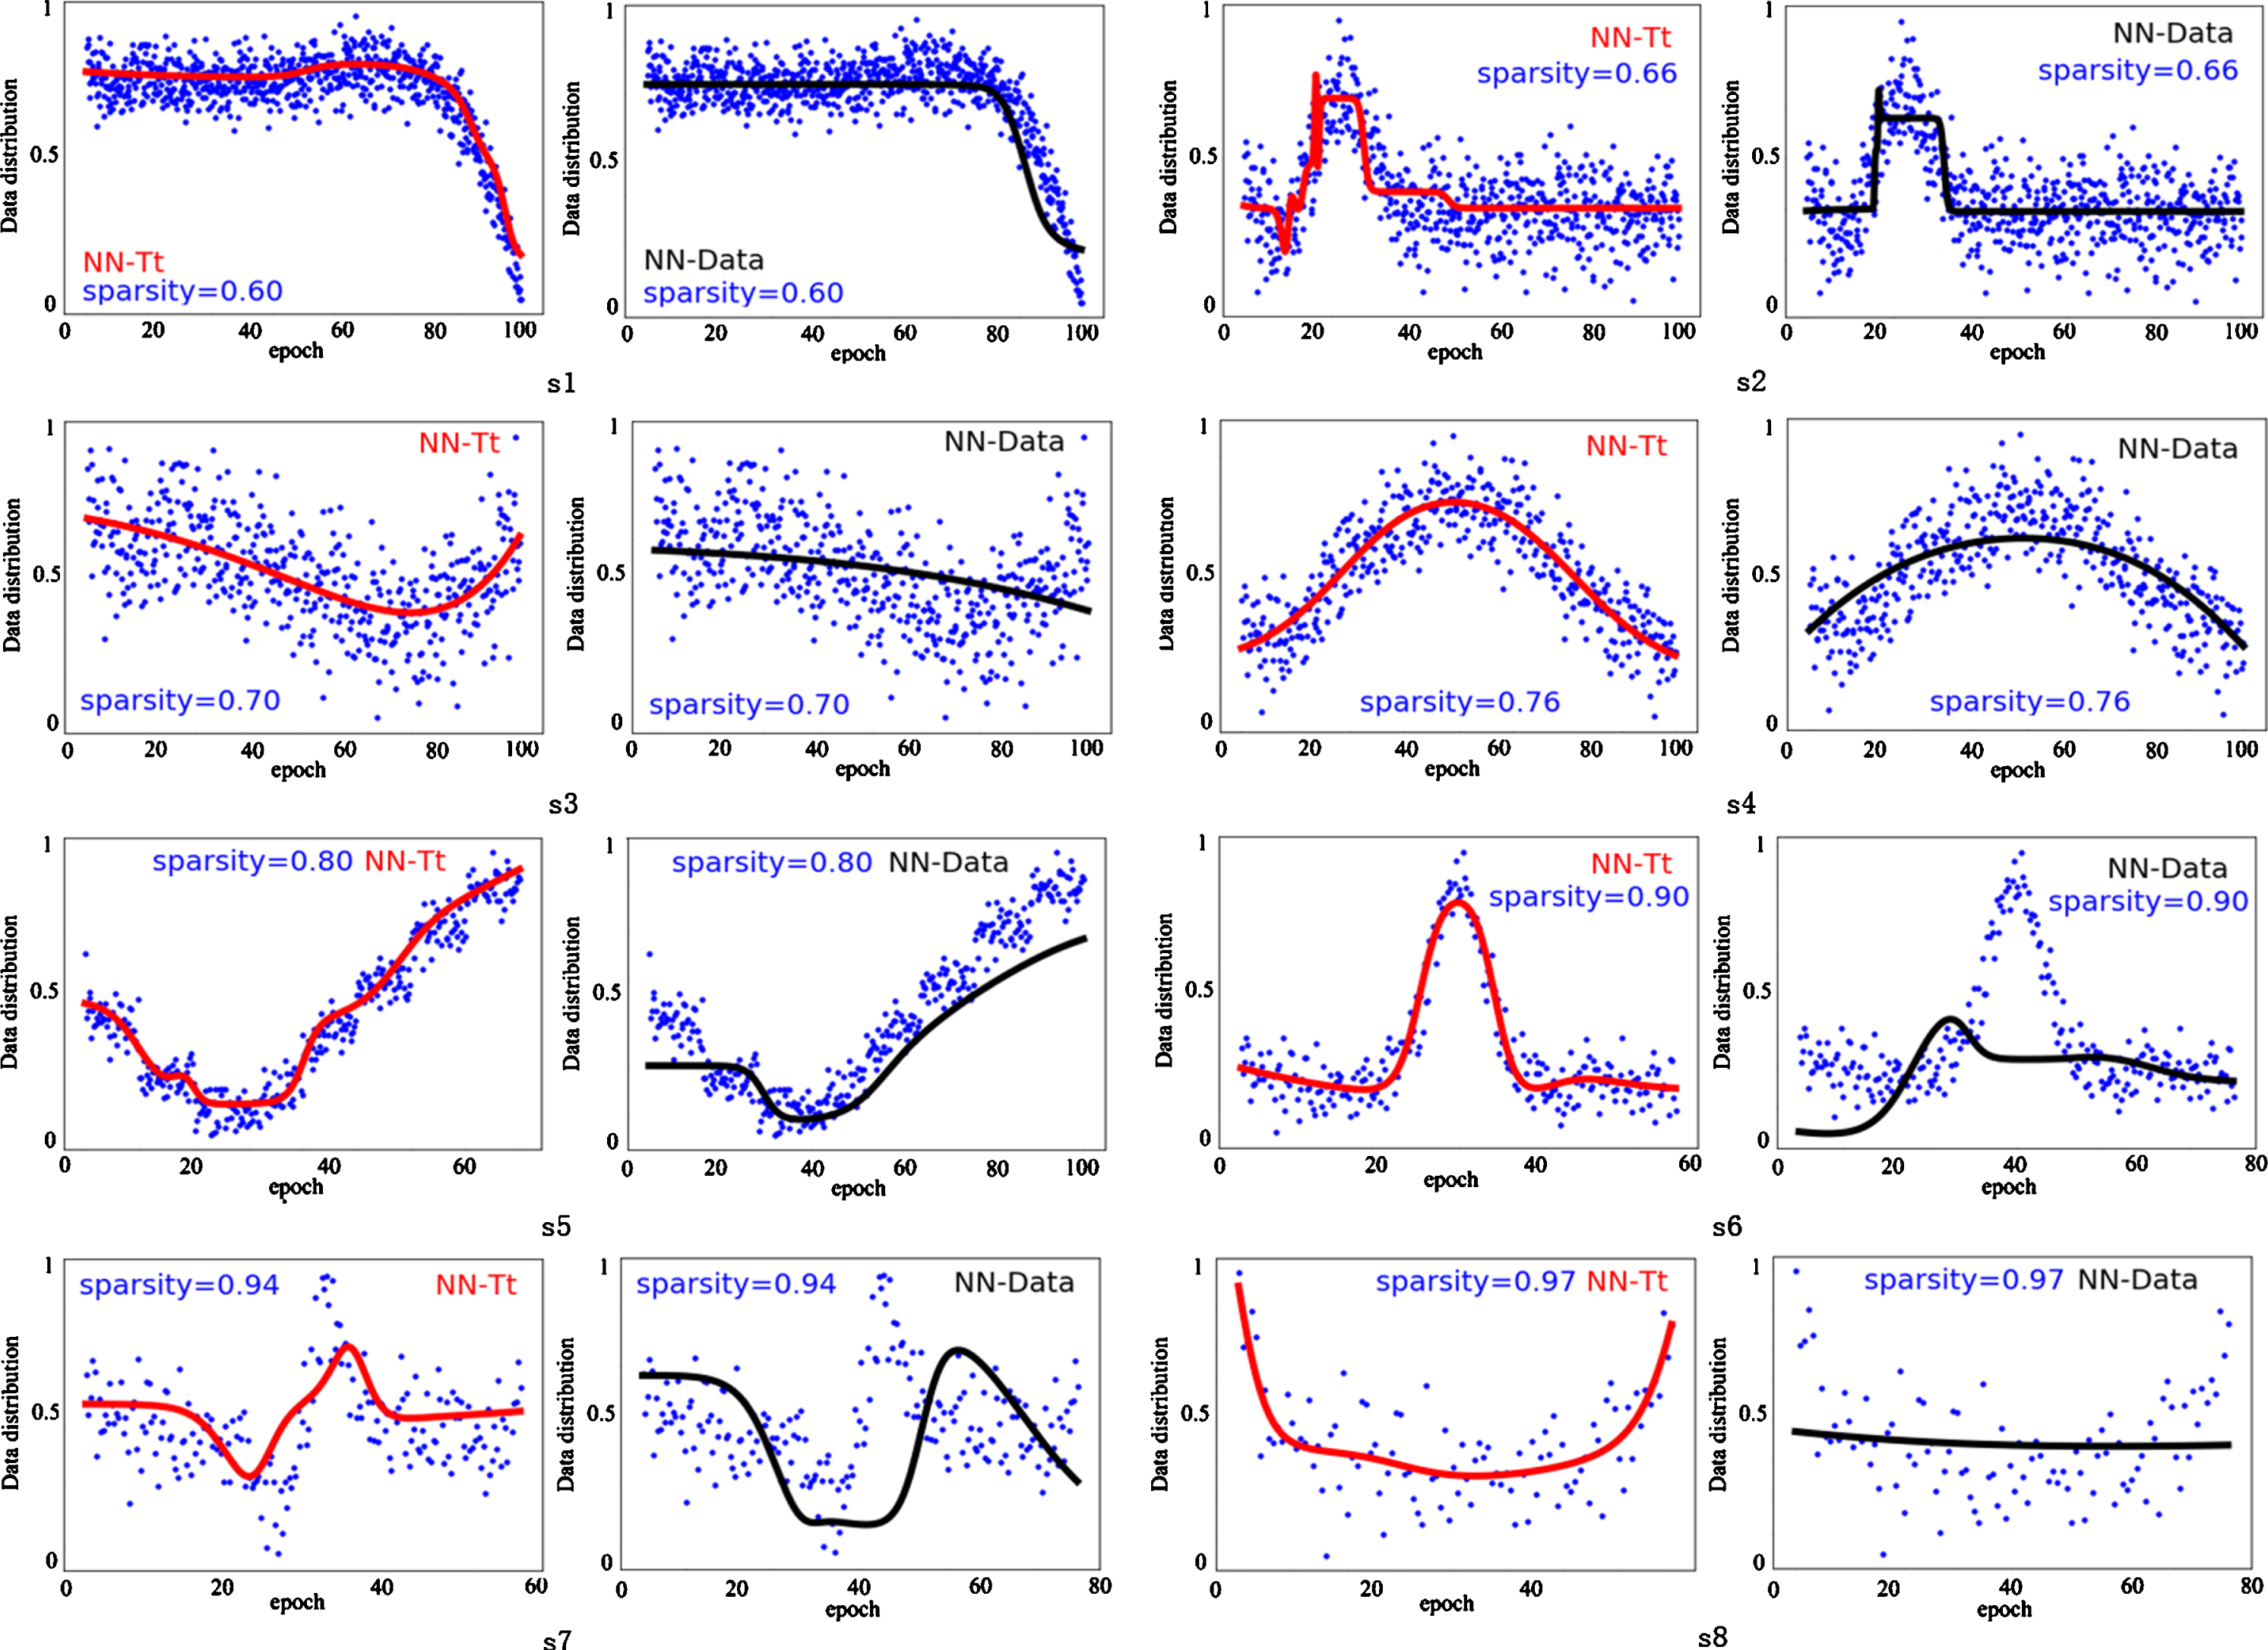
Data approximated by NN-Tt and NN.

Results of approximation precision.
From Figs. 2 and 3, several observations can be obtained: (i) There is no significant difference between NN-Tt and NN in these results (see Table 4). Obviously, NN-Tt is statistically better than NN in approximation precision in Fig. 3. From the perspective, NN-Tt is regarded as a winner. (ii) NN-Tt shows a clear advantage over NN approximation high-dimensional data as shown in Fig. 2. Unfortunately, NN exists distortion in approximation high-dimensional data, e.g, datasets s5, s6, s7 and s8, when data sparsity reaches over 0.8. (iii) The neural networks trained using data are difficult to obtain advanced results in approximation data in high-dimensional space, while superior results can be easy to obtain by the neural networks trained using high-dimensional functions.
Figure 4 displays the running-time of NN-Tt and NN on the 8 synthetic datasets. In the case of fixed dimensionality and data volume, the running-time of the two neural networks drops as data sparsity augments. Compared with NN, NN-Tt has no advantages. The reason is that NN-Tt needs to calculate the two deviation during each iteration. Calculation the two deviations depends on data dimensionality m1 and data volume m2, so computational complexity is equal to O(t)=c1m1 + c2m2, i.e., O(n3)> > O(t)> O(n2), where, c1 and c2 are constants. However, NN does not have to do that. Overall, NN-Tt takes a lot of time to calculate the deviation, resulting in increasing running-time.

Results on running-time.
The results on real-world datasets show that NN-Tt is obviously higher than NN as for approximation accuracy in Table 5. For instance, data dimensionality of TTC is equal to 7570, and data sparsity reaches 0.9402, in terms of precision, it can be seen that NN-Tt is 24.4% higher than NN. Beyond that, these statistical results in Table 5 also demonstrate that the approximation precision does not shows in general a difference between the proposed NN-Tt and the competitor NN. This implies that in high-dimensional space, superior results are easier to obtain using NN-Tt than that of using NN.
Approximation precision on real-world datasets.We independently did experiments for 500 times. Precision for t-test (p < 0.05). {precision value}
Approximation precision on real-world datasets.We independently did experiments for 500 times. Precision for t-test (p < 0.05). {precision value}
To explore the capability of approximation data in high-dimensional space using neural networks, we add the number of hidden-layers (from 5 to 12) for NN without changing parameters. The number of hidden-layers for NN-Tt is still constant. We independently did experiments for 500 times, then, compared results with NN-Tt are shown in Fig. 5.
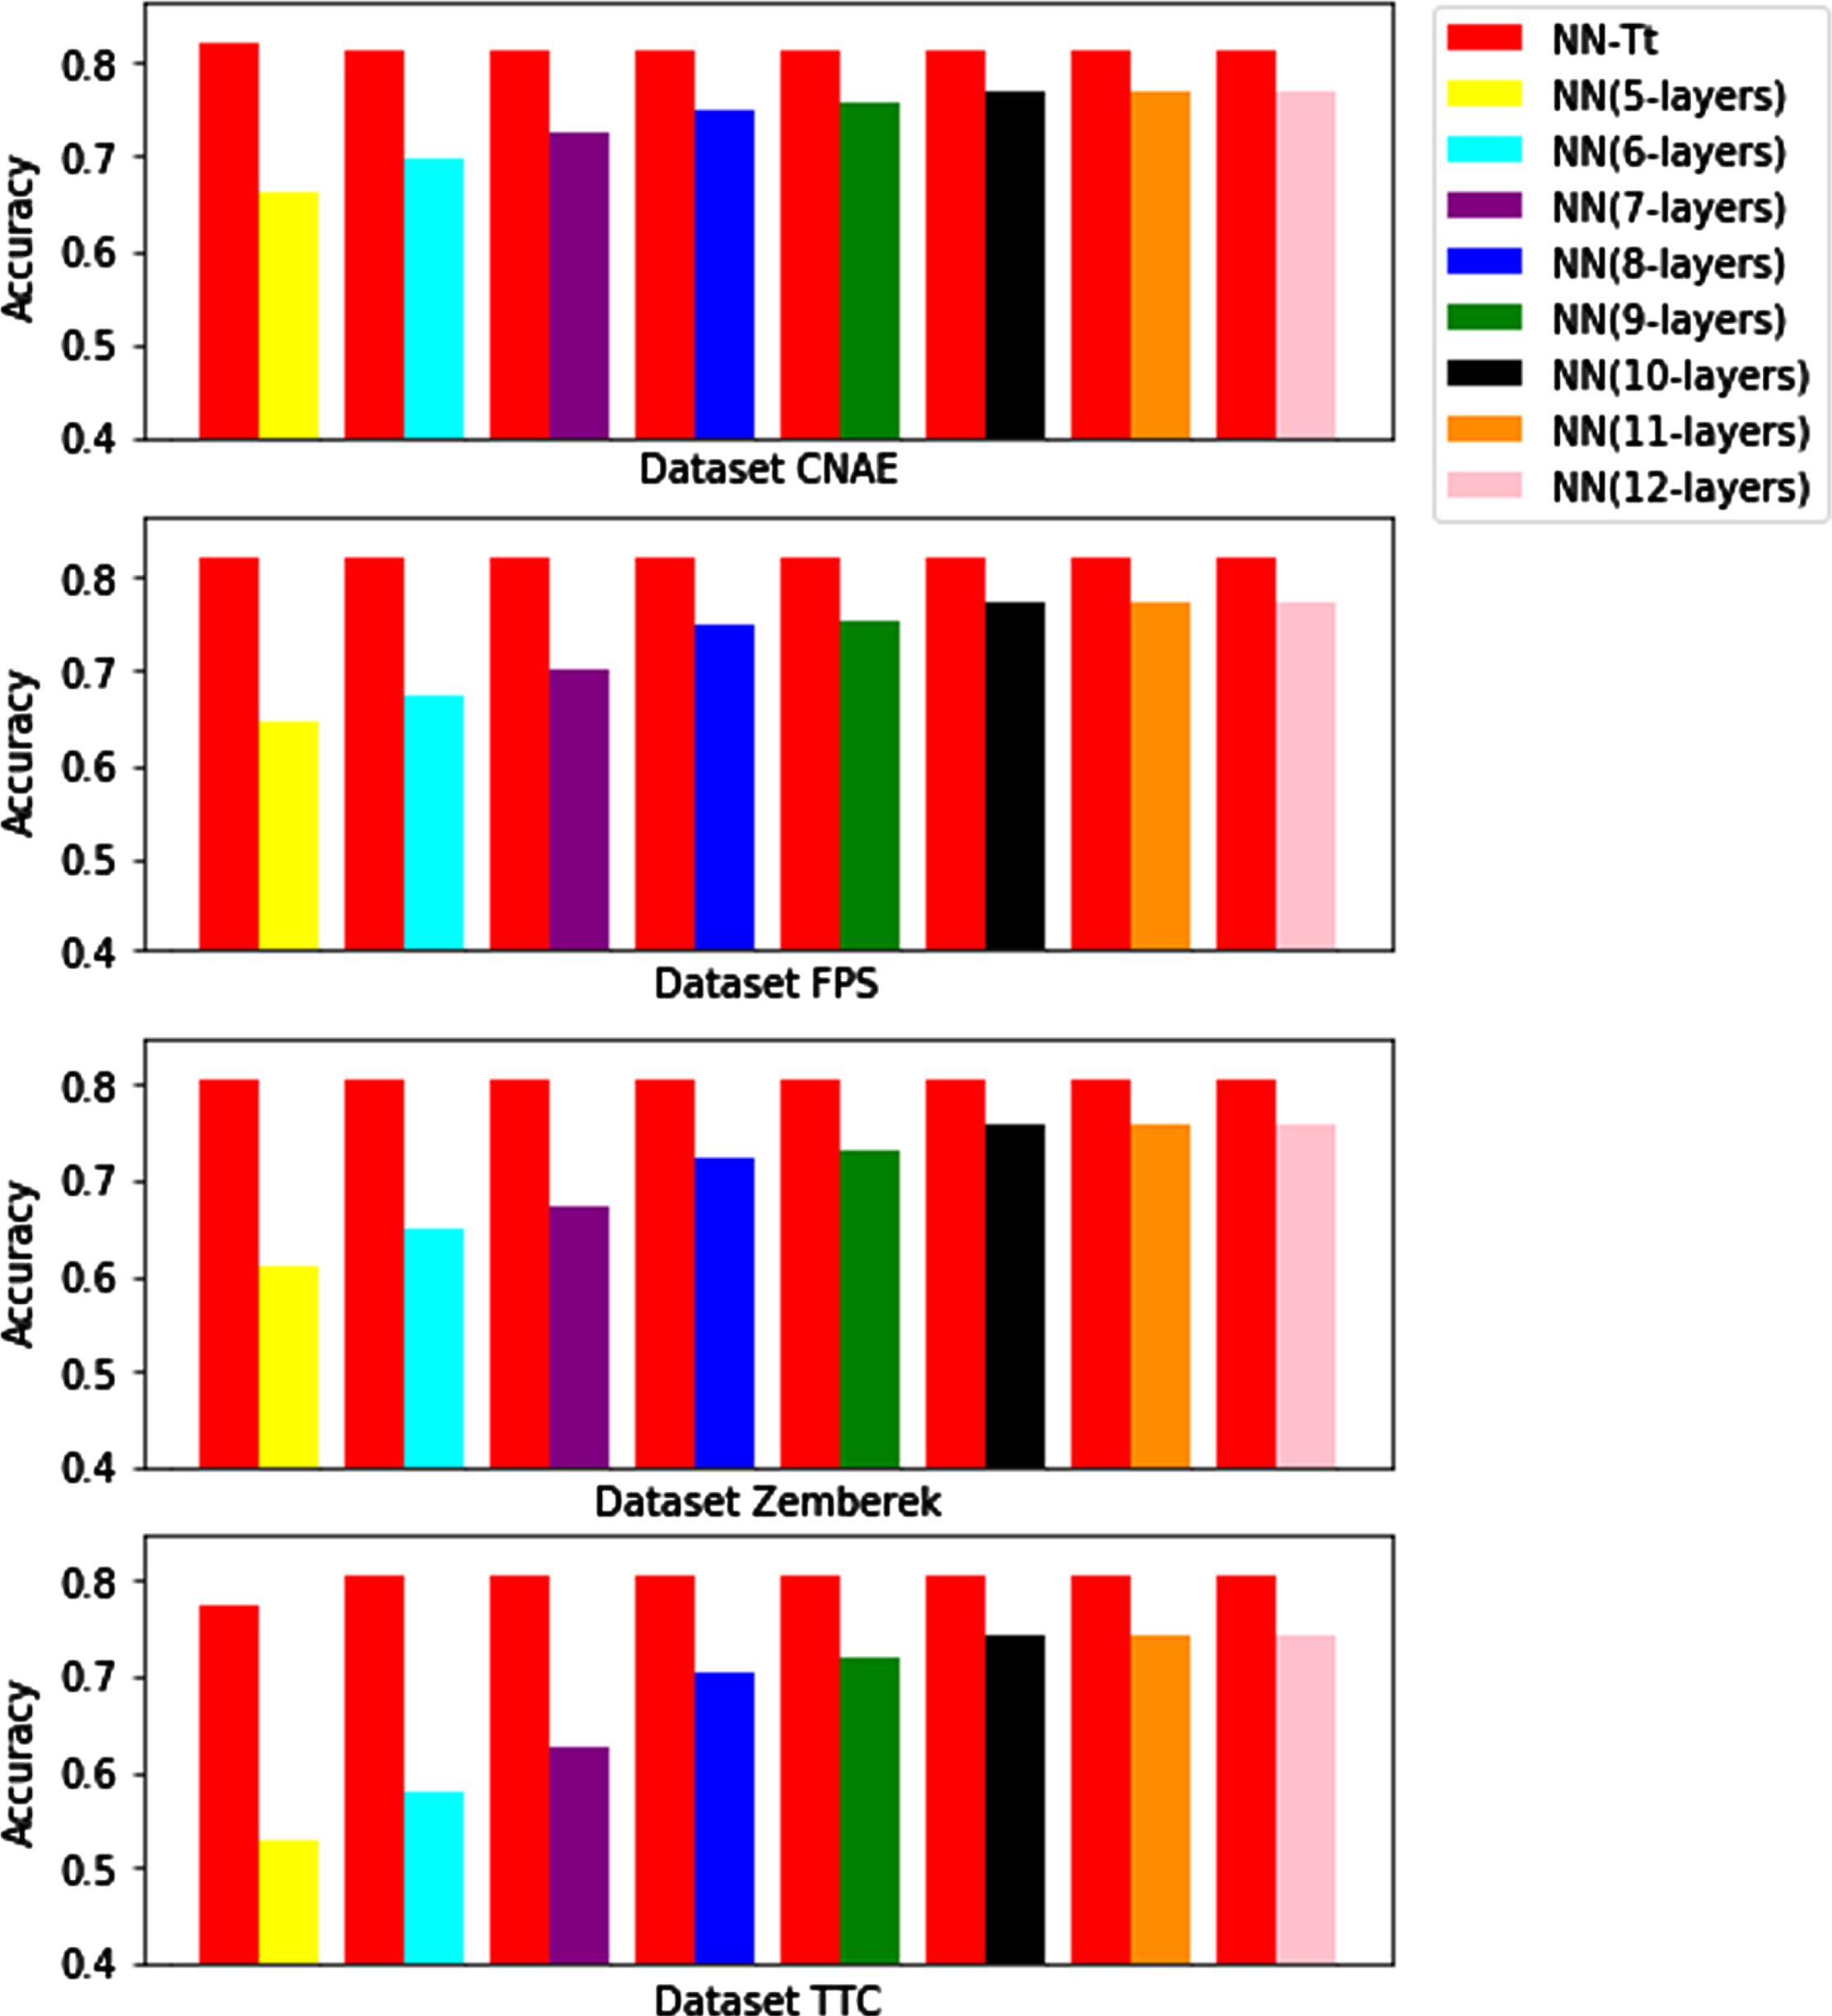
Approximated precision on the four real-world datasets.
It can obtain several observations from Fig. 5: (i) Even if the hidden layers of NN is increased, the approximation precision of NN-Tt is still better than that of NN. (ii) In high-dimensional space, by tuning hidden-layer, this is difficult to have substantial positive effects on improving approximation ability of the neural networks trained using data. (iii) When the number of hidden layers for NN reaches above 10, we find that its approximation capability hardly does increase significantly. This implies that the approximation ability of the neural networks trained using data is hardly to improve substantially when the hidden layers increase to a certain number.
Through analyzing experimental results, we demonstrate the advantages of the proposed approach compared to the state-of-the-art methods, i.e., (i) High-dimensional functions can train higher quality neural networks of being suitable for high-dimensional space, so that there is no need to retain sufficient data for neural networks training. (ii) In the case of being short of data scenarios, the mechanism using high-dimensional functions training fully replaces that of using data training. (iii) In high-dimensional space, the neural networks trained using data are more difficult to obtain advanced results of approximation data, while superior results are more easily obtained by that of trained using high-dimensional functions.
Equation (2) is used to constrain the deviation of neural networks training. This purpose is that the training deviation is governed within a tolerable range, so as to obtain the neural networks of having high accuracy and being suitable for high-dimensional space. Equation (10) minimizes the deviation of approximation data in high-dimensional space using neural networks. By Equation (2) and Equation (10), neural networks show better dimensional adaptability and resistance to data sparsity in high-dimensional space. Although the capability of approximation data using neural networks is improved under constraint of Equation (2) and Equation (10), meanwhile, this also exist a little disadvantages, such as time complexity, approximation a large number of data, computational time complexity increases. However, the time complexity O(t) is acceptable, i.e., O(n3)> > O(t)> O(n2).
Neural networks training requires sufficient data. This may not be available in practical applications. Consequently, the value of our approach is to provide a reference for neural networks training. We proved the rationality and validity of the proposed thought theoretically and experimentally. However, we do not demonstrate how to select high-dimensional functions, because that is not the focus in our work. Certainly, we also suggest that the selection of high-dimensional functions considers smooth functions, or high-order functions, etc.
Conclusion
In this paper, to address this issue of approximation data in high-dimensional space using neural networks, we derived the two deviation according to the Lipschitz condition, i.e., neural networks trained using high-dimensional functions and high-dimensional functions approximation data in high-dimensional space. Here, the two deviation provide a reference to improve precision for neural networks training in high-dimensional space. In the future, we will look at exploring more approaches to improve the precision of approximation data in high-dimensional space.
Footnotes
Acknowledgment
This work was supported by the Science and Technology Research Program of Chongqing Municipal Education Commission of China under Grant KJQN201903003. And the Science and Technology Research Program of Chongqing Municipal Education Commission of China under Grant KJQN202003001. And the Chongqing Municipal Education Commission of China under Grant 192072. And the Higher Education of Chongqing Municipal Education Commission of China under Grant CQGJ20ZX021.