
Abstract
Blood vessel segmentation is an essential element of automatic retinal disease screening systems. In particular, retinal blood vessel analysis from fundus image is vital in the identification and diagnosis of cardiovascular and ophthalmological diseases (Ex: Diabetic Retinopathy, Macular degeneration, Retinal Pigmentosa, Macular Edema, and various stages of Glaucoma, etc). Wherefore, the diagnosis of these diseases by automatic vessel segmentation has become essential, especially in disclosure of premature prognosis of vision condition. In general, blood vessel extraction is divided into vessel tracking and pixel classification. In vessel tracking a vasculature model is expanded from a seed point. In pixel classification, the classifier classifies the pixels as either a vessel or background pixel, which is demonstrated in the proposed architecture. In this paper, deep learning based 19 layer U-Net architecture is proposed for the accurate and efficient segmentation of blood vessels. Prior to segmentation, a pre-processing block of AlexNet architecture is introduced for the classification of high-quality images from the experimented databases. This pre-classification stage helps in efficiently picking high-quality images determined by clarity, field definition, and sharpness. AlexNet classification is pivotal in enhancing the overall performance of the system by segmenting fine and tiny blood vessels. The proposed U-Net architecture has an encoder-decoder framework with 9 and 5 convolutional layers in each respectively. In order to boost the efficiency of the network as well as to reduce training and testing time, a proper choice of kernel dimension and number of filters are necessary. Our architecture was investigated on popular databases such as DRIVE, ARIA_d and MESSIDOR and various performance measures (accuracy, sensitivity, specificity, sensibility, Dice coefficient, and Jaccard coefficient) have been computed along with the Receiver Operating Characteristics. It is observed that the accuracy for DRIVE, ARIA_d and MESSIDOR are 90.60%, 87.60% and 83.42%, respectively. Area under curve in Receiver Operating Characteristics plot is found to be 98.54%, 93.28% and 88.18%, for DRIVE, ARIA_d and MESSIDOR databases, respectively. Results with the proposed architecture show remarkable improvement in the performance metrics for blood vessel segmentation.
Introduction
Diabetic retinopathy (DR) is an ocular disease that usually damages the blood vessels of eye, due to diabetes complications. It is the paramount cause of blindness and therefore economically viable screening and identification for early diagnosis of ophthalmological and cardiovascular diseases. Analysis of these retinal blood vessels (RBVs) from the fundus image can be used for screening and diagnosis of related diseases. So, accurate and efficient segmentation of RBVs have become the prerequisite step for automated diagnosis. Automated segmentation of retinal vessels is crucial to identify the stages of blindness and retinal conditions. This segmentation can be more prominent and accurate by the help of deep learning techniques. Segmentation of vessels can be achieved by using several machine learning (ML) and deep learning (DL) [11] methods. As DL is proved to be more advantageous than ML, several DL architectures like convolutional neural network (CNN) [19], fully convolutional network (FCN) [14], SegNet, U-Net [21] are used for efficacious segmentation of retinal vessels.
Elisa et.al. [20] have used support vector classification and line operators to segment RBVs. Authors classified the unsupervised pixels by thresholding the basic line detector output. Further they have used supervised classification by incorporating support vector machine for segmentation of blood vessels employing orthogonal line detector along with grey label target pixels. The effectiveness of this method is demonstrated by receiver operating characteristics (ROC) curve [17] on STructured Analysis of the Retina (STARE) [6] and Digital Retinal Images for Vessel Extraction (DRIVE) [25] databases with an accuracy of 95.95% and 96.46%, respectively. This method detects some false positives in the vicinity of optic disc (OD) and the pathological regions. This fails to detect the thinnest blood vessels for the low contrast images and the segmented image appears noisy.
Multi-scale matched filters are found to be superior in noise suppression compared to the single scale filters. So, particle swam optimization (PSO) is proposed by Sreejini and Govindan [23] for determining the multi-scale Gaussian matched filter parameters that optimal for segmentation of RBVs. Sreejini and Govindan have tested this method on DRIVE and STARE databases. They reported sensitivity, specificity and accuracy of 71.32%, 98.66% and 96.33% for DRIVE and 71.72%, 96.87% and 95% for STARE databases.
Bekkers et al. [2] have used biologically inspired multi-orientation analysis to determine vessel tracking for-instance: crossing, bifurcation, parallel vessels, varying width vessels and vessels including high curvature. Authors have used an invertible orientation score to provide the multiple orientations. The vasculature tracking algorithm embodies of OD detection, seed point spotting in OD, initialization of edge tracking in orientation score, automatic termination based on stopping criteria, junction detection, classification and junction resolving. The edge tracking orientation score was used as a basis for vasculature tracking. They have reported an average of 5.25% false vessels in case of bifurcations, out of 381 images (healthy = 110, diabetes = 152 and glaucoma = 119). The above mentioned methods are ML techniques put forward by several researchers for vessel segmentation. Researchers (Hu et.al, Lu et.al., Jiang et.al.) recently motivated to use DL methods for segmenting the vessel, as it extracts the finer details from the retinal images. Some of them are discussed below with their limitations. This motivates us to develop the efficient DL architecture for better segmentation.
Hu et al. [7] used CNN and conditional random fields (CRFs) that are fully connected for segmentation of retinal vessels. This method employs abundant information related to spatial context by interacting all the pixels in the fundus image. Here, a map of probability is produced from image to image using a multi-scale CNN architecture along with an ameliorated loss function of cross-entropy. Finally, the binary segmentation is obtained by applying CRF. They have reported an accuracy of 97.51% and 97.59% for STARE and DRIVE databases. This method fails to detect the tiny blood vessels.
A 13 convolutional layer (6 along down sampling path and 7 in upsampling path) U-Net architecture is proposed by Lu et al. [16] for RBVs segmentation. The CNN subsumes rectified linear unit (ReLU) and maxpooling to reduce the training parameters significantly. In the final layer softmax is used for class distribution of the pixels. CRF is performed on the output of U-Net for segmentation. This method test outcomes on DRIVE [25] dataset provides an average accuracy of 86.5%.
Transfer learning in DL basically preferred for insufficient databases. In this case, the network is trained with large number of labeled training data and tested with small number of test data. In biomedical field, the expert annotated images are rear and expensive. To overcome this difficulty, a supervised method based on pre-trained FCN [14] through transfer learning is contemplated by Jiang et.al. [9] for vessel segmentation. This method uses an additional unspervised image post-processing technique for the refinement of the segmented result. This method was experimented on STARE [6], DRIVE [25], High-Resolution Fundus (HRF) and CHASE_DB1 databases and an accuracy of 98.70%, 95.80%, 97.70% and 95.80%, reported respectively.
A 15 layer CNN is put forth by Liu et al. [13] for segmentation of vessels.Prior to segmentation of images; they are subjected to pre-processing by cropping them into 48×48 image patch. The network is tested on the most familiar DRIVE dataset [25] producing an accuracy, sensitivity, specificity and AUC of 95.1 %, 98.5 %, 72.5 % and 96.8 % respectively.
Two stage framework of training and testing stages are incorporated for vein segmentation by Jiang et al. [8]. First stage which is a training stage consists of (i) pre-processing of retinal images, (ii) patch extraction by dynamic extraction strategy, (iii) feature extraction and weight updation by gradient descent and back propagation algorithm. Second stage is a testing stage consists of (i) image pre-processing, (ii) patch extraction by overlapping extraction strategy, (iii) obtaining segmentation patches and (iv) reconstruction of segmentation patches by overlap patch reconstruction algorithm. This framework achieved an F1 score of 83.21 %, 85.31 %, and 82.43 %, an average accuracy of 97.06 %, 97.77 %, and 97.73 %, and AUC of 98.80 %, 99.23 %, and 99.17 % on the DRIVE, STARE, and CHASE_DB1 datasets, respectively.
Gojic et al. [4] created datasets (GT1 and GT2) of retinal images exhibiting retinopathy of prematurity. These images are fed into networks proposed by Zhuang [28], Oliveira et al. [18] and Li et al. [12] and are compared with the results of public datasets such as DRIVE, STARE and CHASE_DB1. The network proposed by Li et al [12] provides an accuracy and AUC of 96.78 % and 94.29 % on GT1 dataset. This network achieved an accuracy and AUC of 93.78 % and 83.96 % on GT2. The proposed network by Oliveira et al. [18] provides an accuracy and AUC of 96.81 %, 94.36 % on GT1. This network achieved an accuracy and AUC of 91.25 %, 82.50 % on GT2. Zhuang [28] proposed network obtains an accuracy and AUC of 96.39 %, 93.93 % on GT1. This network achieved an accuracy and AUC of 93.07 %, 82.11 % on GT2 dataset.
Luo et al. [15] in their research work proposed three levels of information about fundus such as global information, vessel related information and disc-region information. These information are used to design the Vessel-Net. The global stream information is obtained by ResNet-50, prior to this retinal images are resized into 224×224 pixels to enable the pretrained network. The obtained global stream images are again resized into 224×224 pixels and fed into U-Net to obtain local disc region. Then the features of disc region are extracted by ResNet-50, like global information level. Finally for vessel information, a modified version of LadderNet is used for obtaining the segmented image. Along with the segmented vessels, the neighbourhood region of vessels is obtained by Gaussian blur method. The segmented image observes an AUC, sensitivity and specificity of 82.20 %, 78.46 %, and 81.46 % respectively on ODIR dataset.
The above discussed methods have an average accuracy lying between 92% to 97%, whereas average sensitivity and specificity are found to be around 72% and 98%, respectively. These performance metrics values are not good enough for any method to perform efficient and accurate diagnosis of the diseases. So, there is a scope for improvement of the values of performance metric of the segmented features (specifically blood vessels) from the retinal fundus image. In order to achieve this, a 19-layer U-Net architecture has been proposed in conjunction with the classification of medically suitable retinal images (MSRI) [3]. MSRI can be obtained by using AlexNet [3] on the publicly available databases. This classifies the images into low quality (LQ) and high quality (HQ). The relative position of OD & fovea, visibility of vessels and contrast are used for representing the HQ images. The classified HQ images gleaned from the database are passed into the proffered 19-layer U-Net architecture for segmentation of vessels.
The method presented in this paper has been experimented on DRIVE [25], Automatic Retinal Image Analysis (ARIA_d) [24] and Methods to Evaluate Segmentation and Indexing Techniques in the field of Retinal Ophthalmology (MESSIDOR) [1] databases and performance measures (accuracy, sensitivity, specificity, sensibility, Dice coefficient, Jaccard coefficient and area under curve (AUC)) [26] have been computed and compared with the existing CNN architectures reported in the literature’s.
The organization of rest part of the paper is as follows. Section II demonstrates the proposed implementation of the U-Net architecture along with MSRI [3] for RBVs segmentation. Section III discusses retinal image databases, results and performance evaluation. The conclusion and value of this proposed work has been discussed in Section IV.
Methodology
The proposed block diagram for RBVs segmentation is shown in Fig. 1. It consists of MSRI [3] classification for finding the HQ images, 19-layer U-Net architecture for RBVs segmentation and performance measure for determining the correctness of segmentation. Each block is described in the subsequent subsections.
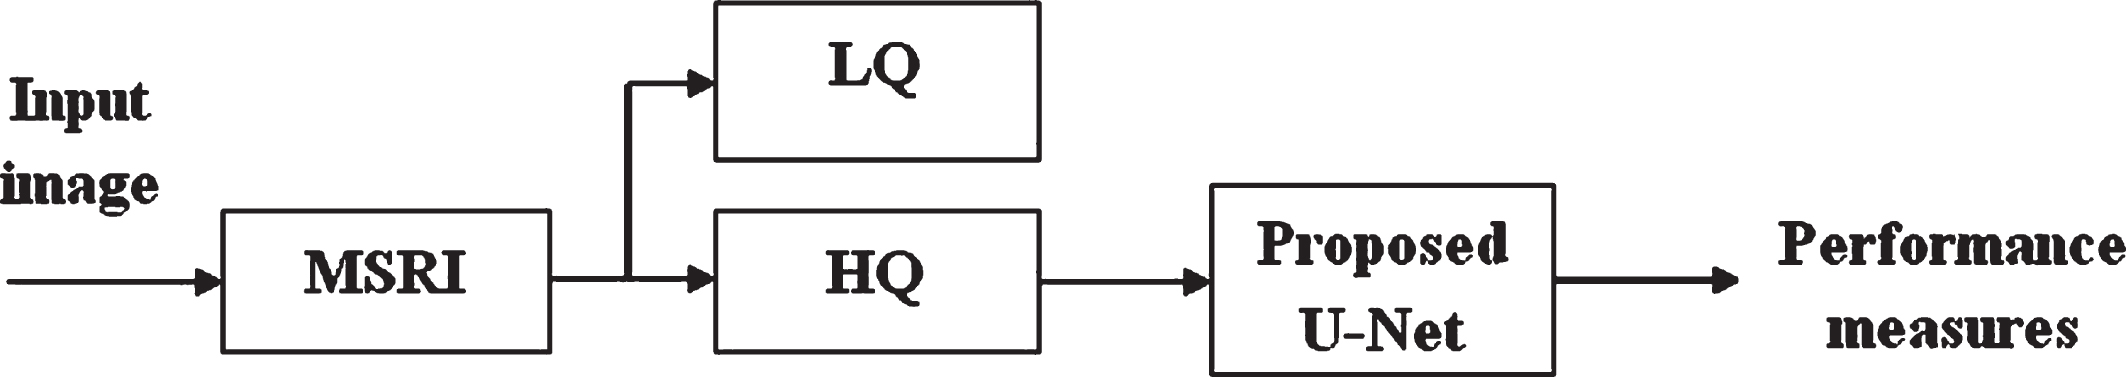
Proposed block diagram for segmentation of features.
In literature the performance evaluations of retinal image database are performed without examining the retinal image quality, which strongly affects the performance of the whole system. As a means to overcome this drawback initially the images are screened based on the quality into HQ images (referred as MSRI [3]) and LQ images. With the aim of assessing the quality of image, several researchers (Fleming et.al., Pires et.al., Chakkal et al. [3]) have used different techniques and introduced various indicators such as clarity, field definition and sharpness etc. to identify MSRI. Chakkal et al. [3] used a two stage classification in which the first stage performs the DL based classification by existing AlexNet and second stage performs the classification in terms of sharpness, illumination and homogenity. This is followed by an evaluation based on field definition and content in the image.
In this paper, MSRI are classified using AlexNet (reproduced in Fig. 2) which is a deep convolutional neural network (DNN). This architecture has 5 convolutional layers having kernel size 3×3, and stride 1. The number of filters used in each convolutional layer increases as the layer passes from Conv1 to Conv5. The number of filters are 96, 256, 384, 384, and 256 in Conv1, Conv2, Conv3, Conv4, and Conv5, respectively. Cross channel normalization (CCN) follows the ReLU in Conv1 and Conv2. A ReLU activation function is applied in all the layers, which helps in speeding up the training and easy gradient computations. It is represented in Equation (2). It consists of 3 maxpooling layers with a 3×3 kernel and stride 1, which assist in dimensionality reduction. The outcome of the convolution or maxpooling process is given to fully connected layers for making a decision regarding the classification. It is followed by a softmax layer, that maps non-normalized output to a probability distribution for predicting output classes. The softmax function is given in Equation (1). The softmax function will calculate the probabilities of each target class over all the possible target classes. In this case, 2 classes are used for predicting the output as HQ or LQ.
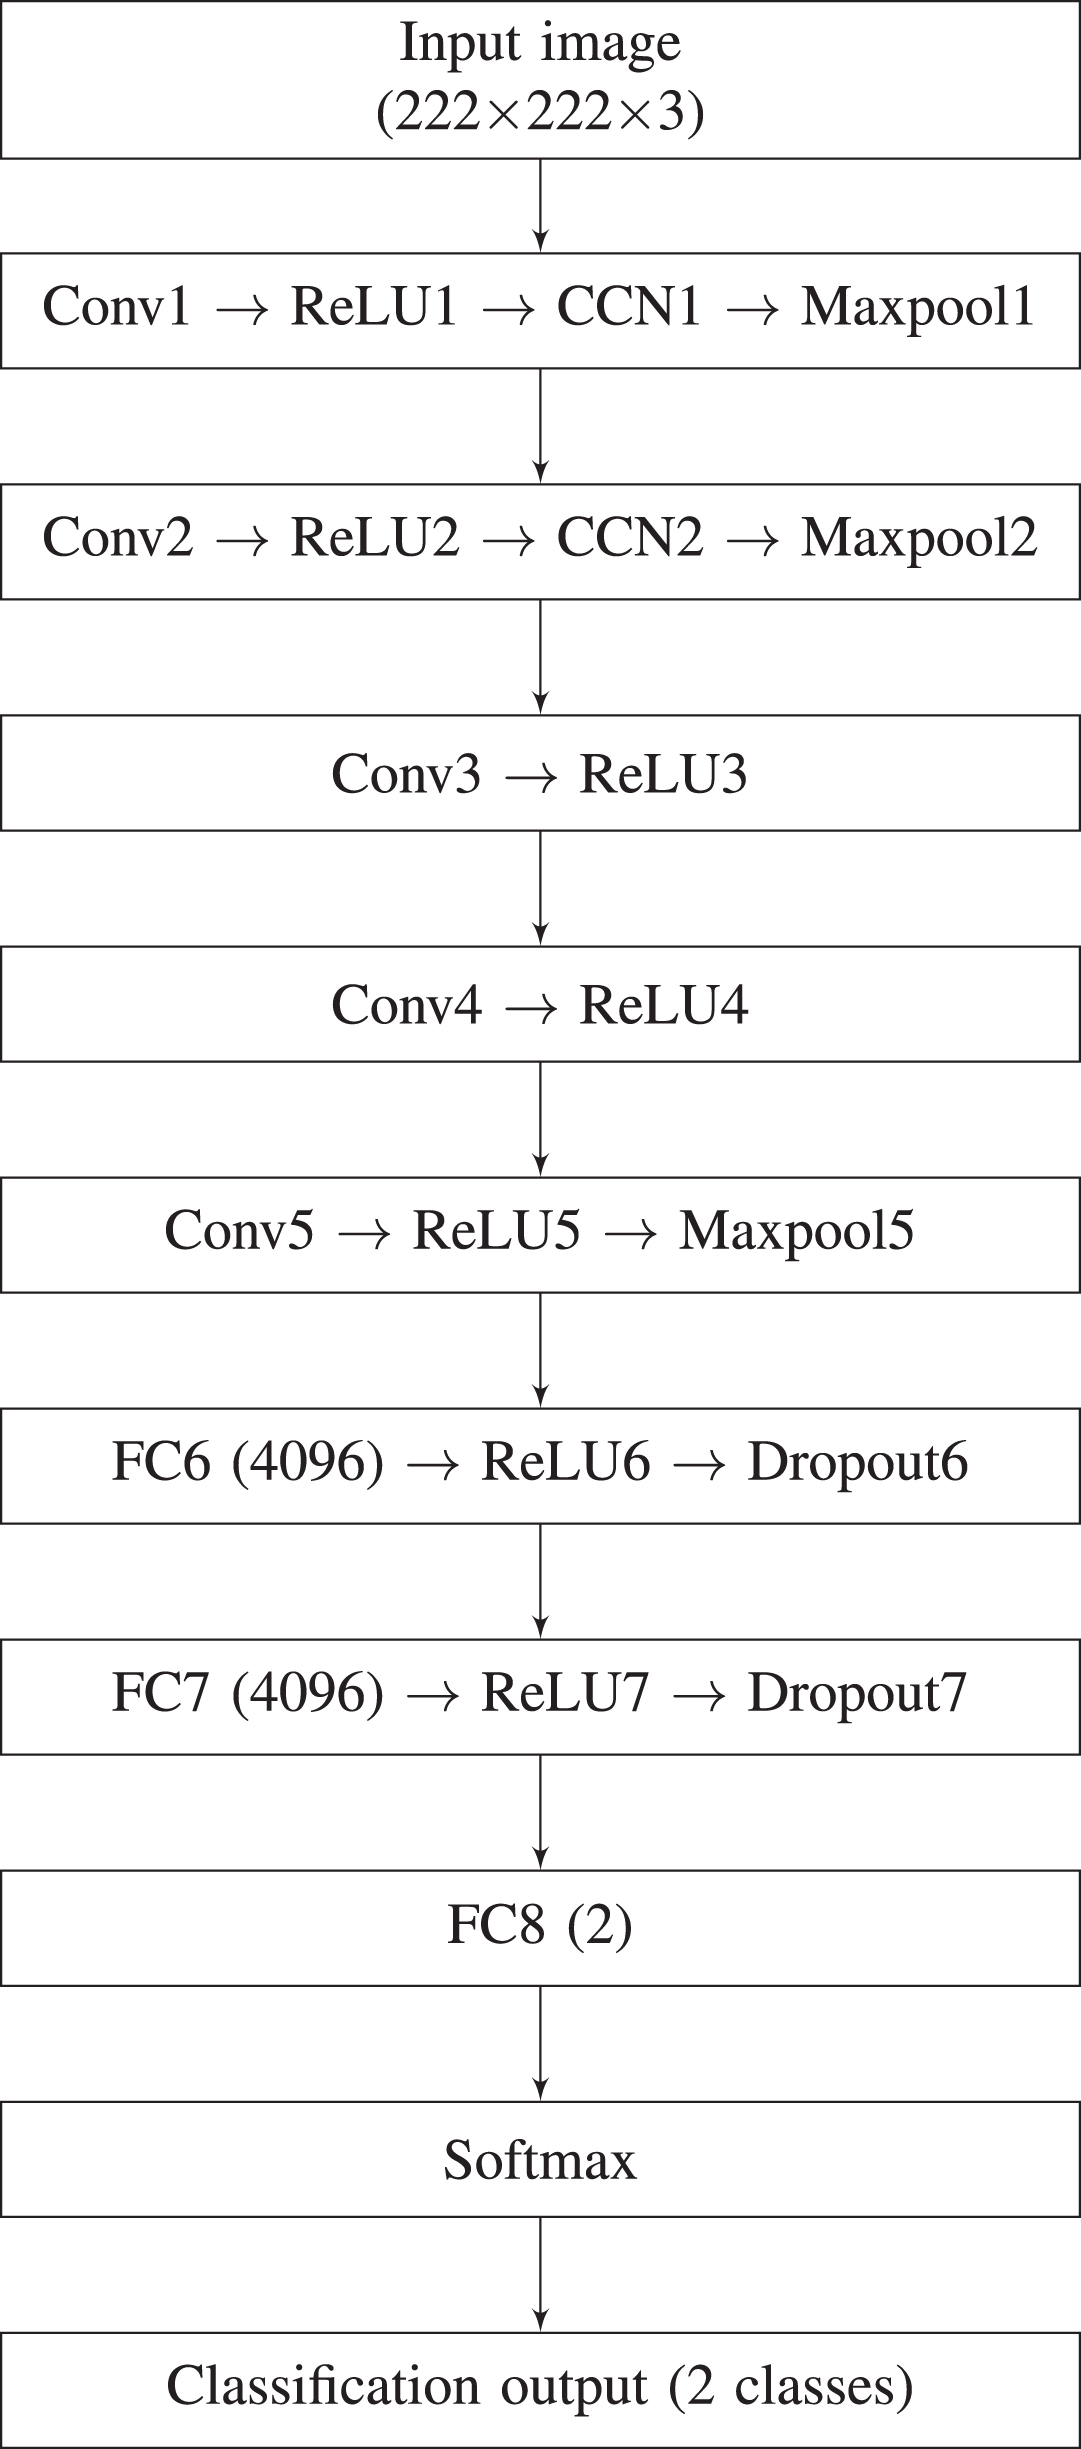
AlexNet used for MSRI classification [3].
In this paper, images from DRIVE [25], ARIA_d [24] and MESSIDOR [1] databases are considered as a whole for two classes (HQ and LQ) to train the AlexNet network (reproduced in Fig. 2). A total of 25 HQ and 36 LQ images are chosen from the above databases for training. These images are resized to 227×227×3 before giving to the AlexNet network for classification. In the testing phase each database is used separately to obtain the HQ and LQ images. The HQ images obtained from the classification are fed into the proposed 19-layer U-Net architecture for segmentation of RBVs.
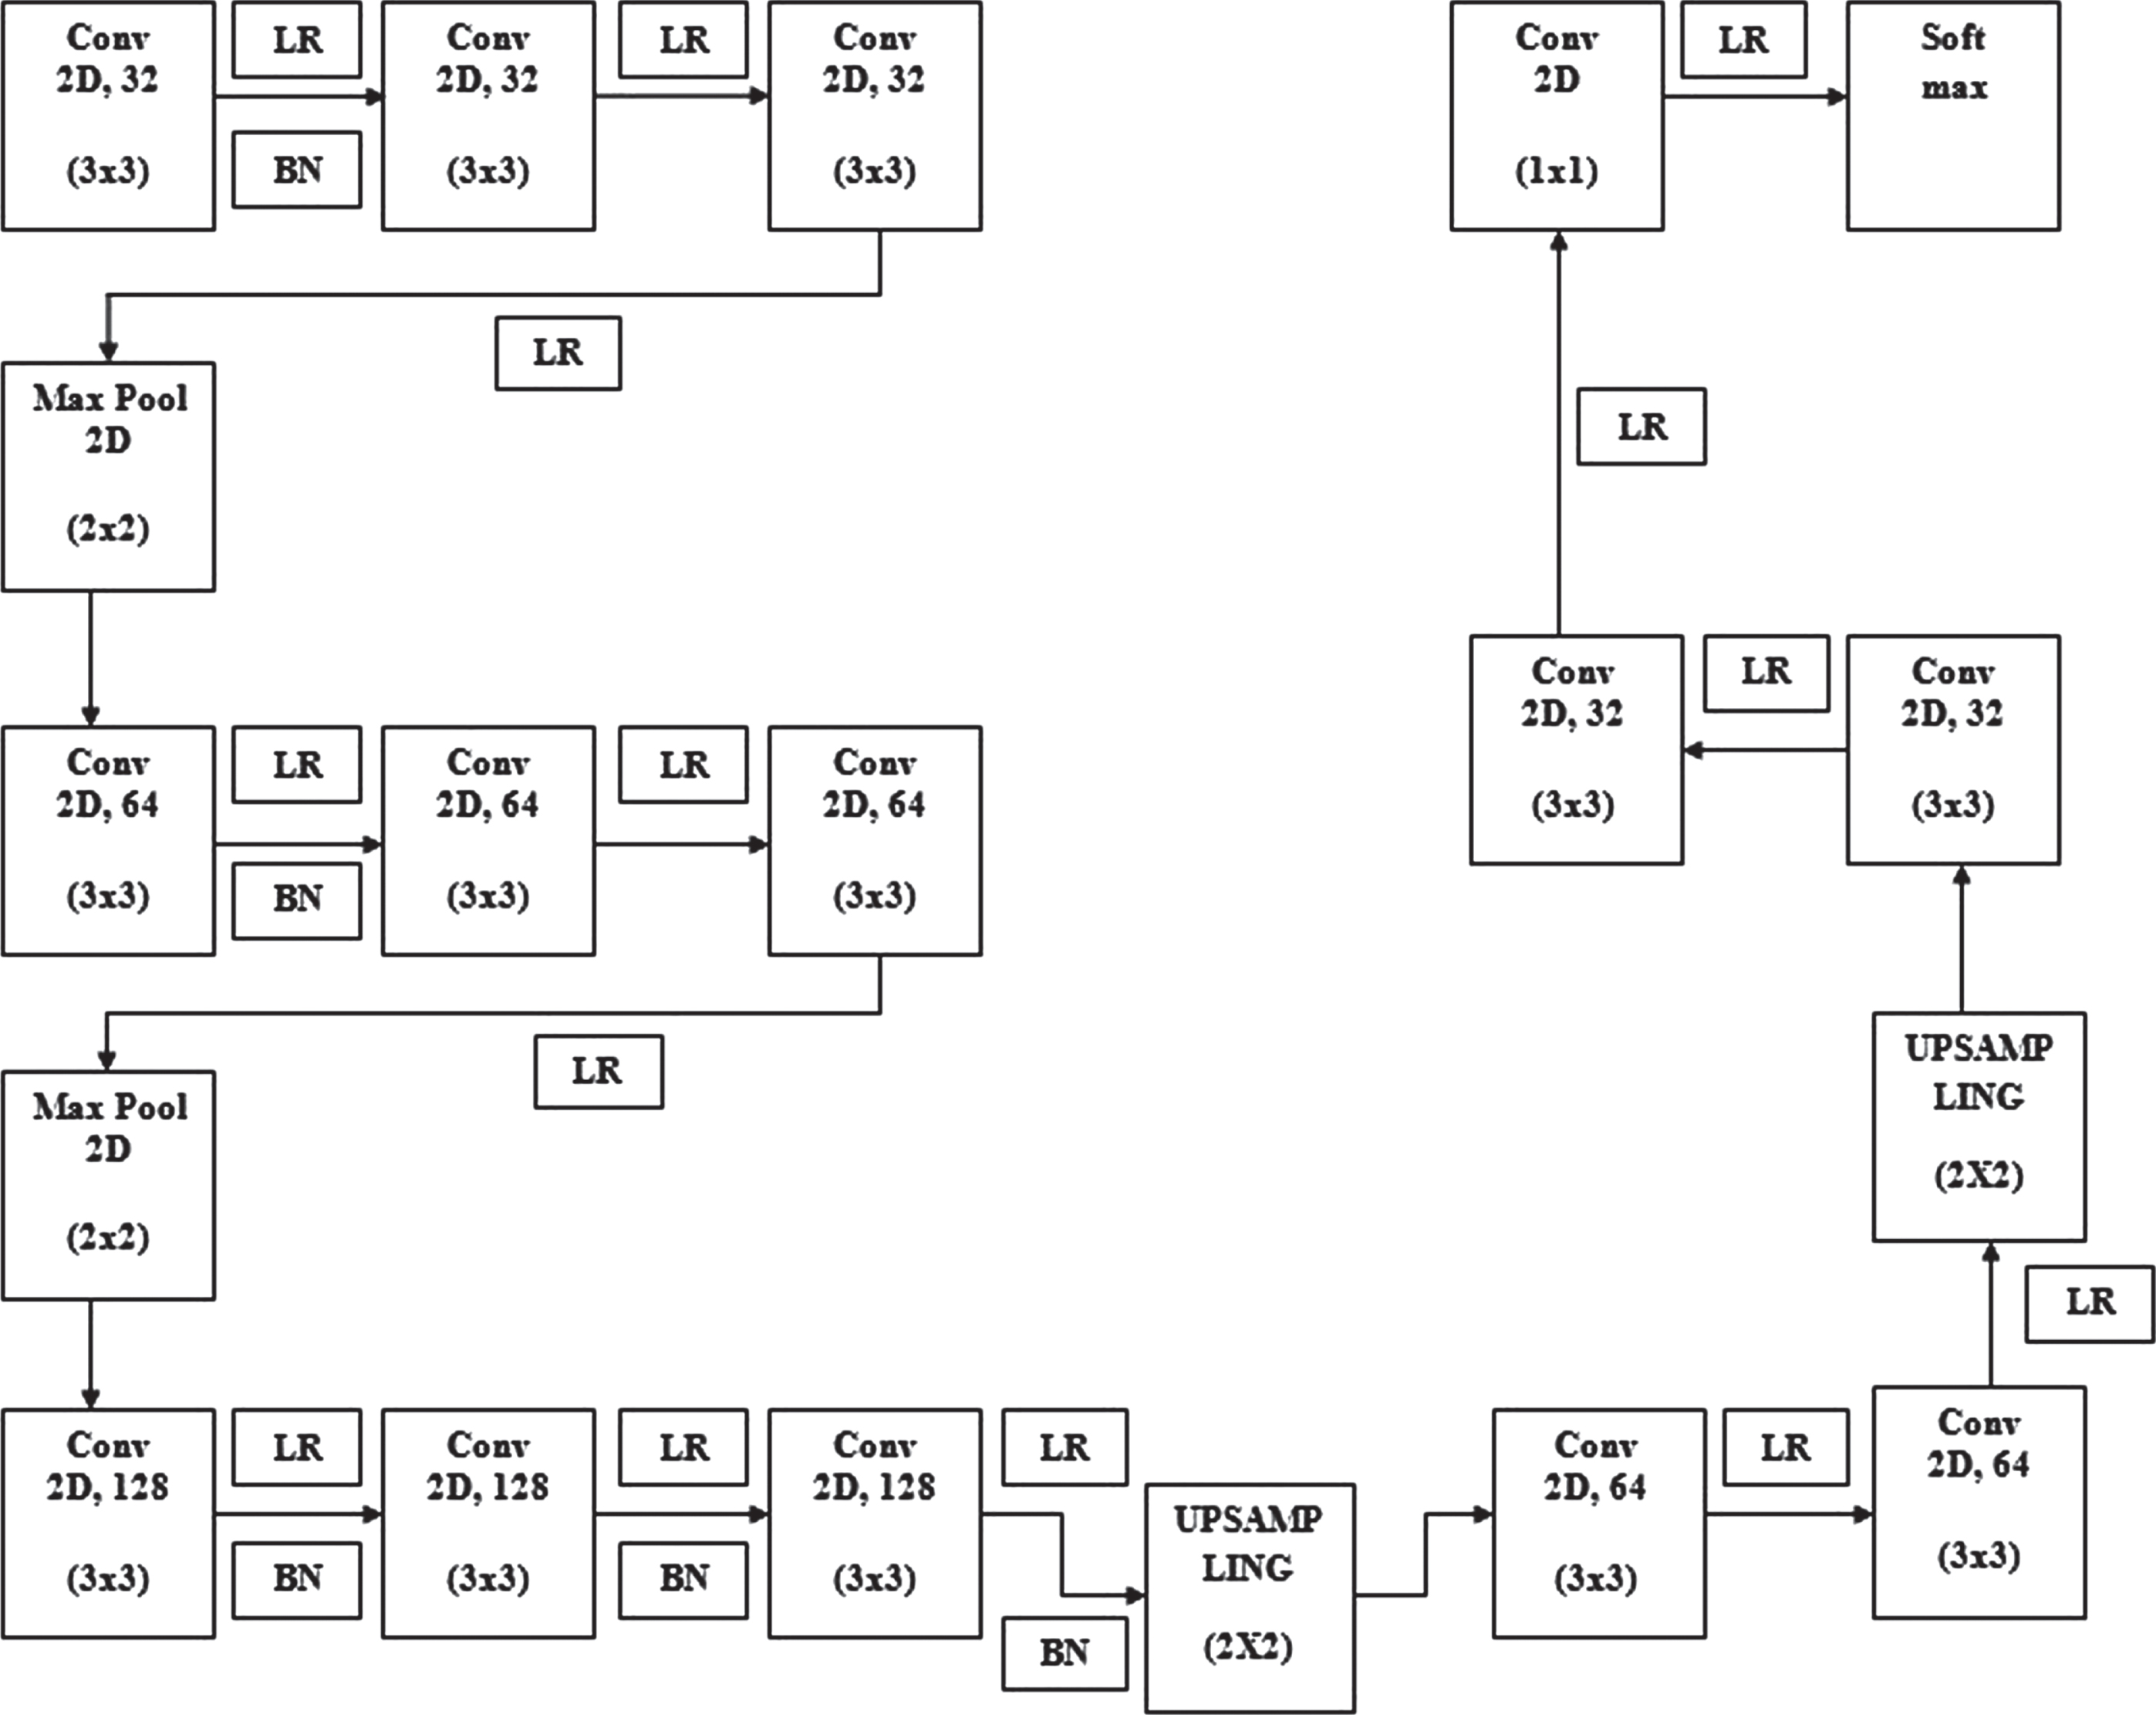
Proposed U-Net.
A proposed 19-layer U-Net architecture accepts the HQ images from the MSRI [3] classification for RBVs segmentation. This architecture has a downsampling block and an upsampling block. The downsampling block has 9 convolution layers with a kernel dimension of 3×3 and 2 maxpooling layers with kernel size 2×2. The upsampling block uses a kernel dimension of 3×3 in the beginning 4 convolutional layers and uses 1×1 kernel size in the last convolution layer. The upsamling block contains 2 upsampling layers and is used for doubling the dimension of the image. LeakyReLU (LR) is used throughout the architecture as an activation function and is represented in Equation (3). The value of leakage (α) is considered as 0.3 in LR for better performance. In this architecture batch normalization (BN) is performed for some of the layers to enhance the training and learning rate. The BN is computed according to the expression given in Equation (4). It uses two learning parameters γ and β, they are initialized to 1 and random value, respectively. The entire model uses a stride height & width of 5 and a batch size of 25. This architecture uses Adams optimizer to compute the learning rates for individual parameters. Cross-entropy loss function is Incorporated for segmentation in this model. In the last layer of the architecture softmax layer (1) is used for pixel classification.
The output of the softmax yeilds the segmented RBVs. These segmented RBVs are compared with the available ground truth (GT) for computing the performance metric.
Input: Values of x over batch B= {x1, …, m }
The segmented output obtained from each image from the U-Net block has been compared with the respective GT image for predicting the segmentation performance. The performance measures computed in this paper are accuracy, sensitivity and specificity etc. The detailed description about these are given in Sub-section 3.3. The segmentation performance is visualized by the ROC curve. For MESSIDOR [1] database the GT is not available. For this database GT for RBVs, OD, macula and fovea have been found out by the experts in my institute using GIMP (GNU Image Manipulation Program) toolkit [5]. The original TIFF images from the MESSIDOR database are opened in GIMP toolkit and a transparent layer is overlayed on it. The line tool brush (whose size can be manually adjusted depending on the size of the feature) present in this GIMP is used to trace the BV, OD to trace BV and other normal pathological features.
Databases, results and performance evaluation
The proposed method for RBVs segmentation has been experimented on various public databases (such as: DRIVE, ARIA_d and MESSIDOR) and the values are computed. In this paper, the results are represented by segmented output and the ROC curve. This work is compared to existing approaches in the literature with different metrics (accuracy, sensitivity, specificity, sensibility, Dice coefficient and Jaccard coefficient). The detailed description about the database, results and performance evaluation have been discussed in Sub-section 3.1, 3.2, 3.3, respectively.
Databases
DRIVE database [25] has a collection of 40 color fundus images in JPEG format having a dimension of 768 × 584, extracted from DR screening program in Netherlands. All the data is captured by a 3CCD camera (Canon CR5 non-mydriatic) with a 45° field of view (FOV). All the images are grouped into training and test sets consists of equal number of images. For both the groups, two sets of GT for blood vessels are available.
ARIA database [24] was launched in the year 2006, as a product of collaborative research by Department of Ophthalmology, Clinical Sciences, University of Liverpool Liverpool, UK and St. Paul’s Eye Unit, Royal Liverpool University Hospital Trust Liverpool, UK. The images in the database have a resolution of 768 × 576 captured by Zeiss FF450 fundus camera. All the images are divided into three groups, out of which, 92 correspond to age-related macular deneration (AMD), 59 are related to diabetes and the remaining fall into control group. The GT for the blood vessels is available for all the images.
MESSIDOR database [1] contains 1200 retinal images (grouped into 10 sets) obtained from three different opthalmology departments. A non-mydriatic 3CCD camera (TopCon TRC NW6) was availed to capture the images with a 45° FOV. Three different resolutions (1440 × 960, 2240 × 1488, 2304 × 1536) are available in TIFF format for the images.
Table 1 explains the comparison between the above mentioned databases along with some other publicly available databases such as: STARE, Digital Retinal Images for Optic Nerve Segmentation Database (DRIONS-DB) and ImageRet. The GT for OD is only available for DRIONS-DB. Whereas, GT for the RBVs is not presented by the research group for ImageRet [10].
Retinal image databases
Retinal image databases
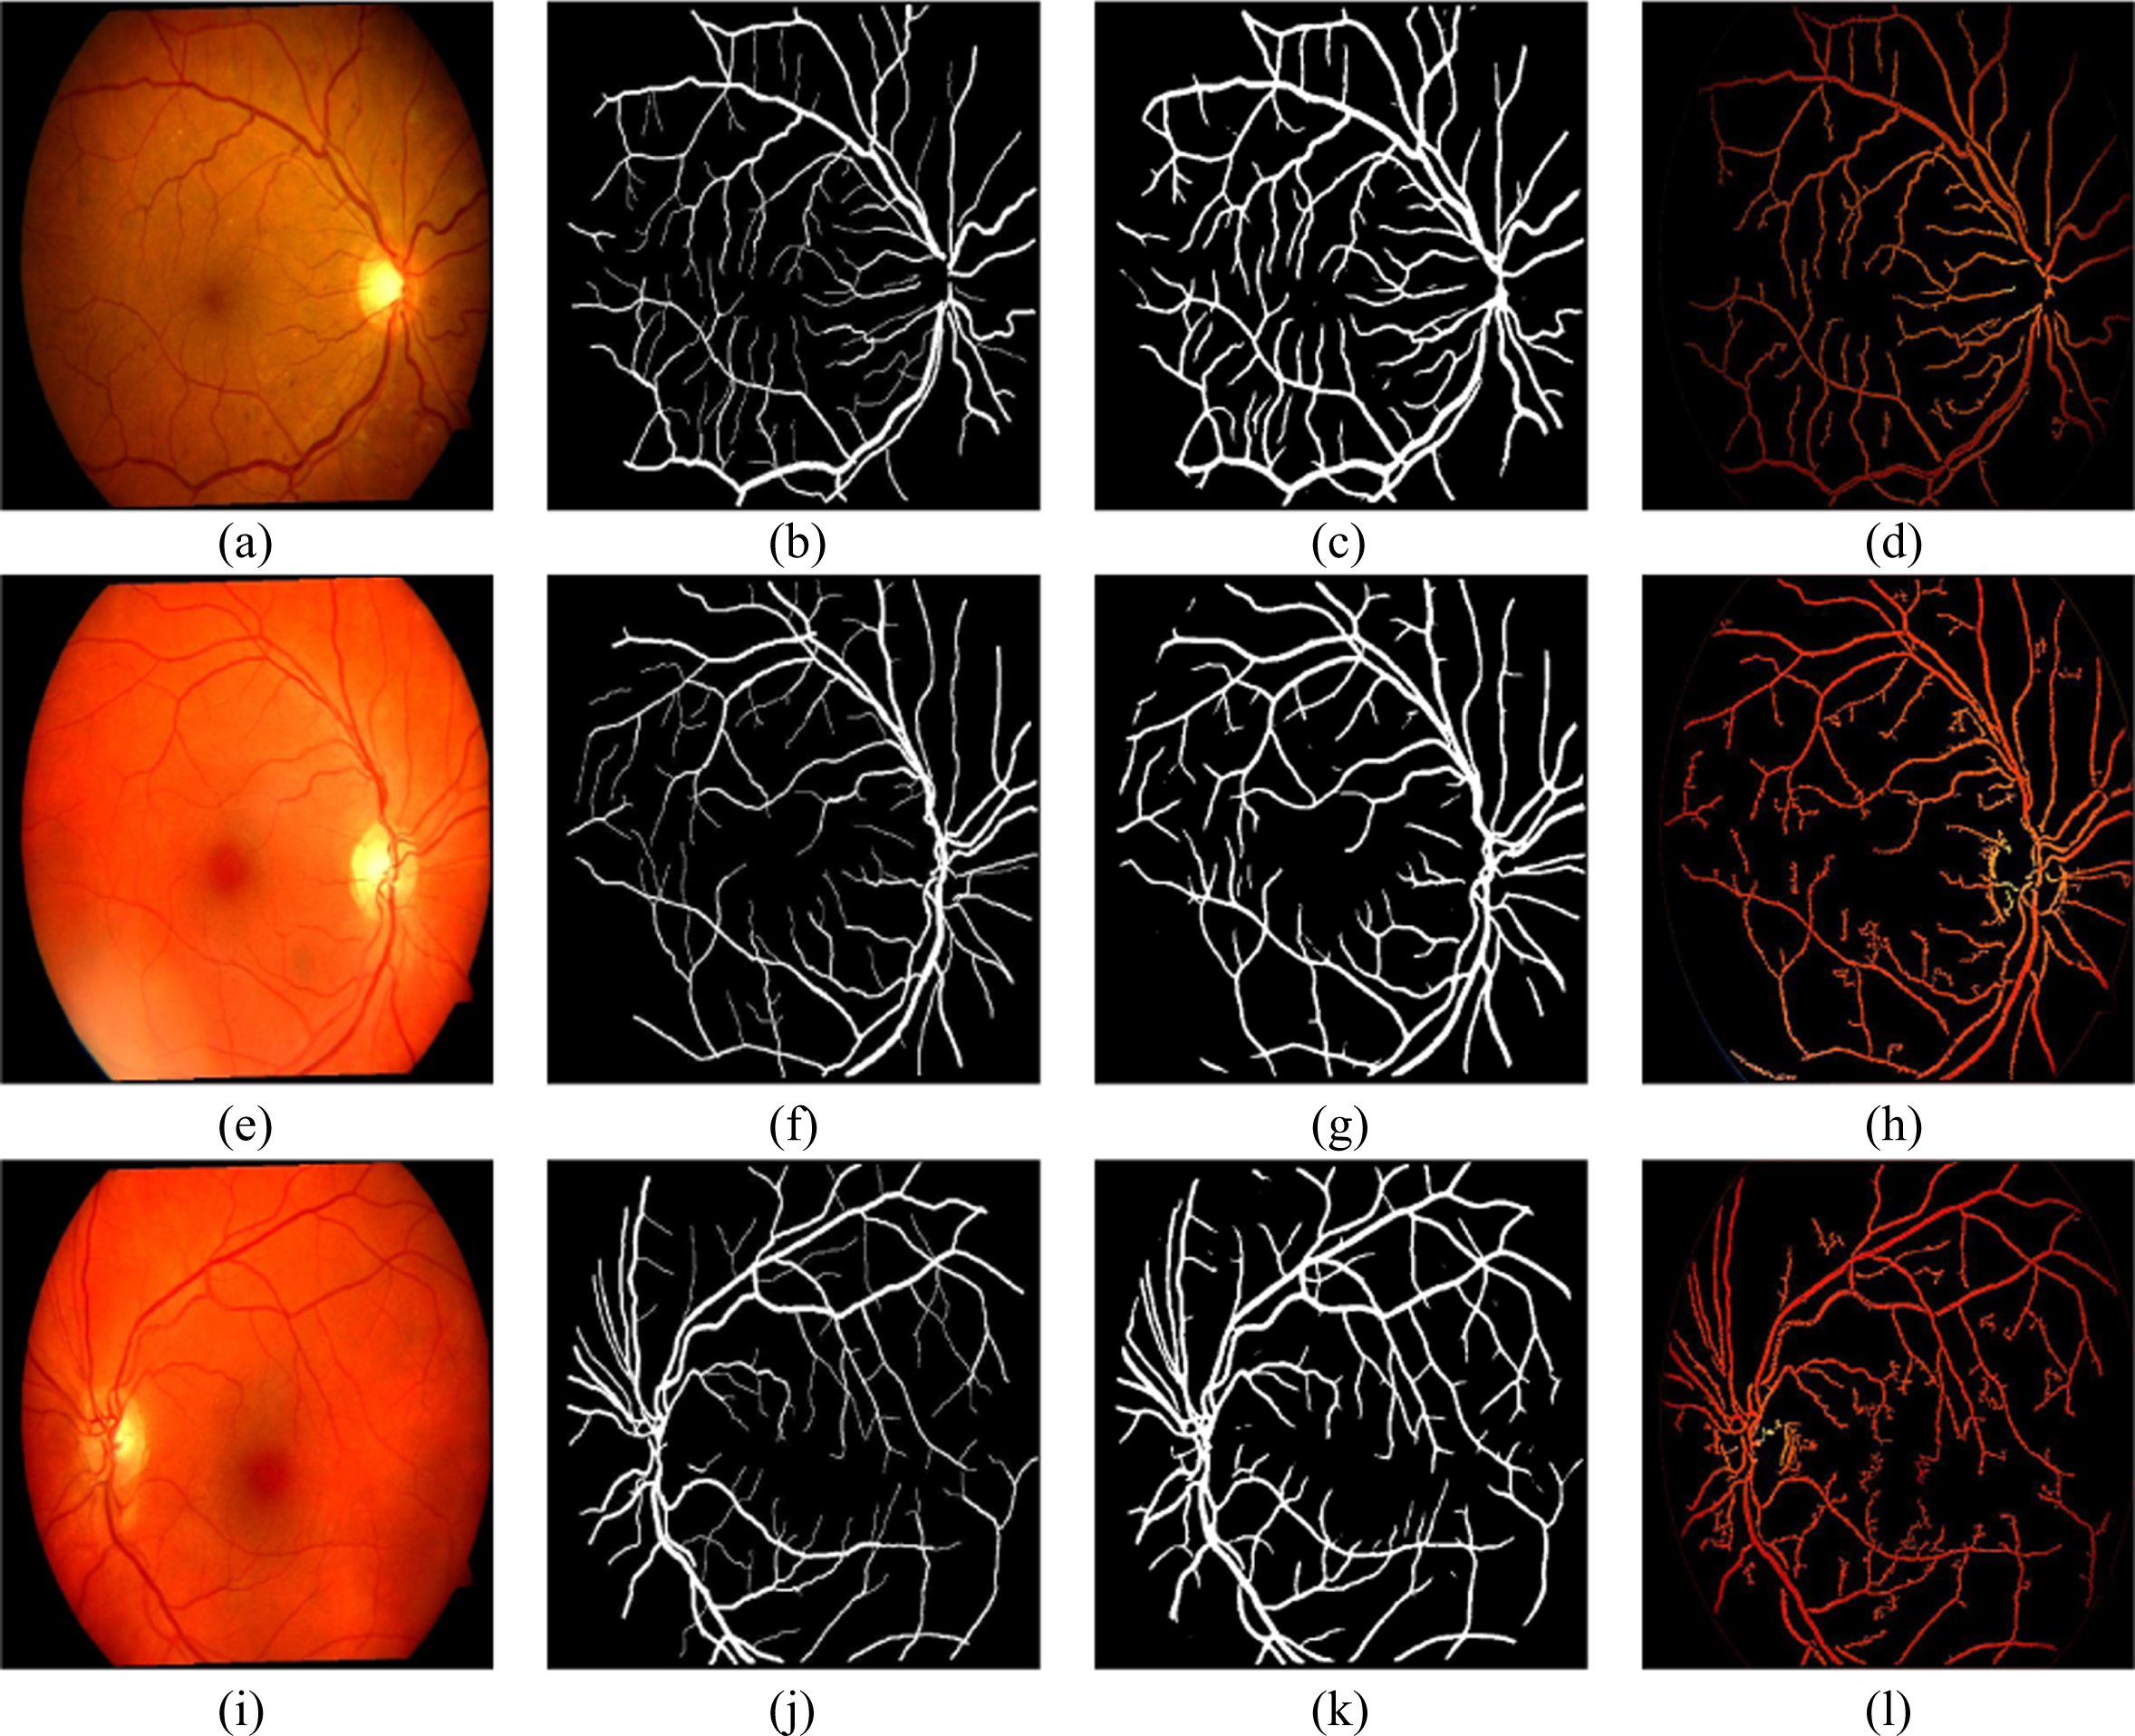
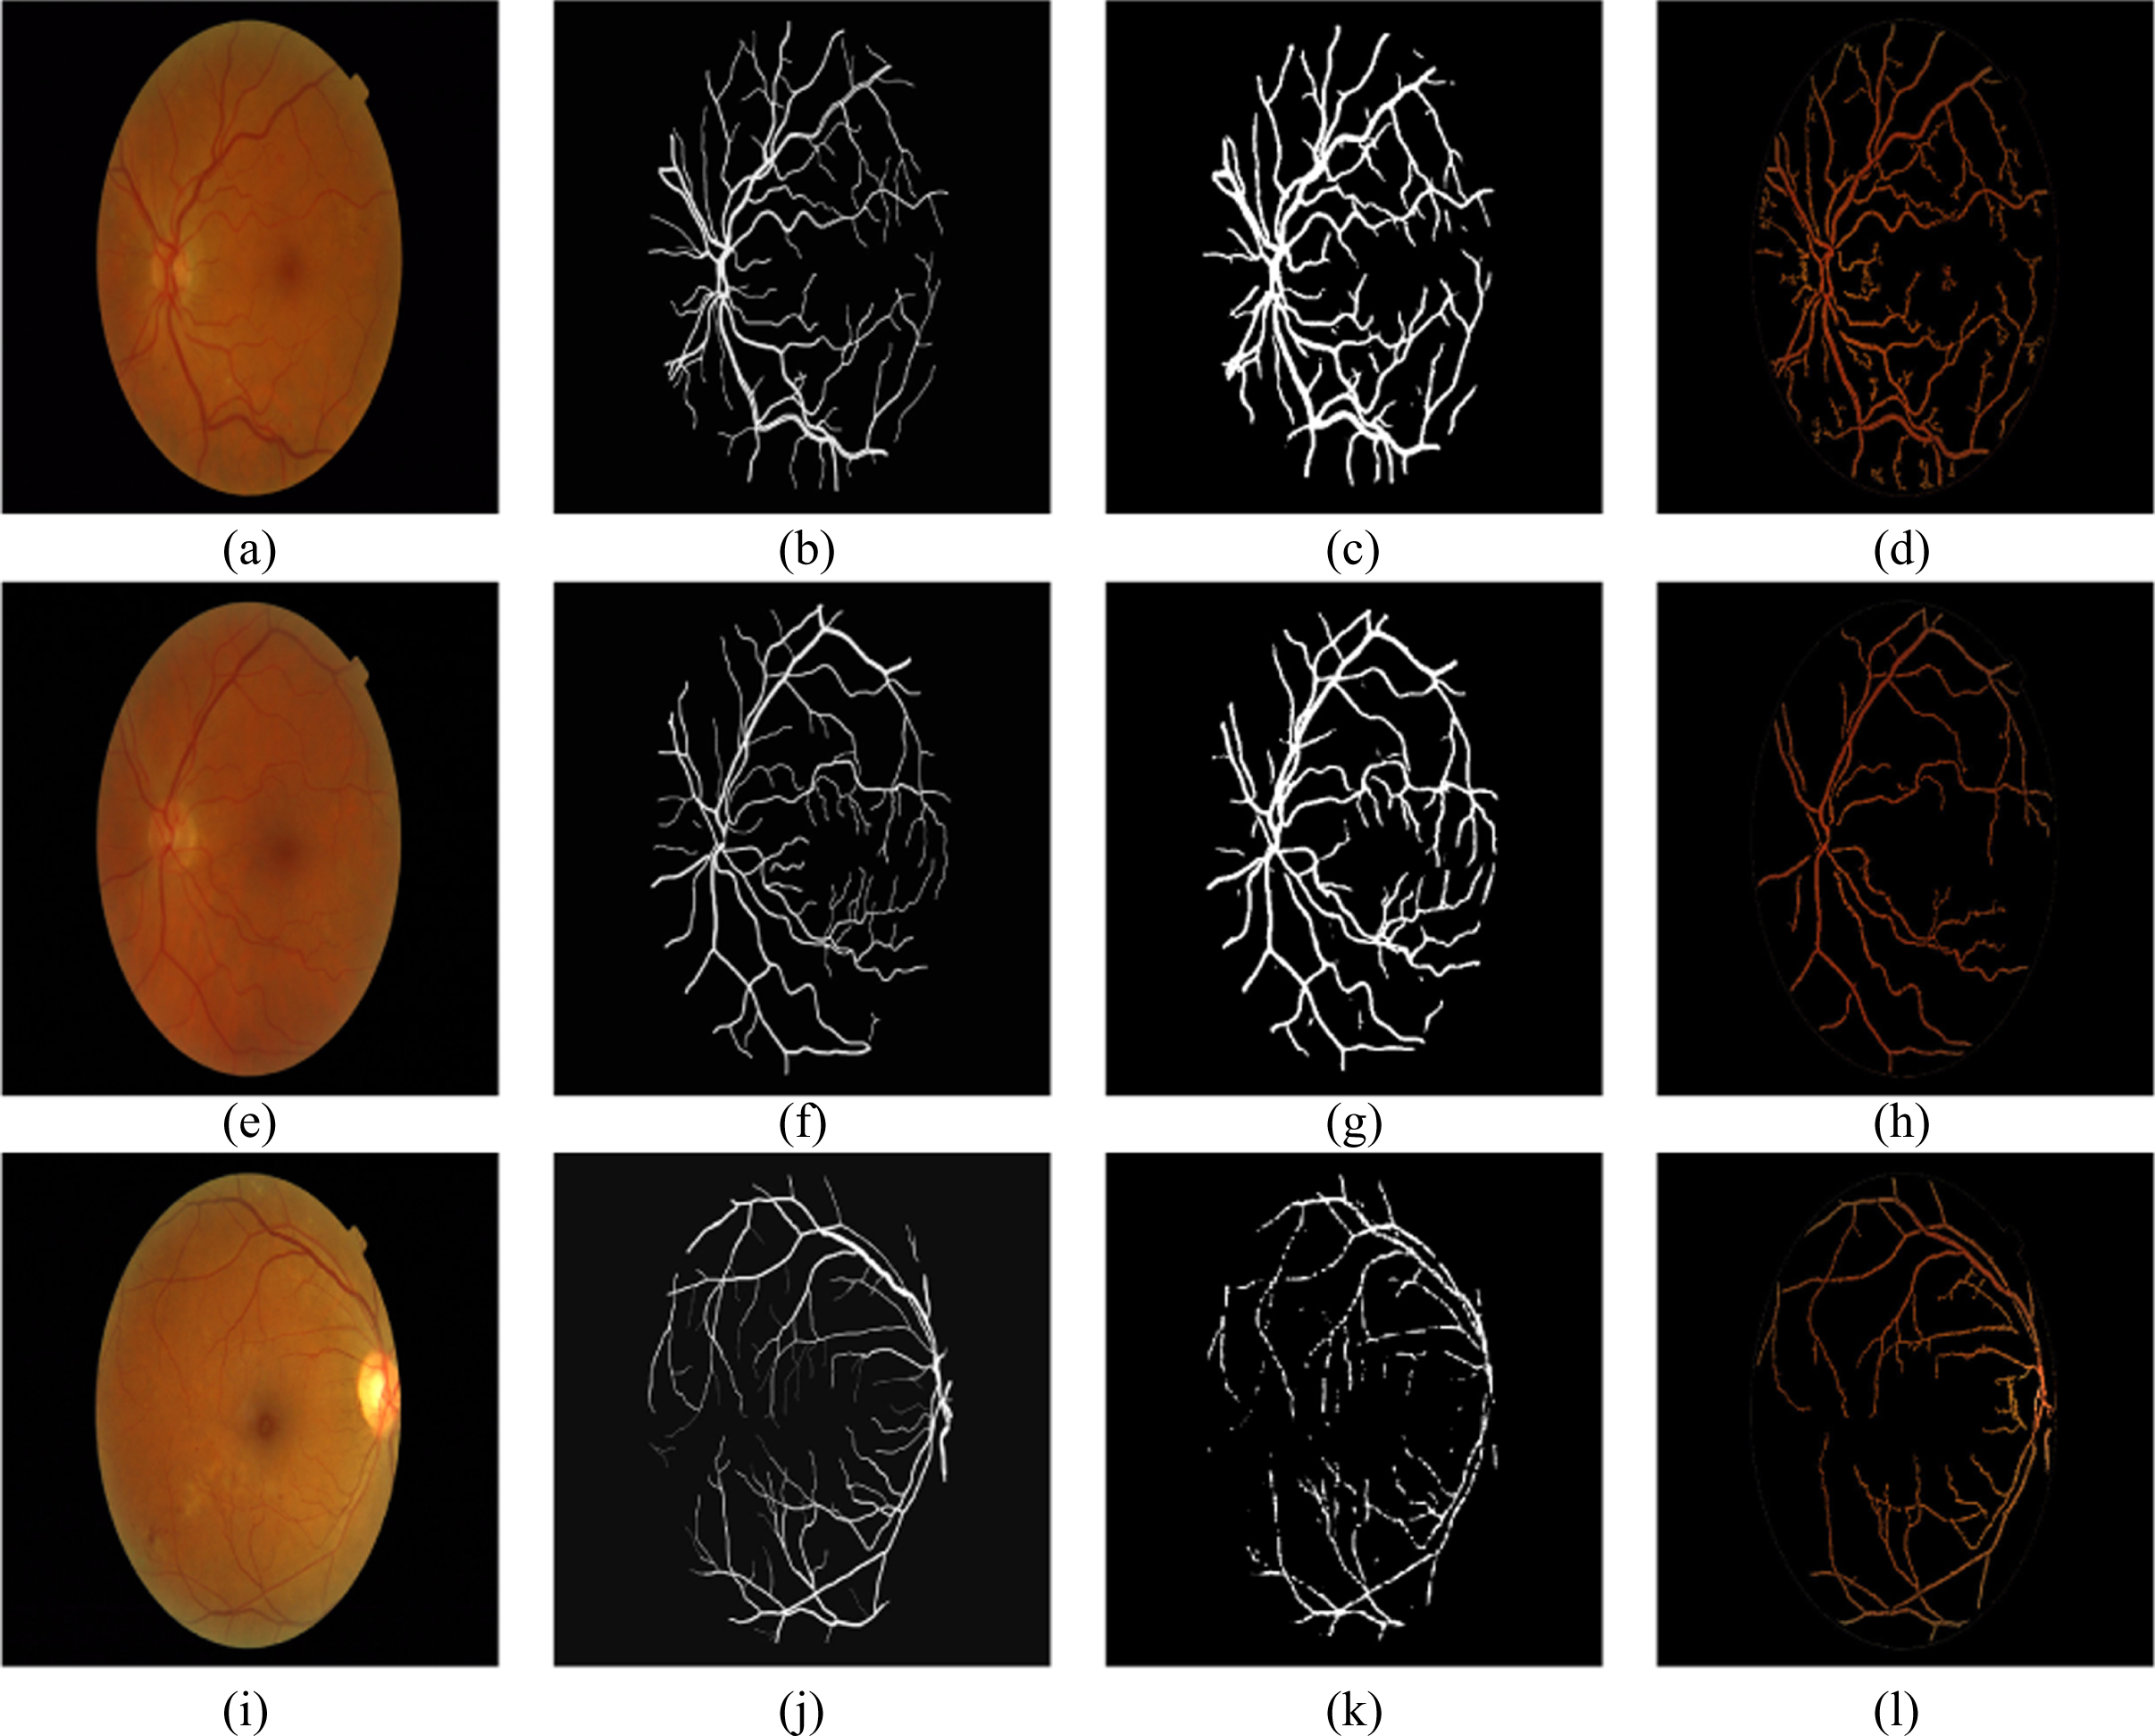
The data from the available databases (ARIA d, DRIVE and MESSIDOR) are passed into MSRI classification block for separating into HQ and LQ images. These HQ images are given to the proposed 19-layer U-Net architecture for the segmentation of RBVs. The segmented RBVs obtained from the U-Net architecture are shown in Figs. 4, 6 and 7. These segmented outputs are compared with the segmented outputs obtained by Coye Tyler in the year 2015 [27]. The segmented output results for our approach and the Coye Tyler method are shown in Fig. 4, Fig. 5, Fig. 6 and Fig. 7. The column 1 and column 2 of the above mentioned figures represent the original image and the corresponding GT for blood vessels, respectively. The segmented output obtained by our approach and Coye Tyler method are given in column 3 and column 4, respectively. It is visible from the segmented blood vessels that our approach segments more number of blood vessel pixels compared to the Coye Tyler method. Figure 4. shows the results for DRIVE database. Whereas, Fig. 5 and Fig. 6 shows the results for ARIA_d and MESSIDOR databases. Figure 7 specifically shows the results for pathological images of ARIA_d database. From the visual inspection by the experts, it is observed that our method is able to separate the fine and tiny blood vessels without any outliers. It hardly noticed any differences by comparing the segmented output with the GT as shown in Figs. 4, 6 and 7.
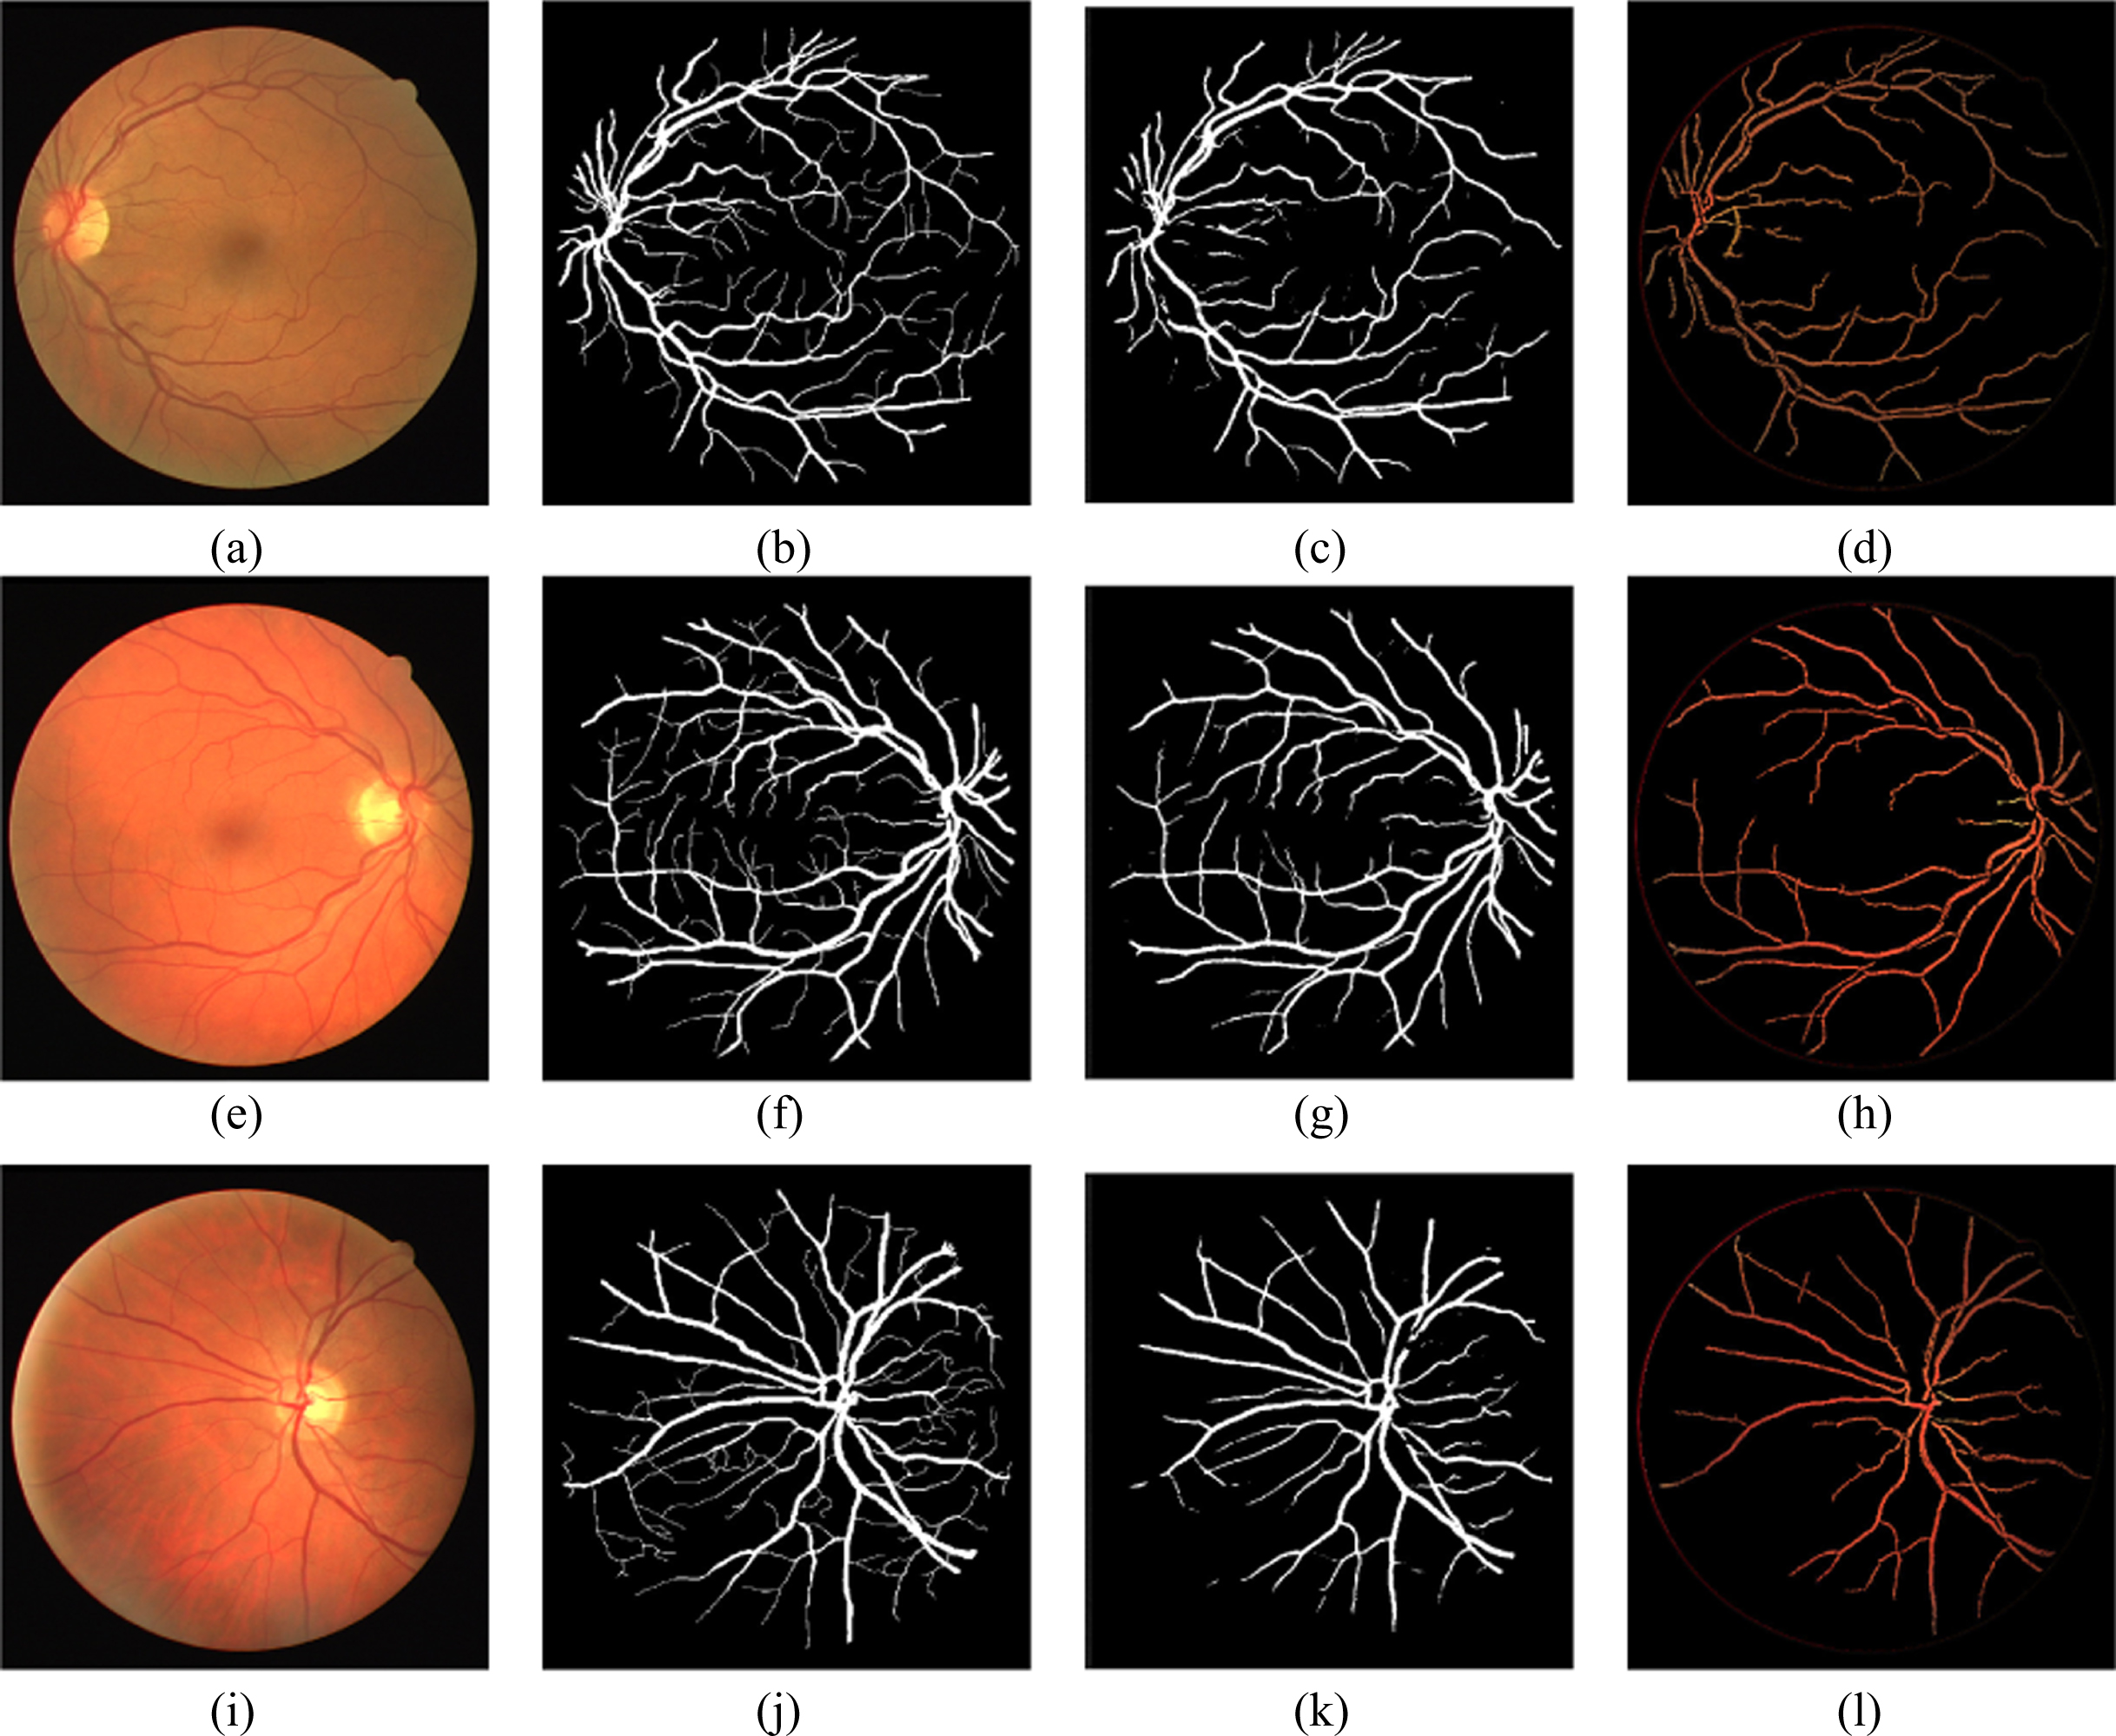
Original, ground truth, segmented images (proposed U-Net) and segmented images (Coye Tyler) of DRIVE.
Original, ground truth, segmented images (proposed U-Net) and segmented images (Coye Tyler) of ARIA_d.
Original, ground truth, segmented images (proposed U-Net) and segmented images (Coye Tyler) of MESSIDOR.
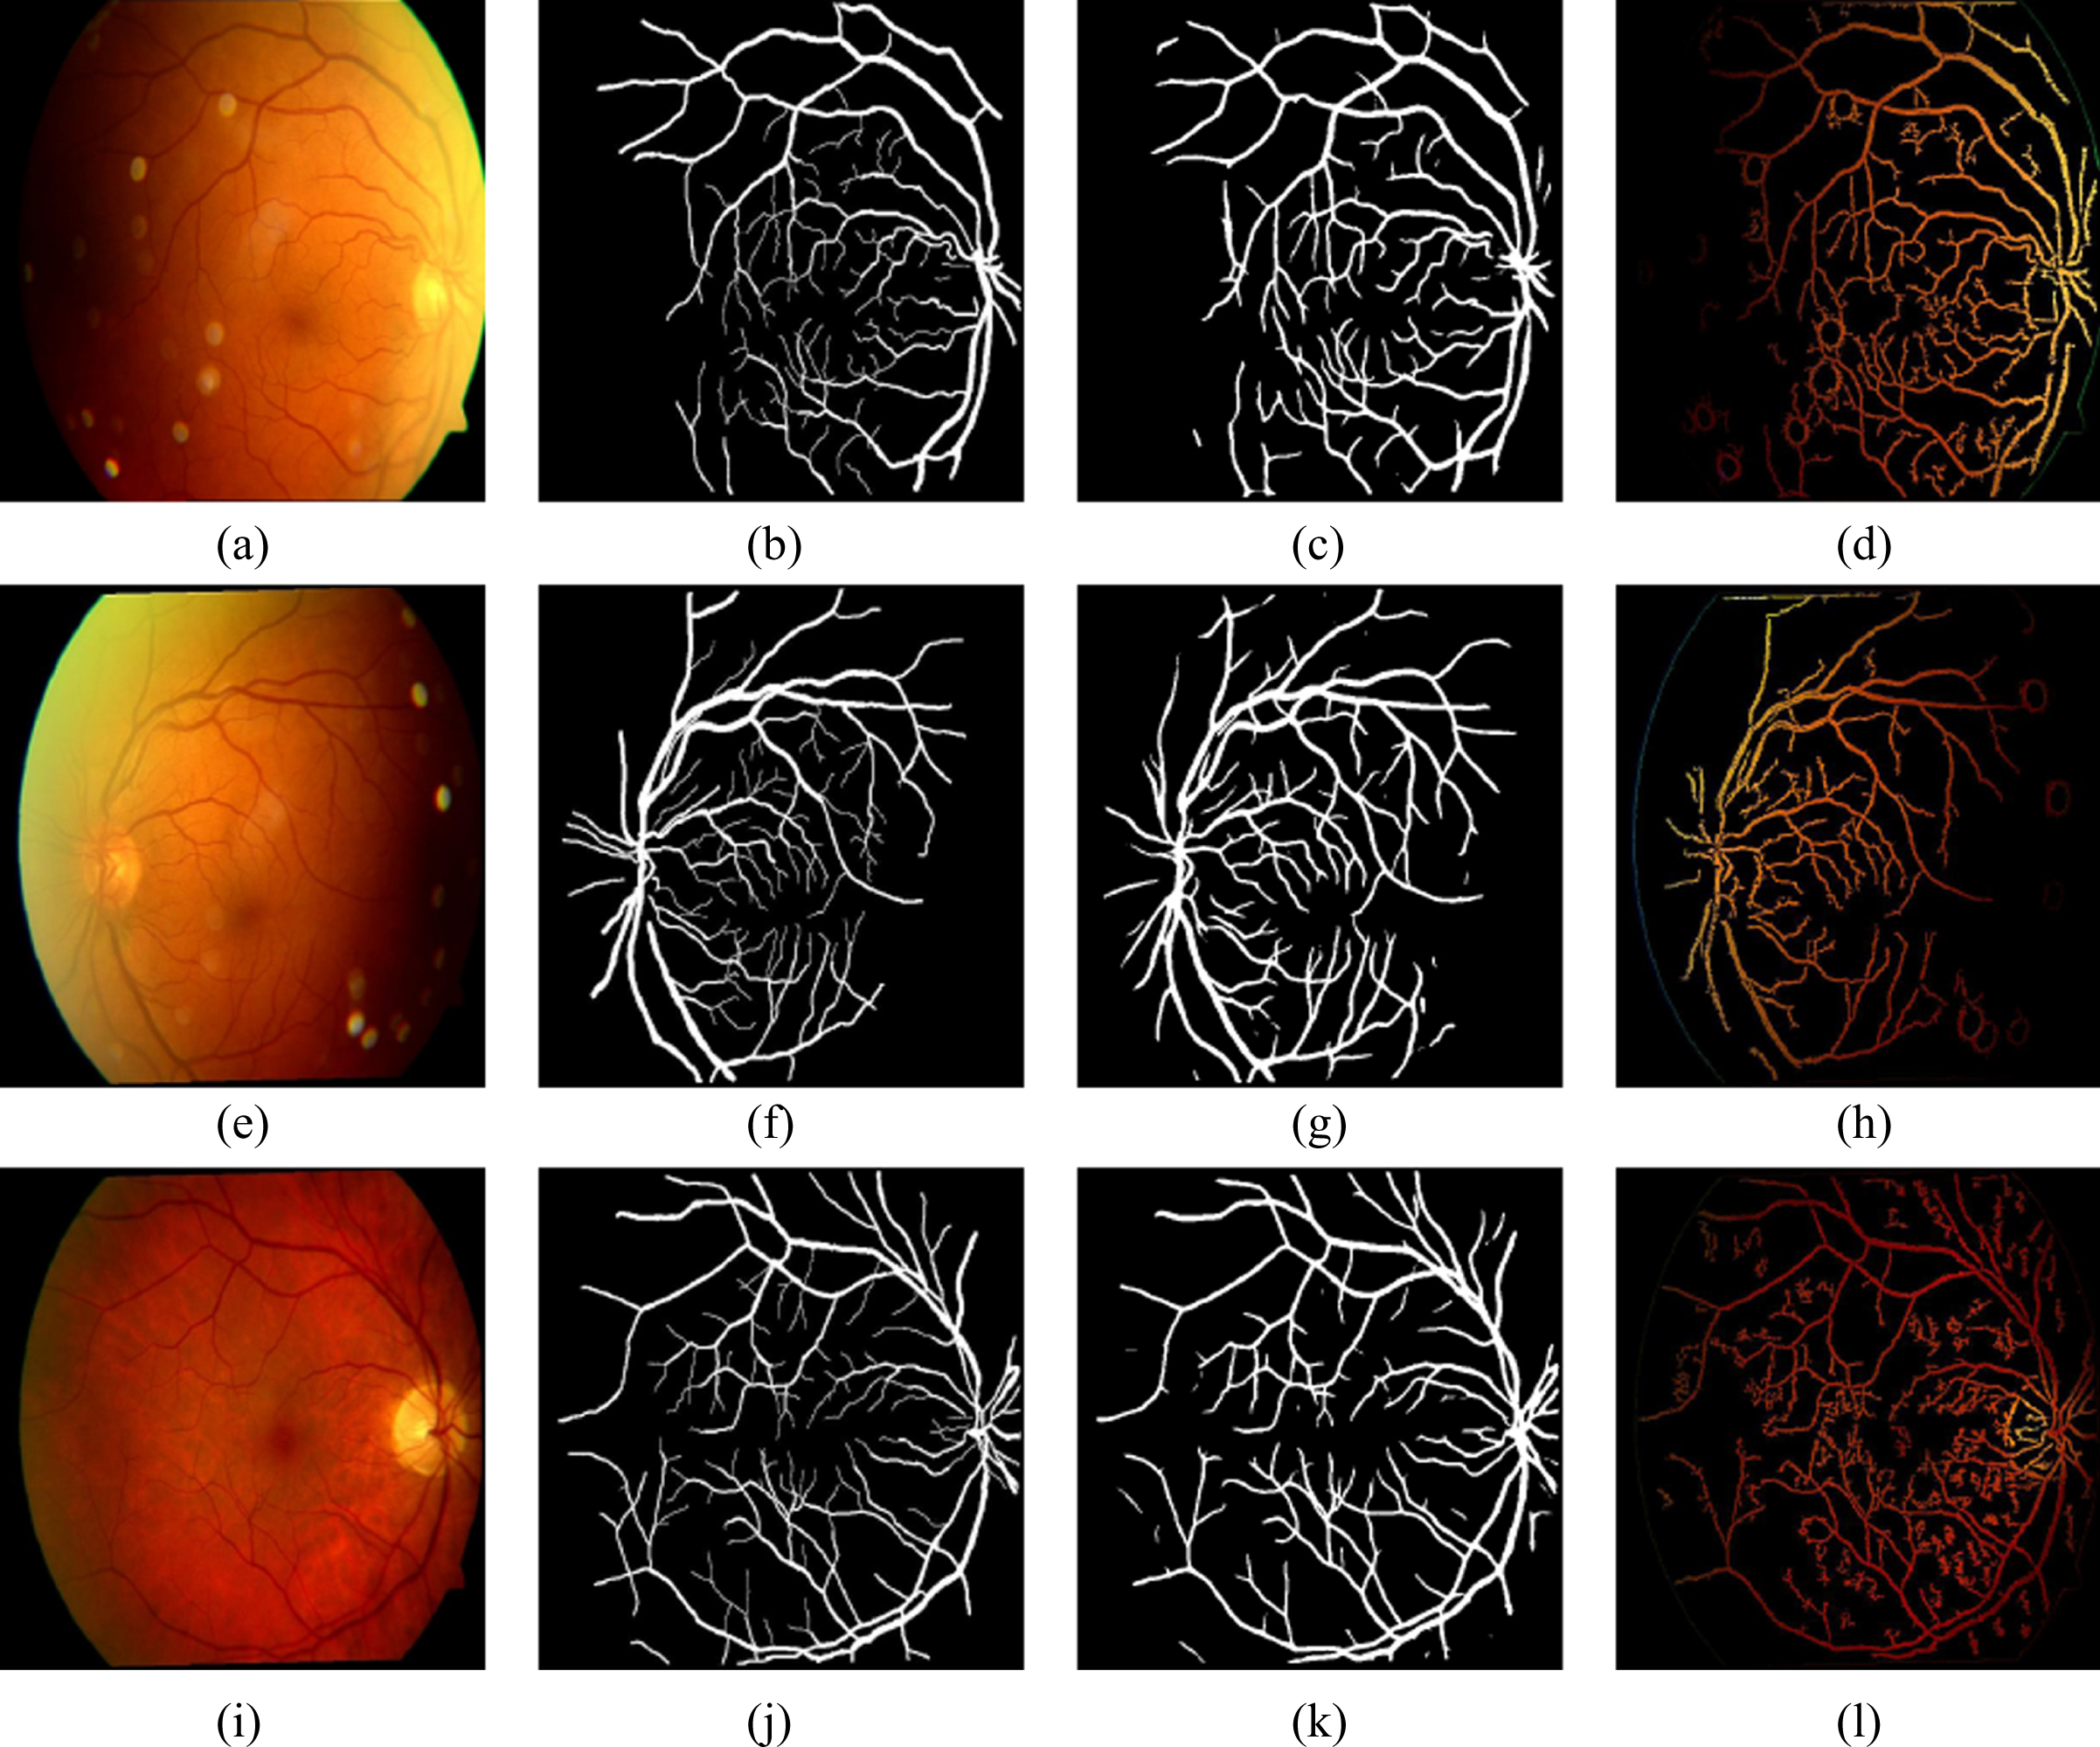
Original, ground truth, segmented images (proposed U-Net) and segmented images (Coye Tyler) of pathological images of ARIA_d.
The quality of segmentation is evaluated quantitatively by performance metrics (accuracy, sensitivity, specificity, sensibility, Dice coefficient and Jaccard coefficient [17]). These metrics are obtained by the computation of true positive (TP), false positive (FP), true negative (TN) and false negative (FN). TP represents the number of blood vessel pixels present in segmented image and GT image. Whereas, FP represents the blood vessel pixel count detected in the image that is segmented, but actually not present in the GT image. The number of pixels correctly excluded is represented by TN. The left out blood vessel pixel count is called FN.
The total number of right predictions achieved by model over the total number of predictions is represented by accuracy and is given in Equation (5). Sensitivity, known as true ratio is represented as the ratio of rightly classified blood vessel pixels to the entire number of blood vessel pixels present in the GT. It is also coined as recall and provided in Equation (6). Specificity represents the ratio of correctly excluded background pixels to the total number of background pixels present in the GT, which is represented in the Equation (7). Sensibility is represented as the ratio of number of false pixels to the number of non-vessel pixels in the GT and represented in Equation (8). The representation for Jaccard coefficient (KJ) is given in Equation (9), where ζ is called discrepancy concordance ratio which is represented as ratio of total error (sum of FP and FN) to the true positive. The expression for the Dice coefficient (KD) is given in Equation (10). The above mentioned metrics have been calculated for the proposed method and the Coye Tyler method by experimenting on DRIVE, ARIA_d and MESSIDOR databases and the mean values are represented in Tables 2, 3 and Table 4. The performance metrics for the databases have been computed for various number of epochs. It is observed the highest AUC for drive database is obtained at epoch 20. As number of epochs crosses this limit, the performance of the model degrades. For epoch 20 the accuracy is noticed to be 90.60%. The same procedure for various epochs has been repeated for ARIA_d and MESSIDOR databases. For ARIA_d highest AUC is noticed at epoch 10. For the same epoch it provides an accuracy of 87.86%. For MESSIDOR database the accuracy is found to 83.42% for epoch 1. This experiment is also conducted without pre-processing (MSRI block). Without MSRI block the DRIVE database provides a highest AUC of 98.36% for epoch 30. But, with MSRI the highest AUC for DRIVE database is obtained at epoch 20, which significantly shows the computational efficiency of the proposed method. Similarly, it is found that highest AUC for ARIA_d is obtained at epoch 100. For MESSIDOR databases the AUC with pre-processing and without pre-processing are found to be same. This is happened due to the availability of better quality images. It is observed that, our approach with MSRI block performs better than the Coye Tyler method with an highest accuracy of 90.60% for epoch 20, 87.86% for epoch 10 and 83.42% for epoch 1 on DRIVE, ARIA_d and MESSIDOR databases, respectively.
Performance metrics for blood vessel segmentation with MSRI
Performance metrics for blood vessel segmentation with MSRI
Comparison of performance metrics (Coye Tyler [27] and proposed method)
To justify the quality of segmentation of the proposed method, the ROC plot (sensibility versus sensitivity) is plotted and the area under the curve is measured. The ROC curves are shown in Fig. 8 for DRIVE, ARIA_d and MESSIDOR databases. The highest AUC of the proposed U-Net architecture without MSRI is observed to be 98.36% for epoch 30, 92.48% for epoch 100 and 88.18% for epoch 1 on DRIVE, ARIA_d and MESSIDOR databases. The highest AUC with MSRI block, among the computed epochs is observed to be 98.54% for epoch 20, 93.28% for epoch 10 and 88.18% for epoch 1 on DRIVE, ARIA_d and MESSIDOR databases, respectively. The results shown above, conclude that our approach with MSRI block outperforms the Coye Tyler method.
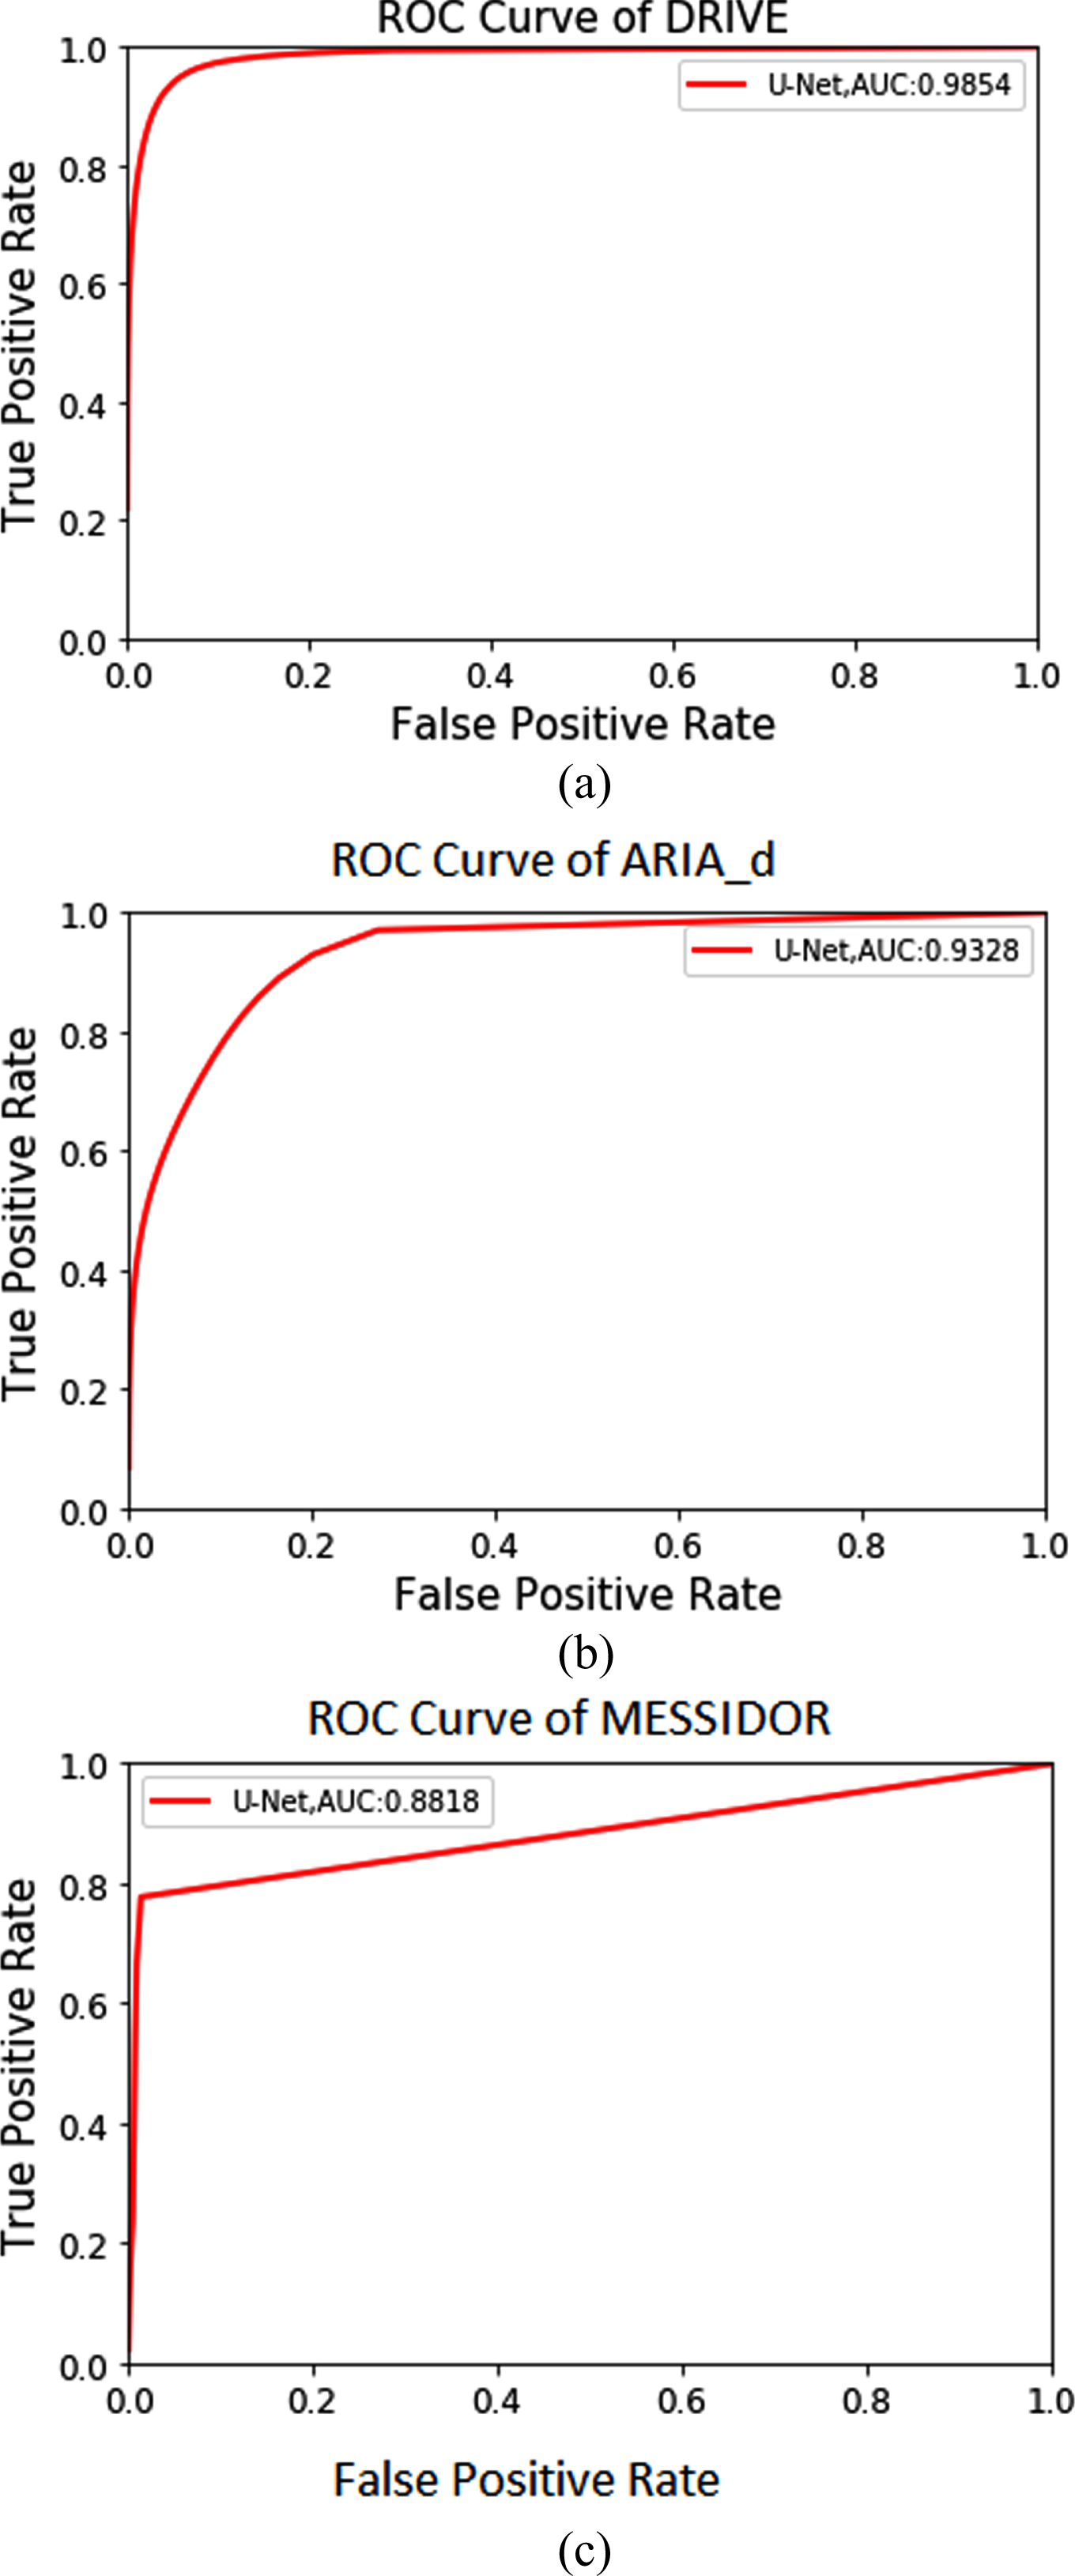
ROC plots for segmentation of blood vessels: (a) DRIVE, (b) ARIA_d, (c) MESSIDOR.
The proposed DL based (U-Net) approach for efficient segmentation of RBVs is divided into two levels. Level-1, MSRI classification, which is based on AlexNet architecture for identifying the high quality images and these images are fed into 19-layer U-Net architecture for segmentation of RBVs in level-2. From the fundus images, the blood vessels are extracted finely using above approach, which leads to improvement in performance. Our method, has attained accuracies of 90.60%, 87.60% and 83.42% for DRIVE, ARIA_d and MESSIDOR databases, respectively. And the area under curve in ROC plot is observed to be 98.54%, 93.28% and 88.18% for DRIVE, ARIA_d and MESSIDOR databases, respectively. Segmented blood vessels are found to be in the exact positions with the GT images. From this, it is concluded that our approach outperforms the existing methods. Due to the above mentioned reasons, it may be clinically practiced for the segmentation of RBVs to identify the retinal conditions.