
Abstract
An approximation space (A-space) is the base of rough set theory and a fuzzy approximation space (FA-space) can be seen as an A-space under the fuzzy environment. A fuzzy probability approximation space (FPA-space) is obtained by putting probability distribution into an FA-space. In this way, it combines three types of uncertainty (i.e., fuzziness, probability and roughness). This article is devoted to measuring the uncertainty for an FPA-space. A fuzzy relation matrix is first proposed by introducing the probability into a given fuzzy relation matrix, and on this basis, it is expanded to an FA-space. Then, granularity measurement for an FPA-space is investigated. Next, information entropy measurement and rough entropy measurement for an FPA-space are proposed. Moreover, information amount in an FPA-space is considered. Finally, a numerical example is given to verify the feasibility of the proposed measures, and the effectiveness analysis is carried out from the point of view of statistics. Since three types of important theories (i.e., fuzzy set theory, probability theory and rough set theory) are clustered in an FPA-space, the obtained results may be useful for dealing with practice problems with a sort of uncertainty.
Introduction
Research background and related works
Uncertainty mainly contains fuzziness, randomness and incompleteness, which can be seen everywhere in life and result from the imperfection imprecision or imperfection of knowledge. It can be applied in many areas, for example medical diagnosis, information retrieval and data mining.
Rough set theory, an important tool to deal with uncertainty, proposed by Pawlak [27]. This theory has been widely used [10, 33].
An approximation space (A-space) is a fundamental concept in this theory, which consists of a given universe and its equivalent relation.
Fuzziness is one important aspect to describe uncertain information. Fuzziness is not considered in Pawlak’s rough set model. To extend this model, some scholars studied the combination of rough set theory and fuzzy set theory [8]. Mieszkowicz-Rolka et al. [25] obtained fuzzy rough set model with variable precision. Beaubouef et al. [2] looked into fuzzy rough set techniques for uncertainty processing in a relational database. Radzikowska et al. [31] inquired into a more general method to fuzzify rough sets. Chen et al. [5] put forward the roughness of fuzzy rough sets. Liu. [19] provided axiomatic systems for the unity of rough sets and fuzzy rough sets. Chen et al. [4] gave a feature selection mechanism for fuzzy rough sets.
As an A-space under the fuzzy environment, a fuzzy approximation space (FA-space) is the basis of fuzzy rough set theory. With the application of a rough approximation in fuzzy environment, more and more researches on fuzzy generalization of a rough approximation are carried out [35, 36].
Uncertainty measurement, a significant research topic, has an extensive application in many areas, such as data mining [9], medical diagnosis [15], feature selection [39], pattern recognition [3, 14] and machine learning [41]. Many scholars have made some profound explorations on uncertainty measurement and obtained some important research results. Shannon [32] obtained a notion of entropy for the measurement of random variables. Since the concept of entropy was introduced, entropy theory has gradually become the main research method to measure the uncertainty of rough sets or information systems. Many generalizations of Shannon’s entropy have been presented. For example, Yao. [44] provided a granularity measure from granulation’s point of view. Wierman. [37] considered the measure of granularity in rough set theory. Dai et al. [7] investigated entropy measures and granularity measures for set-valued information systems. Liang et al. [22] researched information granules and entropy theory in an information system. Dai et al. [6] inquired into uncertainty measures like entropy and granularity for covering rough set models. Li et al. [21] gave entropy measurement based on Gaussian kernel for a fully fuzzy information system; Xie et al. [40] studied some new measures of uncertainty for an interval-valued information system. Li et al. [24] researched information entropy in a fuzzy relation information system.
Motivation and contributions
Although many scholars have studied FA-spaces, most of their studies are based on the fact that the probability distribution of objects in the universe is uniform. Obviously, the existence of any object in the universe has a probability distribution [13]. This also means that their research can not fully reflect the essence of things. Therefore, in order to solve this problem, we study the combination of a probability distribution and an FA-space.
In order to better integrate probability distribution into an FA-space, we represent the fuzzy equivalent relationship generated by attribute subset with a relationship matrix. By putting probability distribution into fuzzy relationship matrix, we propose a new expression of fuzzy relationship matrix, which includes not only the similarity between objects but also the probability distribution of objects. Thus, we obtain a fuzzy probability approximation space (FPA-space), which can also be regarded as a special an FA-space containing three kinds of uncertainties: fuzziness, randomness and roughness. Then, we study the uncertainty of FPA-spaces, and consider new methods to express fuzzy information granulation, fuzzy information quantity, fuzzy rough entropy and fuzzy information entropy by relation matrix and probability distribution. In addition, it is proved that when the probability distribution of objects is uniform, the four methods will degenerate into the measurement of general FA-spaces. This also verifies the rationality of these methods.
At present, the real data that is applied to FPA-spaces can not be found temporarily. Thus, we make the experimental analysis of these four measures through an example. In this example, we use MATLAB to randomly generate 8 unequal fuzzy relation matrices, in which the similarity of objects is increasing. In addition, we regard probability as a parameter and analyze the effectiveness of the measurement of objects under different probability distribution. Through this experiment, we can not only mine the influence of similarity between objects on these measures, but also discover the influence of probability distribution on these measures. Although we lack real data testing, through these experiments, we can more comprehensively show the advantages and disadvantages of the obtained measures. The four measures proposed in this paper can not only be used to construct heuristic functions in feature selection, but also be applied to weight selection in multi-classifier systems. Therefore, it is of great significance to study the uncertainty measure of FPA-spaces.
Comparison and discussion
In this part, we do comparison and discussion discuss by means of some references in order to see more clearly the innovations in this paper.
(1) Aggarwal. [1] considered not only the probability of objects, but also the randomness of membership grades. On this basis, Aggarwal proposed a probabilistic fuzzy domain information system (PFIS) and studied its entropy measure. Finally, Aggarwal studied a probabilistic variable precision rough set model. One of its main advantages is that this paper considered the probability related to fuzzy membership.
(2) Hu et al. [17] introduced probability into an FA-space and obtained an FPA-space theory. Then, they introduced shannon entropy to measure the information quantity in Pawlak’s A-spaces. Next, they also proposed a new representation of Shannon entropy from the point of relation matrix. Based on the modified formula, they obtained some generalizations of information entropy in FPA-spaces and FA-spaces, respectively.
(3) Based on the reflexive L-fuzzy relations, Qiao et al. [30] introduced the relationship between L-FA-spaces and L-fuzzy pretopological spaces from a categorical viewpoint.
(4) Yu [43] explored the upper and lower fuzzy sets generated by a given fuzzy relationship. Then, based on the upper and lower fuzzy information granules, Yu obtained two measures and then presented the average of the two measures as the uncertainty of FA-spaces. Moreover, Yu analyzed the effectiveness of the measures, and considered the relationships (namely, equality, dependence, independence and difference) between FA-spaces. Finally, Yu obtained the mathematical characteristics of FA-spaces.
(5) Yu et al. [45] studied the entropy measure of fuzzy relation with a probability distribution. This measure can not only calculate the diversity of information fusion systems, but also measure the uncertainty of granulated problem spaces. In addition, the weight vector of a multi classifier system is regarded as a probability distribution, and the uncertainty of the system is calculated by the measure. It is found that the weight of the classifier in a multi classifier system will affect the uncertainty of this fusion system. Therefore, the obtained measure can be used to solve the weight allocation problem of multi classifier systems.
(6) Zhang et al. [49] defined probability measure and Pythagorean fuzzy approximation operator. On this basis, they introduced plausibility and belief functions of a Pythagorean fuzzy information system. Then they also discussed the relationship between Pythagorean fuzzy belief structure and Pythagorean FA-spaces. Finally, they also proposed a reduction algorithm for Pythagorean fuzzy decision information systems.
(7) Zhang et al. [50] further explored the problems in β-fuzzy covering approximation space (β-FCAS). First, they put forward the concepts of I-reduct and I-irreducible element, which are a supplement to the existing concepts. Next, they studied the relationship between fuzzy β-covering and its I-reduct, and fuzzy β-minimal description and fuzzy β-reduct respectively. In addition, they also proposed some new notions between the two β-FCASs and their properties. Moreover, they introduced the condition that two fuzzy β-coverings have the same reduct by these obtained concepts. Finally, they further studied seven derivatives of β-FCASs and proposed corresponding lattices of them.
(8) In this paper, we first show how the probability distribution is combined with the fuzzy approximate relation, that is, the probability distribution is put into the fuzzy relation matrix, and the new expression of the fuzzy relation matrix is obtained. In addition, based on the obtained matrix, we study some new methods to express fuzzy information granularity, fuzzy information amount, fuzzy rough entropy and fuzzy information entropy. Finally, the effects of similarity and probability distribution on the four measures are analyzed by numerical experiments.
Organization
In this paper, we extract the probability of an FPA-space so that this FPA-space can induce the FA-space. In addition, give some tools for measuring uncertainty of an FPA-space.
The work process of this paper is shown in Fig. 1.

The work flow of this paper.
As shown in Figure 1, an FPA-space is firstly obtained by combining an FA-space with a probability distribution, which is also regarded as a special FA-space whose fuzzy relations include the probability distribution. Then, four tools for measuring uncertainty in FPA-spaces are studied. Finally, the validity of these four measurement methods is analyzed by an example.
The remaining part of this article is organized as follows. In Section 2, we recall some basic concepts about fuzzy relations and FPA-spaces, and obtain an FA-space by defining a fuzzy relation matrix. In Section 3, we study four tools to measure uncertainty in an FPA-space. In Section 4, we display a numerical experiment and do effectiveness analysis. In Section 5, we make a summary of this paper.
In this section, we mainly present some notions about fuzzy sets, fuzzy relations and FPA-spaces.
In this paper, U expresses a non-empty finite set and I indicates [0, 1] . Put
Fuzzy relations
F is reputedly a fuzzy set whenever F is a function defined by F : U → I .
For a ∈ I,
Throughout this paper, I U indicates the collection of fuzzy sets on U .
Let F ∈ I
U
. Then F is denoted as
If R is a fuzzy set in U × U, then R is said to be a fuzzy relation on U .
In this article, IU×U show the collection of all fuzzy relations on U .
Put R ∈ IU×U . Then R can be expressed by the following matrix ([43])
Suppose R ∈ IU×U. Then R is called reflexive, if R (x, x) =1 for any x ∈ U; R is called symmetric, if R (x, y) = R (y, x) for any x, y ∈ U; R is called transitive, if R (x, z) ≥ R (x, y) ∧ R (y, z) for any x, y, z ∈ U.
If R is reflexive and symmetric, then R is called tolerance; if R is reflexive and transitive, then R is called similarity; if R is reflexive, symmetric and transitive, R is called equivalence. Moreover, if M (R) = E (here, E is an identity matrix), then R is called a fuzzy identity relation on U, and we mark it as R =▵ ; if R (x i , x j ) =1 for any i, j, then R is called a fuzzy universal relation on U, and we mark it as R = ω .
Below, we give some operations and relations on IU×U [46].
Put R, R′ ∈ IU×U with
(1) R = R′ ⇔
(2) R ⊆ R′ ⇔
(3) R ⊂ R′ ⇔ R ⊆ R′ and R ≠ R′;
(4) ∀ i, j, M (≀ R) =1 - r ij .
Given R ∈ IU×U . For any x ∈ U, two fuzzy sets on U are defined as follows:
Obviously,
FPA-spaces
Let (U, P, R) be an FPA-space where
Define
Then R P is called the fuzzy relation induced by (U, P, R).
The matrix expression M (R P ) of the fuzzy relation R P contains not only the similarity between objects but also the probability distribution. Thus, R P reflects the internal characteristics of (U, P, R).
Suppose that (U, P, R) and (U, P, R′) are two FPA-spaces where
Obviously,
Uncertainty measurement for an FPA-space
In this section, we study four tools to measure the uncertainty of an FPA-space.
Granulation measurement for an FPA-space
(1) Upper-information granulation of (U, P, R) is defined as
(2) Lower-information granulation of (U, P, R) is defined as
(3) Information granulation of (U, P, R) is defined as
Clearly,
Given
Then
If
This example illustrates that G u (P, R) notapproxG l (P, R) . Thus, Definition 3.2 is reasonable.
Obviously, ∀ i, j, 0 ≤ r ij ≤ 1 .
This implies that ∀ i, j,
Then
Thus
(2) Suppose R = o. Then ∀ i, j, r ij = 0, so
(3) Suppose R = ω. Then ∀ i, j, r ij = 1, Thus
Hence G u (P, R) =1.□
Obviously, ∀ i, j, 0 ≤ r ji ≤ 1 .
This implies that ∀ i, j,
Then
Thus
(2) Suppose R = o. Then ∀ i, j, r ji = 0. So
Hence, G l (P, R) achieves the minimum value 0 when R = o.
(3) Suppose R = ω. Then ∀ i, j, r ji = 1, Thus
This implies that
Hence, G
l
(P, R) achieves the maximum value
(1) If T ⊂ Q, then G (P, T)< G (P, Q) ;
(2) If T ⊆ Q, then G (P, T) ≤ G (P, Q) .
Thus ∀ i, j, T P (x i , x j ) ≤ Q P (x i , x j ) and ∃ i′, j′, T P (xi′, xj′) < Q P (xi′, xj′) .
By Definition 3.2,
Hence G u (P, T) < G u (P, Q).
In the same manner, we can prove that G l (P, T) < G l (P, Q).
Hence, G (P, T) < G (P, Q).
(2) The proof is similar to (1) .□
The above theorem indicates that the information granulation increases when the FPA-space becomes coarser and decreases when the FPA-space becomes finer.
Entropy measurement for an FPA-space
Rough entropy measurement for an FPA-space
(1) Upper-rough entropy of (U, P, R) is defined as
(2) Lower-rough entropy of (U, P, R) is defined as
(3) Rough entropy of (U, P, R) is defined as
Given
Then
If
This example illustrates that (E r ) u (P, R) notapprox (E r ) l (P, R) . Thus, Definition 3.9 is reasonable.
∀ i, j,
So
This means that
Thus
Similarly, we can prove that
Hence
So
Thus
This shows that
Similarly, we can prove that
Hence
(3) Suppose R = ω. Then ∀ i, j, r
ij
= 1. So
Thus
(1) If T ⊂ Q, then E r (P, T) < E r (P, Q).
(2) If T ⊆ Q, then E r (P, T) ≤ E r (P, Q).
Thus ∀ i, j, T P (x i , x j ) ≤ Q P (x i , x j ) and ∃ i′, j′, T P (xi′, xj′) < Q P (xi′, xj′) .
By Definition 3.9,
Hence
Similarly, we can prove that (E r ) l (P, T) < (E r ) l (P, Q) .
Thus
(2) The proof is similar to (1).□
The above theorem indicates that the rough entropy increases when the FPA-space becomes coarser and decreases when the FPA-space becomes finer.
Information entropy measurement for an FPA-space
(1) Upper-information entropy of (U, P, R) is defined as
(2) Lower-information entropy of (U, P, R) is defined as
(3) Information entropy of (U, P, R) is defined as
Given
Then
If
This example illustrates that H u (P, R)≠H l (P, R) . Thus, Definition 3.14 is reasonable.
It should be noted that ∀ i, j, 0 ≤ r
ij
≤ 1 . Then
Thus ∀ i,
This implies that
Hence
(2) Suppose that R is reflexive. Then ∀ i, r
ii
= 1 . Thus
Thus
Hence
By (1),
(3) Suppose R = ω . Then ∀ i, j, r
ij
= 1 . Thus
This implies that H u (P, R) =0.Hence, H u (P, R) achieves the minimum value 0 when R = ω.□
It should be noted that ∀ i, j, 0 ≤ r
ji
≤ 1 . Then
Thus
This implies that
Hence
(2) Suppose that R is reflexive. Then ∀ i, r
ii
= 1 . This implies that
Thus
Hence
By (1),
(3) Suppose R = ω . Then ∀ i, j, r
ij
= 1 . Thus
This implies that
Hence, H
l
(P, R) achieves the minimum value
(1) If T ⊂ Q, then H (P, Q) < H (P, T).
(2) If T ⊆ Q, then H (P, Q) ≤ H (P, T).
So ∀ i, j, T (x i , x j ) ≤ Q (x i , x j ) and ∃ i′, j′, T (xi′, xj′) < Q (xi′, xj′) .
By Definition 3.14,
Then
Homoplastically, we have
Thus H u (P, Q) < H u (P, T) .
In the same manner, we can prove that H l (P, Q) < H l (P, T) .
Hence, H (P, Q) < H (P, T) .
(2) The proof is similar to (1) .□
The above theorem indicates that the information entropy increases while the FPA-space becomes finer; inversely, it decreases while the FPA-space becomes coarser.
Naturally, we can also consider other types of information entropy such as joint entropy, conditional entropy, cross entropy, relative entropy. Limited by space, this paper only gives their definitions and does not discuss them in depth.
(1) Upper-joint entropy of Q and T is defined as
(2) Lower-joint entropy of Q and T is defined as
(3) The joint entropy of Q and T is defined as
(1) Upper-conditional entropy of Q to T is defined as
(2) Lower-conditional entropy of Q to T is defined as
(3) The conditional entropy of Q to T is defined as
Obviously, H
u
(P, Q|T) = H
u
(P, Q ∪ T) - H
u
(P, T) , H
l
(P, Q|T) = H
l
(P, Q ∪ T) - H
l
(P, T) , H (P, Q|T) = H (P, Q ∪ T) - H (P, T) .
(1) Upper-cross entropy of Q and T is defined as
(2) Lower-cross entropy of Q and T is defined as
(3) The cross entropy of Q and T is defined as
(1) Upper-relative entropy of Q and T is defined as
(2) Lower-relative entropy of Q and T is defined as
(3) The relative entropy of Q and T is defined as
Clearly, H u (P, Q||T) = H u (P, Q, T) - H u (P, Q) , H l (P, Q||T) = H l (P, Q, T) - H l (P, Q) , H (P, Q||T) = H (P, Q, T) - H (P, Q) .
Information amount of an FPA-space
(1) Upper-information amount of (U, P, R) is defined as
(2) Lower-information amount of (U, P, R) is defined as
(3) Information amount of (U, P, R) is defined as
Given
Then
If
This example illustrates that E u (P, R) ≠ E l (P, R) . Thus, Definition 3.25 is reasonable.
(1) If T ⊂ Q, then E (P, Q) < E (P, T).
(2) If T ⊆ Q, then E (P, Q) ≤ E (P, T).
Thus ∀ i, j, T P (x i , x j ) ≤ Q P (x i , x j ) and ∃ i′, j′, T P (xi′, xj′) < Q P (xi′, xj′) .
By Definition 3.25,
Thus E u (P, Q) < E u (P, T).
In the same manner, we can prove that E l (P, Q) < E l (P, T).
Hence E (P, Q) < E (P, T).
(2) The proof is similar to (1).□
The above theorem indicates that the fuzzy information amount increases while the FPA-space becomes finer; inversely, it decreases while the FPA-space becomes coarser.
Then
So
Similarly, we can prove that G l (P, R) + E l (P, R) =1.
Thus
Examples and effectiveness analysis
In this section, we carry out effective analysis through examples from three sides of dispersion analysis, Friedman test and Nemenyi test, and association analysis in statistics.
Examples
In this subsection, some fuzzy relational matrices were randomly generated by MATLAB. To assess the influence of probability distribution on the proposed measures, we assume that the probability of only one object is different from the other objects. All the other objects have equal probability, and the equal probability increases from 0.02 to 0.14 with a step size of 0.02.
Obviously, ∀ j, k, P j (k) is a probability distribution where only the probability of occurrence on x k is different from the other elements. In addition, ∀ j, P j is a set make up of different probability distributions. So, the probability distribution in P1 has the highest concentration, while the probability distribution in P j (j ≠ 1) gradually decreases in turn. Therefore, for each j, k = 1, … 7, i = 1, … 8, (U, P j (k) , R i ) can be seen as an FPA-space. In the following experiment, we compare four tools for measuring the uncertainty of an FPA-space.
Uncertainty measurement for an FPA-space shows certain regularity on the fuzzy relation and the probability distribution, which is reflected in the following facts (see Figs. 2-8):
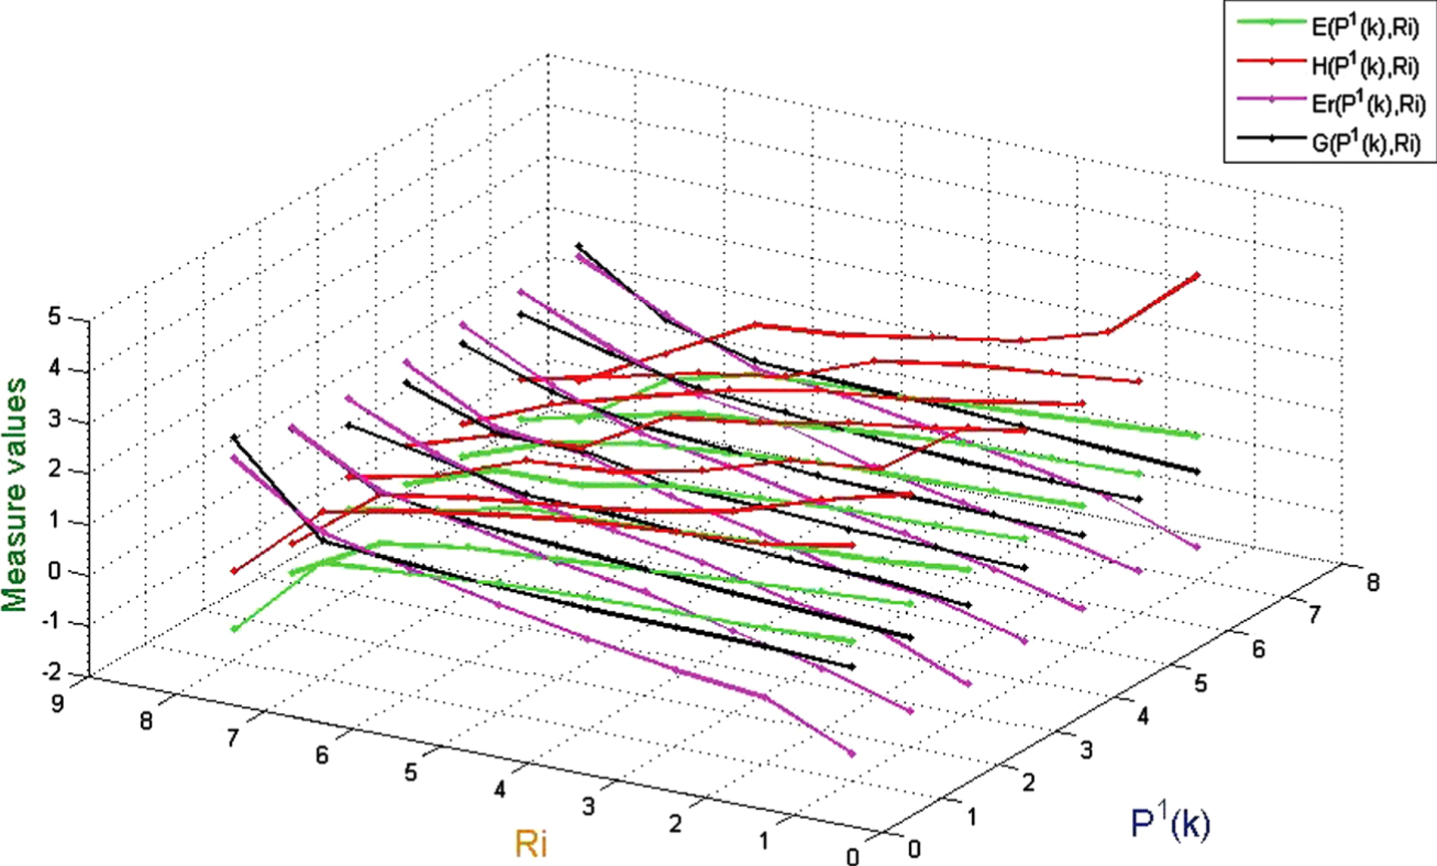
Values of uncertainty measurement on (U, P1 (k) , R i ).
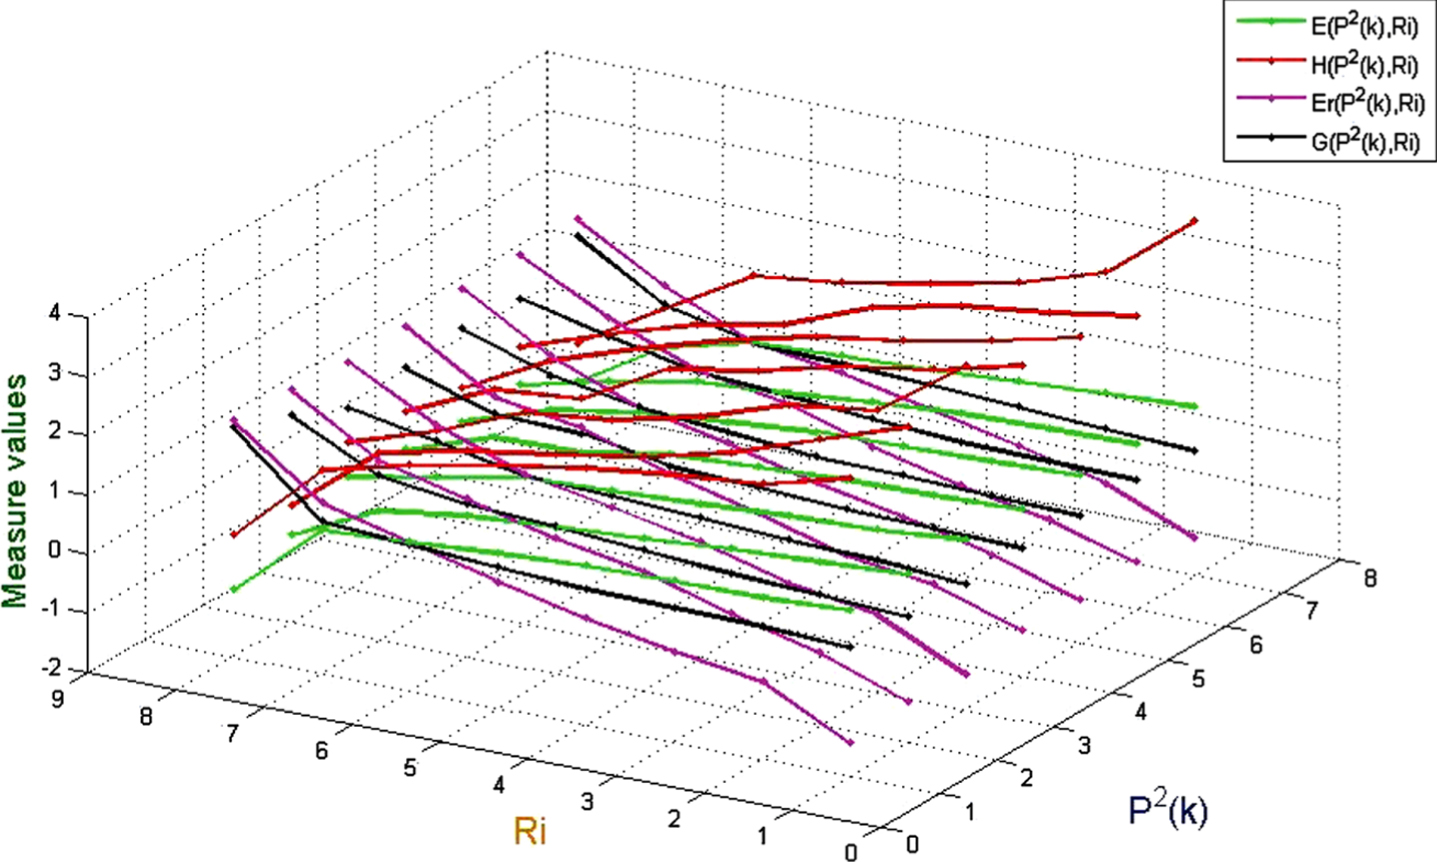
Values of uncertainty measurement on (U, P2 (k) , R i ).
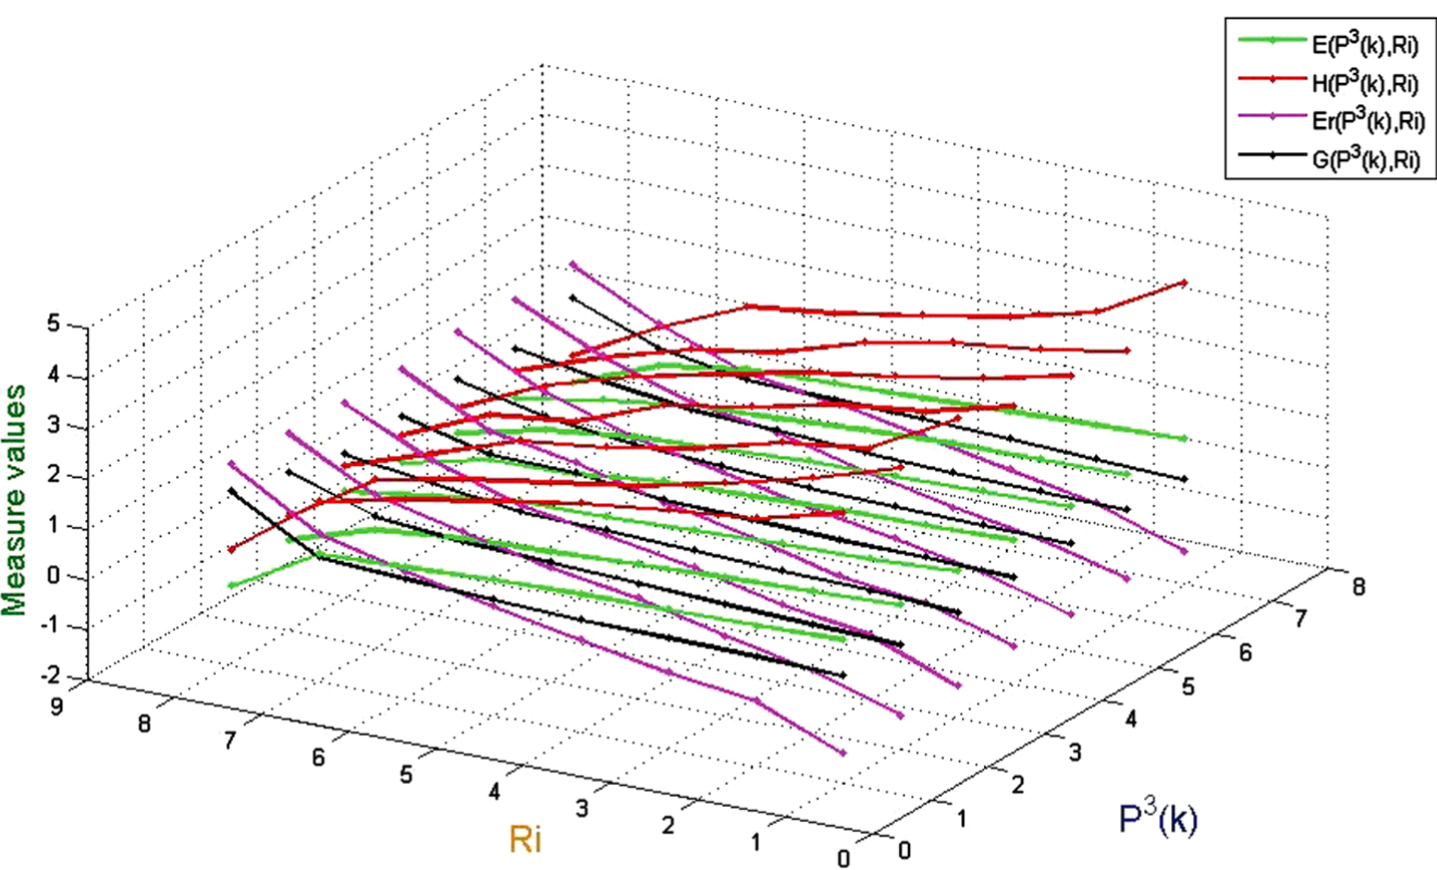
Values of uncertainty measurement on (U, P3 (k) , R i ).
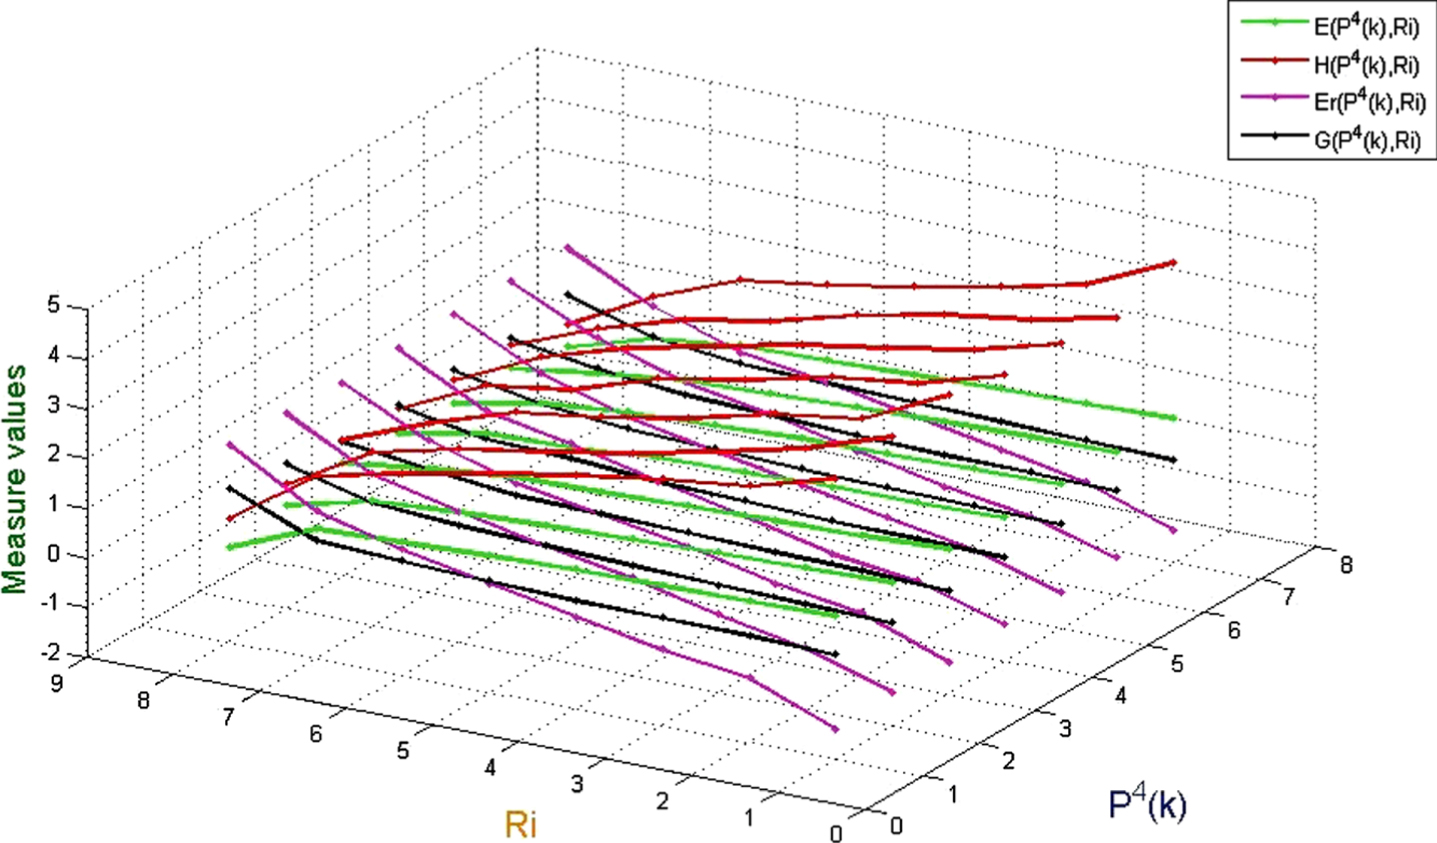
Values of uncertainty measurement on (U, P4 (k) , R i ).
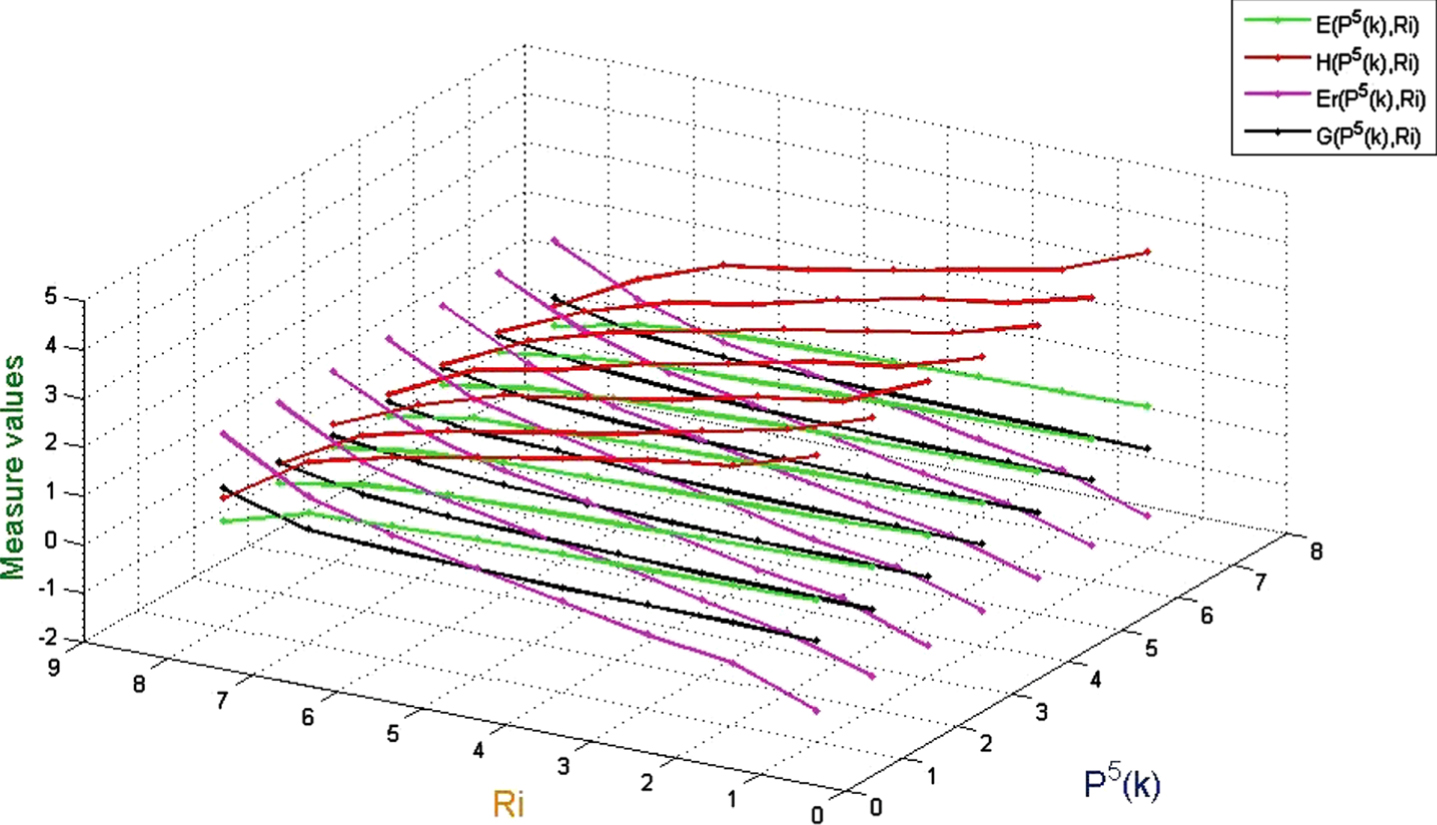
Values of uncertainty measurement on (U, P5 (k) , R i ).

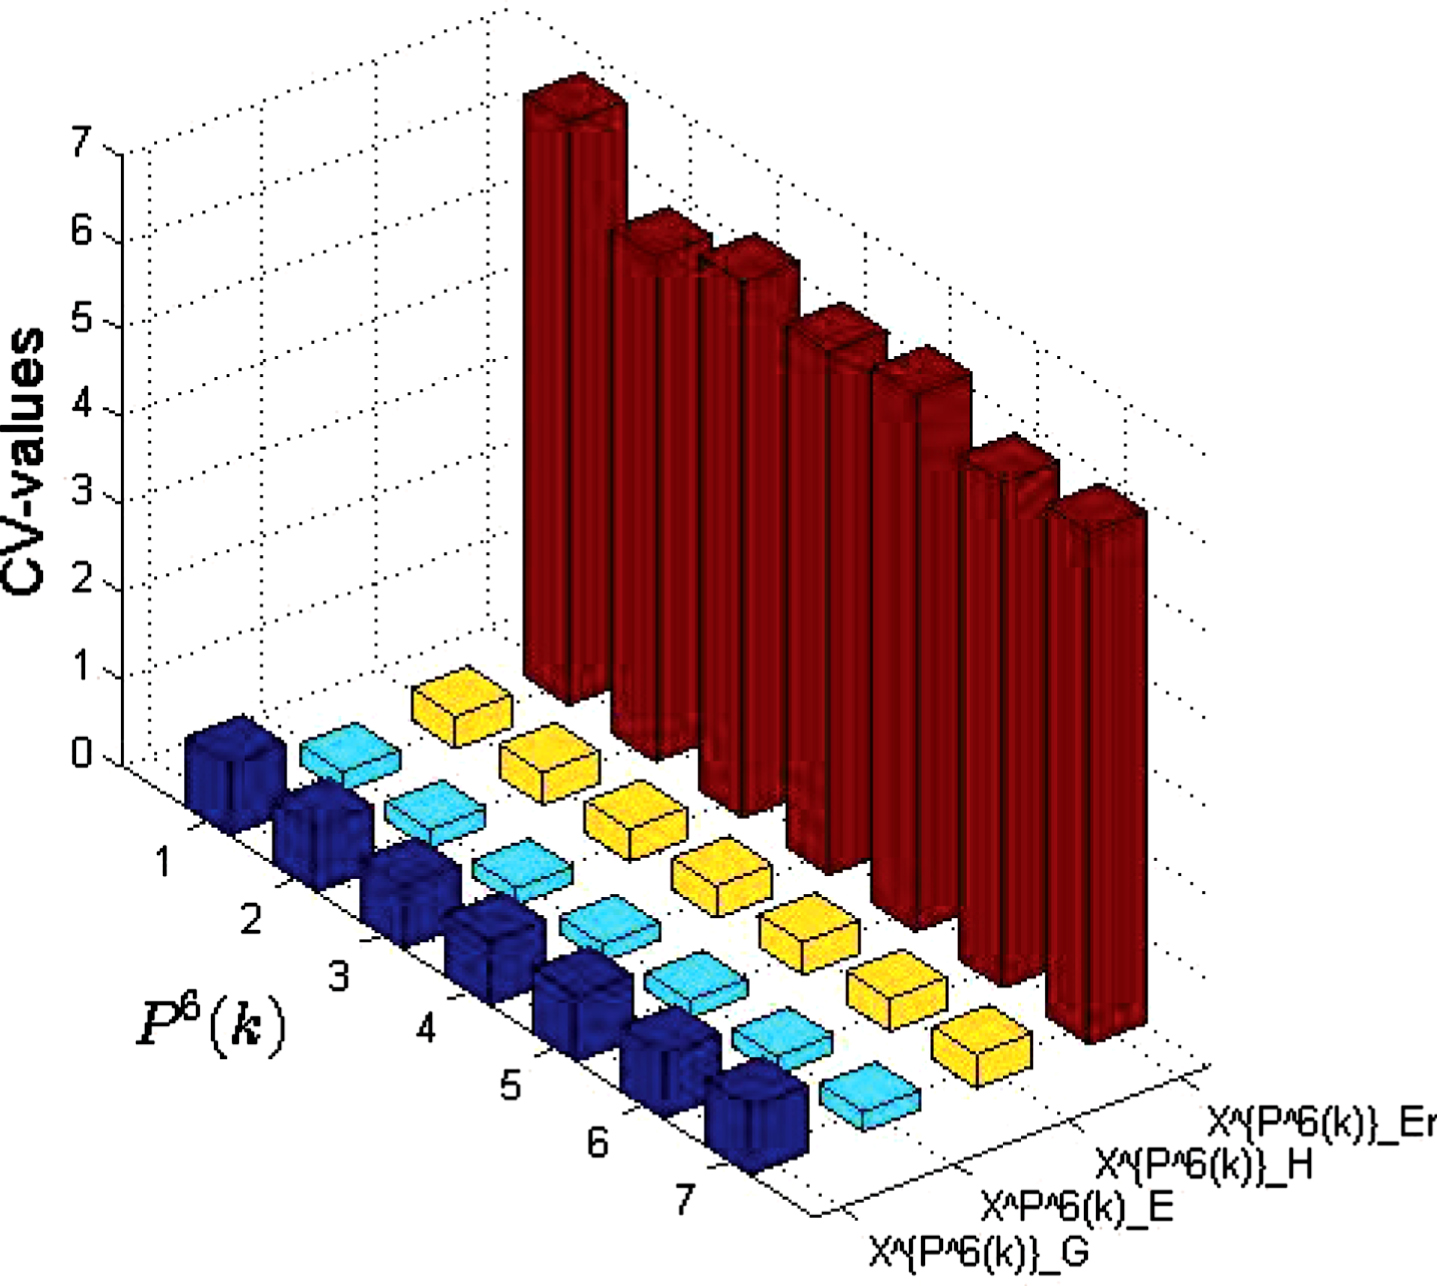
Values of uncertainty measurement on (U, P6 (k) , R i ).

Values of uncertainty measurement on (U, P7 (k) , R i ).
(1) When the probability distribution is a fixed value, E and H monotonically decrease as the similarity between any two objects increases, while G and Er is the opposite;
(2) When the probability distribution is a fixed value, if the similarity between any two objects is high, then Er is mostly higher than G, H and E;
(3) When the probability distribution is a fixed value, if the similarity between any two objects is low, then H is mostly higher than G, Er and E;
(4) When the similarity between any two objects is given, the more concentrated the probability distribution is, the greater the effect on G, Er, H, and E is. In addition, G and E are more sensitive than Er and H;
(5) When the similarity between any two objects is given, the more concentration of probability distribution is, the larger G is, and the opposite is true for E.
In statistics, one often considers the dispersion degree of numerical data by using standard deviation coefficient. Since H and E may be less than 0, this paper analyzes the dispersion degree of those measures by using modified standard deviation coefficient. Among them, the larger the modified standard deviation, the higher the dispersion of data. Instead, it refers to the degree of data dispersion is lower.
Suppose that X = {x1, ⋯ , x
n
} is a data set. Then,
According to Formula 4.1, the CV values of the above measure sets are obtained (see Figs. 9-11)
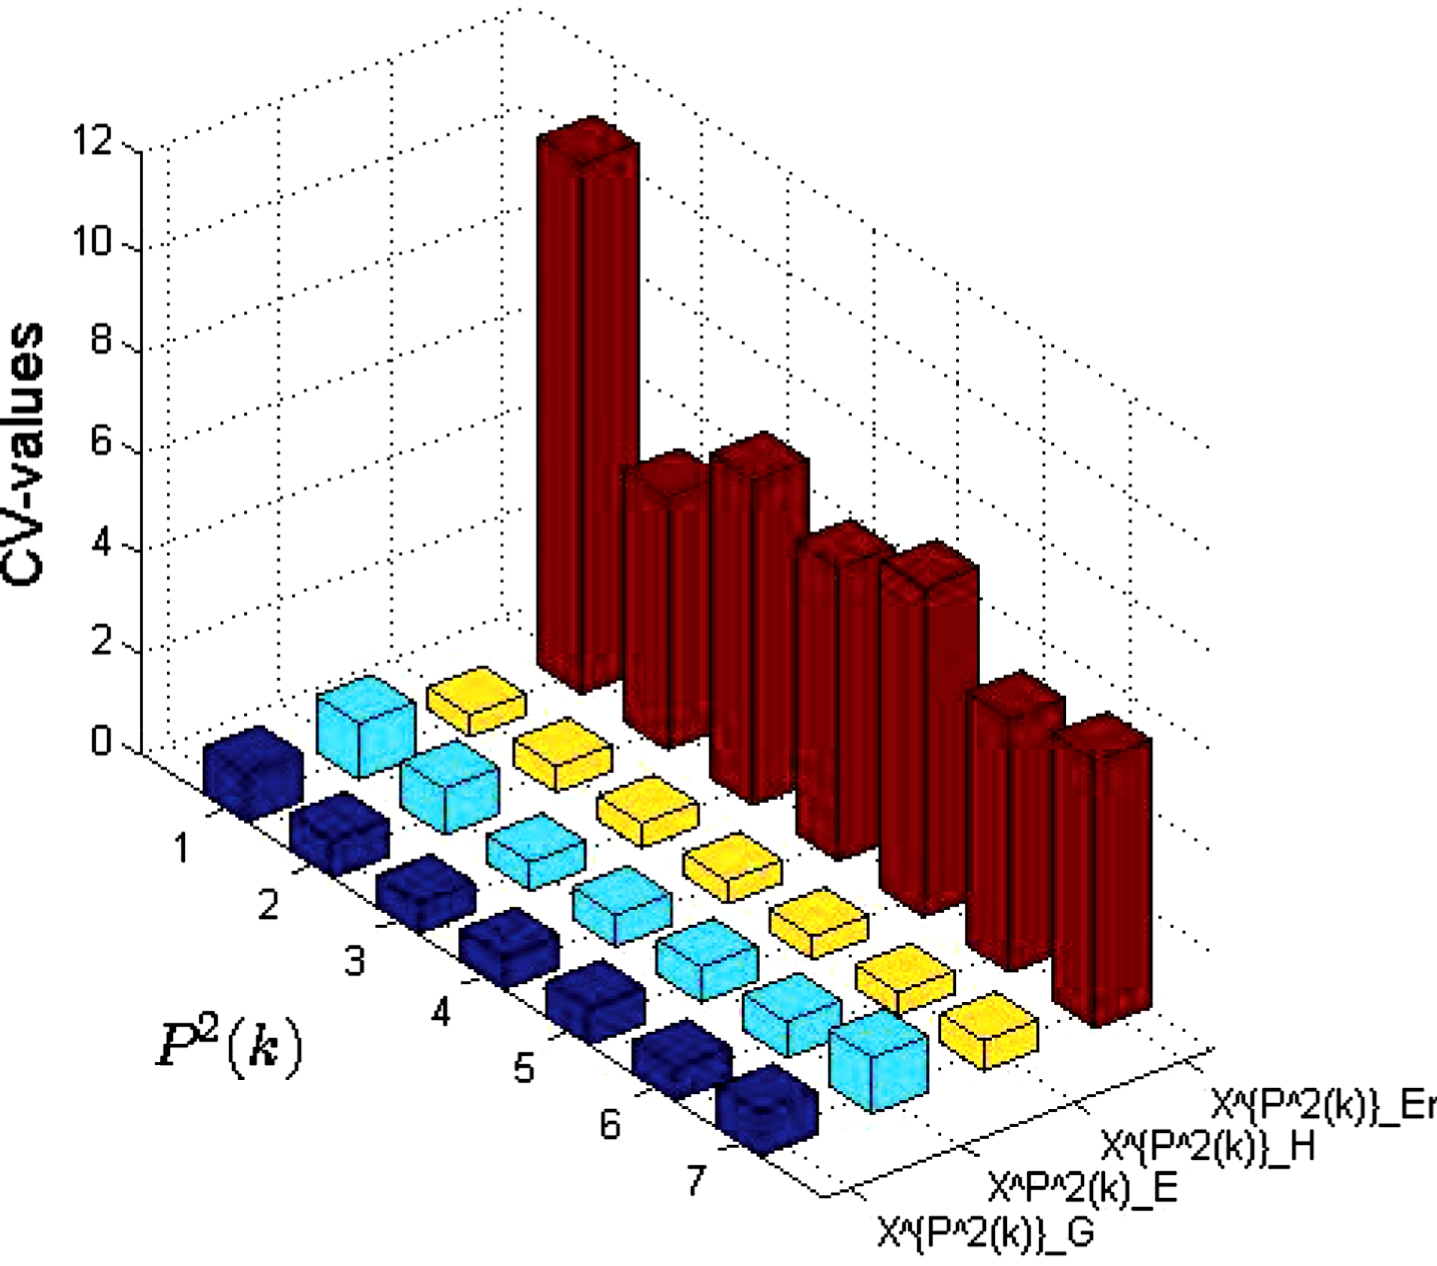
CV values of the above measure sets.
CV values of the above measure sets.

CV values of the above measure sets.
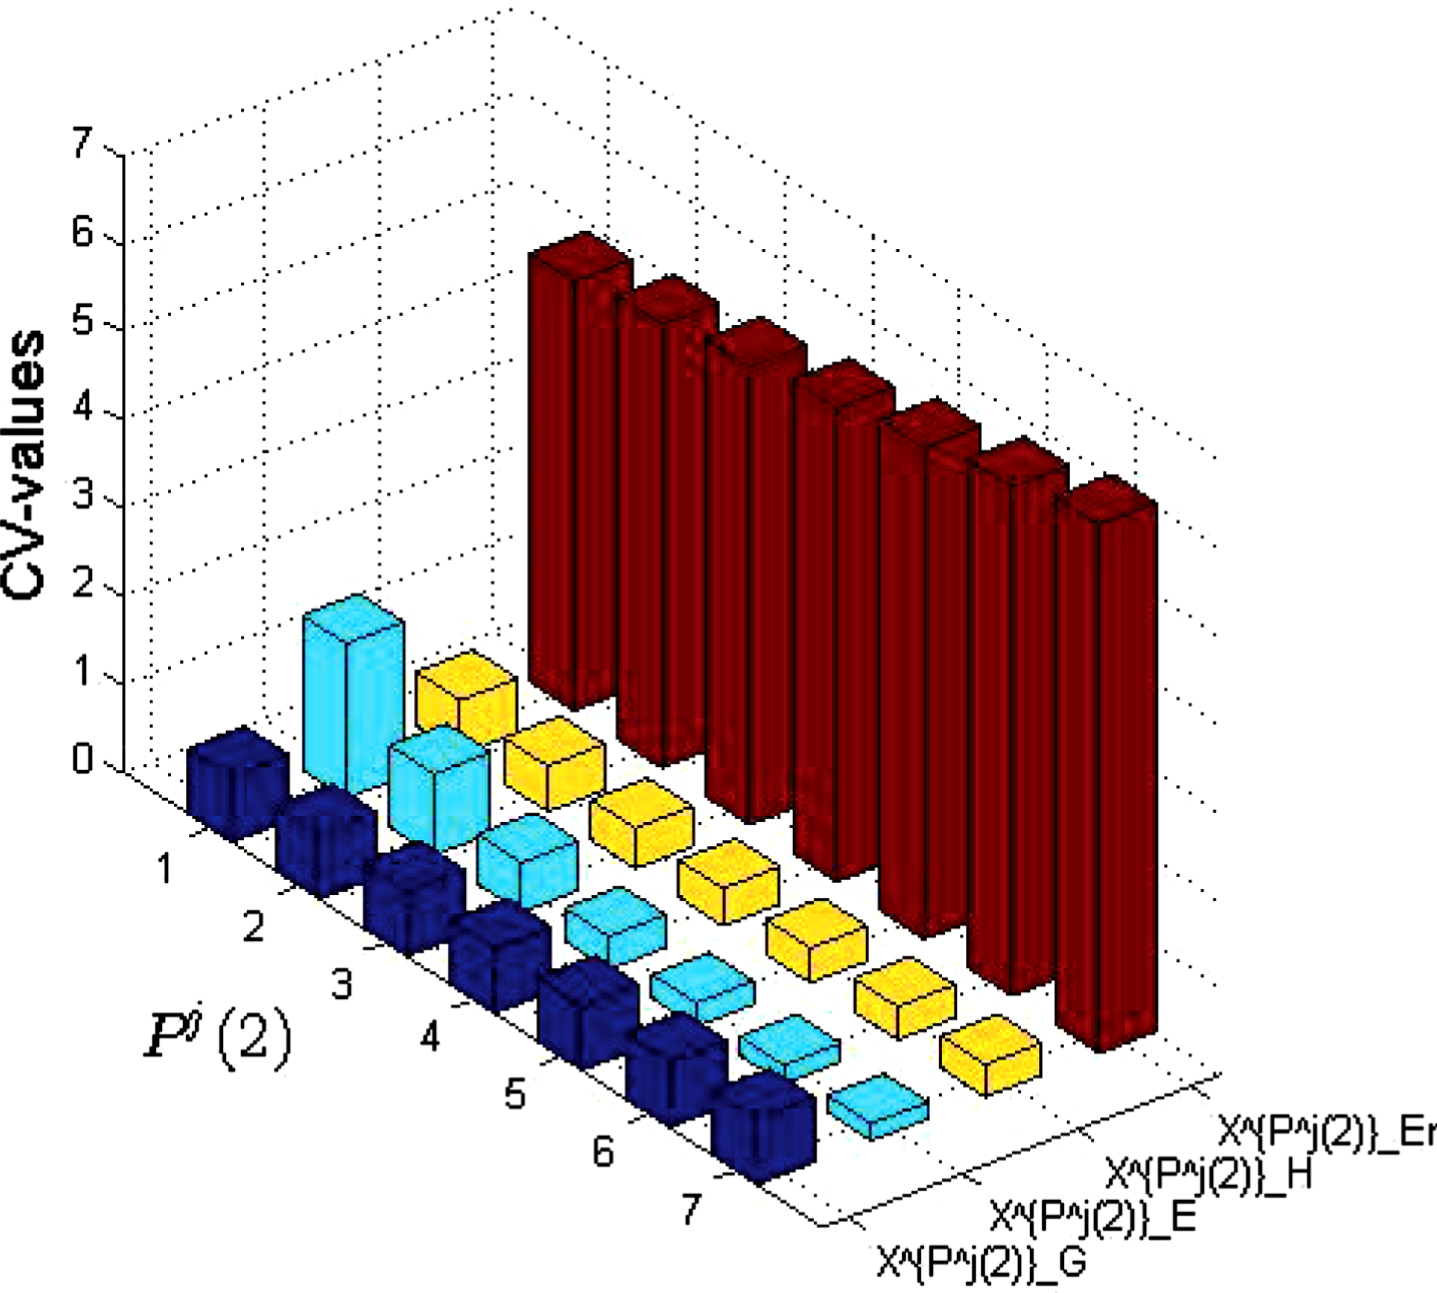
Denote
According to Formula 4.1, the CV values of the above measure sets are obtained (see Figs. 12-14)

CV values of the above measure sets.
CV values of the above measure sets.

CV values of the above measure sets.
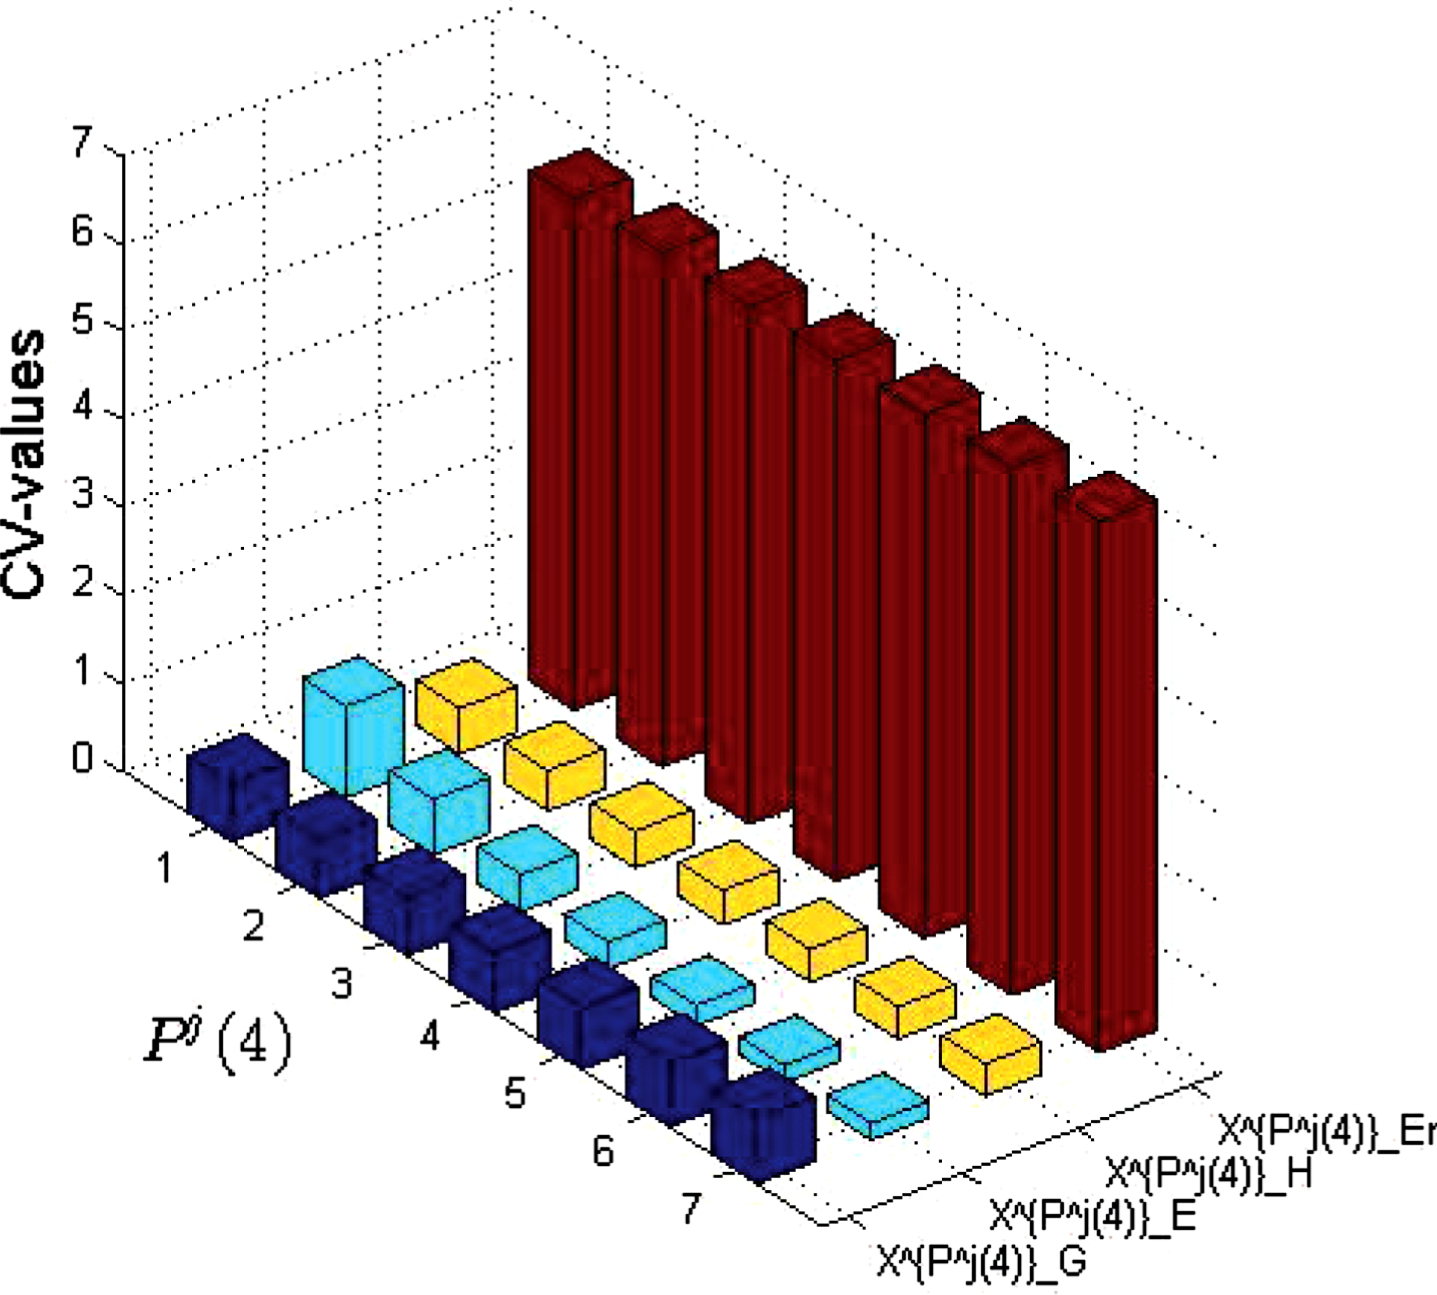
Denote
Therefore, according to Formula 4.1, the CV values of the above measure sets are obtained (see Figs. 15-17).
CV values of the above measure sets.

CV values of the above measure sets.

CV values of the above measure sets.
From Figures 9-17, the following conclusions can be obtained:
(1) When the probability distribution is changing, the dispersion degree of E and H is relatively small in most cases;
(2) When the probability distribution is changing, the dispersion degree of Er is maximum in most cases;
(3) When the similarity between two objects is changing, the dispersion degree of E is minimum in most cases.
As a nonparametric methods in statistics, Friedman test [12] is used to compare the overall performance of k algorithms on N data sets, which can only give the conclusion whether there is a difference between the performance of the k algorithms. If there is a difference, a “post-hoc test” such as Nemenyi test is used to determine which algorithms are statistically different in performance. In this subsection, based on the CV values obtained in the previous subsection, these two tests were used to further verify the stability of the proposed measurements.
Assume that N and k represent the number of data sets and algorithms, respectively. For each i = 1, ⋯ , k, r
i
can be view as the mean ordering of the i-th algorithm. Friedman statistic, denoted by
However, it does not apply to large N and k, then Iman and Davenport came up with a better statistic F
F
, one that based on the F-distribution and distributed by k - 1 and (k - 1) (n - 1) degrees of freedom.
In Friedman test, if the value of F
F
far outweigh the critical value of F
α (k - 1, N - 1), that is, the original hypothesis is declined. Nemenyi test can be used to inquire into which algorithm is better. Critical distance, denoted as CD
α, is shown below
Below, by consider the proposed measures as the algorithms, the CV values of those measures in Example 4.2 are sorted and Friedman test is conducted to investigate whether there is significant difference in the stability of those measures. Note that k - 1 =3, (k - 1) (n - 1) =198 and F0.05 (3, 198) =2.650. Then F
F
= 692.86. Therefor, the value of F
F
is far outweigh the value of F0.05 (3, 198). That is to say, it declines the original hypothesis at α = 0.05. Therefore, there are statistically significant differences in the stability of those measures. Next, based on the Nemenyi test, we can easily figure out that q
α = 2.343 and
The results of the Nemenyi test for these measures at α = 0.05 is displays in Fig. 18, where the dots represent the average ranking for the corresponding measures and the line segments outline the range of CDα. When two lines partially overlap along the Y-axis, one can conclude that the two measures they represent are considered to be not significantly different.
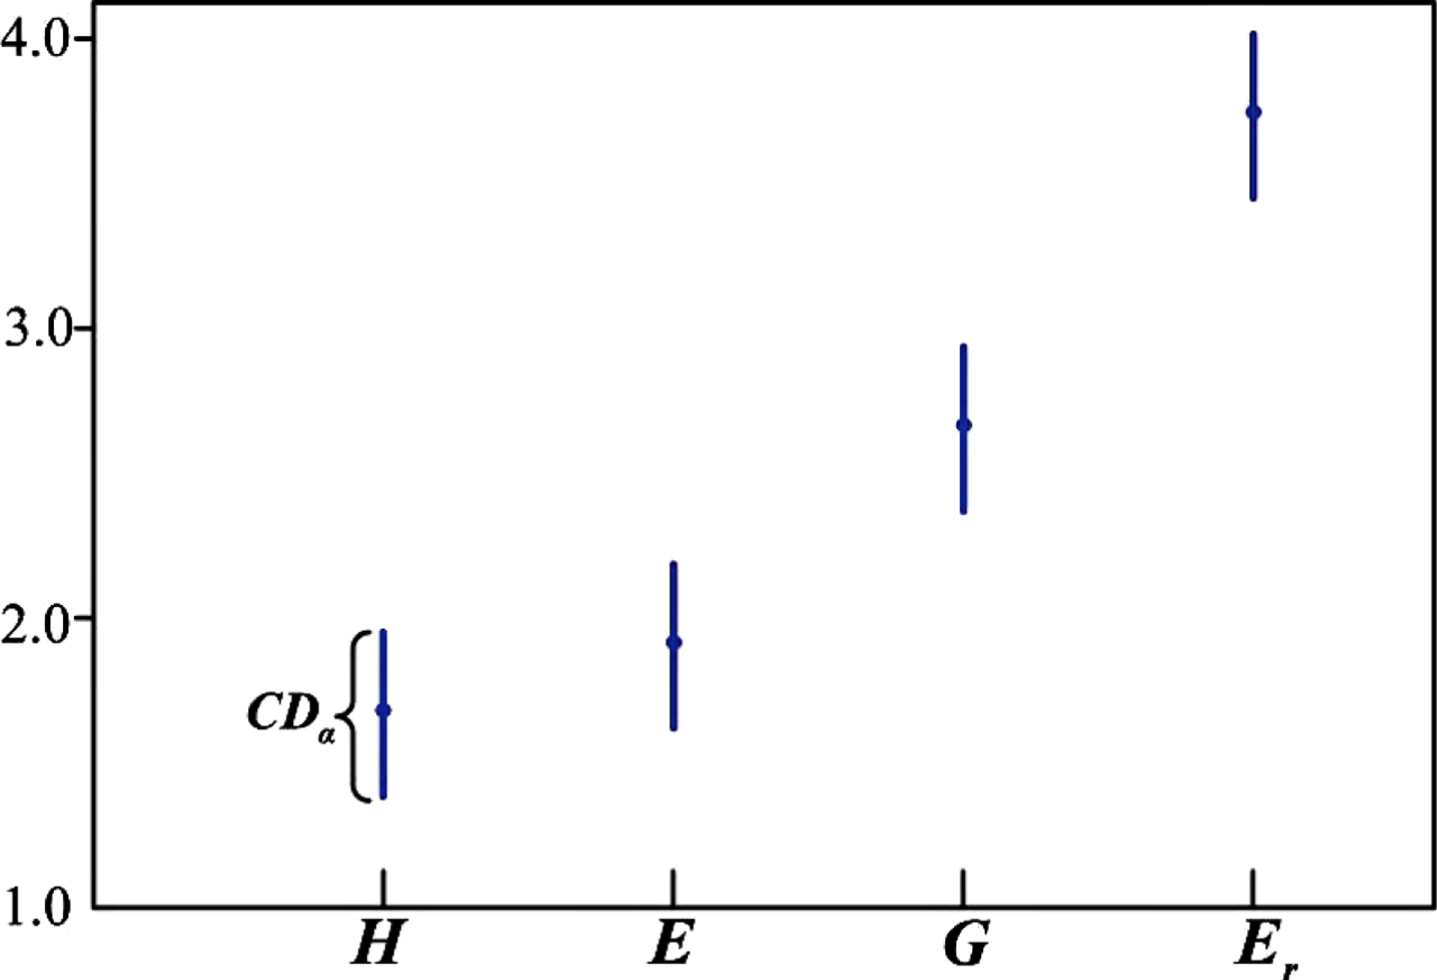
The performance of four measures’s cv values under Nemenyi test.
Some conclusions can be drawn from Fig. 18: There is no significant difference in the measurement stability between H and E, and their measurement stability is better than that of G and E r . In addition, the measurement stability of G was better than that of E r .
By summarizing the above experiment, the following results are obtained:
(1) When one only needs monotonicity, then G, Er, H and E may have better effect in measuring the uncertainty of an FPA-space;
(2) When one only studies stability, then E and H may have better effect in measuring the uncertainty of an FPA-space;
(3) When people consider both monotonicity and stability, then E and H may have better performance to measure the uncertainty of an FPA-space.
In statistics, Pearson correlation coefficient is mainly used to measure the strength of a linear correlation between two data sets.
Give that X = {x1, ⋯ , x
n
} and Y = {y1, ⋯ , y
n
} are two data sets. Pearson correlation coefficient between X and Y, denoted by r (X, Y), is defined as
Obviously,
The corresponding correlation between X and Y
The corresponding correlation between X and Y
By Definitions 3.2, 3.25, 3.14 and 3.9, uncertainty measurement for (U, P, R i ) (i = 1, 2, ⋯ , 8) can be obtained (see Table 2).
Four measure values of the uncertainty for (U, P, R i )
Denote
Then, Pearson correlation coefficients are calculated as follows (see Table 3).
r-values of sixteen pairs of measure sets
From Table 3, the conclusions are shown as follows (see Table 4).
The correlation between two measures
In this paper, new fuzzy relation matrix expression has been proposed, which contains not only the similarity between objects but also the probability distribution. The upper and lower fuzzy information granules induced by fuzzy relation with probability have been studied. Then, the uncertainty of FPA-spaces has been measured according to the upper and lower fuzzy information granules, and the average value of the two measures has been taken as the uncertainty measure of FPA-spaces. On this basis, four uncertainty measures have been investigated to cope with the uncertainty for a FPA-space. Dispersion analysis, correlation analysis and Friedman test have been applied to analyze the effectiveness of the proposed measures. In this way, the validity of the proposed measures has been verified. The experimental results also display that the fuzzy relation and the concentration degree of probability distribution may have some influence on the uncertainty of an FPA-space. In the numerical experiment, eight unequal fuzzy relation matrices have been randomly generated by MATLAB, and the similarity of objects in these matrices is increasing. Taking probability as parameter, the effectiveness of the proposed methods under different probability distribution has been analyzed from the view of statistics. Through this experiment, the influence of similarity between objects on these measures has been explored, and the influence of probability distribution on these measures also has been found. Despite the lack of real data testing, this experiment also provides a more comprehensive demonstration of the advantages and disadvantages of the proposed measures. They can not only be used to construct heuristic functions in feature selection, but also be applied to weight selection in multi-classifier systems. Therefore, it is of great significance to study the uncertainty measure of FPA-spaces. In the future work, we will consider the practical application of the obtained results.
Footnotes
Acknowledgments
The authors would like to thank the editors and the anonymous reviewers for their valuable comments and suggestions, which have helped immensely in improving the quality of the paper. This work is supported by Project of Improving the Basic Scientific Research Ability of Young and Middle-aged Teachers in Guangxi Universities under (2020KY14013), Natural Science Foundation of Guangxi (AD19245102, 2020GXNSFAA159155, 2018GXNSFDA294003), Key Laborabory of Software Engineering in Guangxi University for Nationalities (2021-18XJSY-03) and Special Scientific Research Project of Young Innovative Talents in Guangxi (2019AC20052).