
Abstract
With the in-depth application of artificial intelligence technology in the financial field, credit scoring models constructed by machine learning algorithms have become mainstream. However, the high-dimensional and complex attribute features of the borrower pose challenges to the predictive competence of the model. This paper propose
Introduction
The gradual maturity of artificial intelligence has promoted the development of Internet finance. Credit defaults have always existed in the financial field, and as the main type of financial risk, have caused serious economic losses. Hence, credit risk management has become the core component of the development strategy of financial institutions. Based on the above background, artificial intelligence technology and machine learning algorithms were used to construct a credit scoring model with superior predictive power, which can effectively mitigate risk and reduce economic losses for financial institutions. Previous studies [1–3] have demonstrated the contribution of artificial intelligence toward the construction of a credit evaluation model. To a large extent, the predictive performance of a credit evaluation model depends on the quality of the datasets, and is reflected in its attribute characteristics.
In today’s era of big data, the datasets trained by machine learning usually have multidimensional features, including many non-functional and redundant features. These features reduce the learning capacity of the machine learning model and thus fail to achieve good predictive performance. Therefore, the exfoliation of an effective feature selection method is essential for a credit evaluation model. In recent years, this has been the focus of many researchers. Some researchers [4–8] have made specific contributions to the exploration of feature selection methods. However, this subject is still worthy of further in-depth research. In recent years, the ensemble method has been generally considered an advanced method to improve prediction performance, and it can be divided into two types, homogeneous ensemble and heterogeneous ensemble [9]. Adaptive boosting (AdaBoost) [10], random forest (RF) [11], gradient boosting decision tree (GBDT) [11], XGBoost [12], and a light gradient boosting machine (LightGBM) [13] are typical homogeneous ensemble models. The superior performance of heterogeneous ensemble combining different types of classifiers has been gradually proven [14, 15]. The most effective approach to ensemble modeling has yet to be determined, and this is still being explored by researchers. Furthermore, the predictive capability of base classifiers immediately affects the forecast results of the ensemble model. Therefore, exploring an effective classifier selection method is important for enhancing the predictive capability of ensemble models.
Because the economic loss and impact caused by the default risk on the financial industry are significant, constructing a credit scoring model by applying artificial intelligence technology plays a pivotal role in the development of this industry. Herein, a hybrid model is proposed with a novel feature selection method and an enhanced voting method to acquire a conspicuous improvement in credit scoring. This hybrid model consists of three stages: classifier selection stage, feature selection stage, and classifier ensemble stage. First, a feature selection combined method based on a genetic algorithm (FSCM-GA) is proposed to acquire the optimal feature subset. It uses the optimal classifiers obtained through the classifier selection stage as the evaluation function of the GA to acquire their respective optimal feature subsets and combines these subsets as the optimal feature subset of the prediction model. Furthermore, an enhanced voting method (EVM) is proposed that improves the classification of the average prediction probability within the interval set and is applied to integrate the classifiers to output the final prediction results. Finally, the proposed model is employed to test and verify its predictive competence on credit datasets.
The organizational structure of this research is as follows. Section 2 reviews the research and conclusions associated with the proposed model. The proposed hybrid model is described in Section 3. Section 4 presents a review of the experimental design, which mainly includes dataset description and preprocessing, selected evaluation indicators, and parameter settings. In Section 5, the experimental results and the statistical significance test of the proposed model are discussed. Section 6 elaborates the conclusions and future work.
Related work
Our proposed model involves three aspects: classifier selection, feature selection, and ensemble modeling. In recent research, the focus has been on how to combine them to construct a more effective credit scoring model. This is consistent with our own research. Previous researches are introduced in this section.
Genetic algorithm
Nature-inspired algorithms are constructed based on natural laws and human experience, which can provide a feasible solution to the problem at an acceptable cost. In general, the degree of deviation between the feasible solution and optimal solution cannot be controlled in advance [16]. Nature-inspired algorithms are designed to solve optimization problems by the following steps: Randomly generate the initial solution. Calculate the target function value based on the initial solution. Based on the information obtained, the population (feasible solution set) is constantly updated through selection, crossover, and other operators. Repeat until the iteration ends.
Nature-inspired algorithms are widely employed to solve nonlinear optimization problems, such as studies [17–19] and [20]. As a typical nature-inspired algorithm, the genetic algorithm [21] is a computational model of the biological evolution process that simulates the natural selection and genetic mechanism of Darwinian biological evolution. Each chromosome represents a solution as an individual, and all individuals constitute a population as the set of possible solutions. First, the population is initialized to randomly generate some solutions. A specific evaluation function is then selected to assess the fitness of each individual, and excellent individuals are then selected for crossover and mutation steps to update the population till the end of the iteration. Finally, the GA outputs the optimal individual as the optimal solution. In studies [22–24] and [25], the authors demonstrated the powerful search capabilities of the GA.
However, the programming of the GA is complex, and its search speed is relatively slow. Furthermore, the quality of the solution obtained by the GA is directly affected by the selection, crossover, and mutation operator parameter settings.
The GA is widely applied to combine classification models and improve the prediction accuracy. In [26], the authors combined a GA with an ensemble classifier to form a new hybrid algorithm application with three different benchmark datasets. Th authors in [27] applied a genetic algorithm for feature selection to verify its performance. In [7], the authors proposed a hybrid GA with neural networks, which was applied to feature selection. The authors in [28] proposed a hybrid structure that fuses statistical theory and genetic algorithms for the selection of critical ratios. The performance of the GA for the combinatorial optimization of classifiers was proved in [29]. In addition, extended genetic algorithms have gradually attracted the attention of researchers. The authors in [8] proposed a hybrid method that combines the filtering method and multi-population genetic algorithm, and is applied to find the optimal feature subset. An enhanced genetic algorithm was proposed in [30] and employed for classifier selection and feature selection. In this study, the GA is employed to form a novel feature selection combined method to select the features.
Feature selection methods
Feature selection refers to the process of selecting some of the most effective features from the original features and reduce the feature dimensions of the raw dataset. It is indispensable in data preprocessing to increase the predictive precision of the classification model [31]. Through experience and generalization, feature selection methods include three types, i.e., filtering approaches, wrapper approaches, and embedded approaches.
Filter approaches mainly include the variance selection method, correlation coefficient method, and mutual information. The wrapper approach considers the performance of the classifier as an evaluation criterion for selecting the features. Therefore, such a method must determine a base classifier to select the features. Embedded methods use machine learning models for feature selection, which are automatically carried out during the learner training process. Embedded approaches have the merits of superior speed and efficiency. However, profound prior knowledge is required to adjust the model. To obtain a better feature subset, researchers have attempted to create different combinations of the above three methods. In [4], the authors proposed four feature selection methods combined with an SVM, involving the traditional LDA, DT, rough set, and F-score methods as feature preprocessing steps. The experimental results demonstrate that the hybrid feature selection method is robust and effective in determining the optimal feature subset. It is also proved that the effective feature selection method can enhance the predictive competence of the classifier. The authors in [32] proposed a fast filter approach, which demonstrates the effectiveness of the feature selection approach in terms of dimensionality reduction, eliminating irrelevant data, improving the learning accuracy, and improving the comprehensibility of the results. Five different feature selection methods combined with a new voting method were used for feature selection in [33]. In [34], the authors discussed the effectiveness of feature selection approaches combined with six different models for application to bankruptcy and credit datasets, and the experimental results proved that feature selection does not always enhance the predictive accuracy of the model. However, the GA-based feature selection approach can enhance the capability of the prediction model. The authors in [30] proposed an enhanced multi-population niche GA and initialized the population with prior knowledge obtained by filtering methods for feature selection. Currently, the development of feature selection methods that combine multiple methods is a research hotspot. In this study, FSCM-GA is proposed, which uses the predictive performance of different classifiers as the fitness function of the GA to obtain their respective feature subsets and combines them to form the optimal feature subset.
Ensemble methods
It is expected that a classifier will be trained with good learning capability in machine learning algorithms. The ensemble model has been shown to have superior learning results and robustness compared to a single weak classifier in previous studies. In addition, it can be divided into two types: homogeneous ensemble and heterogeneous ensemble. A homogeneous ensemble contains only the same type of base classifiers. Heterogeneous ensembles train different types of classifiers and synthesize the respective output results of the base classifiers, compensate for their deficiencies, and obtain a better result [15]. Bagging [35], boosting [36], stacking [37] and voting are widely applied classifier ensemble methods. Herein, an enhanced voting method is proposed to integrate the classifiers.
The idea behind voting is to combine conceptually different machine learning classifiers and use majority voting (hard voting) or the average predicted probabilities (soft voting) to predict the class labels. Such a classifier can be useful for a set of equally well-performing models to balance out their individual weaknesses. In the hard voting ensemble model, for the same data, the output results of the ensemble model are the prediction results of the majority of the base classifiers. In contrast to hard voting, soft voting returns the class label by calculating the average prediction probability of the base classifiers. Specific weights are assigned to each classifier using the weight parameter. When weights are provided, the predicted class probabilities for each classifier are collected, multiplied by the classifier weight, and averaged. The final prediction result is then derived from the class label with the highest average probability.
In recent years, the effectiveness of these different ensemble methods has been demonstrated by many researchers. The authors in [38] proved the superior performance of bagging and boosting, and explained why ensembles can frequently outperform any single classifier. In [39], the authors proved the superior performance of voting methods for multiple classification problems. In [40], the authors compared the performance of these integration approaches with the classifier itself. With the support of statistical analysis, the ensemble technique proved to be outstanding in solving the classification problem. In [14], the authors also proved the superior performance of a heterogeneous ensemble model compared with a single classifier. The above studies confirm the superior capability of the ensemble models. However, the current study mainly focuses on the selection of the most appropriate ensemble approach based on a given combination of base classifiers. Therefore, more effort needs to be put into research on the optimal combination approach.
In this study, the EVM is proposed to integrate the classifiers and output the final result. Section 3 describes the EVM in detail.
Modeling
The proposed hybrid model with a novel feature selection method and enhanced voting method is introduced in this section, which includes three aspects: classifier selection, feature selection, and classifier ensemble. The detailed process is as follows. First, a candidate classifier repository is constructed. Then, the data are preprocessed and divided into training and test data, and candidate classifiers in the classifier repository are sorted by calculating the average accuracy of their 5-fold cross-validation in the training data. The top-performing classifiers form an optimal classifier subset. Subsequently, the proposed FSCM-GA is employed to acquire the optimal feature subset based on the classifiers obtained in the previous stage. Finally, the two subsets obtained above are used as the base classifier and the input data of the proposed EVM to output the final prediction result. The framework of the proposed hybrid model is presented in Fig. 1.
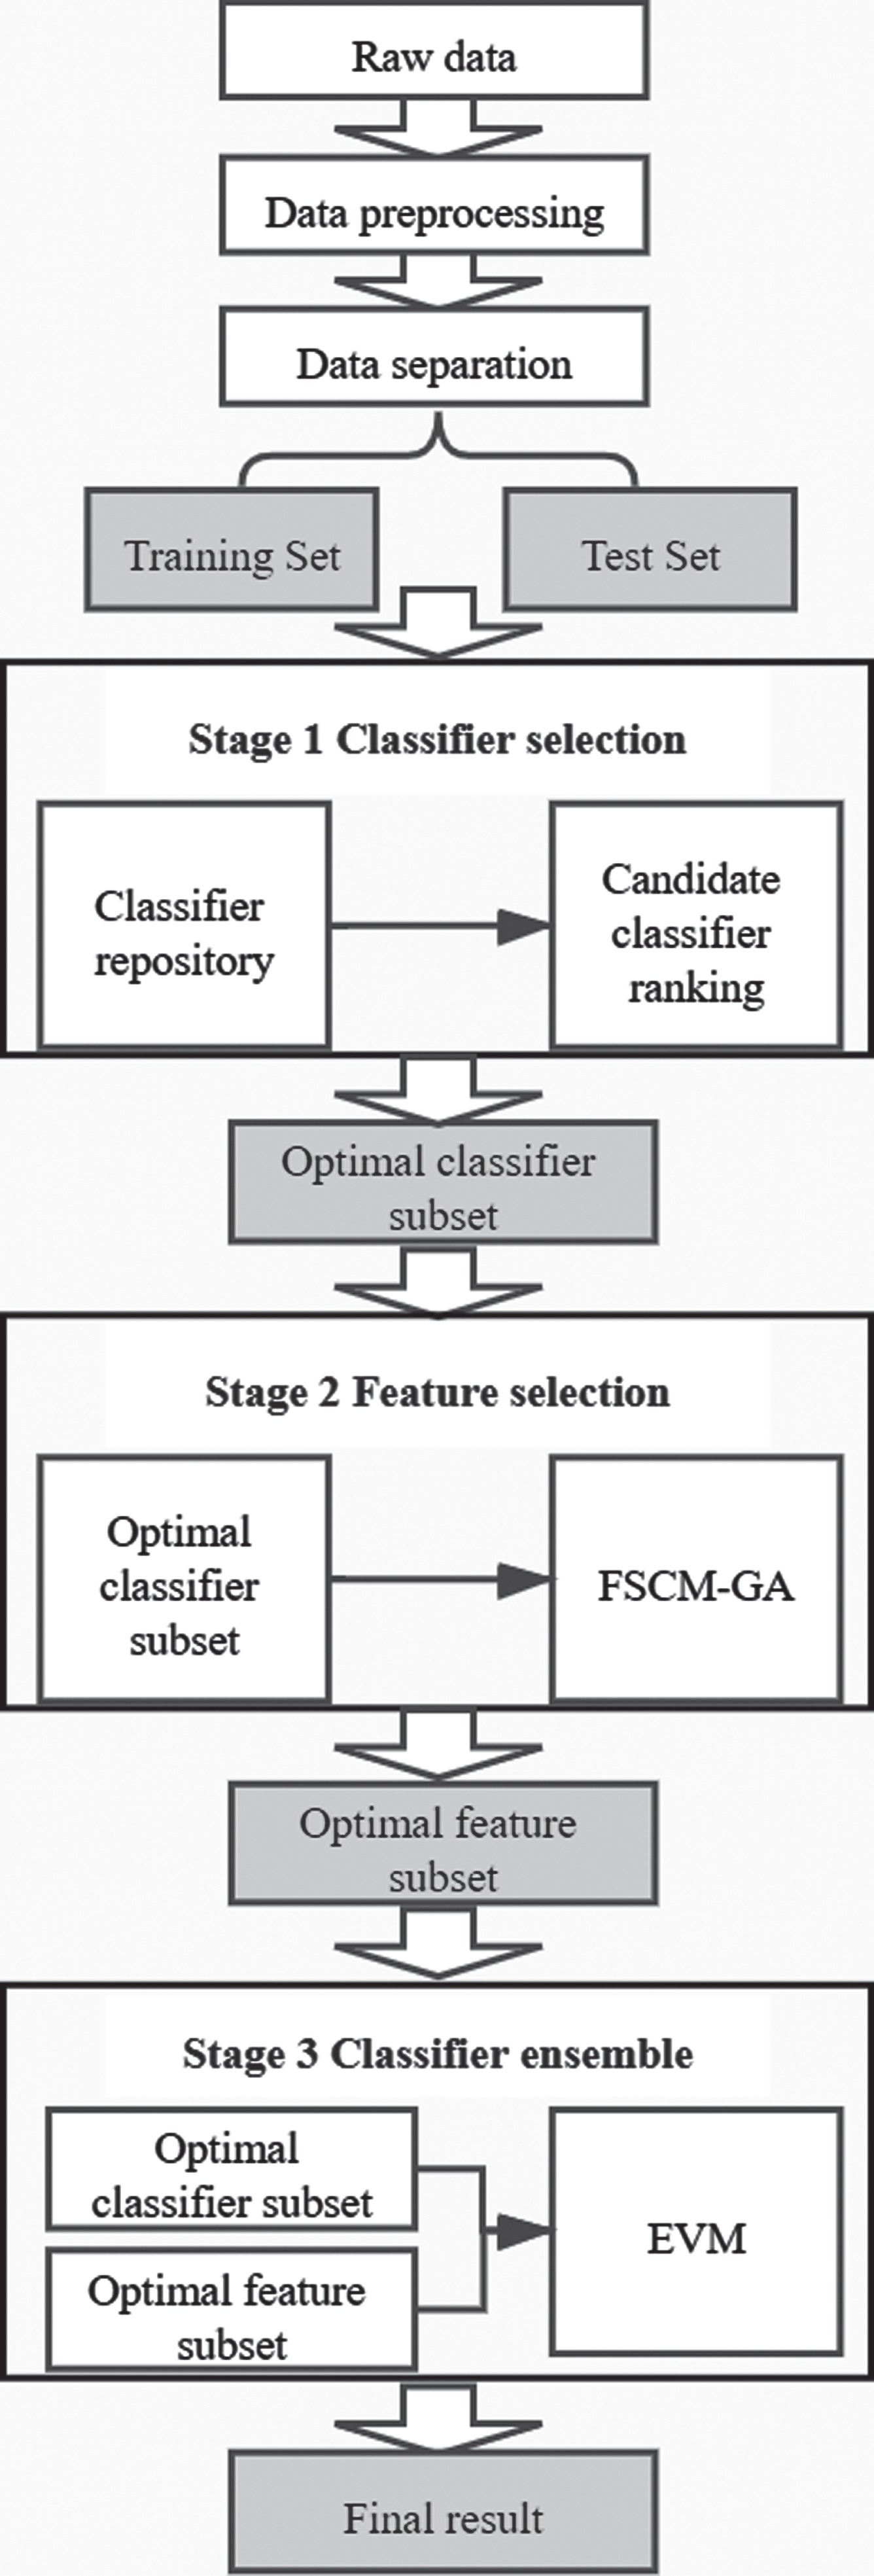
Framework of the proposed hybrid model.
Previous studies have demonstrated the superior competence of ensemble models. In addition, the prediction competence of the base classifiers directly affects the prediction results of the ensemble model. Hence, the core task of the classifier ensemble is to find base classifiers with a high predictive competence. In this study, accuracy [41] was employed to assess the predictive performance of the classifiers, considering that it is an accepted performance metric in machine learning. Furthermore, a five-fold cross-validation were selected to evaluate the classification models because such a validation is widely recognized as a more appropriate way to verify the robustness of the machine learning algorithms [42].
Initially, a classifier repository is constructed, which contains several commonly used machine learning models. The predictive competence of the candidate classifiers in the classifier repository is evaluated by calculating its average accuracy based on a five-fold cross-validation. A higher accuracy indicates a better candidate classifier with superior predictive performance. These candidate classifiers are ranked according to their accuracy and the optimal classifier subset is composed of the top candidate classifiers.
FSCM-GA
Real credit datasets are usually multi-dimensional and complex, which has significant impact on the construction of the model. Hence, the selection of the most helpful features and a reduction of the data dimension is a vital issue that has consistently been the subject of research.
The GA is a typical heuristic algorithm widely used in machine learning. This is a general algorithm for resolving search optimization problems. Compared with some conventional optimization algorithms, the GA can usually achieve better optimization results at a faster speed. In previous studies, the GA has also been shown to perform well in a data dimensionality reduction.
The feature selection procedure of the GA is divided into the following parts: feature encoding, initial population, fitness evaluation, selection, crossover, mutation, and optimal individual decoding. Feature coding refers to the generation of a chromosome with a matching length based on the feature dimension. In general, binary encoding was applied. The initial population consisted of randomly generated chromosomes. The fitness function is applied to assess each individual, for which the fitness value represents the degree of excellence. In this study, the average accuracy of the 5-fold cross-validation in the training data was applied to evaluate each individual. Because the discrepancy in fitness between the majority of the individuals is insignificant, more dominant individuals must be retained in the selection operation to find the optimal individual. Hence, a rank selection operator is employed in the FSCM-GA to select superior individuals. To increase the probability of obtaining a superior individual during each iteration, a crossover and mutation are indispensable steps. A crossover occurs when two pairs of chromosomes exchange genes in a way that creates two new individuals. In this study, a one-point crossover is selected as the crossover operator, which refers to the random setting of a crossover point in the coding string of the individual, and the point then exchanges a portion of the chromosomes of two paired individuals. A mutation refers to the fact that some genes in the coding string of an individual chromosome will be replaced by other alleles of the gene with a certain probability, thus generating a new individual. When the GA terminates, the optimal individual gene is decoded and output as the optimal solution for this operation.
The proposed FSCM-GA is a novel feature selection combined method based on the GA, the main process of which is as follows: The classifiers in the optimal classifier subset are, in turn, sent to the GA to evaluate individual fitness and obtain their respective feature subsets. The optimal feature subset is then obtained by combining the above feature subsets. The combination process is as follows: Those features that are selected by any classifier are selected. Namely, features not selected by any classifier are deleted. The framework of the FSCM-GA is presented in Fig. 2.
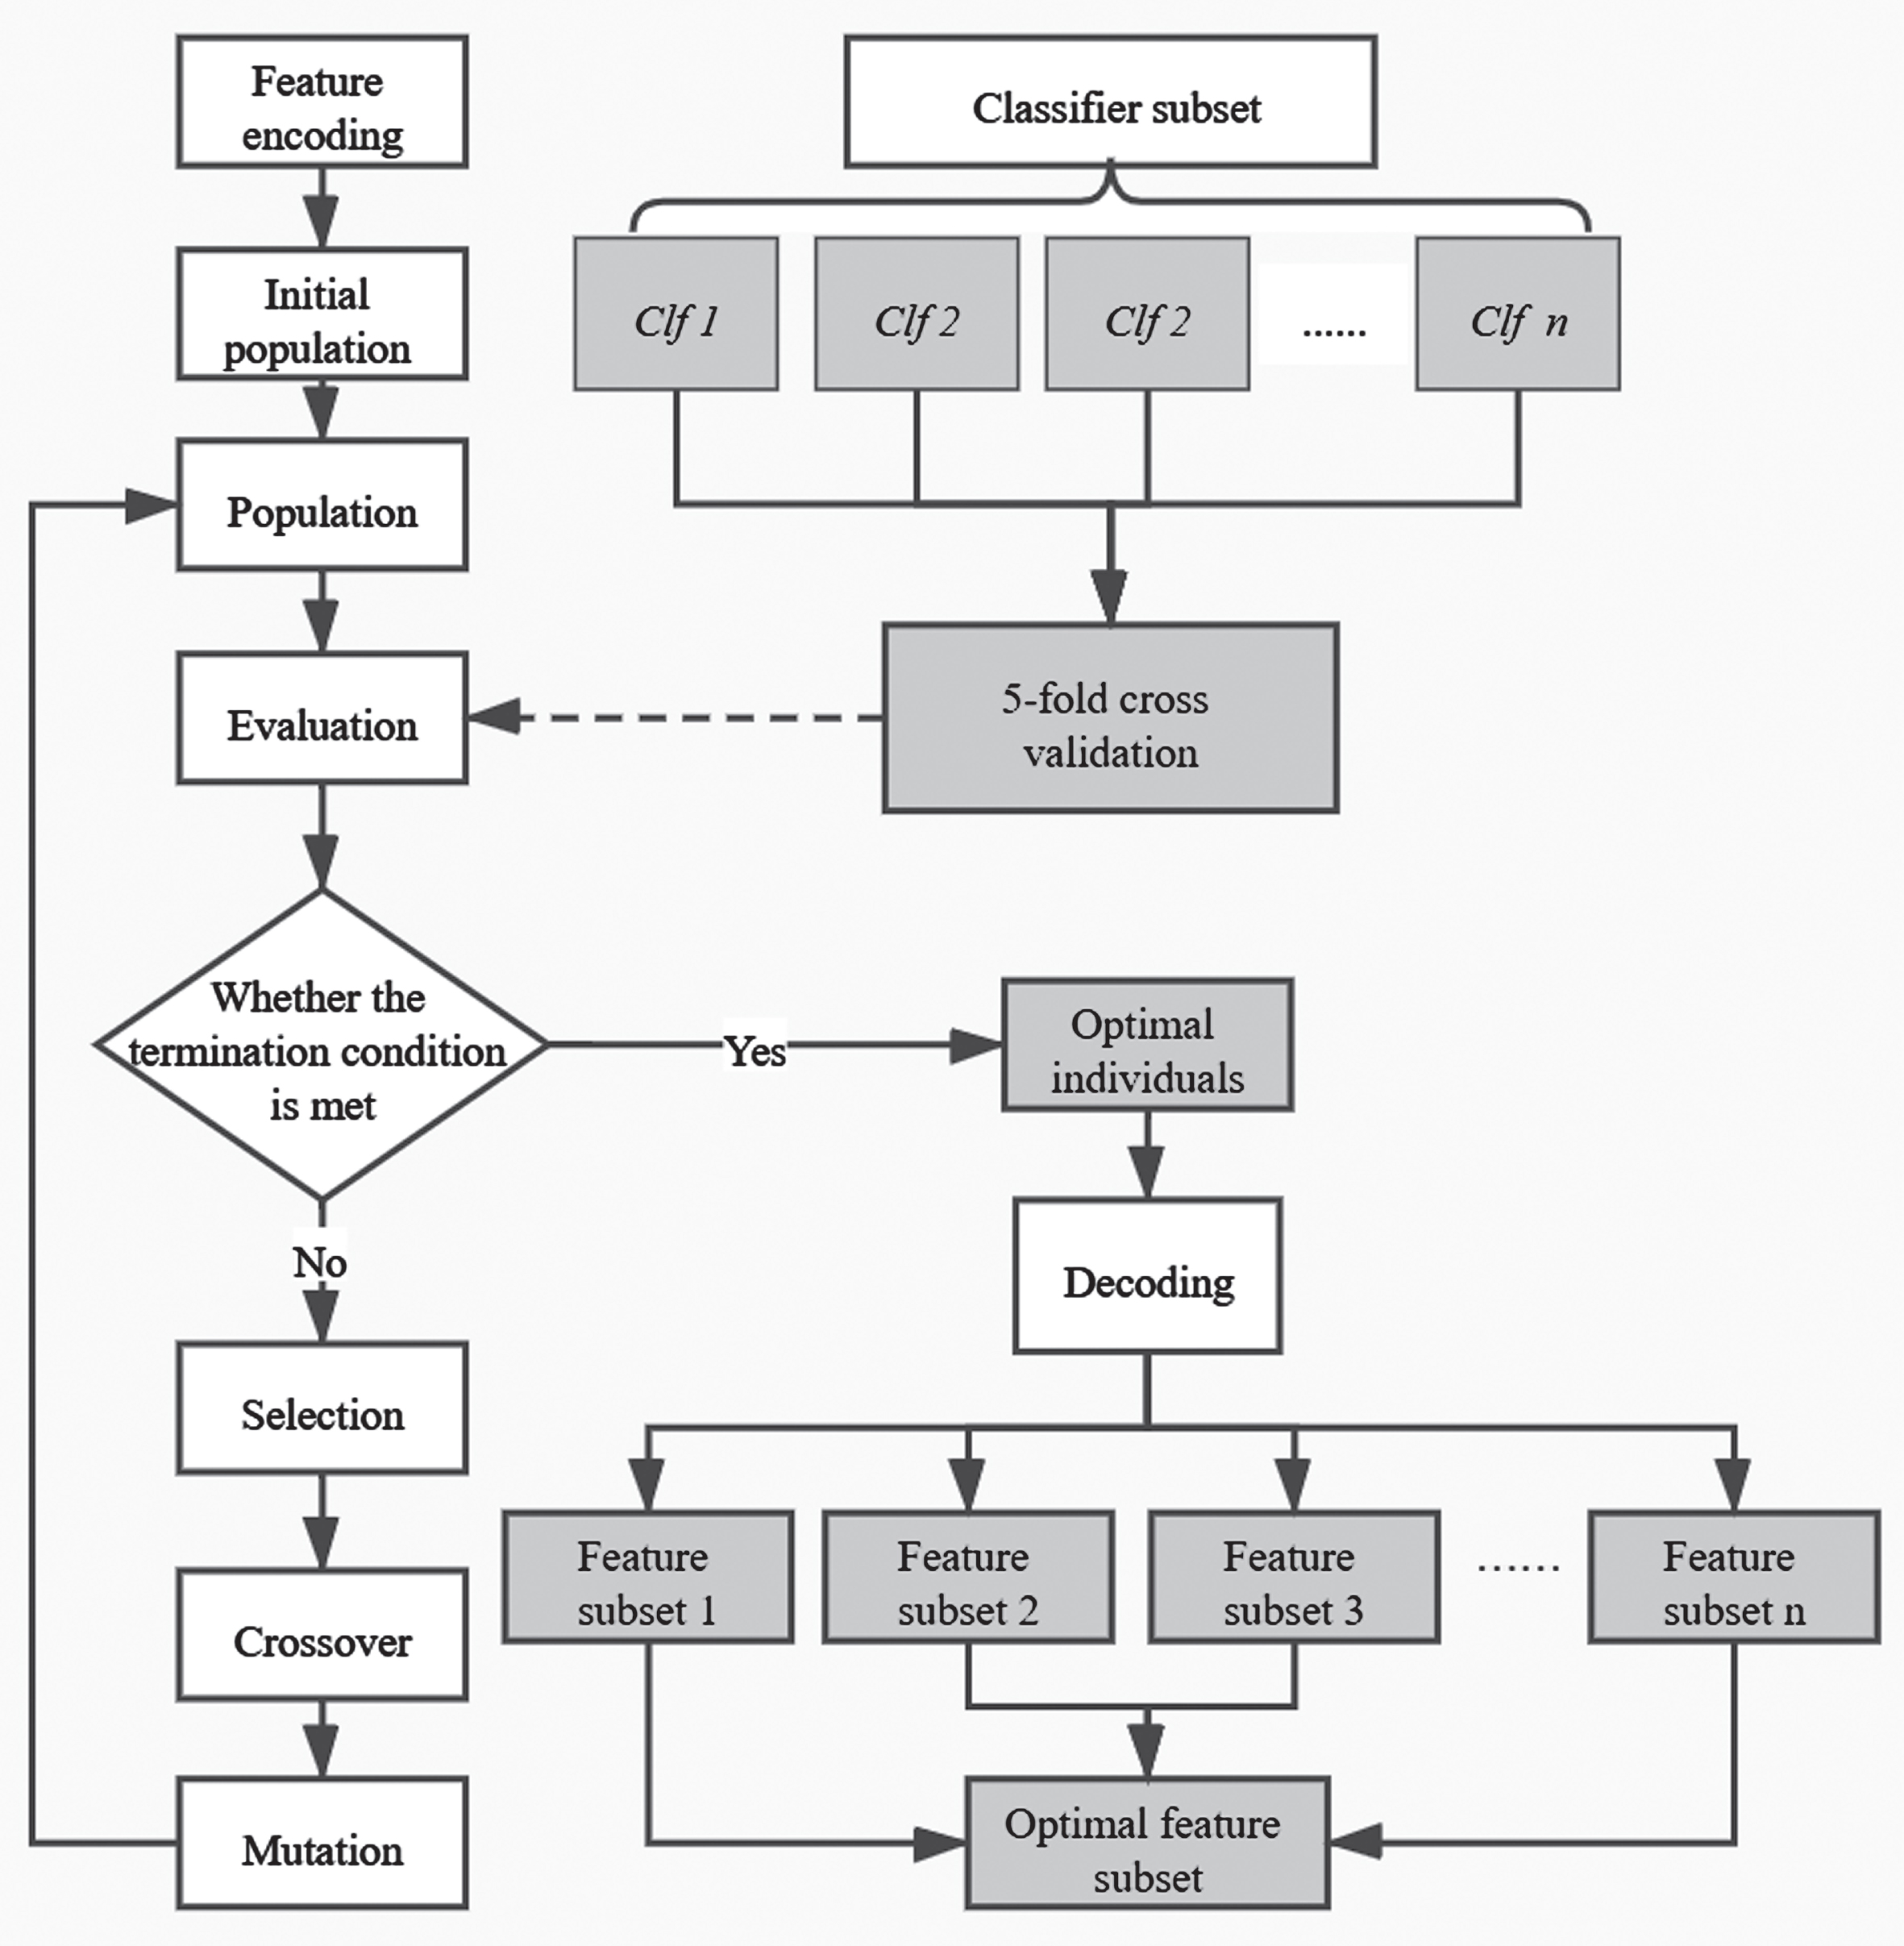
Framework of FSCM-GA.
The average accuracy of the classifier obtained by a 5-fold cross-validation on the training data was used as the evaluation function, of which 80%of the training data were used as the training set to train the classifier and the remaining 20%were used as the validation set to verify the performance. Therefore, the optimal feature subset obtained by combining each feature subset has the advantages of superior robustness and efficiency.
To achieve the effectiveness of a prediction, an effective ensemble approach is essential. The voting method has been proven to enhance the performance [39], and hard or majority voting is based on a binary decision rule that selects a class with a major vote. Soft voting outputs the results by combining the predicted probabilities of the classifiers. Therefore, the voting ensemble method has the merit of complementing the shortcomings of each base classifier to obtain a satisfactory performance. In this study, the focus was on disposing the classifications where the predicted probabilities of classifiers are within a set interval. Hence, the EVM was proposed to obtain a superior predictive performance for a binary classification.
Compared with the normal voting methods, the proposed EVM pays more attention to the classification of the average prediction probabilities of the base classifiers within the interval set and enhances the classification results within the interval, where the calculation formula for the minimum value of the interval is given by Equation (1), and the maximum value was calculated using Equation (2).
The detailed procedure for the EVM is described below. For each sample in the dataset, if the average prediction probability of the base classifiers is within the interval set as mentioned above, the classification result is then determined based on the majority prediction results of the base classifiers. By contrast, when the average prediction probability of the base classifiers is not within the interval and the value is greater than 0.5, the classification result of the EVM is 1; otherwise, it is 0. The framework of the EVM is shown in Fig. 3.
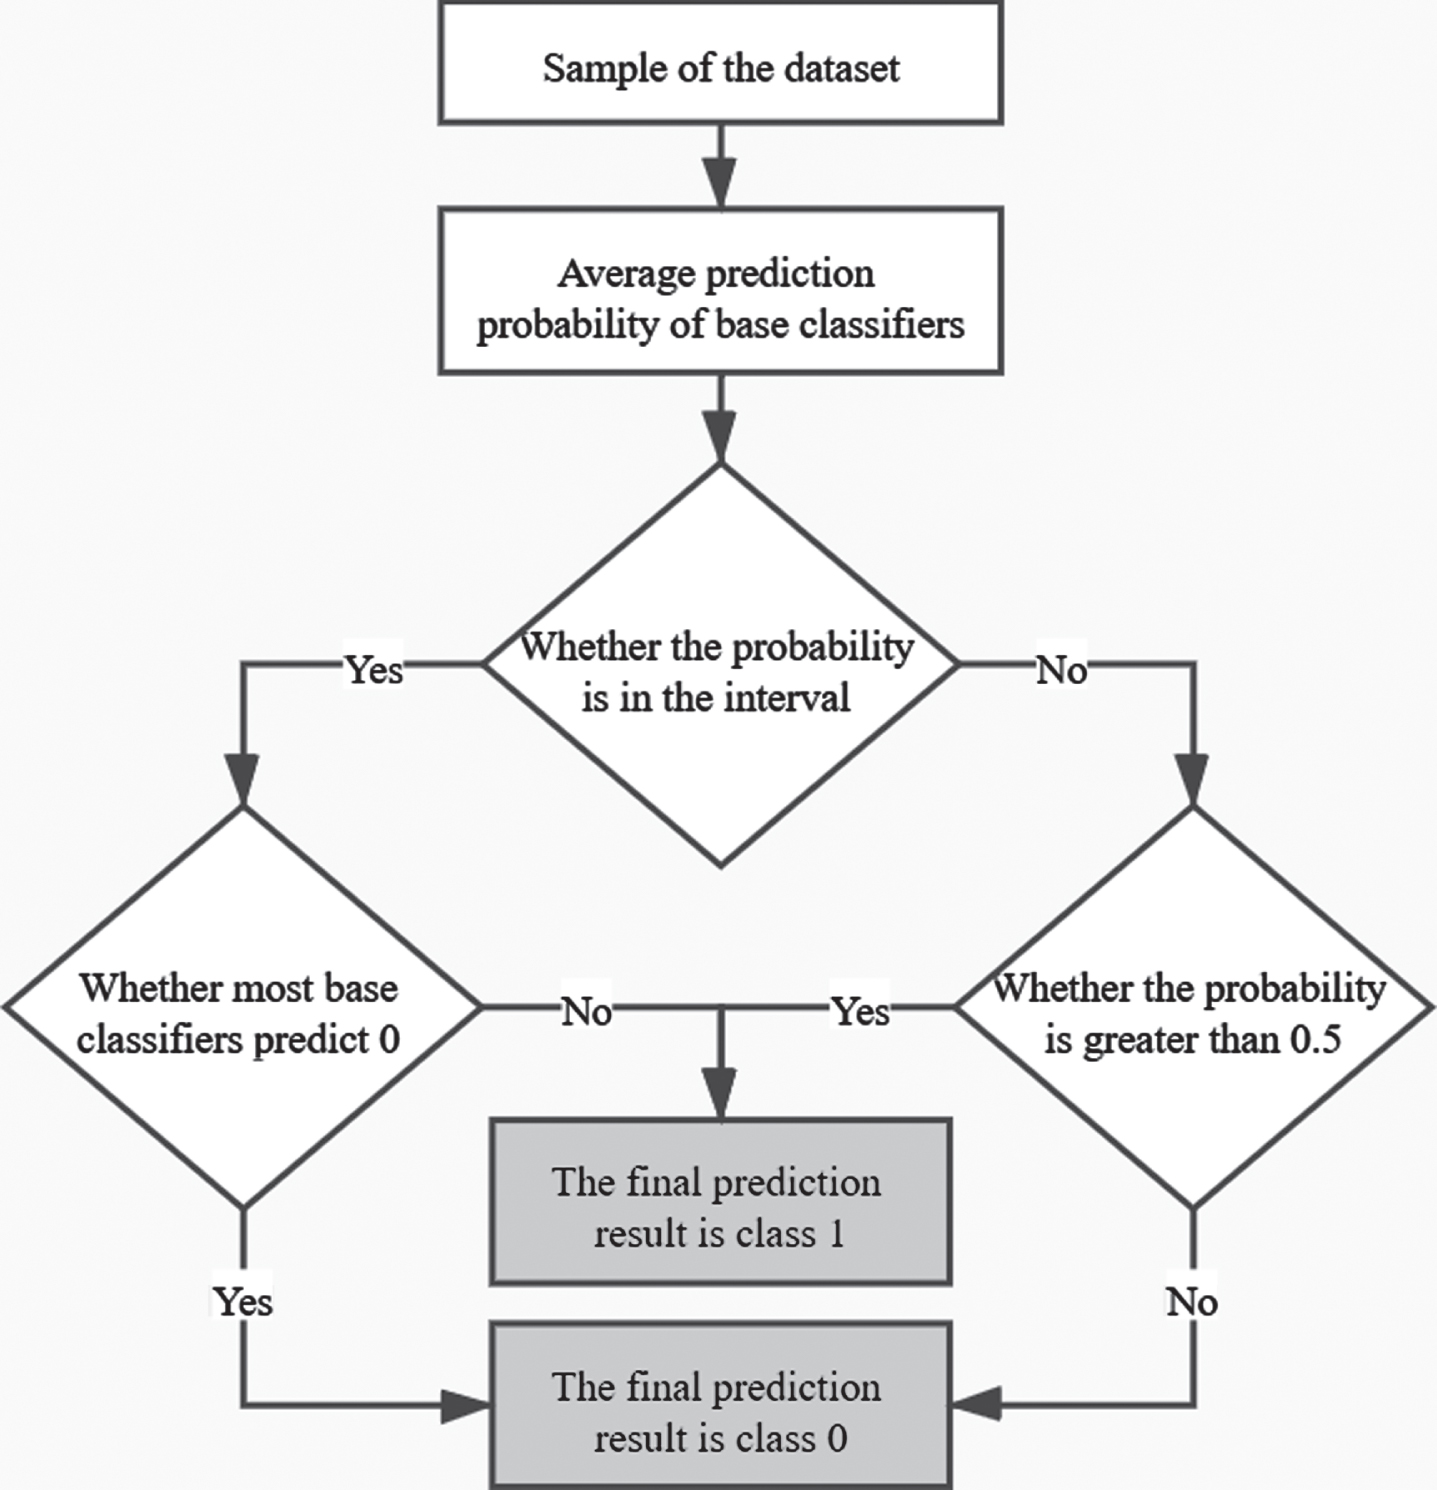
Framework of the EVM.
The experimental design of the proposed hybrid model is presented in this section, and its prediction competence and robustness are evaluated. The following four parts are described in detail: dataset description, performance evaluation indicators, data preprocessing, and experiment parameter settings.
Dataset description
In this study, three public credit datasets from the UCI Machine Learning Repository [43] were adopted to validate the prediction competence of the proposed credit scoring model, including the Australian, German, and Japanese datasets. The detailed introduction of the datasets is shown in Table 1.
Description of the datasets
Description of the datasets
The Australian dataset involves a total of 690 samples, of which the number of samples labeled as non-defaulting (good samples) is 307, and the number of defaulting samples (bad samples) is 383. There are14 attribute feature dimensions for each sample, excluding class labels, 8 of which are numerical features and 6 of which are categorical features. The German dataset involves a total of 1000 samples, of which 700 samples are labeled as non-defaulting (good samples), and 300 are defaulting samples (bad samples). There are 20 attribute feature dimensions for each sample, excluding the class labels, 7 of which are numerical features and 13 of which are categorical features. The Japanese dataset involves the same number of samples as the Australian dataset, except that 383 samples of the total samples are good samples and 307 samples are bad samples. There are 15 attribute feature dimensions for each sample, excluding the class labels, 6 of which are numerical features and 9 are categorical features.
In this research, five recognized evaluation metrics in machine learning were used to verify the prediction competence of the credit scoring model proposed, including the accuracy, AUC, F-score, Log loss [44], and Brier score [45]. The accuracy, AUC, and F-score can be calculated using TP, TN, FP, and FN values.
Where TP represents the number of actual positive values predicted by the model are positive, TN represents the number of actual positive values predicted by the model are negative, FP represents the number of actual negative values that the model predicts are positive, and FN represents the number of actual negative values predicted by the model.
Accuracy is an important metric for evaluating the predictive capability of the classification models, and can be represented by Equation (3). The higher the accuracy, the better the prediction capability of the classification model.
AUC is widely applied to evaluate the classification problems, which can effectively demonstrate the performance of the classifiers. The area enclosed by the ROC curve and the coordinate axis is defined as the AUC value. The higher the AUC value, the better the prediction competence of the classification model.
The F-score can be calculated using Equation (6). For a more intuitive representation of the F-score, the defined formulas for Precision and Recall are shown in Equation (4) and Equation (5). Log loss is a significant classification measurement based on probability. As defined in Equation (7), n represents the number of samples; y
i
and p
i
represent the actual value and the probability prediction, respectively; and y
i
∈ {0, 1}.
Brier score has also been frequently used to evaluate machine learning models in recent years. The Brier score that measures the mean squared deviation between the predicted probability and the actual label. The lower the Brier score is, the better the performance of the model. This is defined in Equation (8)
Before training the proposed credit scoring model, data preprocessing is indispensable for improving the interpretability of the data. In general, there are often missing values for the acquired datasets. Therefore, to remove the adverse impacts of the missing values, the average value is used to fill in the numerical features, as well as the mode that has yet to appear to fill in the categorical features. Numeric features were standardized by removing the mean and scaling to the unit variance. Subsequently, one-hot encoding was employed to extend the categorical features. After the above process, to improve the learning effect of the proposed hybrid model, a feature correlation analysis was used to delete one of the two explanatory features with a correlation of greater than 0.97.
Experiment parameter settings
The original dataset was divided into training data and test data according to the standard ratio of 0.8 to 0.2. In addition, the training data were further divided into training set and validation set through a five-fold cross-validation, of which 80%of the training data were used as the training set and the remaining 20%were used as the validation set. The authors in [46] proved that a cross-validation might lead to a higher average performance than a traditional holdout validation, and can also reduce the risk of a poor performance. Hence, the original dataset is divided into training set, validation set, and test set, with a proportion of 0.64:0.16:0.20. This is the data division approach commonly used by researchers, such as in [30, 47], and [29].
The classifier repository is composed of LR, SVM, DT, KNN, XGBoost, GBDT, RF, and LightGBM, and default parameters are used. In this research, the number of classifiers selected during the classifier selection stage was set to four. In the proposed FSCM-GA, the number of iterations was set to 10, and the size of the population was set to 10. The crossover probability and mutation probability are set to 0.8 and 0.2 respectively. In the proposed EVM, because four classifiers are selected in this study, the minimum and maximum values of the interval are calculated as 0.25 and 0.75, respectively. The classifiers LR, SVM, DT, KNN, XGBoost, GBDT, RF, and LightGBM are imported from the specified Python package. In the next section, the experimental results and analysis are discussed.
Experimental results and comparative analysis
The candidate classifiers for the classifier repository are evaluated in this section, for which the high-performing classifiers in each run are selected to determine the optimal feature subset. Three public credit datasets and five performance indicators are applied to validate the prediction competence and effectiveness of the candidate baseline classifiers as well as the proposed credit scoring model. To decrease the effect of randomness on the experiments, each experiment was run 20 times and the average results were evaluated. All experiments were conducted on a PC with a Microsoft Windows 10 operating system using Python Version 3.8.
Baseline classifier results
To demonstrate the effectiveness of the proposed hybrid model, the candidate classifiers were evaluated on three datasets and five performance indicators, and their performance was used as the baseline results. The following eight classifiers, LR, SVM, DT, KNN, XGBoost, GBDT, RF, and LightGBM were tested as baseline classifiers, as listed in Table 2. The classifiers with the highest performance are bolded for each evaluation indicator.
Performance of baseline classifiers in different datasets
Performance of baseline classifiers in different datasets
Note: significant values are in bold.
Table 2 shows that RF outperforms the other base classifiers in three datasets for most evaluation indicators. It is worth mentioning that LR and SVM also have a superior performance in the German dataset. However, the performance of the DT is poor in comparison to the other candidate classifiers in the three datasets.
To validate the effectiveness of the FSCM-GA, several typical classifiers (GBDT, LightGBM, and LR) were combined with FSCM-GA and a normal GA feature selection method to compare the performance on the same dataset and evaluation metrics. The prediction competence of the classifiers combined with the normal GA feature selection method was evaluated on three datasets and five performance indicators. The results are presented in Table 3, where “N-GBDT,” “N-LGBM,” “N-LR” represent the GBDT, LightGBM, and LR combined with the normal GA feature selection method, respectively. For the same datasets and evaluation metrics, the evaluation metric values of the selected classifiers are shown in bold if the normal GA feature selection method is employed to improve the performance in comparison to the baseline results. As shown in Table 3, most of the five evaluation indicators of the three selected classifiers improved after the normal GA feature selection method was employed. This result proved the effectiveness of the genetic algorithm in enhancing the predictive precision of the classification models.
Performance of normal GA feature selection method using different datasets
Performance of normal GA feature selection method using different datasets
Note: bold indicates significant values.
To demonstrate the superiority of the FSCM-GA over the normal GA feature selection method, the FSCM-GA was employed to combine the classifiers to test the same datasets and evaluation metrics. The test results are listed in Table 4, where “F-GBDT,” “F-LGBM,” and “F-LR” represent the GBDT, LightGBM, and LR combined with FSCM-GA, respectively. Compared with the normal GA feature selection method, the bold fonts of the evaluation metrics indicate that the performance of the selected classifiers has been improved after the FSCM-GA is employed. The results in Table 4 prove that the proposed FSCM-GA has a better effect on improving the classification model performance compared to the normal GA feature selection method.
Performance of FSCM-GA using different datasets
Note: bold indicates significant values.
Figure 4 shows the performance trend of each classifier after a normal GA and FSCM-GA are applied as feature selection methods. Three evaluation indicators, the accuracy, AUC, and F-score, were selected and applied to three datasets to illustrate the results. The time cost of the GA in different datasets are showed in Fig. 5.
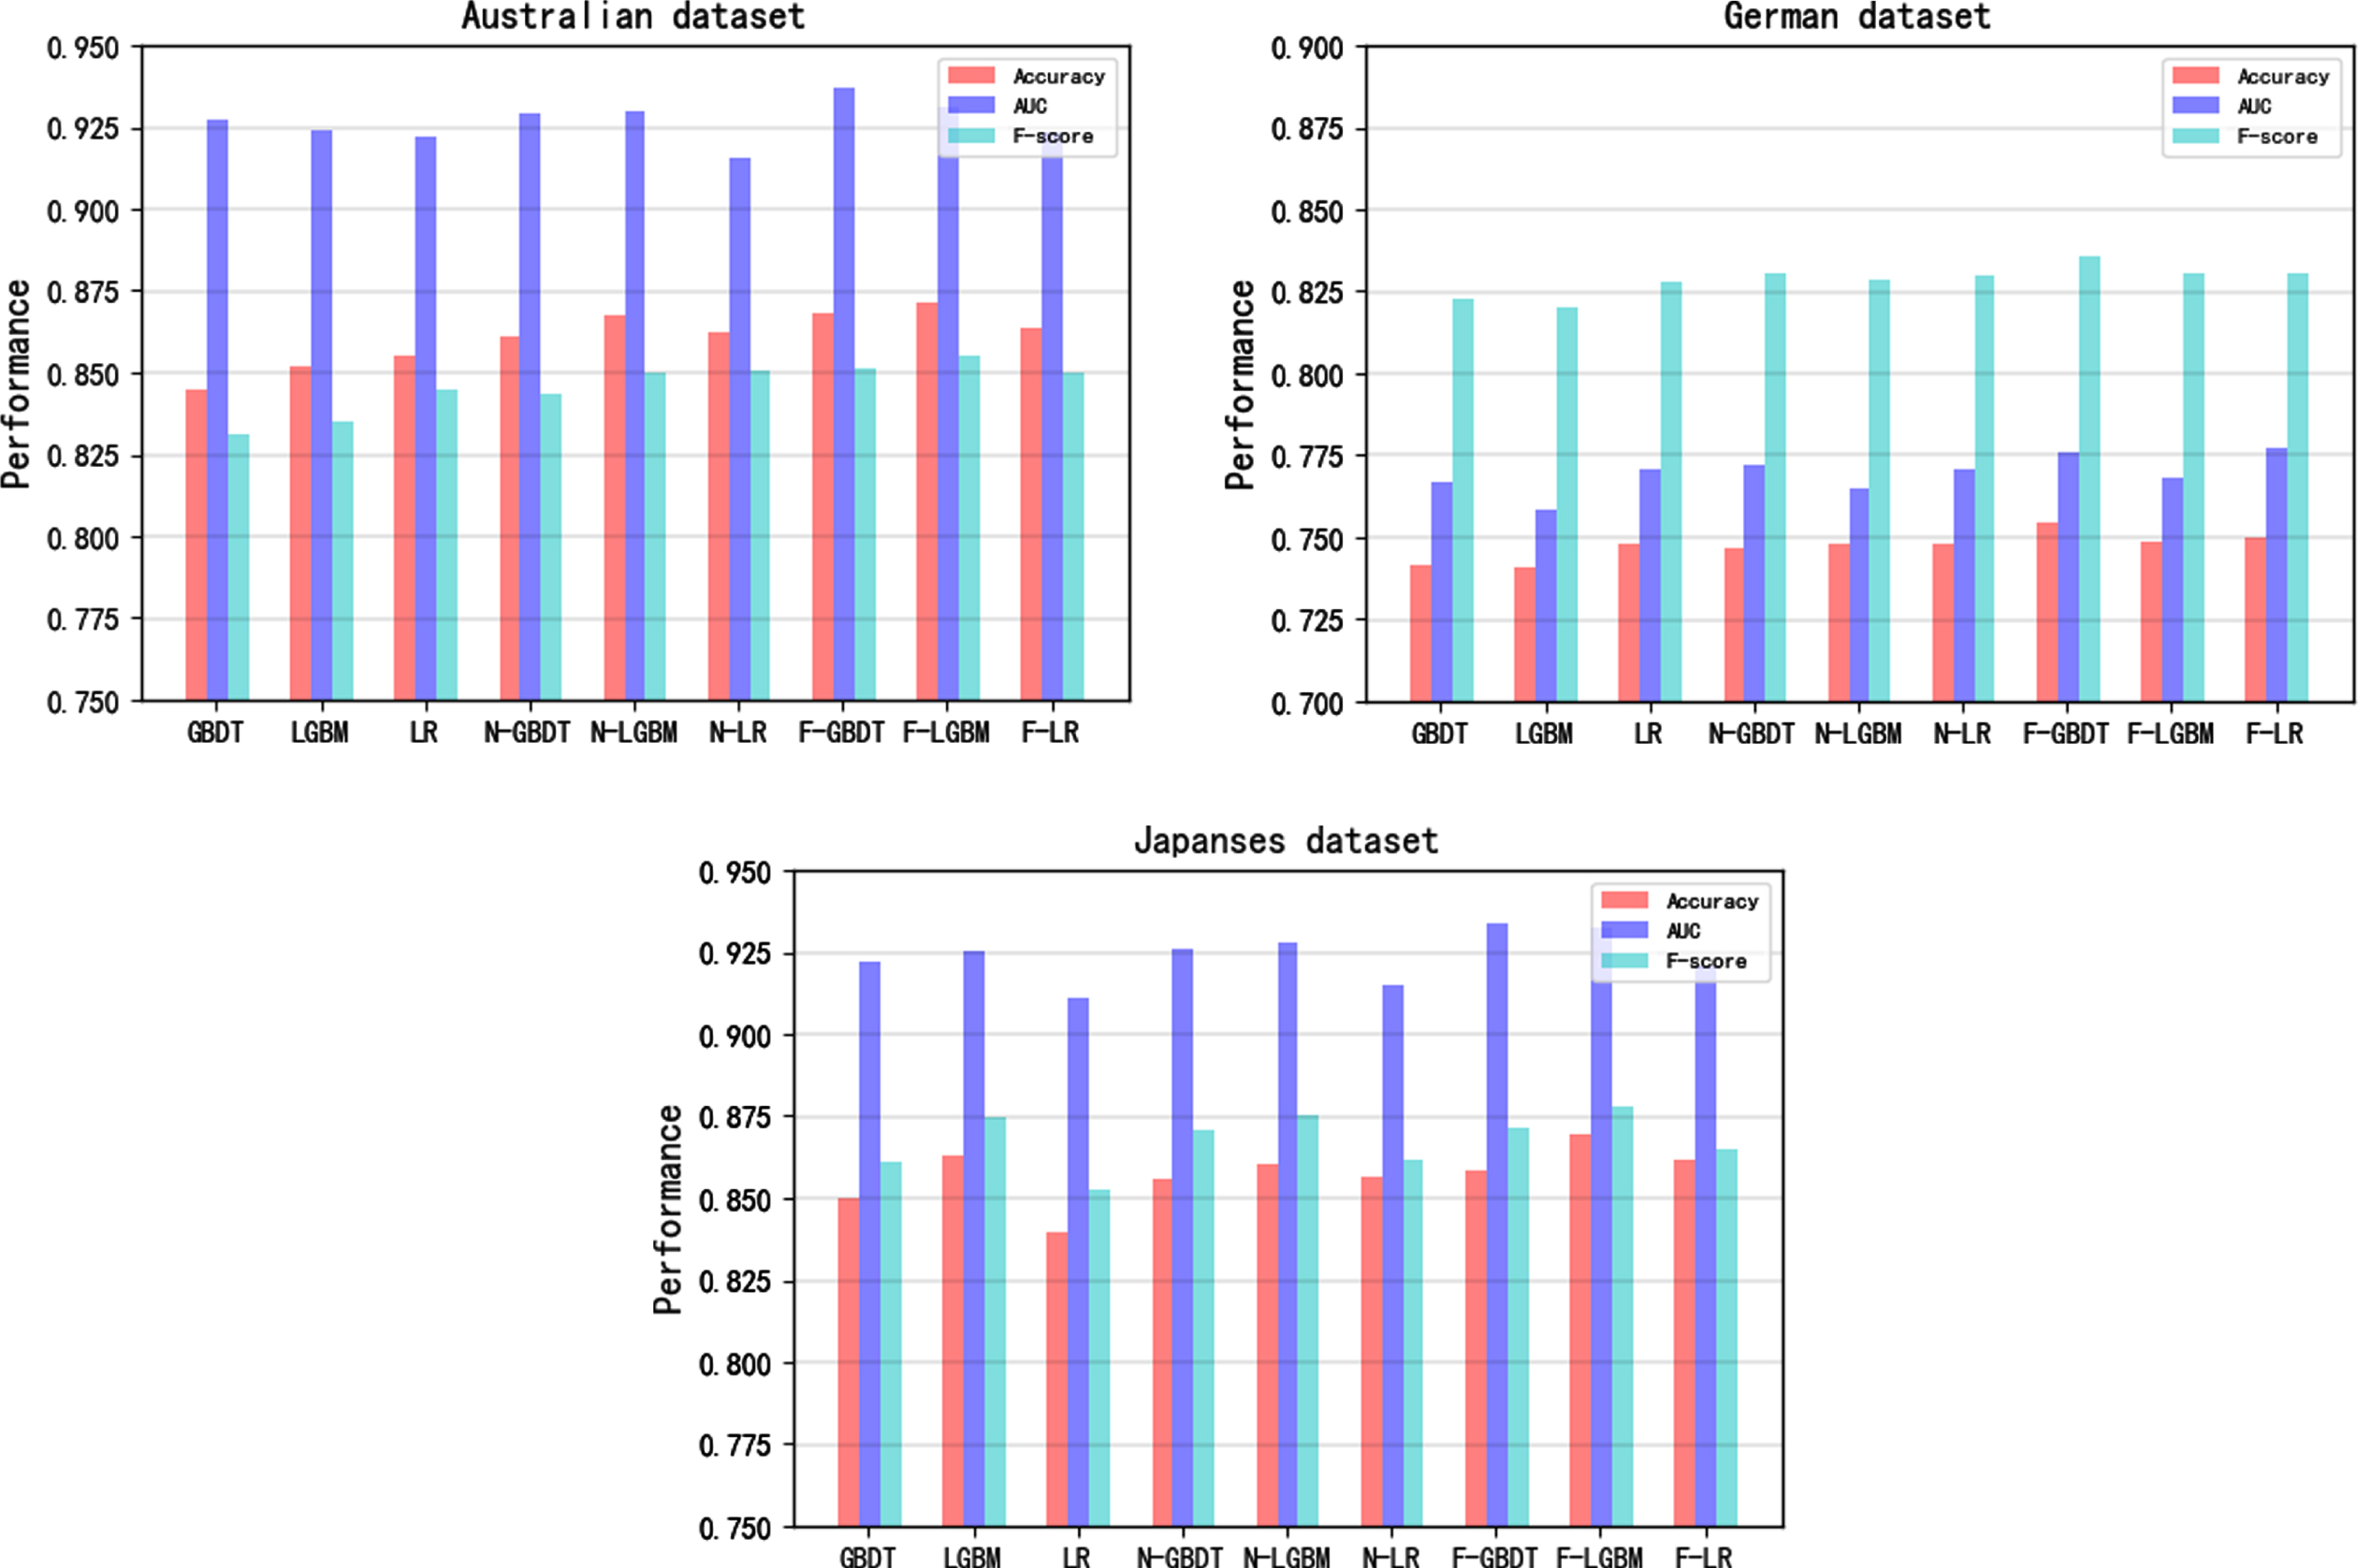
Performance comparison between normal GA and FSCM-GA in three datasets.
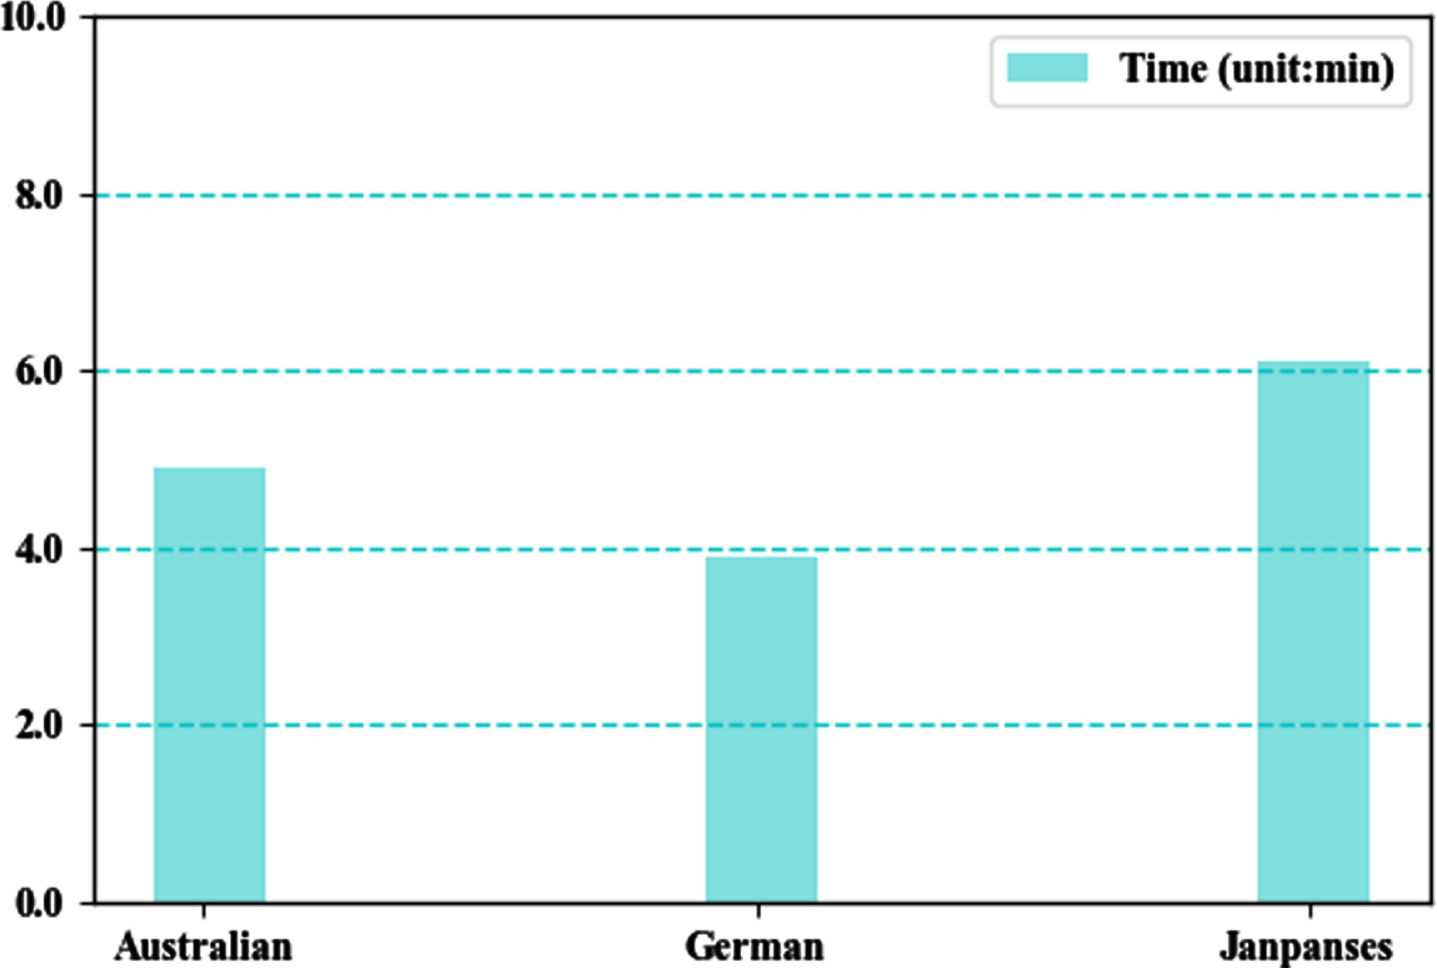
Time cost of the GA in three datasets.
In this section, the proposed EVM is compared with the soft voting method using five evaluation metrics to demonstrate its effectiveness. Similarly, SVM, DT, KNN, GBDT, RF, LightGBM, and LR were selected as the base classifiers, and different combinations were tested. The corresponding performances under the datasets are presented in Table 5. If one of the EVM and soft voting methods performs better, the evaluation metric values are indicated in bold. The results in Table 5 indicate that the overall performance of the five evaluation measures obtained by the EVM is better than that of compared to the soft voting method.
Performance of the soft voting and EVM in different datasets
Performance of the soft voting and EVM in different datasets
Note: bold indicates significant values.
Because the performance of the candidate classifiers is affected by the datasets, their performance rankings vary by dataset. The final prediction result of the proposed credit scoring model was obtained using the ensemble model composed of the selected optimal classifier subset and the feature set on the test set, as shown in Table 6. Compared to the baseline results mentioned above, the proposed credit scoring model showed significant improvements in all evaluation metrics on the three datasets. This proves that the proposed credit scoring model has a high prediction competence and provides considerable help for credit risk management of credit institutions to reduce economic losses, bring in higher returns, and help to better develop under fierce competition conditions.
Performance of the proposed model in different datasets
Performance of the proposed model in different datasets
The prediction competence of the model proposed in this paper is compared with the model proposed in previous studies [30, 47–50], as shown in Table 7. Each model was tested on the datasets applied in this study with different evaluation indicators.
Performance of the proposed model compared with other models
Performance of the proposed model compared with other models
Note: bold indicates significant values; “/” indicates that the corresponding evaluation indicators are not presented in the previous work.
Here, “/” indicates an evaluation metric that is not used in previous studies, and bold indicates a specific evaluation metric of the proposed model that outperformed the other models on the same dataset. The comparison results presented in Table 7 demonstrate the superior prediction competence of the proposed model.
In this section, the Friedman test [51] applied to prove the significance of the proposed model is described. Seventeen different models were tested, including candidate baseline classifiers, classifiers combining normal GA feature selection methods, and classifiers applying the proposed FSCM-GA, the ensemble model with soft voting, the classifier ensemble model with the proposed EVM, and the proposed model.
The Friedman test is a typical non-parametric statistical test, used in this study to compare the predictive competence of the models for each evaluation metric. The ranking of each model for each evaluation metric on all datasets is calculated, and the average ranking of all evaluation metrics was further calculated according to [14], as shown in Table 8. This indicates the comprehensive ranking results for each model. The significant test results indicate that the proposed model is better than the other models, and its rankings are shown in bold. In addition, both the statistical value and the p-value of each evaluation metric were calculated using the Friedman test and placed at the end of Table 8.
Classifier ranking results of Friedman test
Classifier ranking results of Friedman test
Note: bold indicates the ranking values of the proposed model; the alpha value is 0.05; the Chi-square critical value is 5.99.
The test results in Table 8 indicate that the statistical values of each evaluation metric calculated using the Friedman test were higher than the Chi-square critical value, and the p-values were all lower than the alpha value (0.05). Hence, the hypothesis of the statistical significance test is invalid, and the prediction competence and robustness of the proposed model are verified.
The credit scoring system has always been an important tool for the development of financial institutions. The gradual maturity of artificial intelligence technology has brought immeasurable assistance to the financial sector, and various credit scoring models have been constructed to reduce the risk of credit defaults. Researchers have conducted a variety of important explorations in classifier selection, feature selection, and ensemble methods. Despite research conducted on the combination of the above methods, there still retains the problem of an optimal ensemble that needs further exploration. Herein, a hybrid model is proposed with a new feature selection method and an enhanced voting method to achieve a conspicuous improvement in credit scoring, which includes the classifier selection stage, feature selection stage, and classifier ensemble stage. Based on the performance of each classifier used in the training set, a subset of the optimal classifiers was obtained. Furthermore, FSCM-GA is proposed to obtain a subset of optimal features, using the optimal classifiers obtained through the classifier selection stage as an evaluation function. Finally, the proposed EVM is applied to integrate the classifiers to output the final result with the two subsets mentioned above. The predictive competence of the proposed model was proven on credit datasets, and five performance indicators were applied as the performance measures. The experimental results indicate that the prediction competence of the proposed FSCM-GA is better than that of the normal GA feature selection method. Moreover, compared with the soft voting method applying several different combinations of base classifiers, the proposed EVM achieves a superior prediction performance. The Friedman test results prove that the performance of the proposed model is significantly enhanced compared to the benchmark models, which will inspire researchers for future research on machine learning models.
This study has certain limitations that need to be addressed. For classifier selection, only one evaluation indicator was evaluated to obtain the optimal classifier subset. In the future, an attempt will be made to add more evaluation indicators for selecting the classifiers. In addition, more credit datasets need to be used to validate the effects of the model. Moreover, it is important to validate the efficiency of the heuristic algorithm. Finally, this study can be applied to other fields of financial forecasting.
Footnotes
Acknowledgments
The research in this article has been supported by the National Natural Science Foundation of China under Grant No. 71801187.