
Abstract
With the development of infrastructure construction in China, the number of bridges is increasing rapidly, putting a strain on operation management and structural maintenance. Bridge Information Management System (BIMS) uses information and digital technology to ensure the maintenance of the bridge in long-term operation. However, large-scale bridge models are large in size, complex in structure, rich in information and occupy more computer resources, which harms performance of the BIMS. This paper aims to design and develop a bridge information visualization management system based on Building Information Model (BIM). The geometry and material information for the model is extracted from the IFC by the secondary development of Revit. The lightweight method of the bridge model is studied and implemented, and the model volume is reduced to less than 20% by using the lightweight algorithm. Also, a Web-BIM-oriented model visualization scheme is proposed to render the lightweight model into the browser. This system integrates BIM with the Internet of Things (IoT) and contains information visualization, human-computer interaction and user collaboration. Such a BIMS can effectively relieve the pressure of bridge operation and maintenance, while also providing managers with a safe and reliable platform.
Introduction
With the advancement of industrialization reform in China in recent years, the industry of transportation has grown by leaps and bounds. The bridge is an important piece of transportation infrastructure that plays an essential role in social and economic development. According to the statistics, the number of reinforced concrete bridges in China has ranked first all around the world [1]. The increasing number of bridges brings tremendous pressure during maintenance. Environmental factors may cause different structural damages to the bridge during its long-term operation. As a result, the reliability and life cycle of bridges will be influenced [2]. Unseasonal bridge maintenance may cause some unpredictability in safe-related accidents. For example, the collapse of Hefei Bridge and the Wuxi Viaduct in China has resulted in a series of property losses and casualties. Bridge Information Management System (BIMS) supports the stages of bridge design, construction, operation, and maintenance to improve efficiency and reduce costs [3]. Many countries have invested heavily in both their economies and their people to develop the BIMS.
Nowadays, BIM technology is widely used in engineering construction due to its high visualization and coordination capabilities. BIM can reduce the Life Cycle Cost (LCC) and improve construction efficiency [4]. There is an increasing amount of commercial software based on BIM that has been developed and applied during all walks of life, such as Autodesk Revit, ArchiCAD, and so on [5]. These software are usually used during buildings design and construction stages, but rarely used during operation and maintenance stages [6, 7]. Most of those applications are based on the C/S, which is not suitable for most users because of its higher professional requirements. Therefore, how to reduce the complexity and expand the application capabilities became the focus of many companies [8]. WebGL is a Web-based drawing library that has the advantages of being compatible with all kinds of Web browsers [9], making it an ideal tool for developing the BIMS based on the Browser/Server(B/S).
WebGL inspires BIM designers with new design concepts [10]. Many scholars proposed different methods for designing BIMS. Wan et al. [11] studied and extended Industry Foundation Class(IFC) and International Framework for Dictionaries(IFD) standards, proposed a standardized structural modeling method for rapid BIM model establishment, and realized the design of a Web-BIM-oriented bridge management system. However, with the increasing size of IFC file, the mode’s rendering speed will decrease. Philipp et al. [12] proposed a candidate model for binding the information model with IFC, which was used to classify the detection information on the Reinforced Concrete bridge to meet the needs of different users for sharing and standardizing format storage. This research focused on bridging defect information classification and sharing rather than relieving the pressure of bridge operation and maintenance. Liu et al. [13] proposed a method for visualizing large-scale Web3D models. This method has reduced the model volume and effectively improved the real-time performance of model rendering. However, this method only supports the display of 3D models and can not demonstrate the influence of external environment information on buildings.
In this paper, BIMS based on BIM is proposed to reduce the pressure of bridge operation and maintenance. This method firstly analyzes the IFC file of the bridge by Revit API. Next, it sets up the information access interface, extracts the geometric model file of the bridge, and pushes it into an obj file for exporting and saving. Then, the obj file is compressed by the Draco 1 algorithm to reduce the model’s volume. Combining with WebGL, the BIM model can be rendered more quickly in the browsers. Simultaneously, this paper introduced the visualization function of environmental information and achieved the real-time display of the environmental information selected from the database. The decision-makers can put forward a reliable bridge maintenance scheme by analyzing environmental information. BIMS realizes the bridge information collaborative management based on web BIM and effectively improves the efficiency of bridge maintenance management.
System design
System analysis
BIMS aims to use informatization and digitization technology to realize the visual display of bridge 3D model and the collaborative management of the bridge information. Traditional 3D model visualization is designed and developed based on the Client/Server(C/S), which needs professional applications. Moreover, this strong specialization limits the application of BIMS. The BIMS model usually consumes too many computer resources due to its large volume, and the rendering speed is unsatisfactory [14]. In bridge maintenance, the construction personnel needs to understand the real-time environmental data of the bridge to analyze the bridge structure load and propose a reasonable bridge maintenance scheme. According to the above demand analysis, the system design scheme based on B/S is determined, which has the three characteristics listed below:
Virtual visualization
Bridge model virtual visualization is the key of the BIMS. Virtual visualization mainly includes 3D model visualization and monitoring of data visualization. This paper employs WebGL technology and Three.js 2 as the overall framework. It proposes a 3D model rendering method based on the B/S to realize 3D model rendering and redrawing on the browser. Data visualization is used to display the information about the bridge’s components and the node monitoring, including historical data query and data dynamic curve display. Maintenance personnel can develop a reliable bridge maintenance program by checking and analyzing the data. The system communicates with the information collection equipment through the server, and the collected bridge information is stored on the server. The node monitoring information is displayed on the browser by calling the interface to realize the visual management of the data.
Real-time
Real-time transmission ensures that the data can be transmitted in a timely and effective manner, allowing users to receive the bridge environmental information in time and protecting against possible safety accidents.
Interactivity
The use of interactive design can improve the user experience. Users can control the function buttons of each module in the system through mouse and keyboard or select different monitoring nodes to check real-time monitoring information.
System function module design
According to the above analysis, the bridge information management system mainly includes four modules:
Data acquisition module
The bridge information acquisition node is integrated by sensors, controllers and wireless transmission module. Transmission Control Protocol/Internet Protocol(TCP/IP) communication is used by data acquisition nodes to transmit the collected environmental information to the database in real-time.
Visualization module
This module includes 3D model visualization and data visualization functions. To optimize system performance, it is necessary to lightweight the model. The design of the model lightweight is divided into two steps in this paper: Firstly, the model’s geometric data is extracted from the IFC file and encapsulated into obj format. Then the Draco algorithm is used to compress the model, greatly reducing its volume. Data visualization includes the real-time display of monitoring data and information display of bridge components.
Interactive design
It gives users a more intuitive and convenient way to check 3D model component information and node real-time monitoring data. It mainly includes roaming and information display functions. The roaming function creates the first-person and trackball roaming. In the first-person roaming mode, users can control the viewing angle with the model by mouse and keyboard. In the trackball roaming mode, the view angle will be displayed along the set observation track. Meanwhile, users can select the model component or monitoring node with a mouse to view the component parameters and real-time monitoring information.
Background service
It provides database query and database update, realizes the acquisition and storage of monitoring node data, and provides data support for information display.
System development process
According to the above analysis, the overall framework of the BIMS is designed and developed based on Web-BIM. This system is divided into the above four modules, each of which performs a different function.
Data Acquisition
Bridge monitoring information is mainly collected by information monitoring nodes. The information monitoring node is built with IoT technology as the core. Through the analysis of bridge collapse accidents, four digital sensors of temperature, humidity, wind speed and pressure are selected as information acquisition equipment. After the information is collected, it is transmitted to Microprogrammed Control Unit(MCU) for processing, and then uploaded to the cloud server through the Lora gateway, which is associated with the sensor in the 3D model to realize digital-model fusion. Figure 1 shows the architecture of the data acquisition.
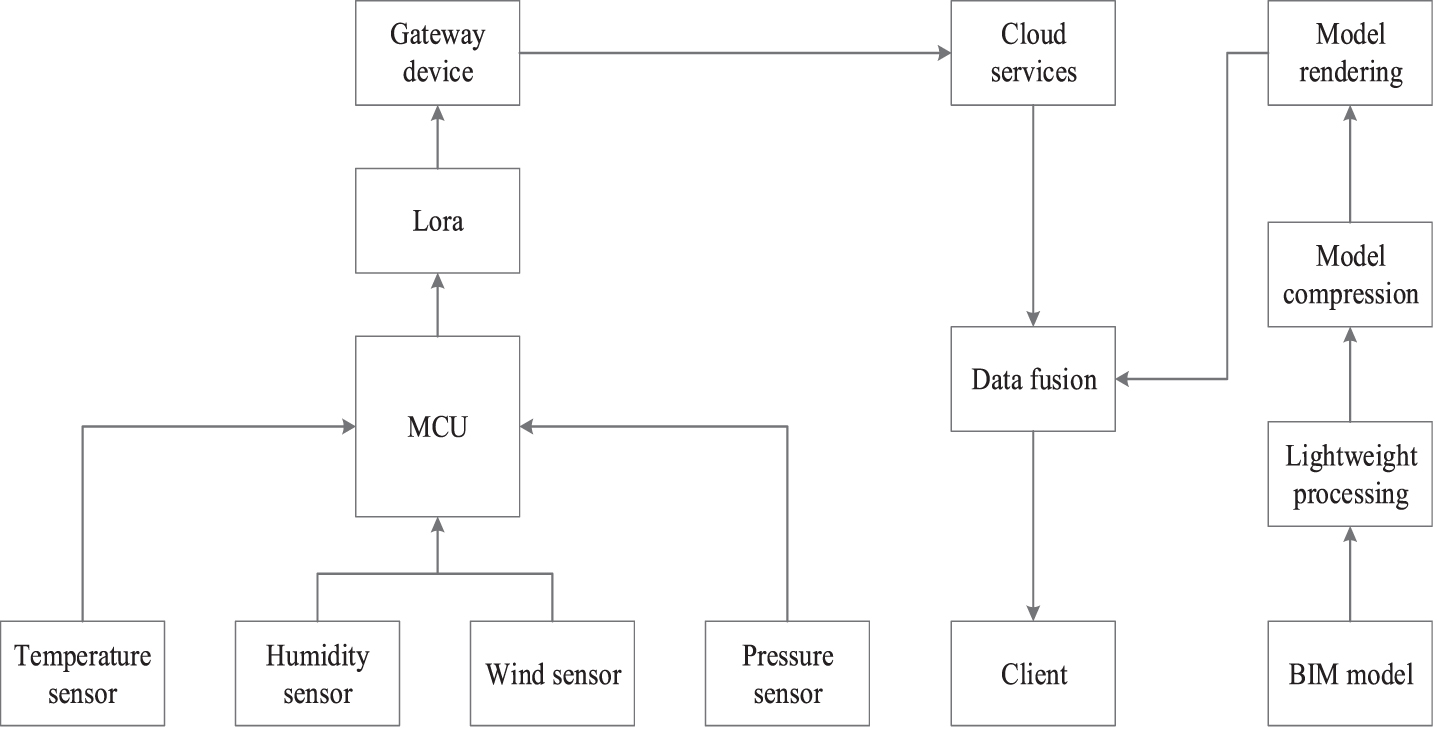
Data acquisition.
BIMS aims to provide an open, cross-platform BIM online visualization scheme. However, for large bridge structures, there are many static attribute information in the process of building a 3D model, resulting in an excessively large final volume of the 3D model [15]. The large volume model file consumes more computer resources and increases the rendering time of the model. Therefore, the model file must be lightened. Figure 2 shows the lightweight model scheme divided into two steps: geometry file extraction and model compression.

Model lightweight programme.
IFC data is an international standard for BIM system integration, data exchange and sharing. It can be used to describe the interaction of building objects and components [16, 17]. The origin of IFC is to integrate construction engineering data into an information model that includes all aspects of the construction industry, such as geometry, topology, attributes, cost, materials, etc. It makes the simple data exchanged more complicated [18]. Simultaneously, in 3D model rendering, a large number of building parameters and attribute information in IFC are not applied, but they take up a lot of storage space, slowing down the rendering speed of the model. Therefore, to build a Web-BIM system, the required data must be extracted from IFC files to reduce the model volume. Figure 3 shows the scheme of model geometry information extraction.
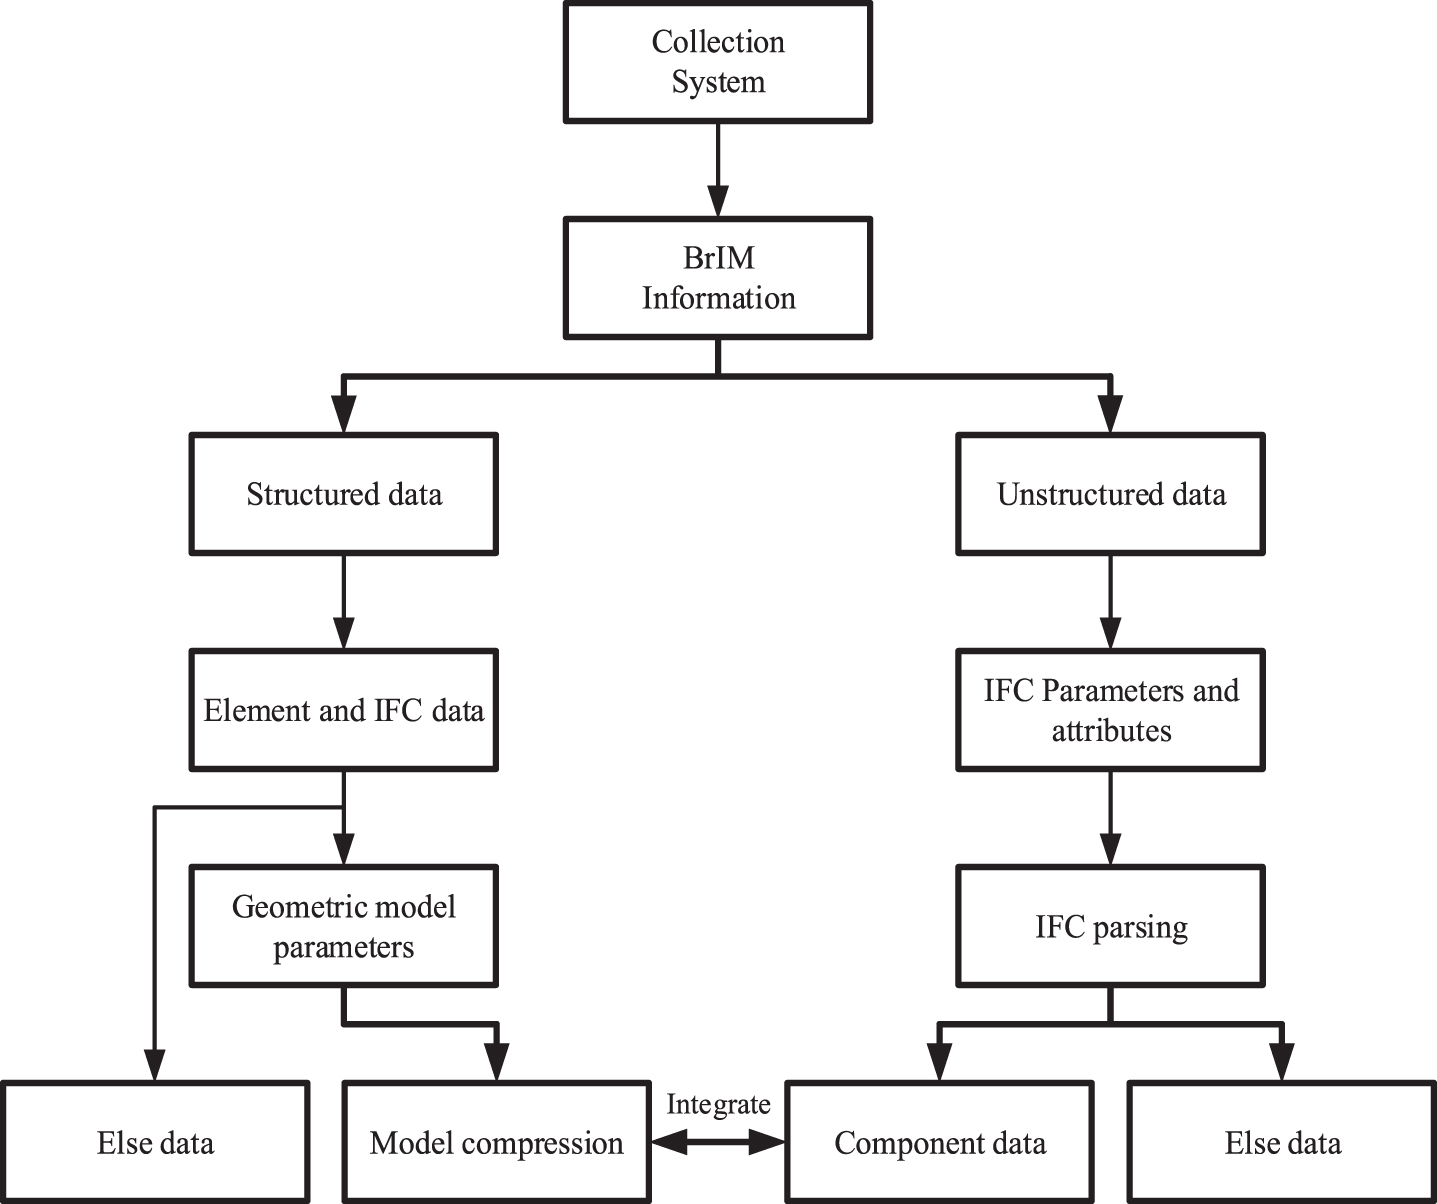
Data extraction of the 3D geometric model.
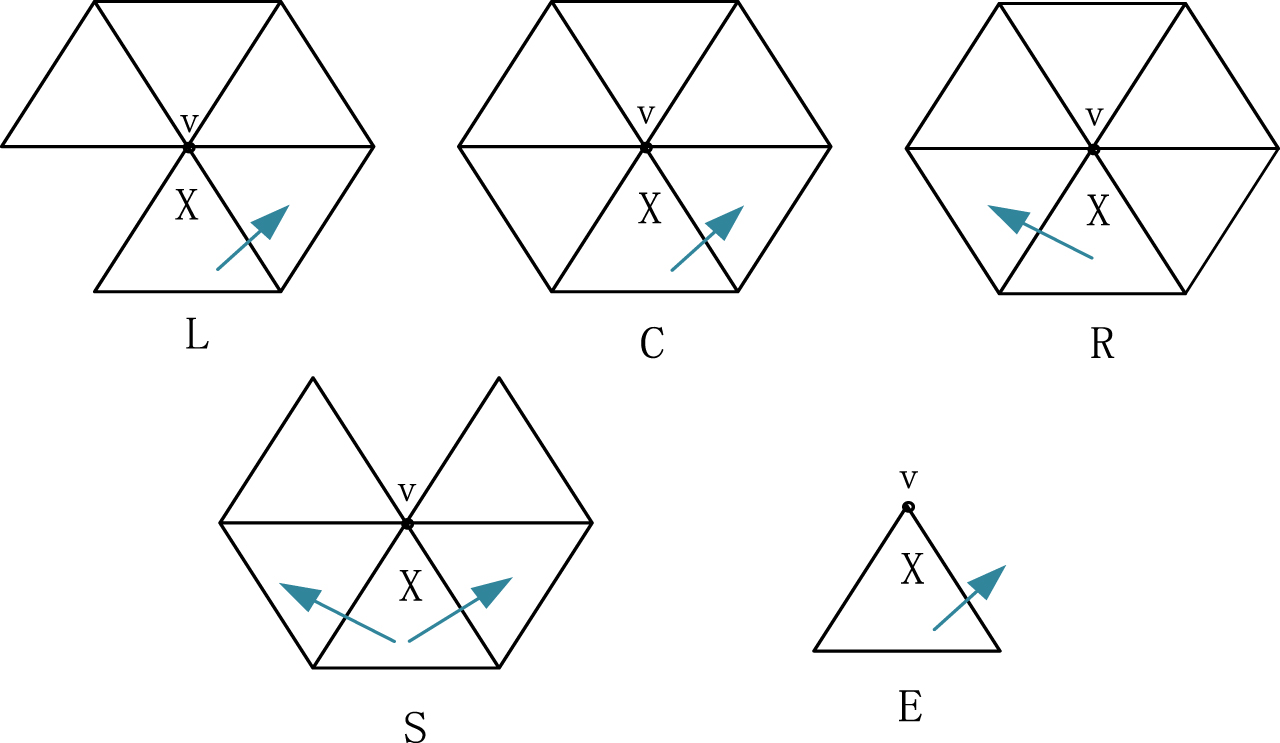
Edgebreaker Traverse access.
The first step of model lightweight is model data extraction. IFC contains the elements from each class in the BIM model, such as color, material, geometry, size, etc. The number and type of elements in the bridge’s BIM model are different and the geometric structures of the original model need to be preserved after data extraction. To reduce the error of model information extraction, it is necessary to analyze the structures of the IFC file. Extract and encapsulate the class corresponding to the element information of the geometric model. The geometric storage of model elements is defined by the IfcLocalPlacement interface; The quantity storage of model elements is defined by the IfcElementQuantity interface; The attribute storage of model elements is defined by the IfcPropertySet interface. The model’s detailed state in the 3D scene is described by texture mapping. Texture mapping can be divided into color texture mapping and geometric texture mapping. Texture coordinates are essentially the mapping between texture pixels and screen space pixels, which can be understood as the transformation of the space coordinate system. Each vertex is marked with two coordinates U and V, representing the horizontal and the vertical axes, respectively. The UV value represents the percentage position of the vertex in 3D coordinates. The model’s attribute value can be extracted from Ifcplocalplacement, Ifcpropertyset, and Ifcelementquantity, associated with the definition in obj file to realize the encapsulation of IFC to Obj format.
Reducing the volume of the model can significantly improve its rendering speed. The Obj file is a standard 3D model file format that supports conversion between different formats. Since the Obj file only contains the geometric information of the 3D models, it has a small volume suitable for this system. The model volume has decreased after exporting the bridge geometry model data from the IFC file and encapsulating it into Obj format. To further reduce the volume of the model, the model must be processed by the compression algorithm.
Draco is an open-source 3D model compression algorithm frequently used to compress and decompress triangular geometric meshes and point cloud data to improve the storage and transmission rate of 3D graphics [19]. Draco combines the Edgebreaker algorithm and the parallelogram difference method. It compresses the surface information of the model through the Edgebreaker algorithm to generate a Corner Table data format, which represents the encoding of the connectivity association between a triangular mesh and a boundary vertex. The attribute information of the vertices is then compressed using the parallelogram difference method, encoded, and stored separately. The Draco algorithm supports two compression methods: lossy and lossless. To protect the integrity of the 3D model, this paper uses a lossless compression method to further lighten the model file.
The Edgebreaker algorithm is the core of the Draco algorithm. Edgebreaker algorithm traverses the triangular mesh of the model in the order of spiral (depth-first) triangle span tree. When it traverses one mesh, it outputs a topological relation descriptor of the mesh and boundary clers including the polygon in the encoded part. Clers relational characters are composed of sets {C, L, E, R, S} and different characters represent different meanings. For example, C indicates the traversal vertex is not on the boundary topology. The L and R indicate the traversed vertex is on the boundary, in addition to the current edge, there is a side in different directions on the boundary of the current triangle. S means the figure can be divided into two parts; E means all three sides of the triangle are on the boundary.
The coding process of obj format file using Draco algorithm is shown in Fig. 5. Firstly, read the model’s information from the folder and choose the compression encoding method according to the model’s type. Then encode and store the model’s mesh information, and compress the stored information through the Edgebreaker algorithm, including the model’s topological relations, vertex attribute information, etc. Finally, the compressed information is stored in the Corner Table to obtain the lightweight model file.
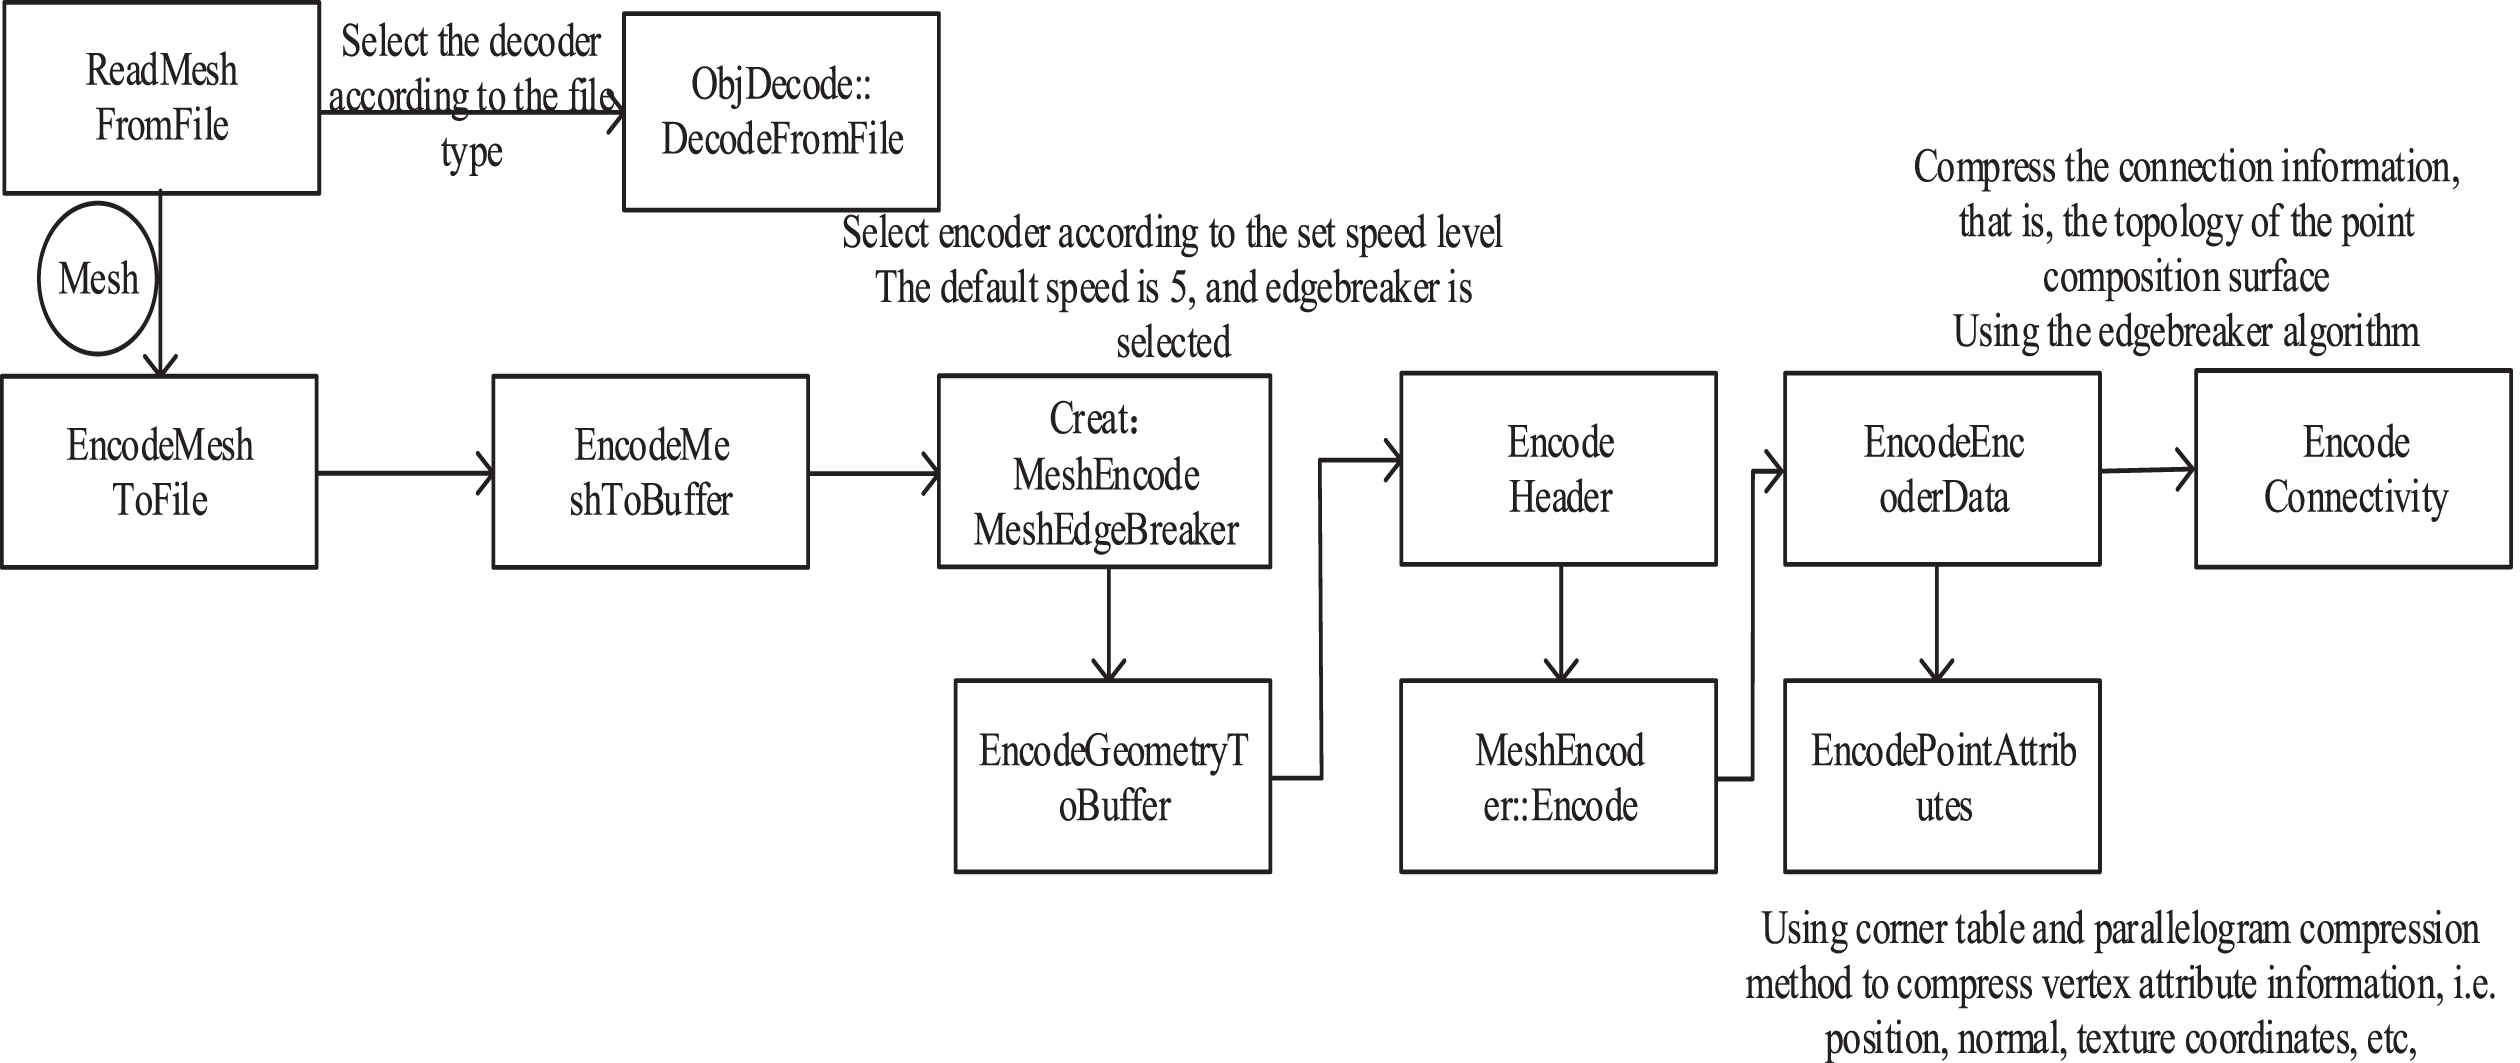
Obj coding flow chart in file format.
Figure 6 shows the visual design scheme in the system.
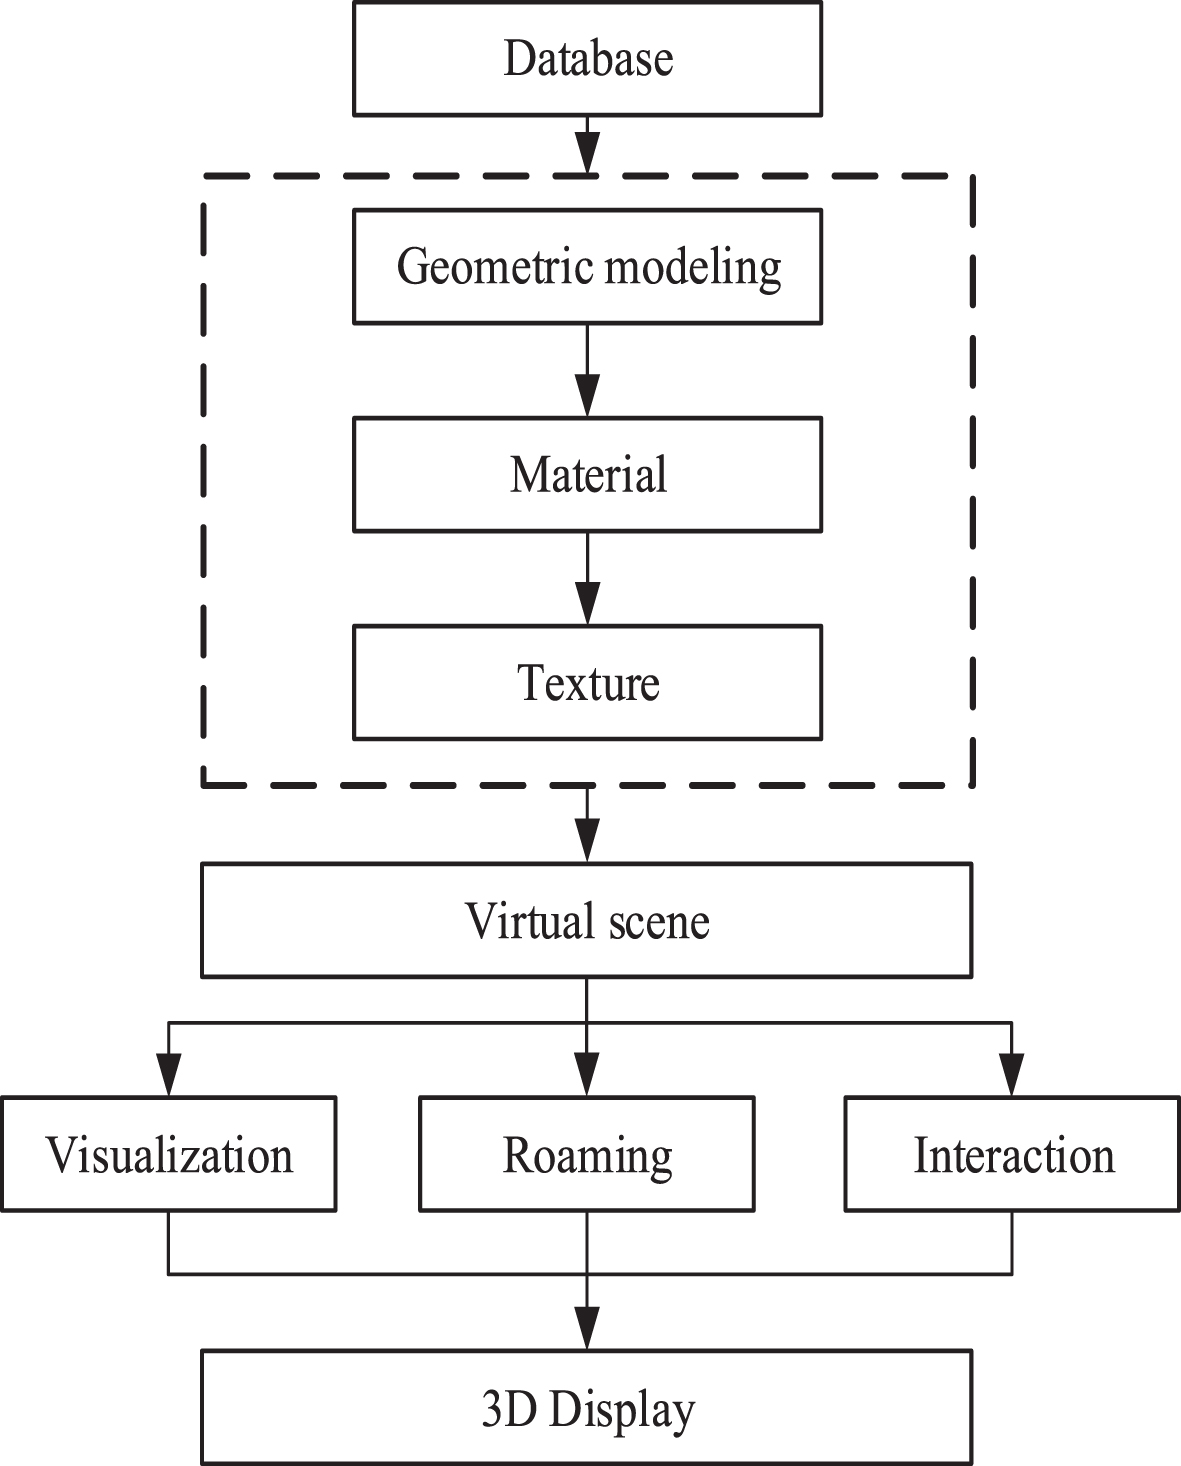
The development process of visualization function.
WebGL technology promotes the development of 3D model visualization technology. Three.js is an open-source framework of WebGL, a lightweight graphics rendering engine that runs on the Web. It simplifies the bottom API of WebGL and covers up many troubles of 3D model rendering. It can realize online visualization of the 3D model via browser rendering engine [20]. The lightweight model is uploaded to the server as a call, and the JavaScript and WebGL are programmed to realize the rendering of the bridge 3D model in the browser. Figure 7 shows the rendering steps of the 3D model on the browser. There are four steps in the rendering process.
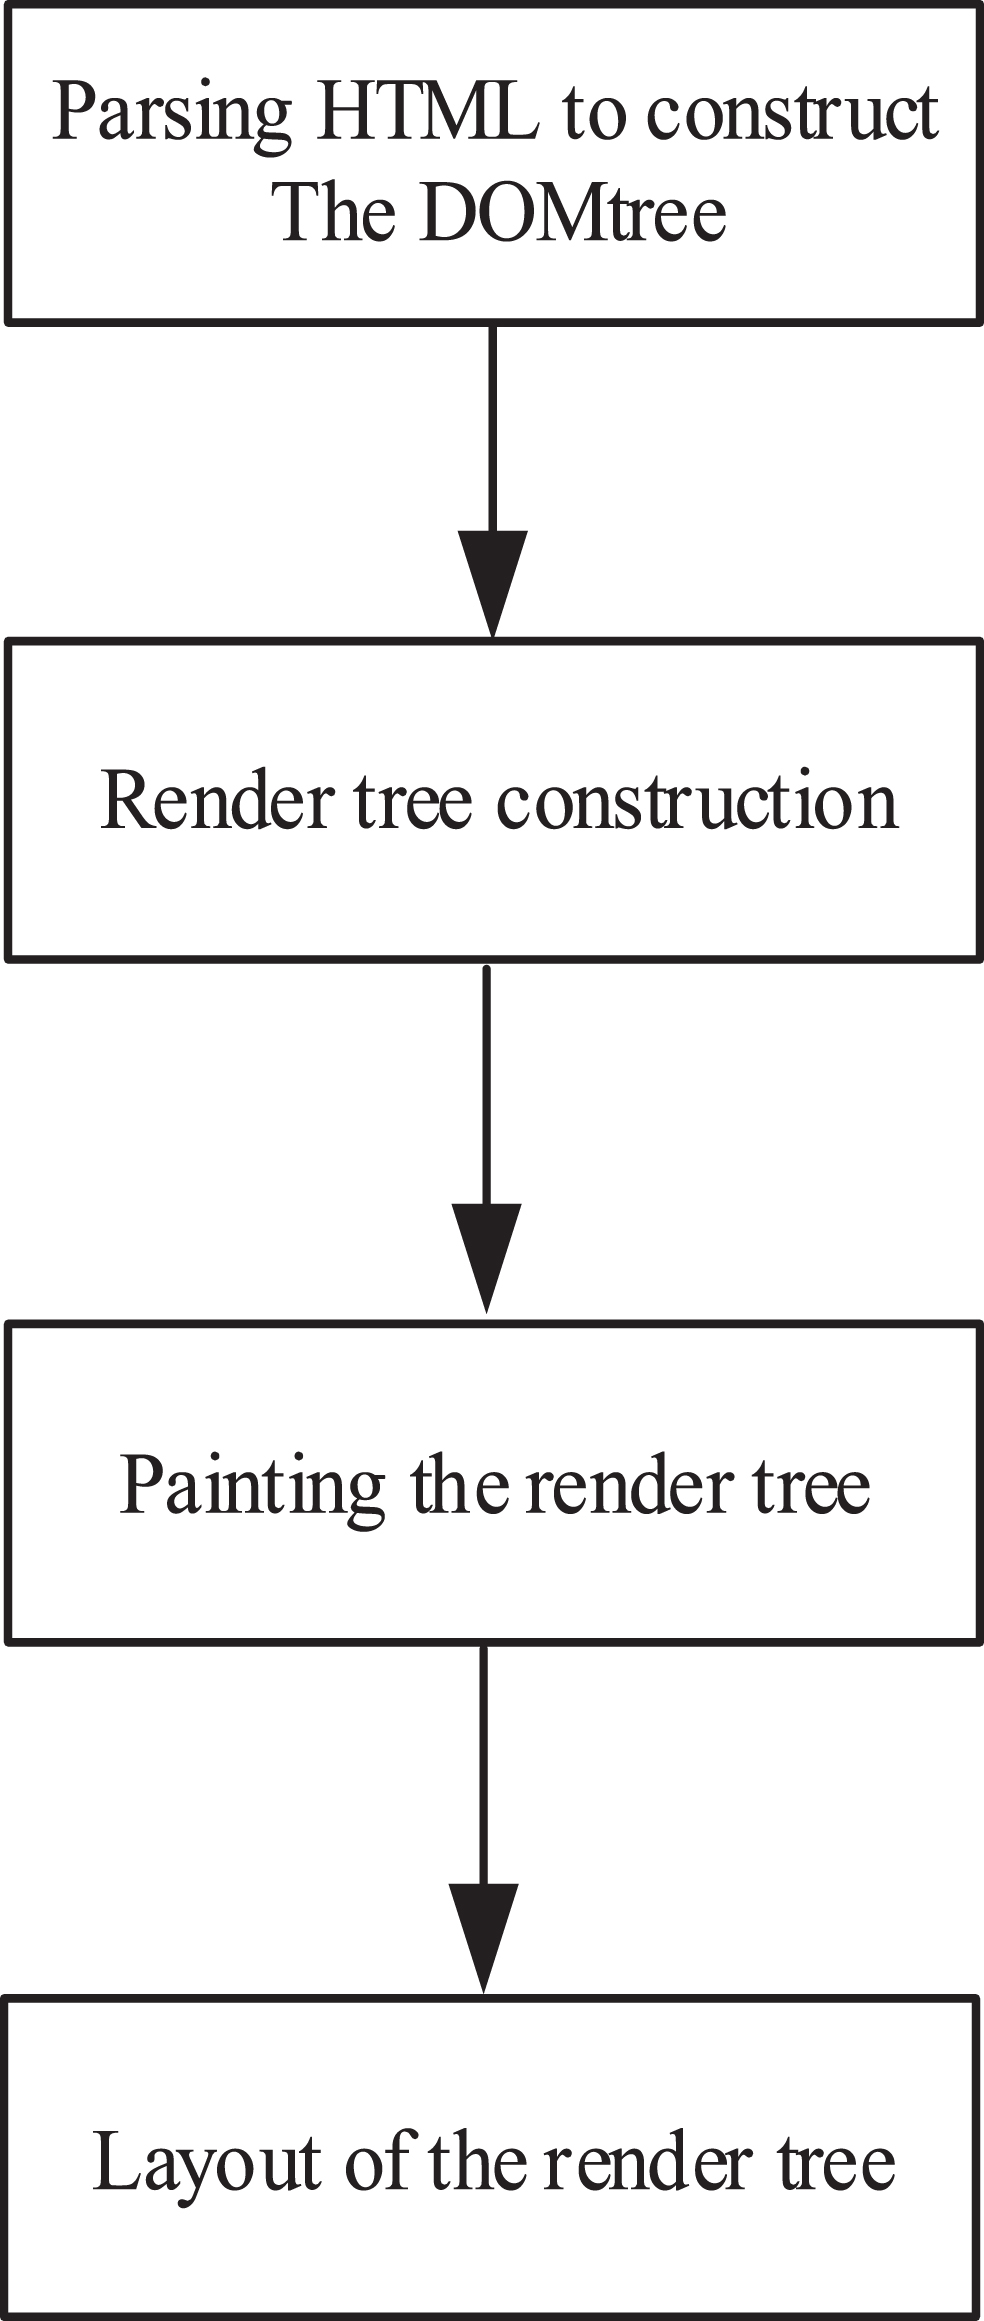
Rendering steps.
The rendering engine parses HTML document and generates a DOM tree;
Analyze CSS styles to generate CSSOM tree and rendering tree based on DOM tree and CSSOM tree;
Determine the display position of the node’s layout of the render tree;
Traverse the rendering tree and draw nodes with UI back-end layer.
The rendering process begins when the user’s requested HTML text reaches the rendering engine via the browser’s network layer. After the model has been lightweight, its volume is reduced, and its rendering speed is accelerated.
The coordinate system in WebGL is different from the world coordinate system of other software [21]. Therefore, the model needs to be transformed when it is loaded in the browsers. The coordinate transformation of the model is achieved by multiplying the transformation matrix and the point coordinate vectors in the 3D model. The position of the points in the 3D space needs to be represented by homogeneous coordinates. That is, add a quantity w after x, y, z. Assuming that the point matrix is P, the transformation matrix is M, the transformed point matrix is Q. The value of w is 1, and the formula of describing the point by homogeneous coordinates is as follows [22]:
The basic transformation matrix M is as follows:
The calculation formula of point basic transformation is as follows:
Different matrix values lead to different transformation methods. The matrix M for translation, scaling and rotation are as follow:
In practice, the above transformation formula is used to perform translation, rotation, and zoom operations on the model to realize the model processing based on the actual demand of the model deviation.
An interactive design is added to the Web-BIM system to improve user experience. Interaction design mainly includes three functions: roaming, components information display, and monitoring nodes information display. The roaming mode is designed and implemented by the WebGL control Orbitcontrols.js, which mainly includes the first-person roaming mode and the trackball roaming mode. The parameter information of the component is stored in the database and bound to the components through the nodes ID. When a user clicks on a component in the bridge 3D model, its information will be displayed on the Web front-end. The information from detection nodes is stored in the data table, and Ajax technology is used to query and update data in real-time.
Background service
The background service is responsible for Web service support. The system background applied Java as the development language, integrated the SpringBoot and MyBatis framework, encapsulated the query service as the microservice, applied the Model-View-Controller(MVC) design pattern, put the complex processing logic in the controller, and view refers to the front-end interface. The framework decoupled the front and back programs, allowing for greater code scalability. Background service module in the system performed the following functions: Real-time data acquisition: collecting real-time environmental data from IoT nodes and storing it in the Mysql database. Real-time data display: data display can be divided into bridge model interactive display and real-time dynamic curve. Data query: historical data can be queried. IOT nodes management: updating sensor nodes data synchronously after updating terminal nodes. Role control: login system for different roles and display of different functions, roles are divided into administrator and non-manager.
The system uses MyBatis as a data persistence layer, integrated Java Database Connectivity(JDBC) code development, and manually setting parameters and obtained result sets, optimizing development mode and reducing the difficulty of development and later maintenance. The interface and Java POJOs have mapped database records, and the database configuration is integrated into Extensible Markup Language(XML) files. For security and data integrity, the background service in the system interacts with the terminal node via the TCP/IP communication protocol.
Experimental study
Model compression experiment
Draco algorithm is different from other model topology transformation algorithms. It does not change the topological structure of the model but reduces its volume by encoding the triangular patches. The model volume has been significantly reduced by applying the Draco algorithm to compress the obj format 3D model. To verify the compression effect, this paper chose five groups of different volumes of obj 3D model files and run the compiled code. The volumes of the five groups of obj 3D models are 64kb, 104kb, 2247kb, 12658kb, and 622108kb. The running environment is windows 8.1 operating system, CPU i5-5200u, NVIDIA GeForce 840M, and 4G Memory. The compression effect is evaluated based on the compression rate value. The method for calculating compression rate is as follows:
Experimental results of model compression
From the analysis in Table 1, it can be concluded that: For models 2, 3, 4, and 5, the compression rate increases with the increase of the model’s volume; Model 1 has small volume, low complexity, and many large-scale triangular meshes, but it has a fixed file structure that can not be compressed, so the compression rate is not ideal; With the increase of model volume, the time of model compression increases; The compression effect is remarkable for the 3D model with high complexity and large-scale triangular meshes.
There are three commonly used methods for 3D model lightweight: Geometric vertex deletion, geometric edge folding [23]. However, these methods will change the topology of the model and affect the model’s integrity. In this paper, the obj model with a volume of 26009kb is lightweight through the “vertex deletion algorithm,” “edge folding algorithm,” “vertex reuse+edge folding algorithm,” and “Draco algorithm” Table 2 shows the experimental results:
Experimental results of model lightweight
Experimental results of model lightweight
According to Table 2, it can draw a clear conclusion that: Among the four algorithms, the compression effect of the algorithm used in this paper is the most obvious. Compared with other algorithms, the compression rates of the Draco algorithm are reduced by 57.08%, 83.46%, and 38.18% respectively.
Theoretically, as the volume of the model shrinks, the rendering time is also decreased. To verify whether the rendering time of the 3D model has been reduced, three groups of Obj 3D model files with different volumes in section 4.1 are selected and combined with Three.js to run the rendering experiment in the browser before and after the lightweight model treatment. The experiment runs in the same environment as section 4.1, with Chrome browser used for model rendering and JavaScript as the development language. The rendering time of the 3D model before and after compression is calculated during the rendering process. The rendering acceleration effect is validated by the speedup ratio. The formula for calculating the speedup ratio is as follows:
Experimental results of model rendering
After the 3D model is compressed, the amount of data and computation needed for rendering have reduced, and the rendering speed has increased. It can be seen from Table 2 the rendering time of the three model groups after compression has been reduced to less than 15% of that before compression, and the rendering speed of the after compression model has been greatly improved.
To achieve effective management and maintenance for bridges, this paper has designed and developed a bridge information visualization management system based on BIM. The core of this system is the visualization module, which mainly includes model visualization and data visualization. To optimize the system performance, the model visualization function was designed with a lightweight algorithm, which considerably reduced the model volume and improved the model rendering speed. Figure 8 shows the rendering effect of the 3D model.
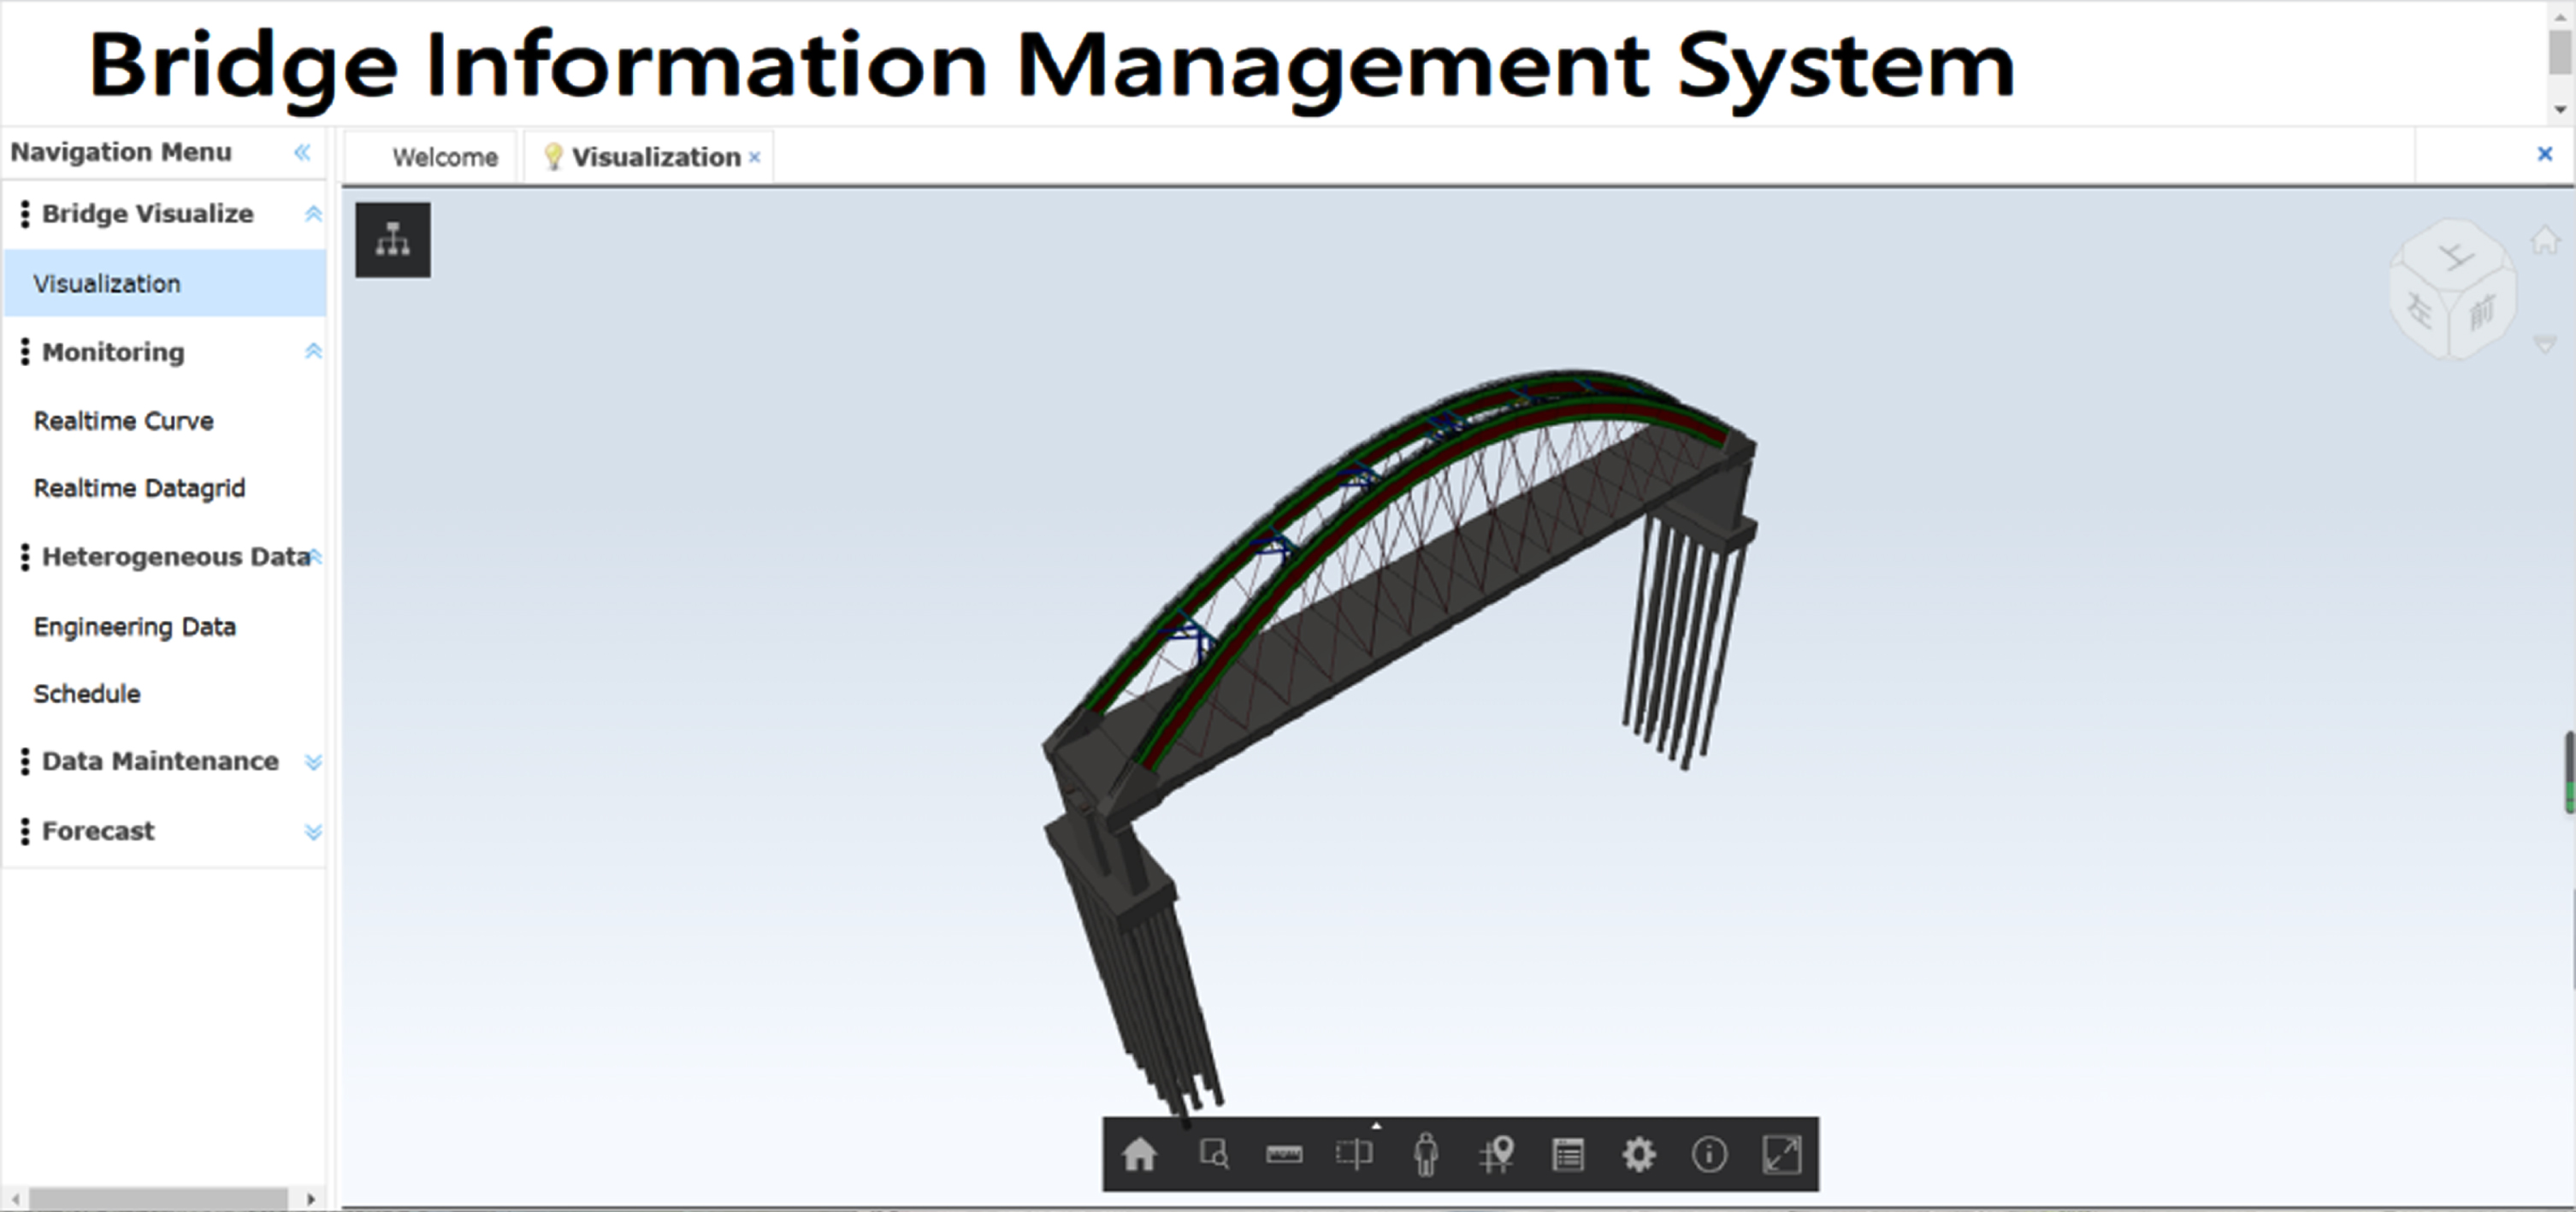
3D model visualization.
When the operation and maintenance personnel make maintenance decisions on the bridge, they need to consult the historical operation and maintenance parameters of the bridge. By analyzing the historical operation and maintenance parameters of the bridge, they can understand the damage degree of the bridge and provide a reasonable maintenance scheme. Therefore, the bridge’s historical operation and maintenance parameter curve can provide data support for decision-makers. The system uses Highcharts and Ajax technology to build a web page and displays the data information collected by the monitoring nodes as a curve. In addition, the bridge information database is associated with the model to realize the visualization display of real-time monitoring information, as shown in Fig. 9.
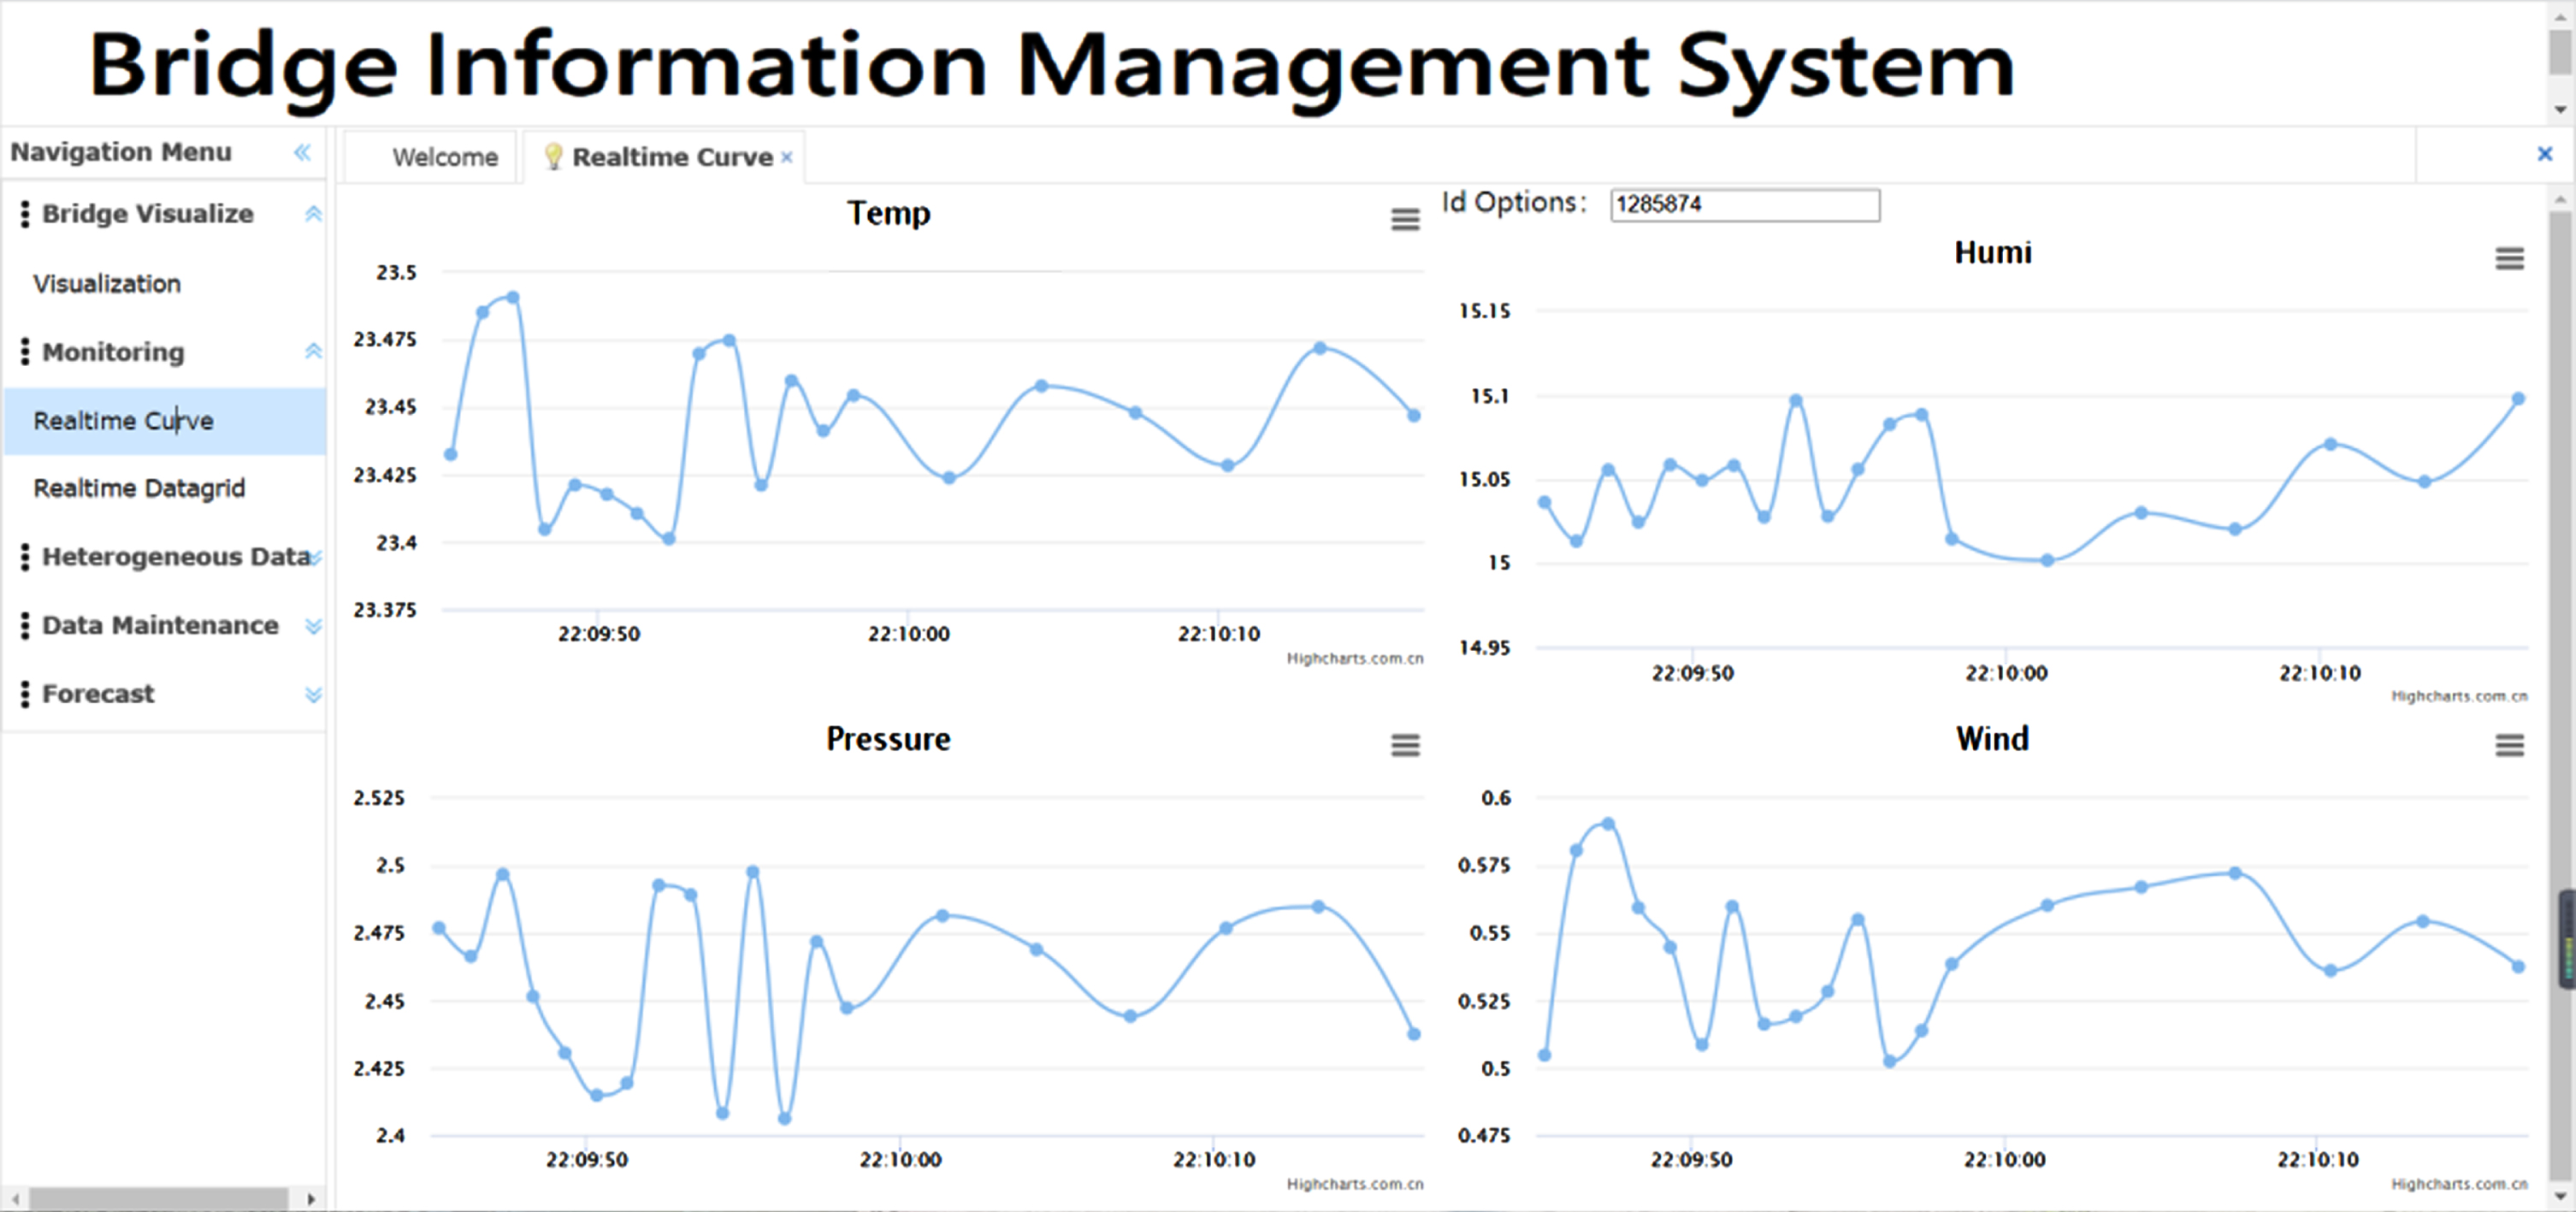
Visualization of real-time monitoring information.
To facilitate the user to check the model or data directly, the system has added an interactive function design. When the user clicks on the model component, the system retrieves the static data information stored in the database based on the model component’s ID. The component attribute information is called and displayed in the front-end page’s information bar using Ajax technology, as shown in Fig. 10.
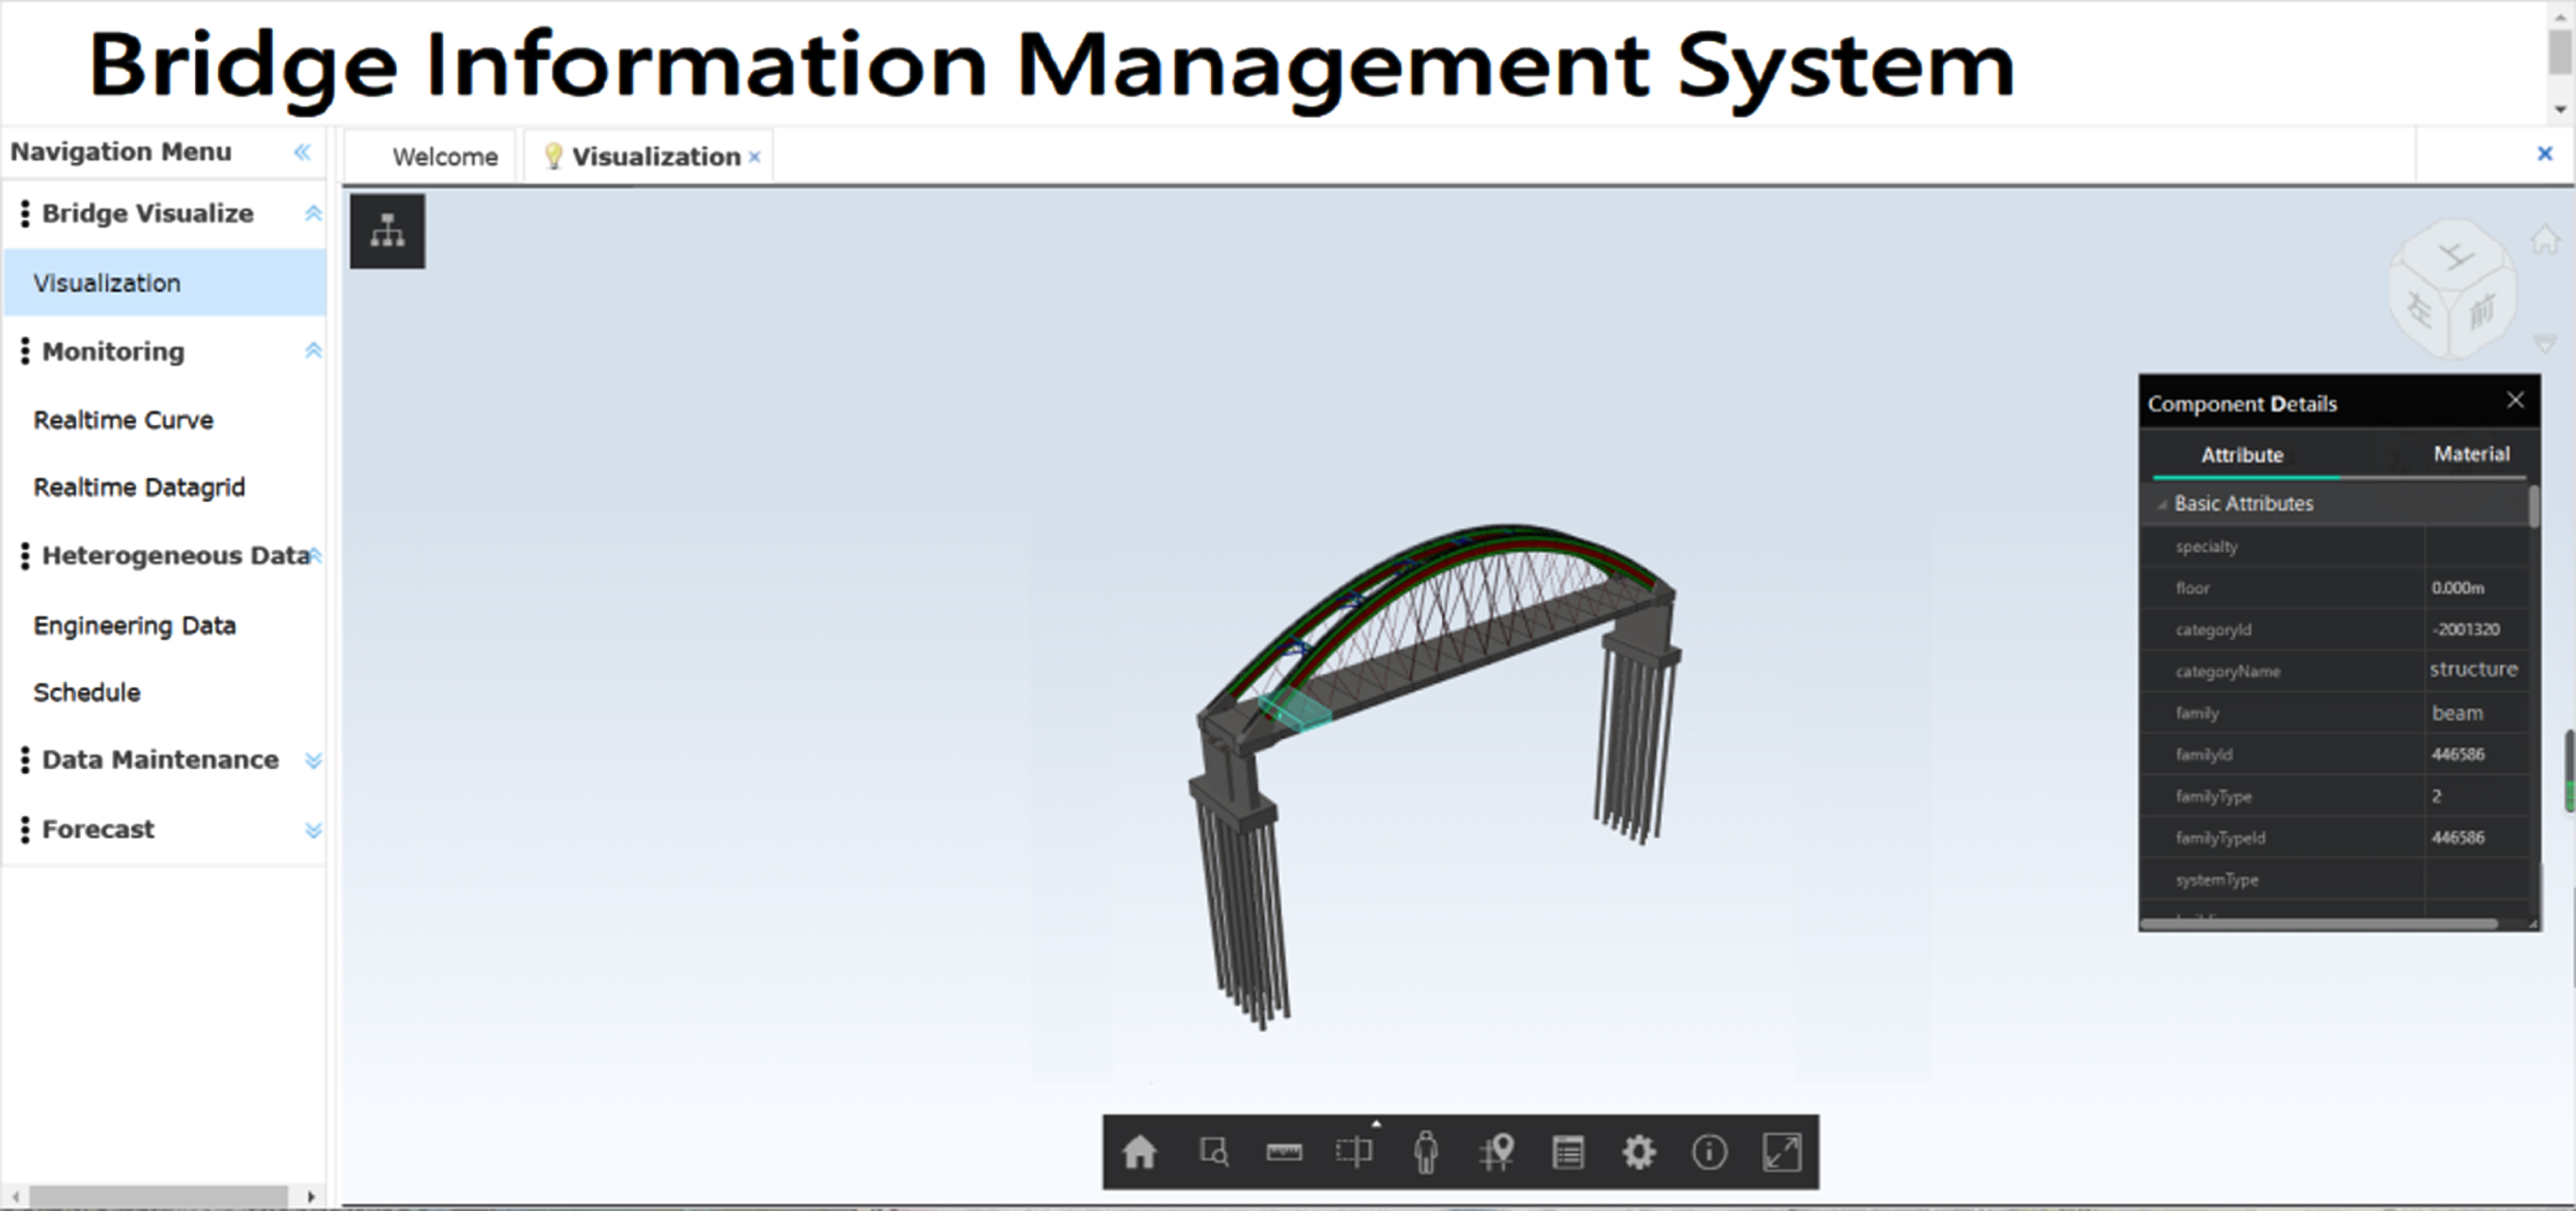
Component information query.
The roaming mode navigation bar is set in the upper left corner of the page. Roaming mode provides users with two roaming paths: first-person and trackball. The user activates different review modes by selecting the option key in the navigation bar. Figure 11 shows the roaming mode navigation bar.
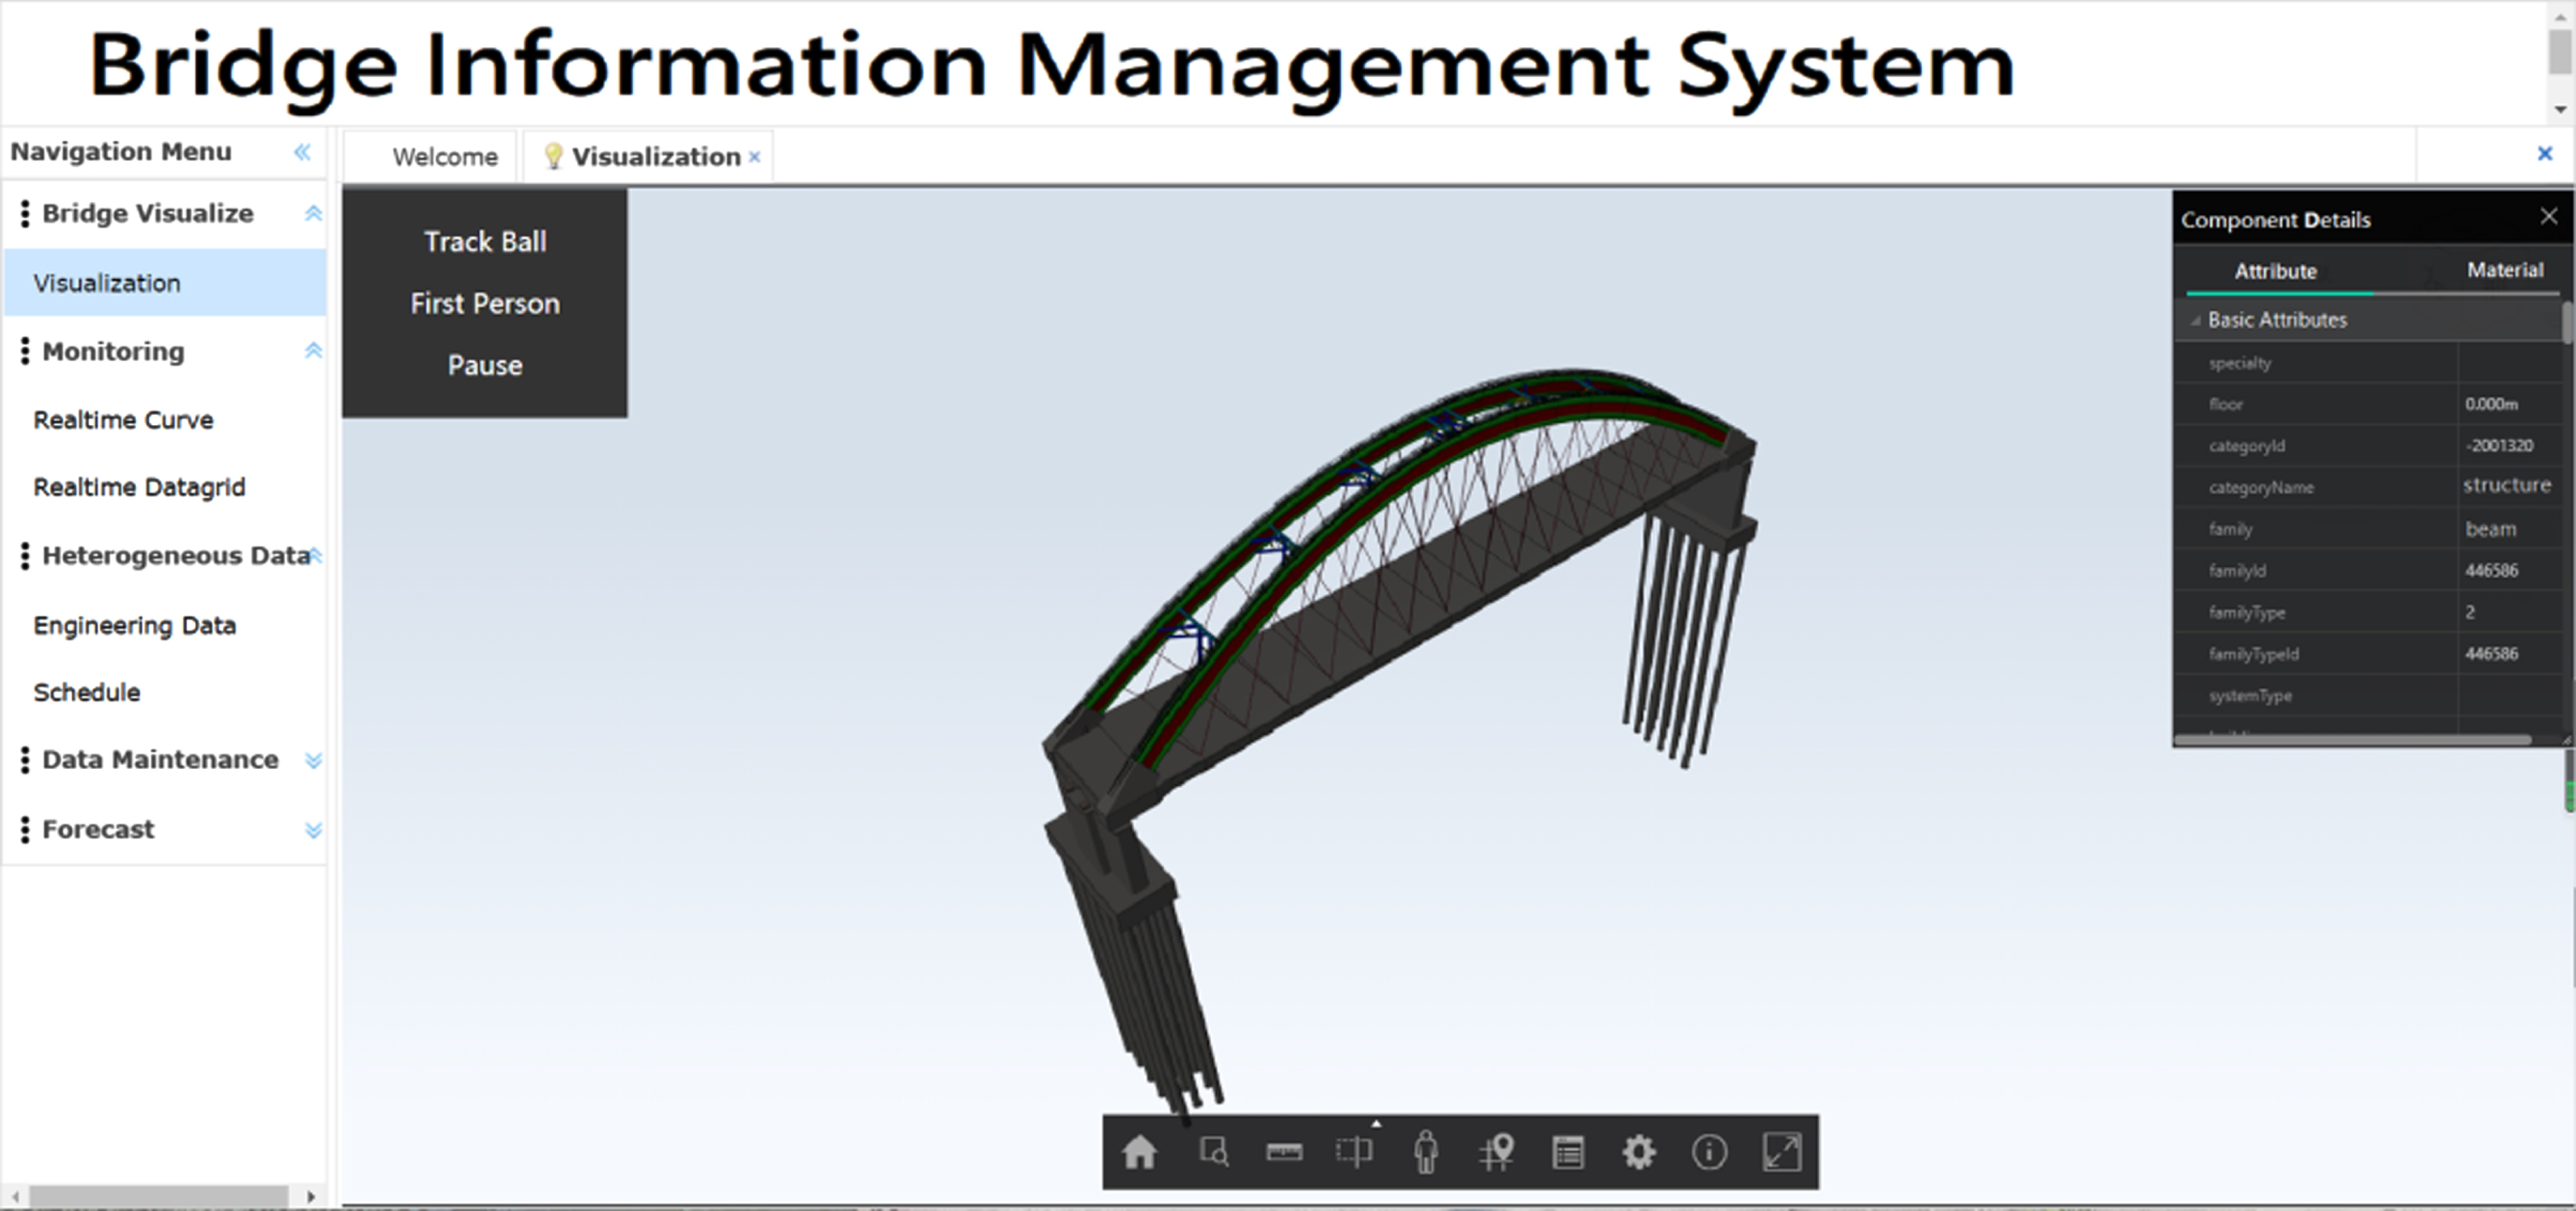
Roaming mode.
The number of bridges has increased dramatically over the last several decades in China. However, as the number of bridges grows, so does the pressure on operation and maintenance. An efficient bridge information visualization management system has become the key to bridge maintenance.
In order to overcome the huge pressure on the operation and maintenance stage caused by the large volume of the three-dimensional model of a long-span bridge, by analyzing the system integrity, we determine that the bridge information visualization management system must meet the three requirements: visualization, interactivity, and real-time. We have proposed a Web-BIM-oriented system development method and designed the overall framework of the system. In order to solve the problem that the large volume of the bridge model affects the rendering performance of the system, we developed based on IFC files and designed IFC to obj format plug-in to reduce the volume of the bridge model. To further reduce the pressure caused by the excessive volume of the model, we introduce the Draco algorithm to compress the obj model, further reduce the volume of the model and improve the rendering performance of the system. Finally, we designed a model compression experiment and a rendering speed experiment. The results show that compared with other model lightweight methods, the method in this paper has a 57.08%, 83.46%, and 38.18% increase in lightweight effect, and at the same time, the rendering speed has also improved.
This paper developed a BIMS that was used to realize online visualized management of bridge information. The system includes interactive functions that promote multi-user interaction and collaboration while reducing the pressure caused by bridge operation and maintenance. Undoubtedly, this system provided a reliable management platform for the bridge during the operation and maintenance phases. We can anticipate that this system will be extended and applied in different fields by more designers in the future, such as 4D simulation, security analysis, threat assessment, early warning, and other functions.
Footnotes
Acknowledgments
This work was supported by the Science and Technology Development Program of Shaanxi Provincial Department of Construction under grant no. 2018-K05, the Xi’an University Talent Service Enterprise Project under grand no.2020 KJRC0054, the Open Project of Anhui Province Key Laboratory of Intelligent Building and Building Energy Saving, Anhui Jianzhu University under grant no.IBES2020KF11 and the Soft Science Research Program of Shaanxi Province under grant no. 2021KRM029.