
Abstract
Distributed Generating (DG) units, Energy Storage Systems (ESS), Distributed Reactive Sources (DRS), and resilient loads make up the microgrid (MG), which can operate in both connected and isolated modes. Because the amount of power generated by Renewable Energy Sources (RES) such as Wind Energy Systems (WES) and Photovoltaic Energy Systems (PVES) is unpredictable, it becomes difficult for MGs planners to make judgments. In this article, the uncertainties caused by RES are resolved through the successful application of a hybrid optimization approach and the integration of hybrid DGs. The Teaching Learning Algorithm (TLA) is used in this study to determine the best site for DGs and reconfiguration, and heuristic fuzzy has been merged with TLA to handle multi-objectives such as total generation and emission cost minimization, and bus voltage deviation. In addition, the impact of replacing RES with hybrid DGs on RES performance is investigated. The ideal structures are determined by solving four different scenarios with the suggested approach, allowing DSO to make decisions with greater flexibility. The proposed technique is validated using a benchmark IEEE 33 bus system that has been converted into a microgrid. WES, PVES, and hybrid DGs are validated using a 24-hour daily load pattern with 24-hour load dispatching characteristic behaviors.
Keywords
Nomenclature:
Description Bus Voltage Deviation Total number of load buses present in the system Voltage at the feeder Real power Transmission losses Reactive power transmission losses Real power Demand Reactive power Demand Total Emission Cost Total Generation Cost Diesel Engine Stored Energy Minimum Stored Energy Maximum Stored Energy Charge Rate Discharge Rate Charge efficiency Discharge efficiency Ramp up Ramp down Time period
Introduction
The power system is undergoing significant changes in all areas of design, configuration, operation, and control in the context of global energy infrastructures. The demand for installing Distributed Energy Resources (DER) and Energy Storage Systems (ESS) is fast expanding as a result of increased awareness of environmental issues and deregulation of the power industry, with more and more DG units being adopted and deployed near homes. DGs and ESSs placed near loads provide significant benefits, including increased system reliability, improved energy quality, reduced power loss, and lower power generation and emission costs. Nonetheless, the diversification of this paradigm shift necessitates the coordination and collaboration of distribution and control systems, which poses certain challenges in energy system design, operation, and control. Power distribution firms are faced with the difficult task of developing a reliable and cost-effective distribution infrastructure. Various energy management and control methodologies, as well as heuristic optimization methods connected to microgrids, have recently evolved, each providing quality and trustworthy support to ensure microgrids operate optimally. A distribution system [1] suggested at a complete assessment of the intelligent control methodologies that has been applied as well as future development. For successful management of MG with RESs based DGs optimization algorithms such as harmony search algorithm [2], stochastic optimization [3], resilient optimization algorithm for mixed integer programming [4], and cuckoo search algorithm [5] have been established. The hierarchical structures of microgrid control methods were described in [6], and it’s managed to the microgrid optimal operation and control. In MG, one purpose of energy distribution is to reduce costs and losses. A hybrid grey wolf and particle swarm optimization approach for minimizing power losses in the distribution system by selecting the best site for DGs [7]. An evaluation of the optimization approach is used for the combined reconfiguration and optimal DG placement successfully conducted [8].
However, the particle swarm optimization (PSO) with a fitness function based on the microgrid, it has been benefit to load response and WES [9]. In addition to that for executing optimal generation scheduling (OGS) and distribution feeder reconfiguration (DFR) using Mixed-Integer Second-Order Cone Programming (MISOCP) recommended on a short-term forecast basis it’s evaluated the lowering total microgrid operating costs under various DG and utility system [10]. To address the distribution system optimization problem under dynamic load conditions, an improved hybrid fuzzy-genetic approach was developed in [11]. Using the Interval Optimization approach, [12] presented a Multi-objective Optimal Dispatch Model of Microgrid (MODMG) under power system uncertainty. In [13], a hybrid optimization technique based on fuzzy theory was developed to increase the speed of convergence and better handle operational constraints along with the objective function in order to achieve the goal of lowering the total fuel cost and real power loss of MG. To minimize economic and emission costs, an effective scenario-based stochastic programming approach was presented in [14], which decomposes the problem into deterministic problems. Table 1 shows a detailed analysis of the remaining literature that proposes solutions to the microgrid optimization challenge.
Comparison of literature
Comparison of literature
The majority of the studies in Table 1 solved the optimization problem by using optimal DG placement as the objective function. The need of controlling CO2, NO2, and SO2 emissions has been recognized by most developing countries, resulting in the use of renewable energy sources for power generation. Based on different variables such as efficiency, lifetime, payback period, installation and maintenance costs, power generation through WES and PVES is the most recommended among all other RES. However, the power generation of these renewable energy sources is mostly dependent on environmental conditions, resulting in seasonal and time-varying power generation. Furthermore, many studies ignore the ambiguities associated with WES and PVES. As a result, the suggested position for the DGs for optimal functioning displays inadequate power delivery performance for the majority of the hours of the day. The cost co-efficient of hybrid DG is discussed in the papers [31]. The appropriate replacement of standalone RES-based DGs with hybrid DGs can address this key issue [32]. Based on the modeling of the problem, the technique applied for DG placement, and the assumptions made to achieve the answer, the mathematical complexity of the solution process is classified as small, moderate, or big in the literature review. The impact of WES and PVES on the microgrid is investigated using a hybrid Fuzzy and TLA algorithm to solve the optimization issue in the microgrid while taking into account their unpredictability. The system’s distinctive data can be found from [33].
For the best placement of renewable energy-based DGs in the microgrid, this paper presents a hybrid Fuzzy-TLA algorithm. The following are some of the paper’s contributions:
Optimal solution based on overall generating cost, emission cost, and system bus voltage variance. For simultaneous reconfiguration and DG placement, a single algorithm is used. Performance analysis of the two most popular RES and their many combinations. Performance improvement is realized by replacing RES with hybrid DGs.
The best daily dispatch investigation with genuine RES and load uncertainty features. The following are the six sections that make up this document. The considered scenarios of the work are described in section II. Section III introduces the considered objectives as well as the operational constraints. The proposed algorithm’s step-by-step method is detailed in Section IV. Section V describes the test system and examines the various case study outcomes. Finally, section VI summarizes the findings of the current study and introduces potential future research fields.
Considered scenarios
Optimal dispatch under wes integration
This scenario is realized by assuming that the microgrid is only augmented by the WES. The WES’s generating cost is calculated based on its installed capacity, life expectancy, and installation, operation, and maintenance costs. For WES [34], the generation cost functions are as follows:
Where
Only PVES-based DGs are replenished together with the grid in this situation. Although the operational costs of PVES plants are low when compared to other renewable energy plants, the installed capacity, life time, and installation, operation, and maintenance costs of each plant are all taken into account when determining the per KW power output cost. The cost of electricity generation per unit fluctuates with plant capacity, which is stated as,
Where
The combined effect of PVES and WES integration into the microgrid is examined in this scenario. In this situation, it is considered that the indicated optimal placement for the DGs has sufficient environmental support and is located in excellent conditions for their respective power generation. Equations (1) and (2) are used to compute the overall cost of power generation based on the number of PVES and WES connected to the microgrid.
Optimal dispatch under hybrid PV-diesel and WE-diesel integration
This situation is being considered in order to better understand the advantages of hybrid DGs. It is well known that wind and photovoltaic electricity generation differs depending on environmental factors. Even in the proposed optimal sites, renewable energy-based DGs perform poorly. By replacing stand-alone PVES and WES systems with hybrid systems, the efficiency of such circumstances can be increased. The hybrid DGs are designed to provide a steady power output despite environmental variables. The benefits of both controllable and uncontrollable DGs are combined in the hybrid DG. The Diesel Engine is assumed to be hybrid in this study, with PVES and WES operating separately. The cost function of the Diesel engine [34] is shown in equation (3),
Where aDE, bDE and cDE are the cost coefficients of DE. As this work addresses the total emission cost reduction of the microgrid along with generation cost reduction, the emission cost estimation of the Diesel Engine (DE) and grid are taken care. The emission cost of the plants is expressed in terms of CO2, NOx and SO2. The generalized equation for estimating the emission cost of the DE per kW power generation are expressed as,
Similarly, the emission by the grid for per kW power generation is determined using the Equation (5).
The following subsection discusses the three objective functions and along with the operational constraints [34] considered in this paper.
Minimization of total generation cost
The optimization has been approached by simultaneously implementing the reconfiguration and optimal DG placement on the microgrid. Therefore, the minimization of Total Generation Cost (TGC) is viewed as a function of per KW generation cost by the Grid, WES, and PVES.
Minimize;
Where nWE and nPV represent the total number of WES and PVES integrated in the microgrid, respectively. Also, Grid cost refers the per kW power generation cost by the grid which is expressed in (7),
Where Kgrid represents the cost co-efficient constant which is assumed as 0.044 $/kW-hr[34].
In order to ensure the operational security and voltage quality to the customer ends, the minimization of bus Voltage Deviation (VD) is considered as an additional objective with the TGC reduction. The minimization of the bus voltage deviation with the set reference voltage for all the load buses of the system is expressed as [35],
Where Vfeeder is the voltage at the feeder bus, Vi is the ith bus voltage and the term ‘nb’ refers to the total number of load buses present in the system.
The Total Emission Cost (TEC) of the system is determined through summing the emission produced by the diesel engine expressed in (4) and emission by the grid. This cost function is considered during the integration of hybrid DGs to the microgrid.
The considered operational constraints are as follows:
Equations (10) and (11), respectively, indicate the microgrid’s actual and reactive power balances. (12) and (13) show the generating capacity of distributed generating units (13). Equations are used to express the capacity limits of electrical power equipment (14–17). In (18) and (19), the DGs’ minimum and maximum bus voltage limits, as well as their power factor limits, are defined. The DG units’ actual and reactive power handling capacity are expressed in (20) and (21, respectively. A set of constraints (22) and (23), respectively, are used to solve the DG units’ actual and reactive power handling capacities. The apparent power handling limits obtained from the real and reactive power handling limits is shown in (24). The expression for the ramp up and down rate constraint is shown in (25), where
Equations (6), (8), and (9) express three objective functions in this optimization problem (9). The recommended method shall deliver the most compromised solution among the assessed goal functions under certain system operating conditions. To merge the objective functions into a single objective function, a fuzzy decision set method is introduced. The membership functions are introduced in this regard for each objective function. The membership functions produced fuzzifier values for the specified configuration, which are utilized in the fuzzy decision set to make decisions. For each fitness function, fuzzy membership functions with maximum and minimum limitations are used. The developed fuzzy functions can be modified according to the contribution of the fitness functions according to the problem needs. The membership functions are defined as follows,
During the arrival of each new configuration, the values of TGC, TEC, and VD are calculated, which are defined as the ratio between the prior best solution and the current solution in the preceding equations. From the membership values found in each feasible solution, the decision fuzzy set (32) is used to discover the compromised solution.
For optimal searching, the Teaching Learning Algorithm (TLA) [36] is used, which is one of the nature-inspired, well-proven, population-based optimization algorithms. It searches for the best answer using a population of solutions, avoiding the need for algorithm-specific parameters for convergence. When compared to other population-based algorithms like GA, ABC, PSO, HS, DE, and others, this trait is regarded a major strength for the TLA. Importantly, this method ensures a worldwide optimal solution for problems of various scales and characteristics. It is based on the data collected throughout the teacher and learner phases of each iteration. In every iteration, the best learner becomes the teacher as teacher is the most experienced, knowledgeable and highly learned person in the community. In this problem, in every iteration, the teacher is the optimal location of DGs and tie-switches based on the objectives. The learners learns the course according to the quality of the teacher and the quality of the learners present in the class for each course. The learners get the course input from the teachers and the interaction between the co-learners of the class. In this problem, every learner has a set of DG locations and tie-switches. The suggested algorithm’s step-by-step approach is depicted in Fig. 1 as a flowchart. The following is the pseudocode and technique for the proposed calculation:
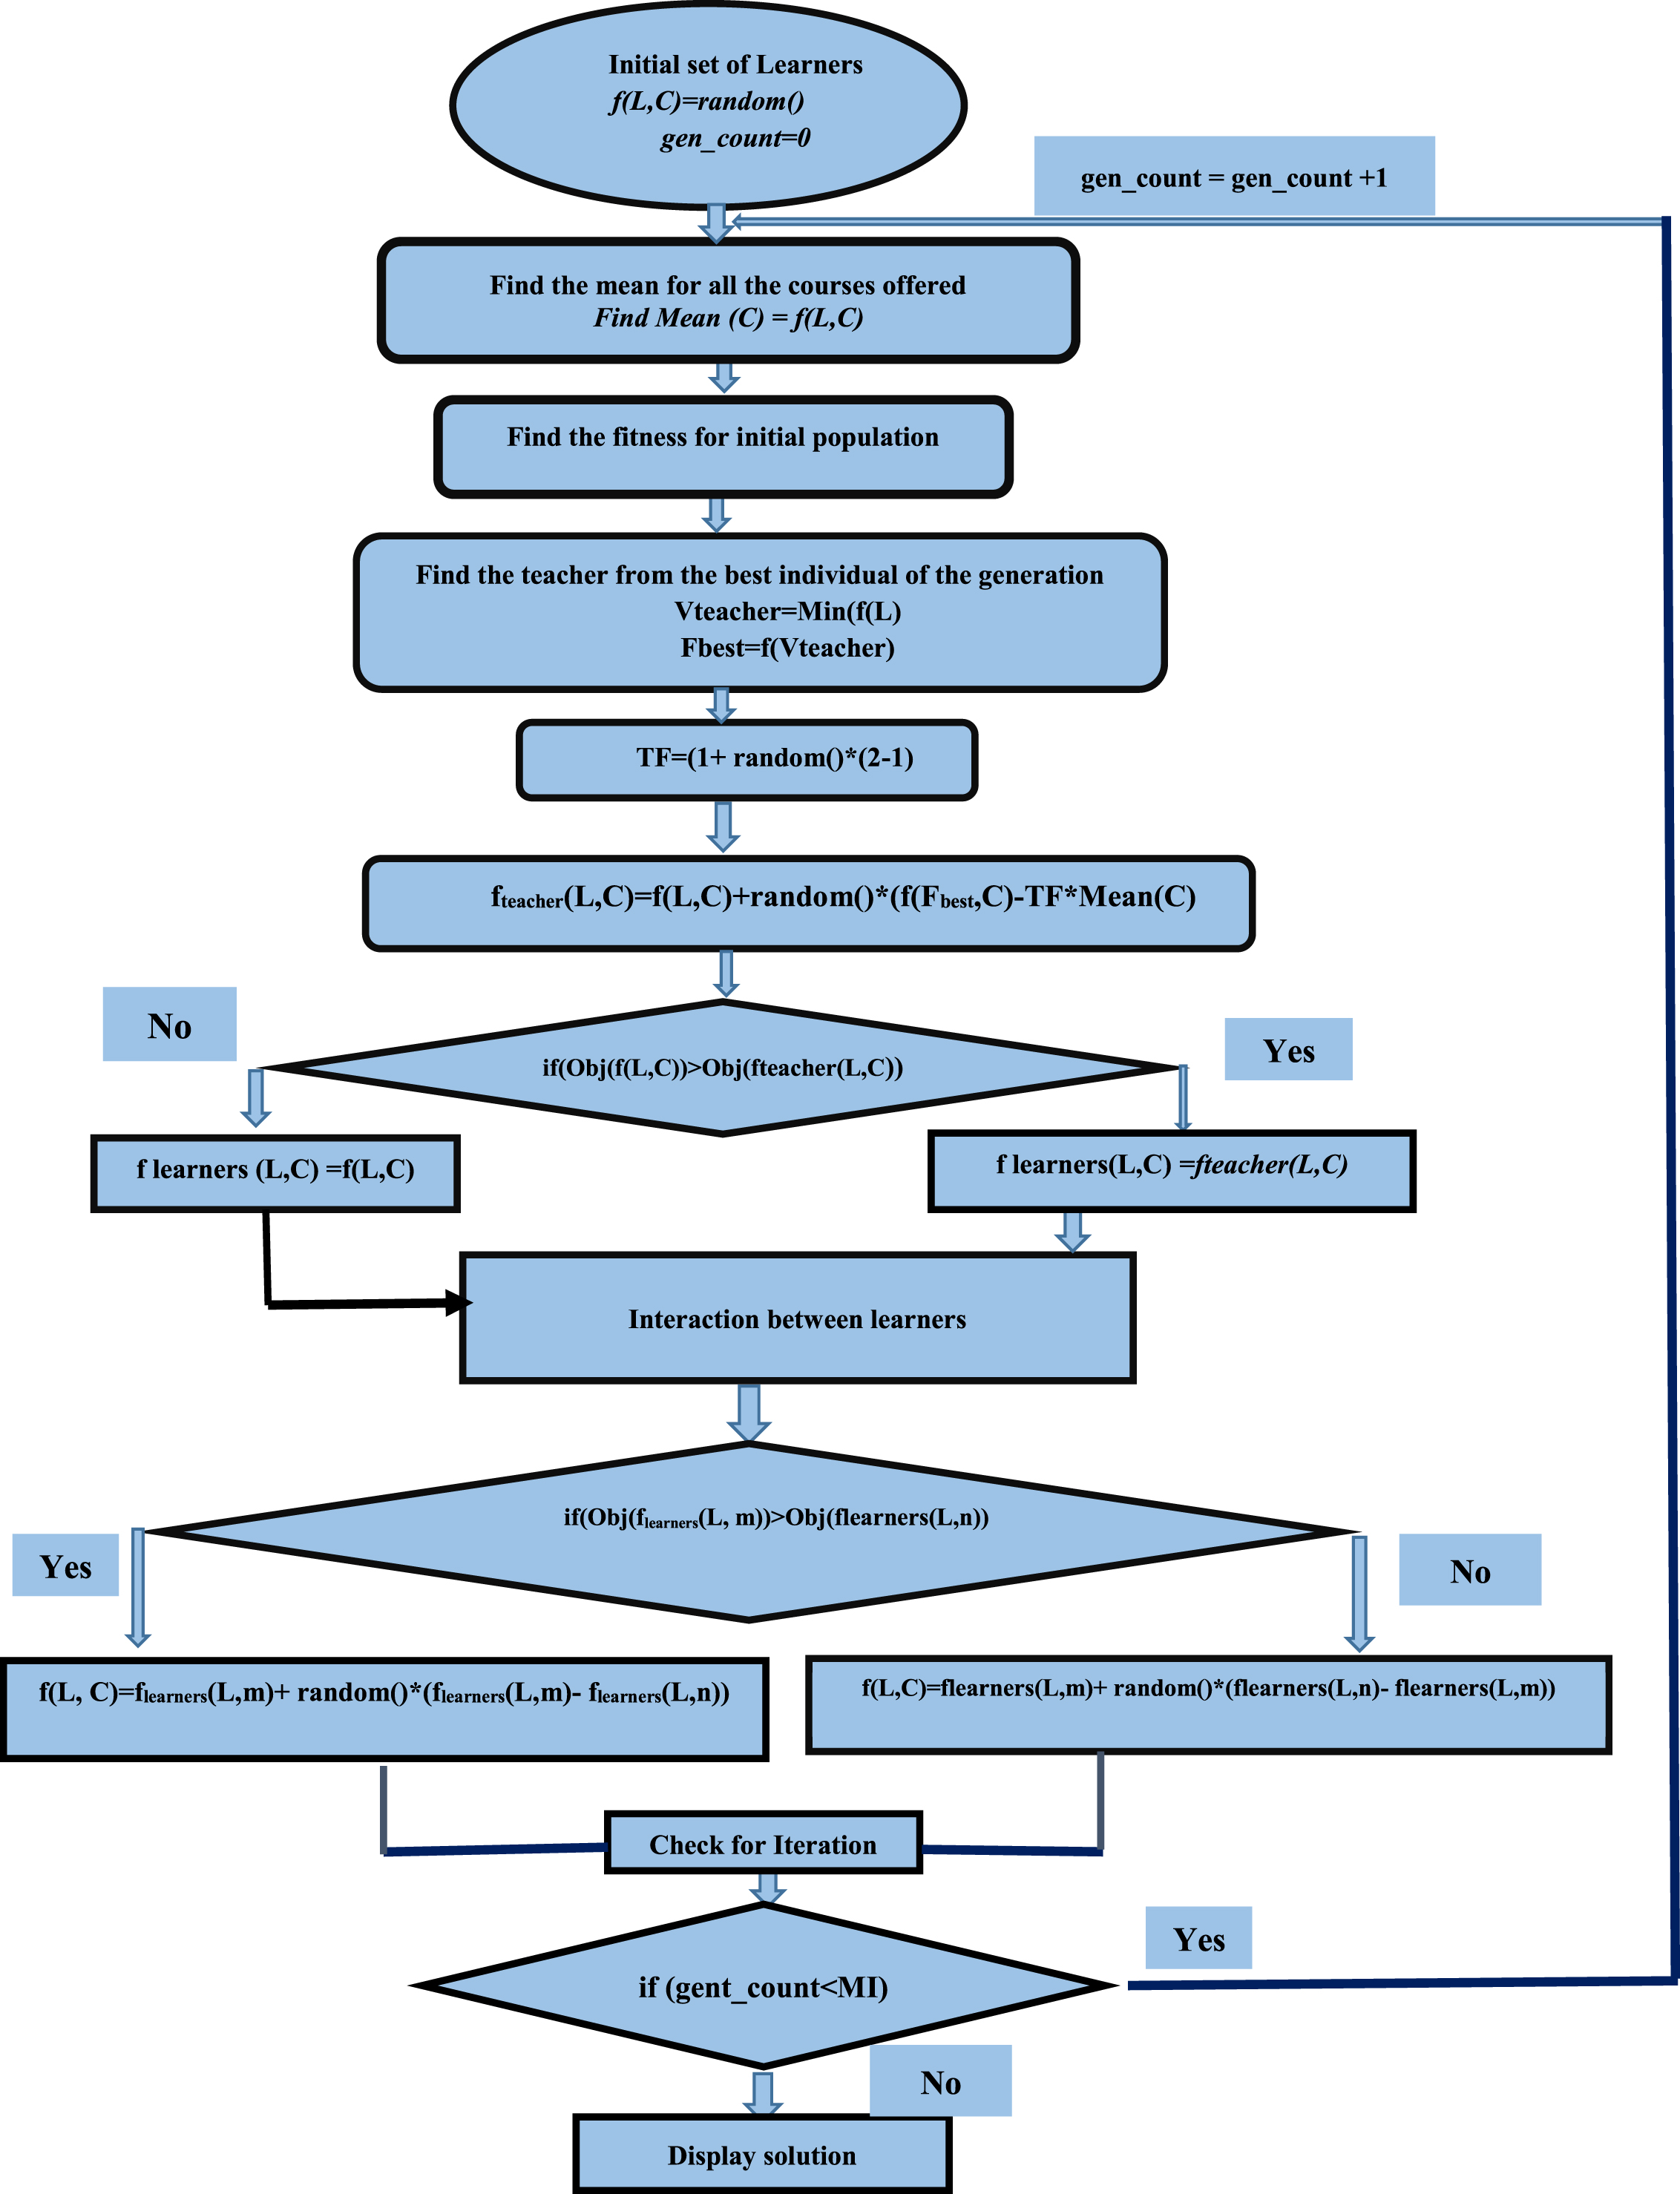
Flow chart of Teaching Learning Algorithm.
Set Max Iteration (MIT), Courses Offered (C = Number of DGs+Number of MGs), Total learners (L), gen_count = 0
Initial set of Learners
f(L,C)=random()
Find Mean (C)=f(L,C)
Find Obj(f(L))
Find the teacher from the best individual of the generation
Vteacher = Min(f(L))
Fbest = f(Vteacher)
TF=(1 + random()*(2-1))
fteacher(L,C)=f(L,C)+random()*(f(Fbest,C)-TF*Mean(C))
if (Obj(f(L,C))>Obj(fteacher(L,C)))
flearners(L,C)=fteacher(L,C)
else
flearners(L,C)=f(L,C)
if(Obj(flearners(L,m))>Obj(flearners(L,n)))
f(L,C)=flearners(L,m)+random()*(flearners(L,m)- flearners(L,n))
else
f(L,C)=flearners(L,m)+random()*(flearners(L,n)- flearners(L,m))
gen_count = gen_count+1
The problem’s control variables were used to identify which courses should be taken for the TLA. The fitness function for optimal searching is taken to be equation (32). The proposed algorithm is written in the JAVA programming language and runs on a 4.1 GHz Intel Core i5 processor.
Test system data
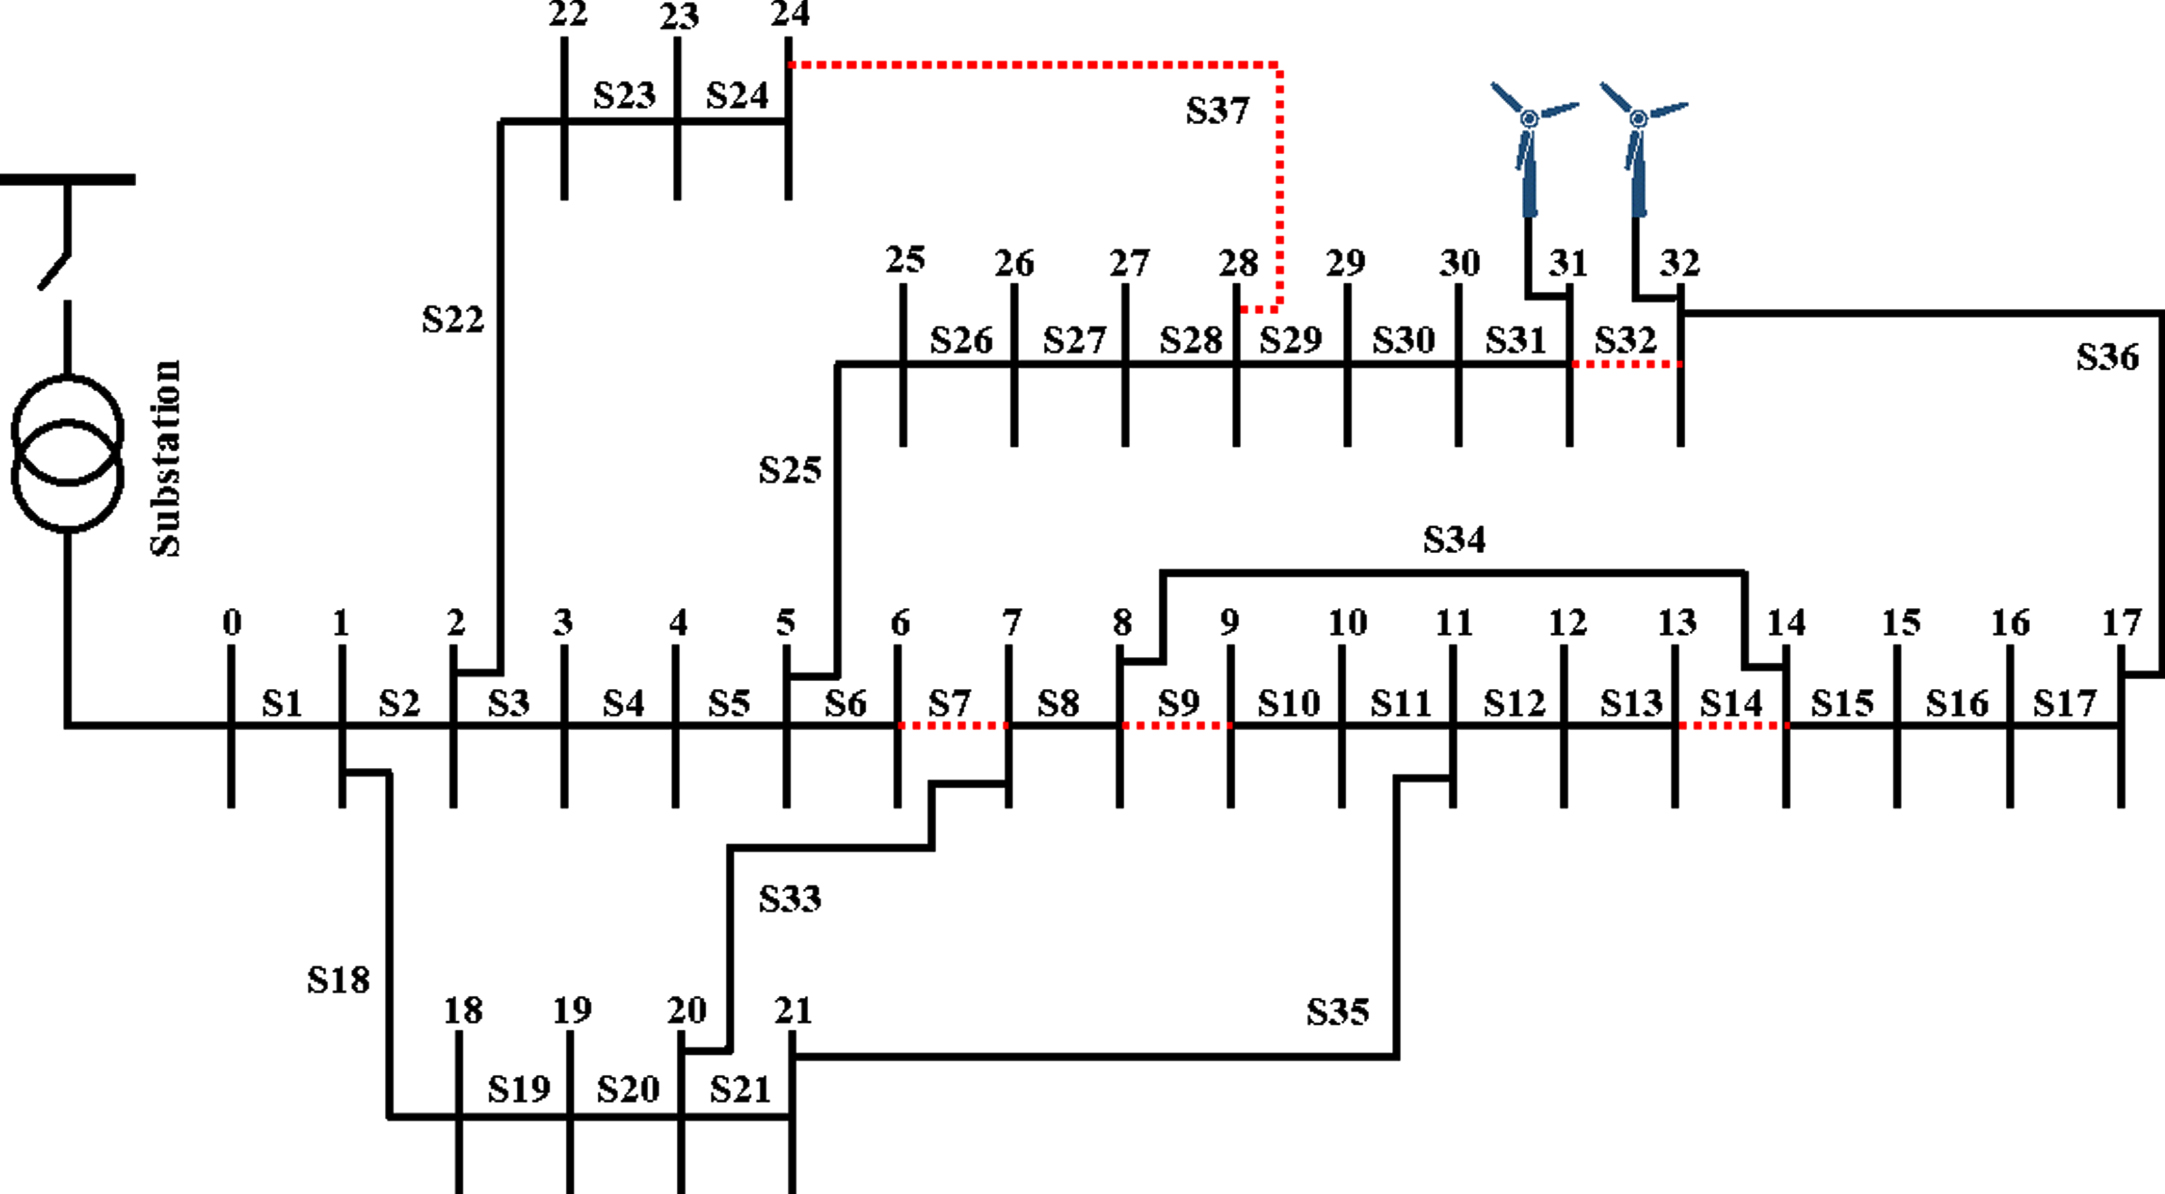
For the simulation investigation, a conventional IEEE 33-bus Radial Distribution System (RDS) is used. As indicated in Fig. 2, the system is served by 32 load buses with five tie-lines. The system’s electrical specifications are as follows: 12.66 base KV, 100 base MVA, 3.715 MW total real power demand, 2.3 MVAR total reactive power demand, and 202.66 kW real power transmission loss under normal operating conditions. Under any conditions, the system’s allowable minimum bus voltage is 0.9 per unit (p.u), with a maximum branch load of 400A.
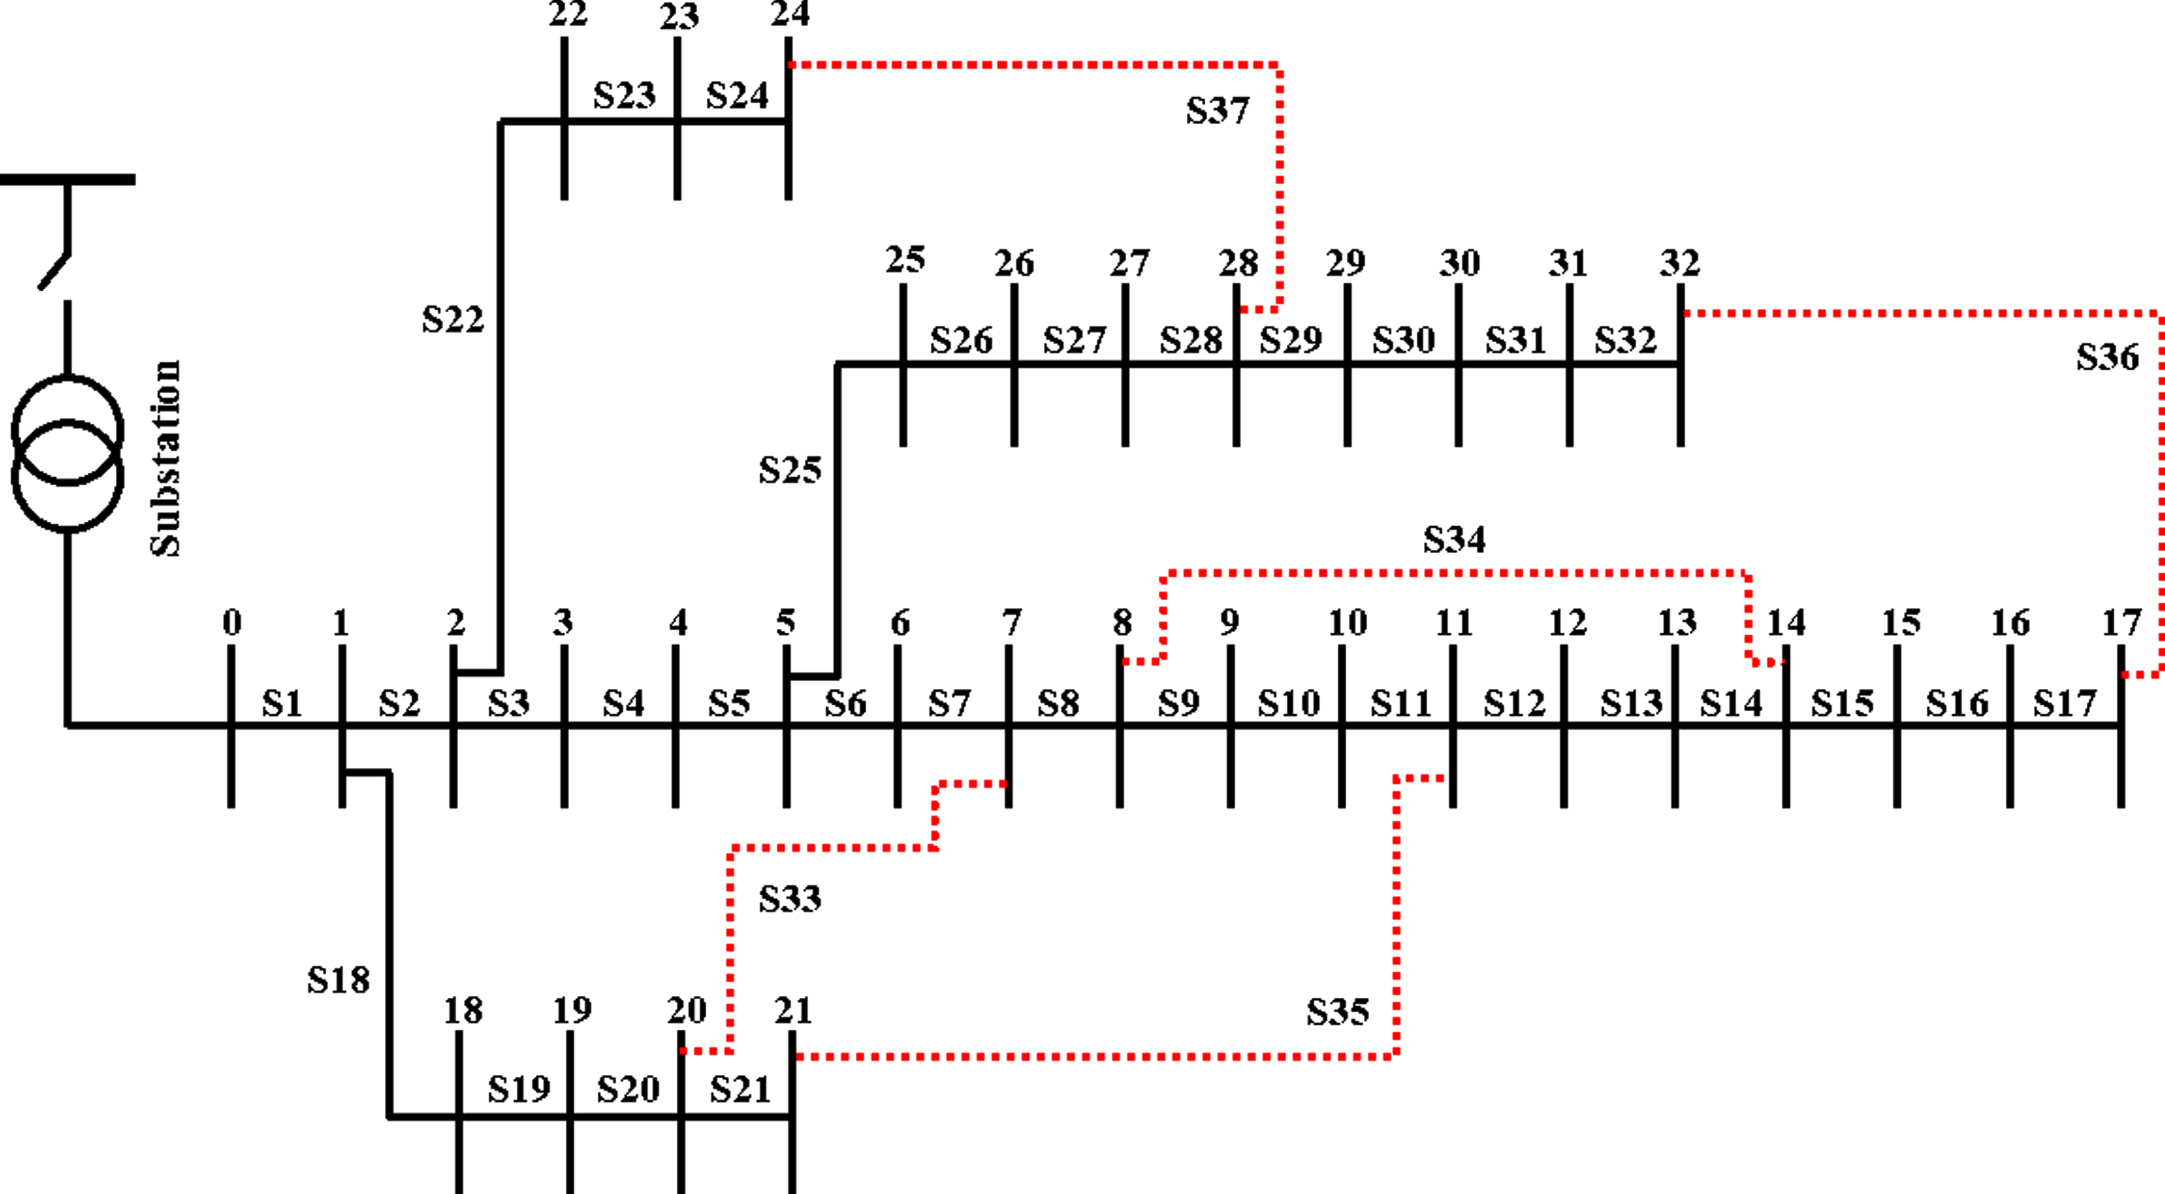
Single-line diagram of IEEE 33 bus RDS.
This research focuses on microgrid optimization for dynamically variable active and reactive power consumption from hour to hour. Figure 3 depicts the test system’s assumed active and reactive power demands for each hour of the day. Both feeder level reconfiguration and optimal placement of RES are part of the optimization plan. The microgrids of the system are built depending on the system’s available tie-lines. Individual loops and accompanying loads connected to each tie-line are taken into account for load sharing between microgrids via reconfiguration. The reconfiguration challenge entails determining the best combination of tie-switches. The reduced solution set for each microgrid is shown below,
{NOS:{S33}, NCS:{S4,S5,S6,S7,S19,S20}} {NOS:{S34}, NCS:{S12,S13,S14}} {NOS:{S35}, NCS:{S8,S9,S10,S11,S21}} {NOS:{S36}, NCS:{S15,S16,S17,S29,S30,S31,S32}} {NOS:{S37}, NCS:{S23,S24,S25,S26,S27,S28}}
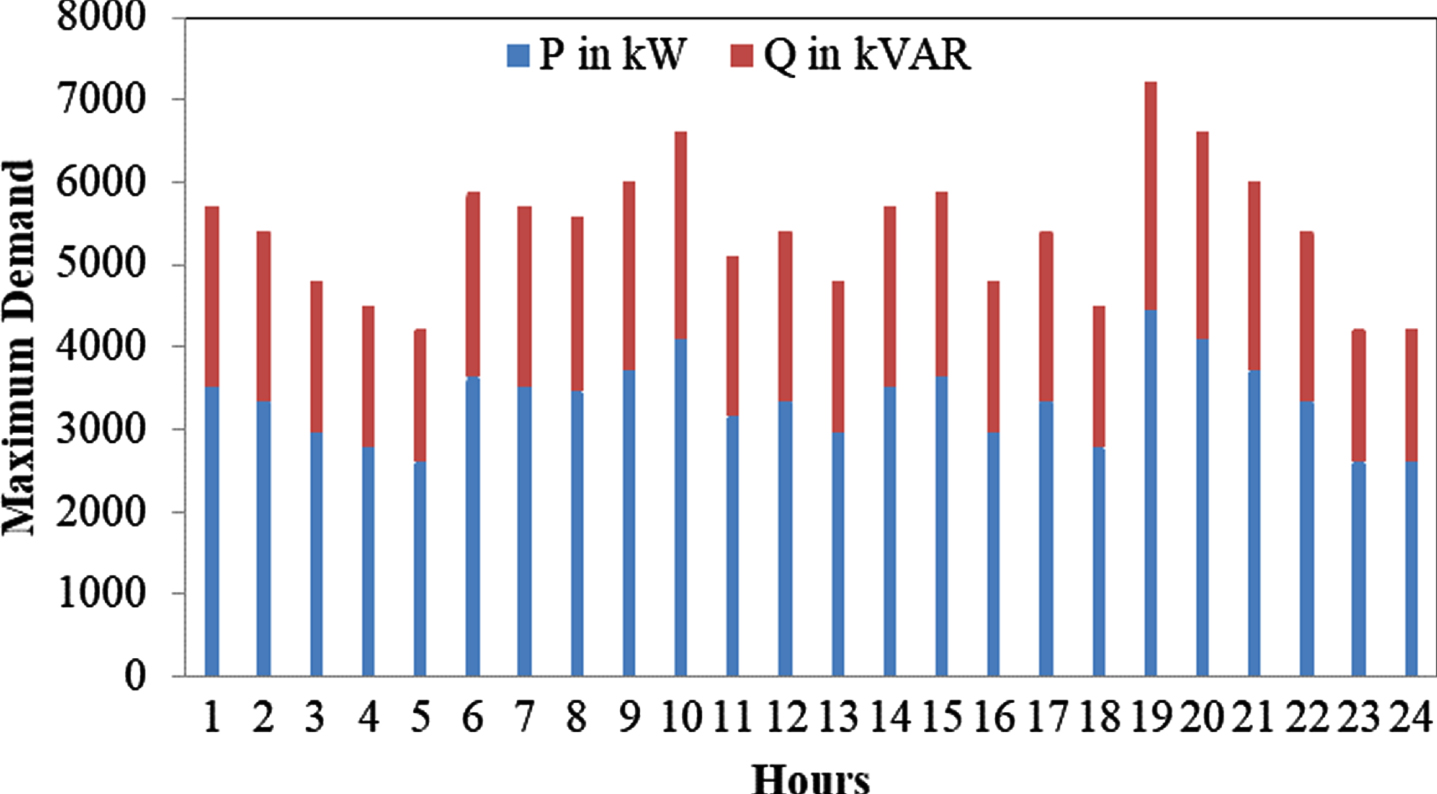
Power demands for the 24 hrs.
The planned effort also aims to determine the performance advantage of wind and photovoltaic energy sources when combined with an interconnected microgrid. It was done by examining four possible scenarios based on the utility customer’s dynamic loading behavior. The analysis is based on the usual load pattern on a day shown in Fig. 3 and the hourly variable efficiency of the typical WES on a day shown in Fig. 4. After successfully implementing the method under hourly varying generation and load patterns (as indicated in Table 2), the ideal solution is reached. In Fig. 4 show that hour-to-hour efficiency for the WES and PVES is illustrated. The information on energy systems is obtained from the literature [31, 32].
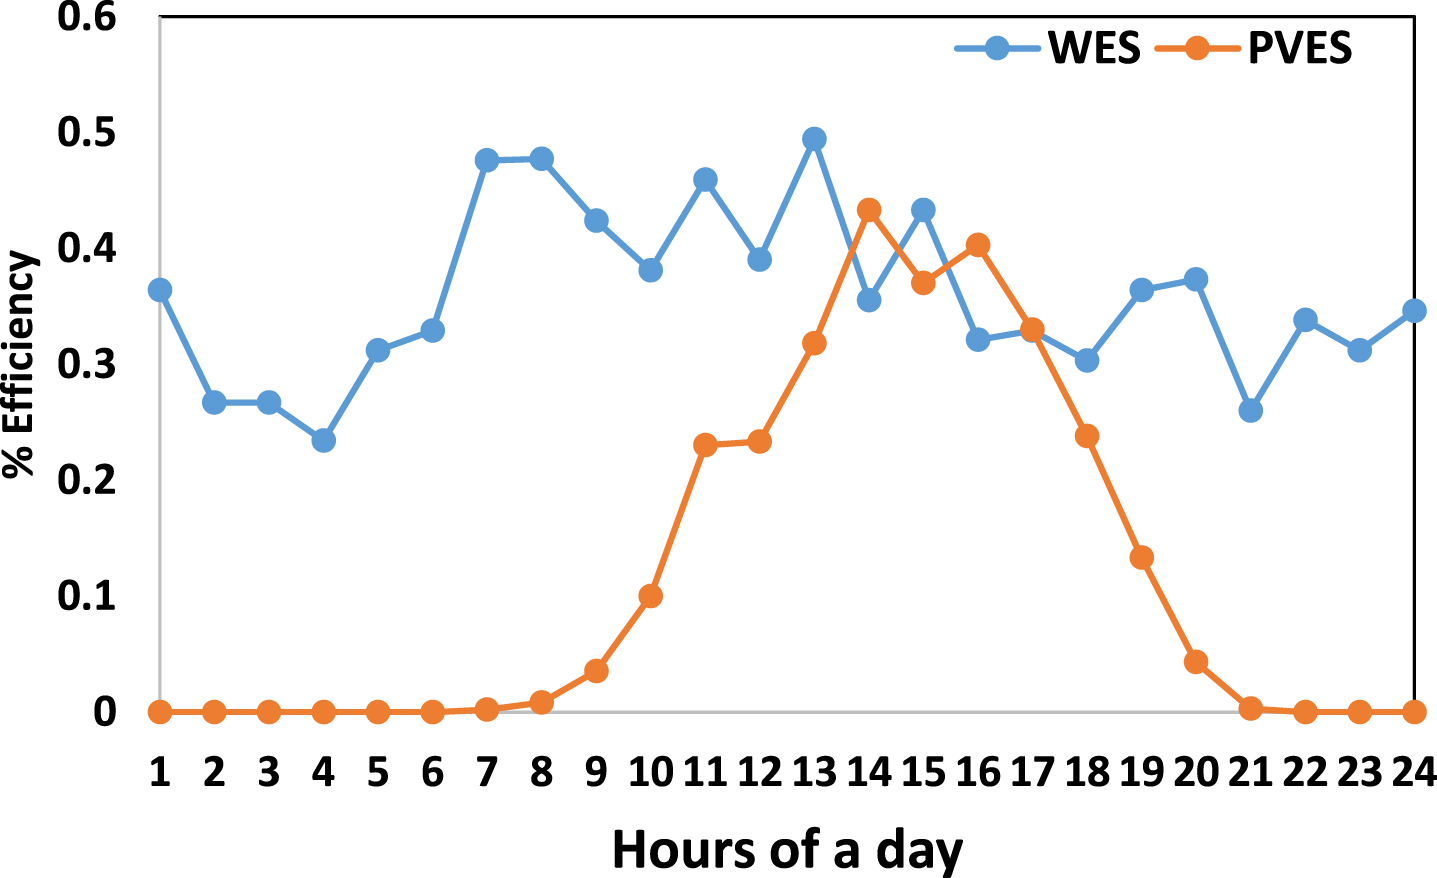
Percentage efficiency of WES and PVES.
Summary of results with WES under daily load pattern
WES integrated with microgrid
This test case was conducted out to see how well a microgrid performed using just WES in the grid. Only five WES, each with a 100 kW installed capacity are allowed in the microgrid, it shows the Fig. 5 according to the optimal WES analysis. The lifetime, installation cost, maintenance cost parameters for the WES cost function are assumed to be 12.5 years, it can occupy 2500 dollars per kW, and 372.57 dollars per kW-year respectively. The proposed hybrid method uses five factors for reconfiguration and five more for determining the best position for WES in the microgrid. The proposed algorithm is run with 50 iterations and 50 populations in mind.
The Optimal Structure with WES.
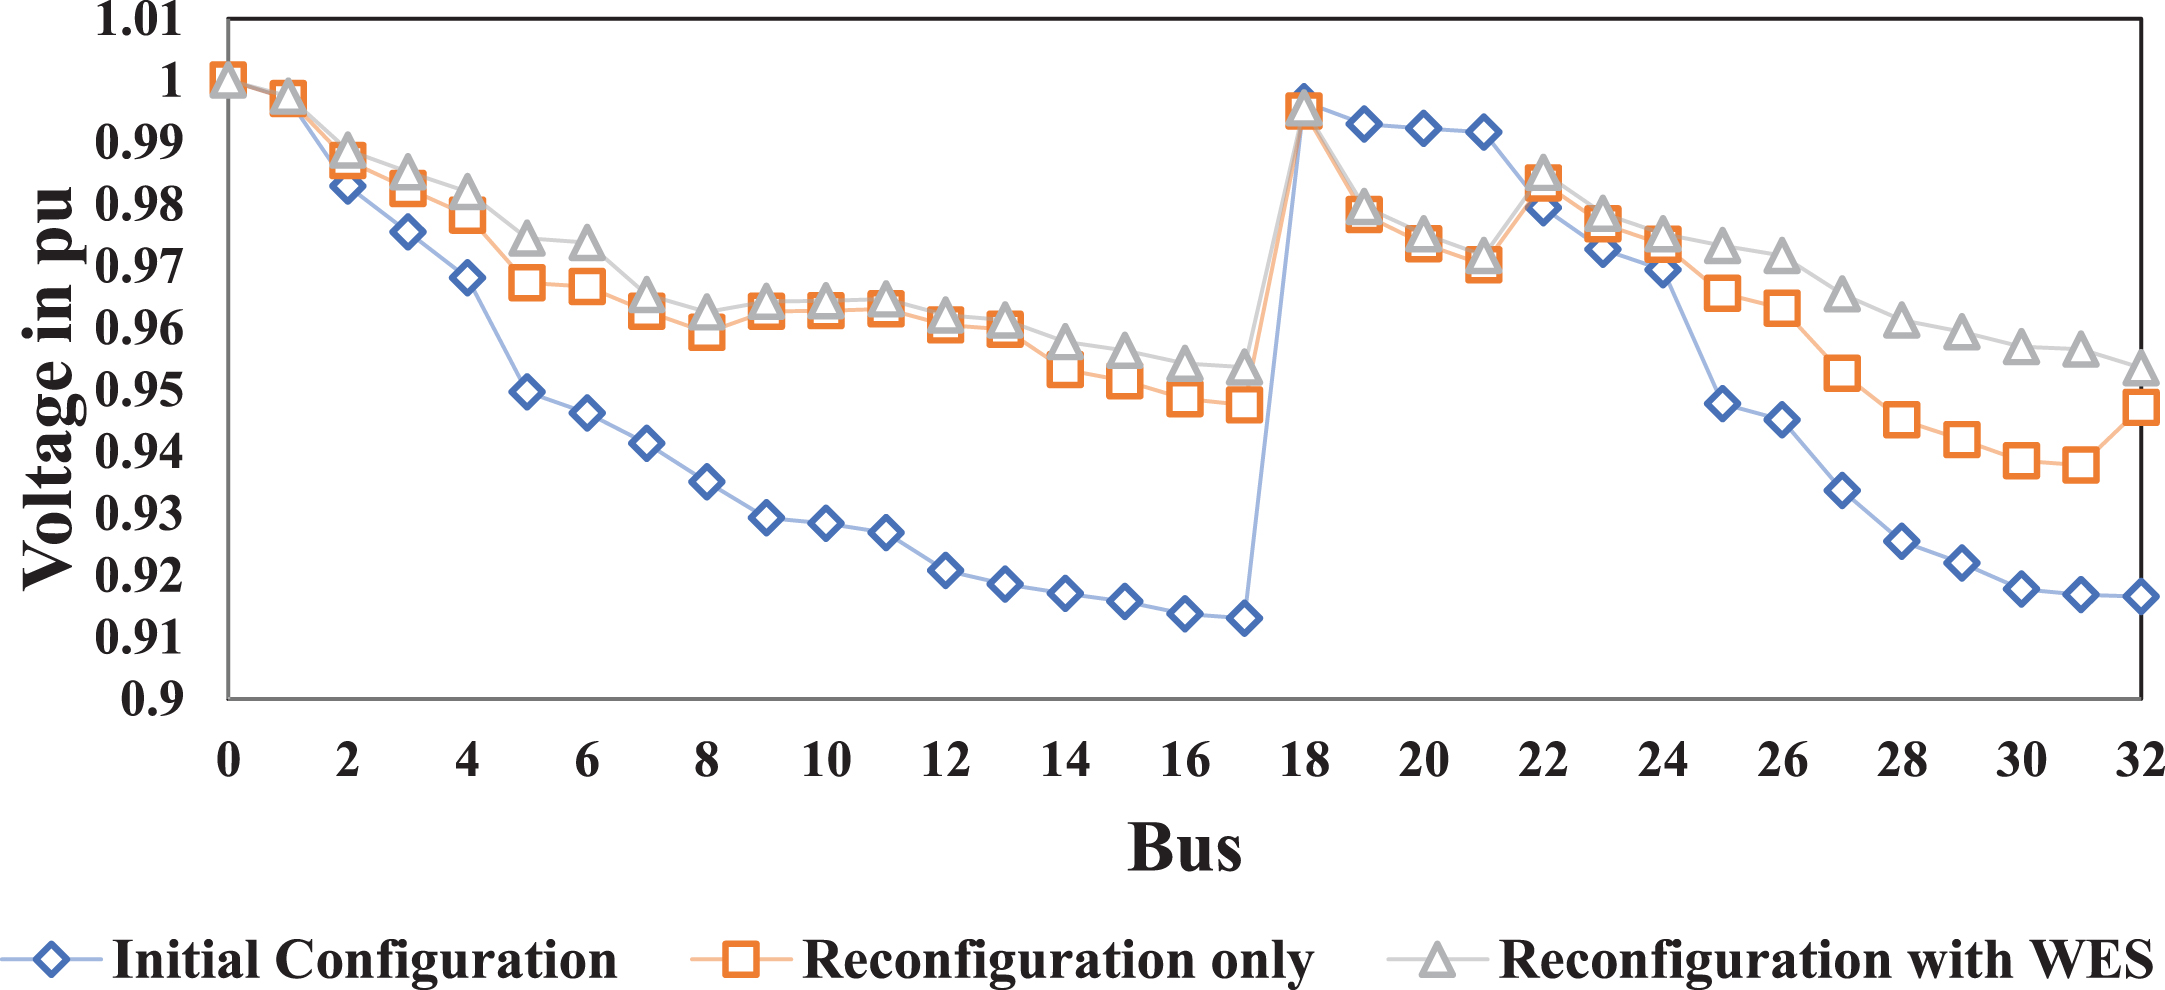
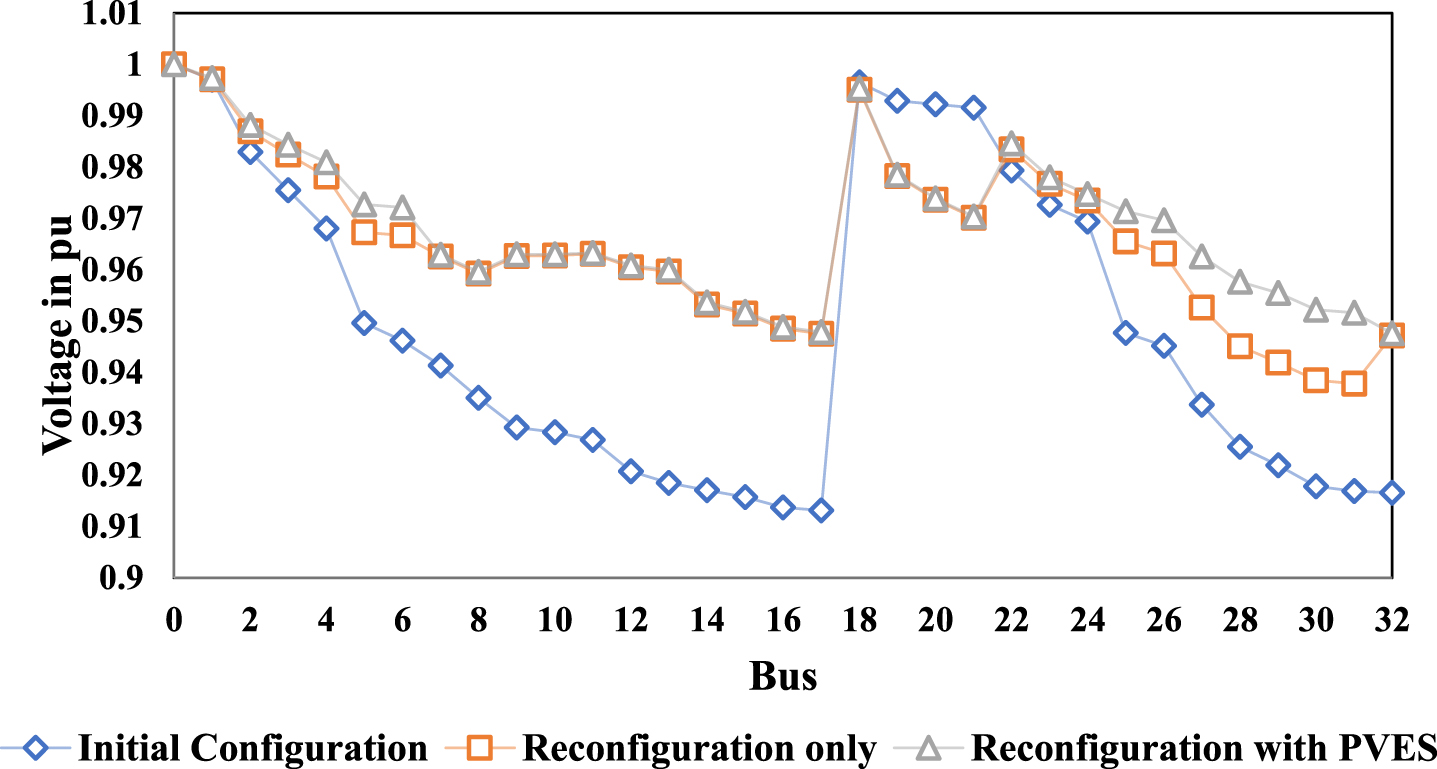
Comparison of Bus Voltages with WES under Different Configurations.
The resultant configuration improves the bus voltage when compared to the other configurations, as seen in Fig. 6. More particular, all load buses’ bus voltages are kept over the minimum voltage limit, with the 32nd bus recording the lowest voltage of 0.9535 p.u. After integrating WES, the system’s transmission loss is decreased to 94.15 kW, and the overall generation cost is 194.68$/hr. Among the total of 5 WES, the 3 numbers of WES have the best placement on bus 31, and the 2 numbers of WES have the best location on bus 32. According to the findings, power generation via the WES is efficient and allows the system to handle additional loads. The WES, moreover, lowers the total cost of emissions. Furthermore, the convergence characteristics of several algorithms are investigated in order to assess the efficacy of the suggested method when the algorithms are run for the same iteration and population values. The convergence of the considered targets, such as TGC, TEC, and VD, is depicted separately in Figs. 7, 8, and 9, respectively. The suggested algorithm gets the optimal solution at the 35th iteration with better convergence than the other techniques in the literature, as shown in the figures. Furthermore, it achieves a near-optimal solution by the 20th iteration.
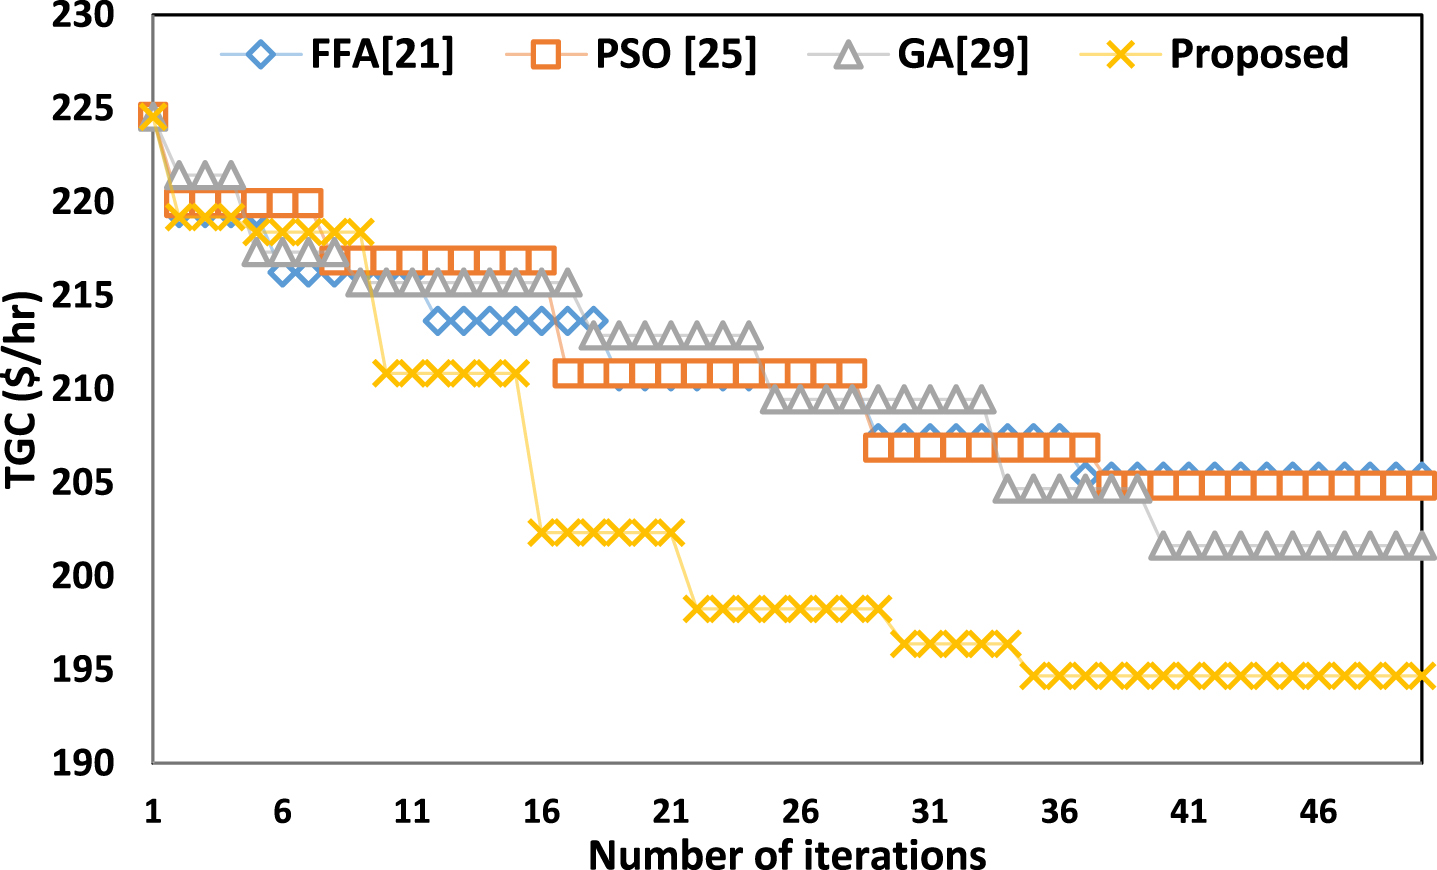
Convergence of the Different Algorithms for TGC.
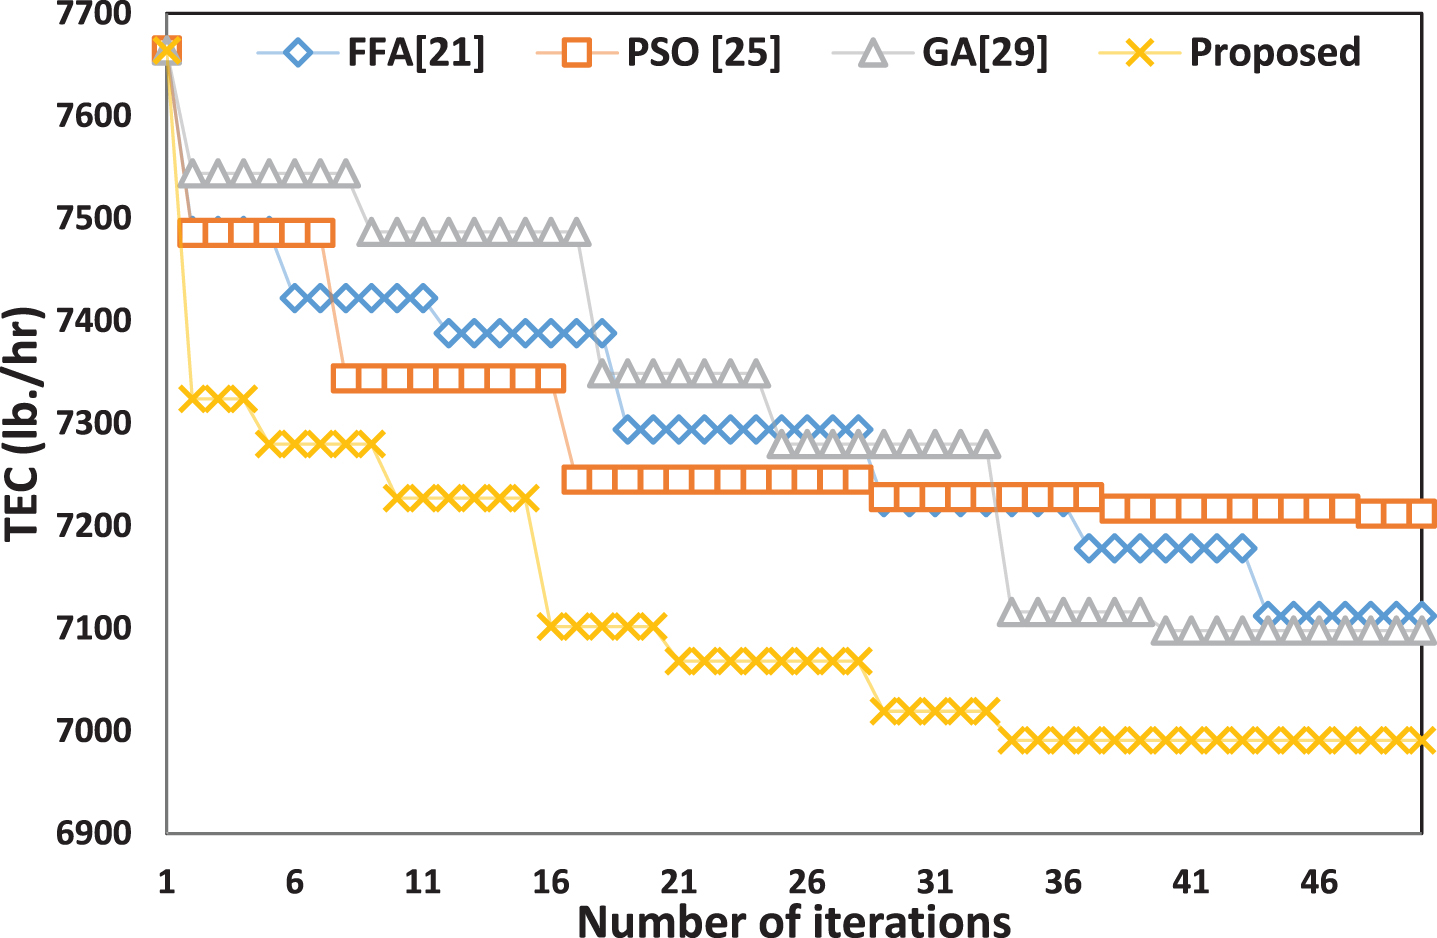
Convergence of the Different Algorithms for TEC.

Convergence of the Different Algorithms for VD.
Optimal solution with PVES under base load condition
The algorithms DGA [24] and PSO [25] do not produce the best solution for the given problem. The proposed hybrid algorithm’s strength is demonstrated by keeping the test system running under dynamic load. The discovered ideal positions for WES in majority of the solutions presented in Table 2 are 16, 17, 31, and 32, and the NO’s for the optimal structure are S7, S9, S14, S32, and S37.
Only PVES are present in the microgrid in this test instance. Only five PVES, each with a 100 kW installed capacity, are available for power generation, as in the prior test case. The suggested hybrid algorithm is optimized using the same boundary conditions as before. The lifetime, installation cost, and maintenance cost parameters for the WES cost function are assumed to be 20 years, 7000 dollars per kW, and 712.92 dollars per kW-year, respectively. After the proposed technique was successfully implemented, the optimal solution was found in the 33rd iteration. In the presence of PVES, results are achieved for the microgrid. Table 3 shows the power loss reduction, ideal configuration, optimal PVES placements, and the configuration’s minimal voltage [37, 38].
The bus voltages and branch currents achieved in the optimal design are compared to the other system configurations depicted in Figs. 10 & 11. In comparison to the other two configurations, the bus voltages are better, and the branch current loading is lowered, according to the figures. Cons was in charge of the optimization procedure.
Comparison of bus voltages with PVES under different configurations.

Comparison of branch currents with PVES under different configurations.
The acquired findings under varied load situations are summarized in Table 4. Table 4 shows that the optimal PVES sites are 16, 17, 18, 31, and 32 in the majority of the found solutions, with the NO’s for the optimal structure being S7, S9, S14, S32, and S37.
Summary of results with PVES under daily load pattern
The various combinations of WES and PVES are studied in this test scenario by constraining a total of five numbers of ES for power generation. With the suggested algorithm, the optimization was carried out with a population size of 50 and a maximum iteration of 100. The investigation is carried out under various load demands over the course of a day, taking into account the equivalent efficiency of WES and PVES in an hour. For all combinations with varied characteristic criteria, the suggested hybrid algorithm provides the best result. The best results are collected for various combinations of WES and PVES under various load circumstances [39–42]. Table 5 shows the microgrid’s true power loss, total generating cost, and minimum bus voltage. The following observations were made as a result of the research: For many of the ES combinations, the best configurations are nearly identical under all daytime situations.
Summary of results under combined WES and PVES integration
Summary of results under combined WES and PVES integration
Summary of results under hybrid WES and PVES integration
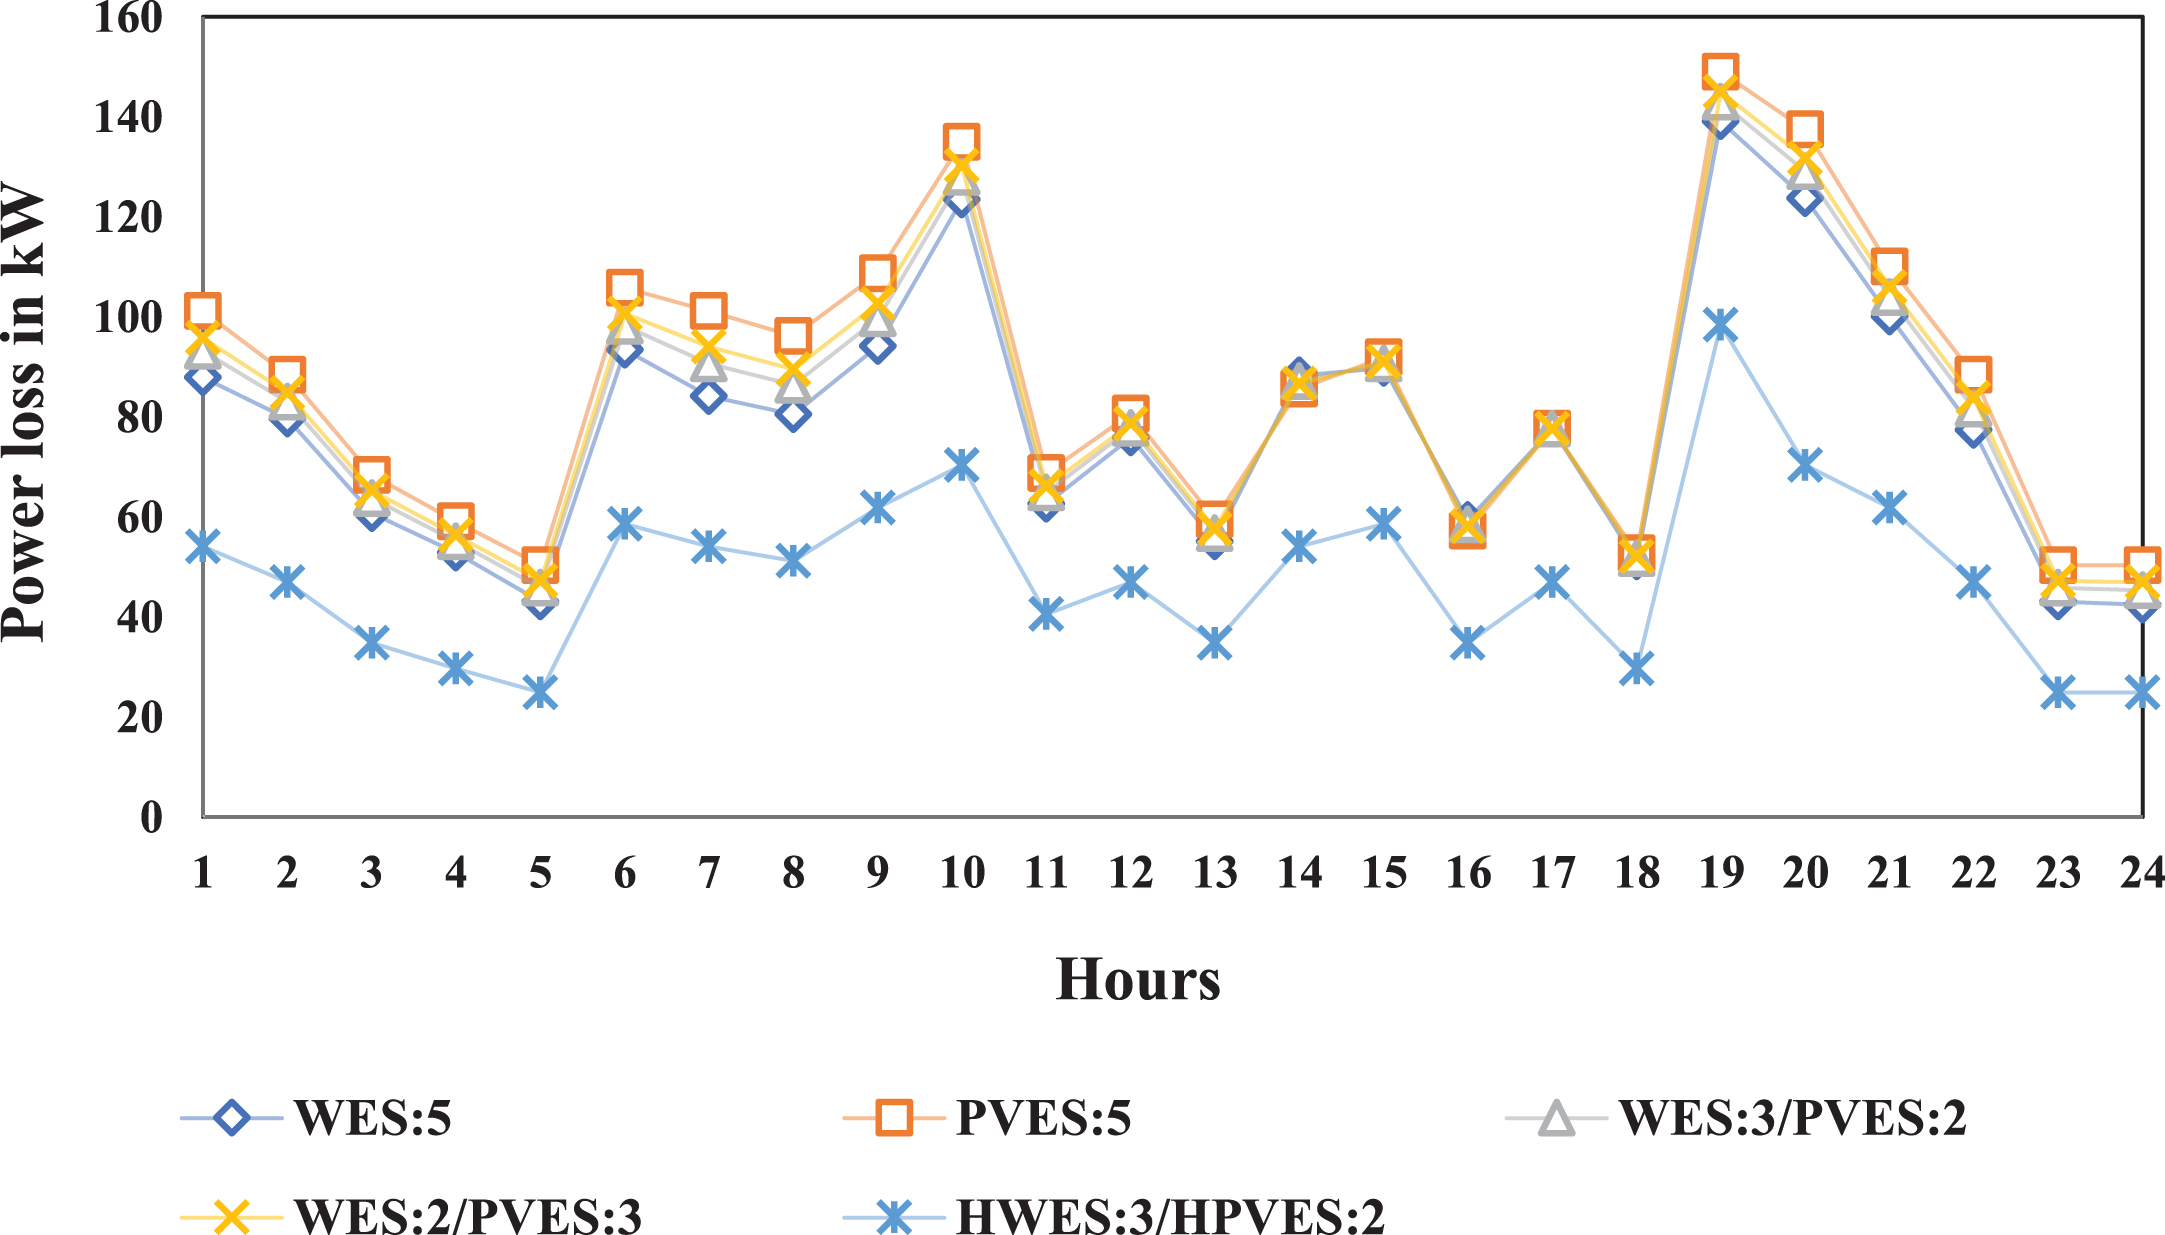
Comparison of power loss between case 4 and case 5.
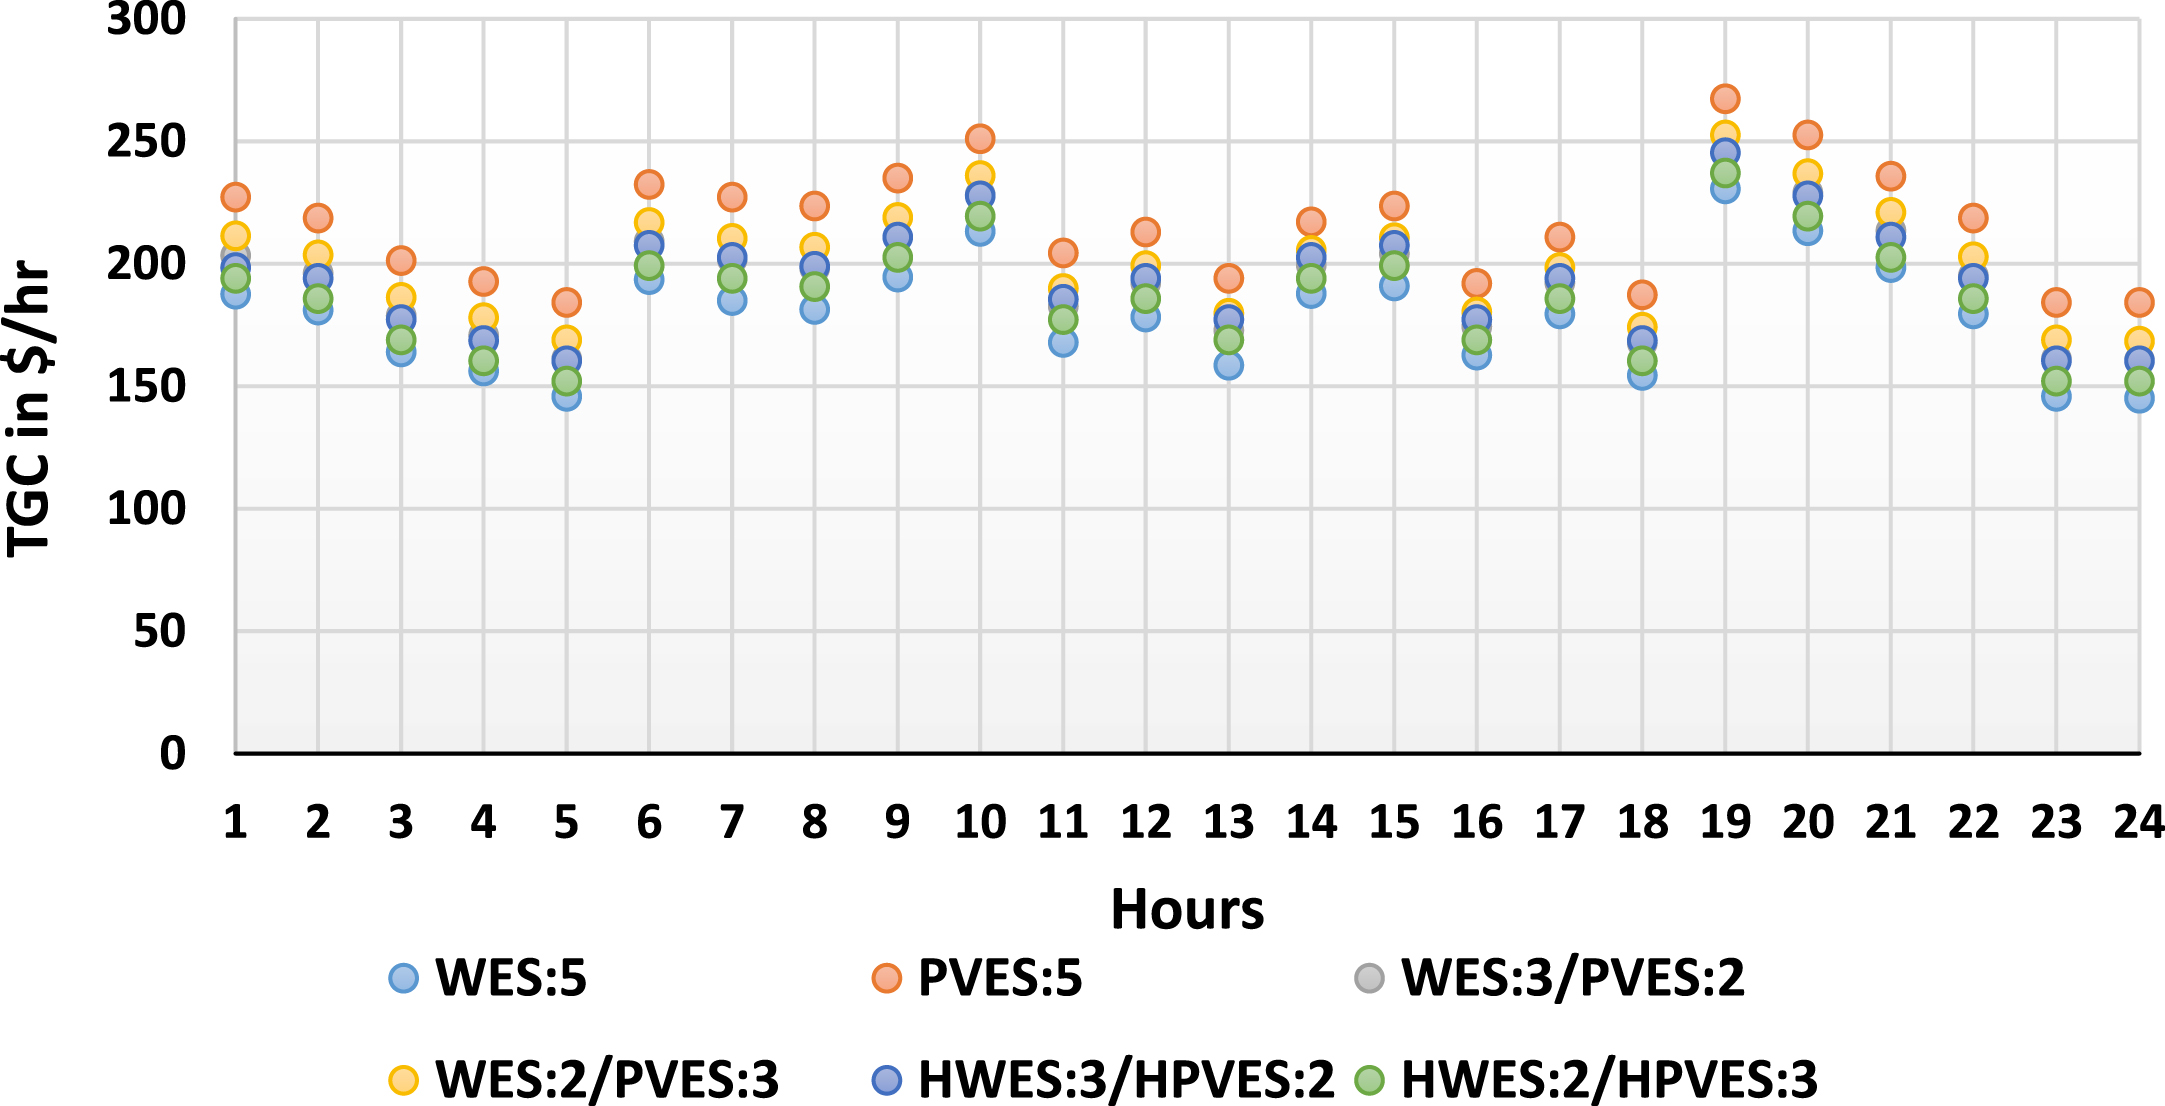
Comparison of generation cost between case 4 and case 5.
Regardless of the type of ES, i.e., WES or PVES, the best placements for the ES are nearly same.
By sharing load with the grid, the use of renewable energy cuts emissions significantly.
Because the generation cost of WES is lower than that of PVES, the overall system generation cost and real power loss drop as the number of WES increases.
When compared to PVES, WES has a higher per-day efficiency.
When it comes to lifetime, PVES are superior over WES.
The efficiency of the RES is regarded a major issue when integrated into the linked microgrid, as evidenced by the results of the previous cases. PVES generates no electricity for roughly 12 hours a day and has a 25 percent efficiency for the remaining 8 hours of the day. PVES, on the other hand, would be far more efficient than WES during the summer months. In terms of WES, the installation necessitates a minimum appropriate wind velocity at the locations at all times of the day.
Overall, the RES’ delivery performance is subpar, despite the fact that they are installed in the best possible sites. When it comes to global warming and the depletion of traditional energy sources, however, renewable energy sources are the best option. As a result of these factors, the best way to improve performance while maintaining the benefits of RES has been determined. Many research projects involving hybrid DGs have recently been completed. The hybrid DG is made up of controllable DGs and renewable energy sources, and it ensures a consistent power supply at the Point of Common Coupling (PCC). When RES power generation is insufficient to meet demand, controlled DGs are used to provide the necessary supply. The performance of the RES can be improved in this way with the help of controllable DGs. The choice of the appropriate controlled DG is determined by the RES’s installed capacity. To test the performance improvement, the RES is replaced by hybrid DGs in this scenario. With the replacement, the hybrid DG ensures 100 kW of power generation throughout the day, regardless of the RES’ power supply performance. The studied two possible combinations of the preceding example are investigated with hybrid DGs for a better comparison of the solutions. The proposed method makes use of the identical boundary conditions as the previous example. The fitness function (32) is created using the equations (3–9) and all of the operational restrictions stated in equations (10–28) are included in the solution process along with the objectives.
The implementation is done for a 24-hour variable load pattern, and the results are shown in Table 6, which shows the power loss, total generating cost, total emission cost, and minimum bus voltage deviation of the best configuration. Under variable load situations, the compromised solution among the examined objectives is ensured. The collected results of all of the situations are compared in order to verify the performance boost of hybrid DGs. The incorporation of hybrid DGs into the grid, most critically, increases the penetration of DGs. The microgrid’s performance is improved due to the increased penetration of DGs. Figure 12 depicts the power loss of the final configuration achieved by the various examples over the course of a day.
The replacement of RES by hybrid DGs provides the best option with the least amount of power loss at all times of the day. Furthermore, even at the best setups, all of the remaining situations are useless due to the RES’s low delivery performance. In Fig. 13, the overall producing cost of the scenarios is compared. When hybrid DGs are linked with an interconnected microgrid, the total generating cost is significantly reduced. In particular, the hybrid WES has a lower generating cost than the hybrid PVES, which can be reversed for plants with higher capacity. Additionally, because hybrid DGs emit dangerous gases, which is unavoidable when addressing global warming issues, this work analyzes the optimization of the total emission cost of the microgrids. The relative performance benefits of WES and PVES are assessed using the predicted daily load curve for the next day and the forecasted daily power generation curve of WES and PVES. The annual anticipated power generation of WES and PVES, which varies seasonally, can be used to analyze this study.
Conclusion and future work
In this research aspect to integrate hybrid DGs performance level and reconfiguration microgrid has been improved. The detailed analysis was carried out with the three key objective functions of total generation cost minimize, total emission cost minimize, and voltage deviation minimize in this manuscript. The fuzzy is integrated with TLA to deal with multi-objective issues. It is used to optimize and reconfigurable location of DGs. At present the investigation on IEEE 33 buses configured in four categories such as microgrid incorporate with WES, microgrid incorporate with PVES, microgrid incorporate with WES / PVES, and microgrid incorporate with hybrid DGs.
In addition to that, a 24-hour load dispatch energy system is under operating, an hour-to-hour shifting daily pattern was investigated. The simulation results show that the proposed method achieves the best outcome, and the optimized structure is clearly enhanced to the present structure. In additionally taken as various combinations of DGs in order to determine the optimum solutions. Most crucially, the value of hybrid DGs over stand-alone DGs was realized. This work can be improved by taking into account the microgrid’s non-linear and unbalanced load situations. Also, a hybrid DG framework used to block-chain technology can be elevated through maximizing customer benefits. The impact of other controllable DGs, as well as renewable energy sources can also be investigated. DGs are used to examine the solution to the microgrid under abnormal situations.