
Abstract
Focal cortical dysplasia (FCD) is an inborn anomaly in brain growth and morphological deformation in lesions of the brain which induces focal seizures. Neurosurgical therapies were performed for the detection of FCD. Furthermore, it can be overcome through the presurgical evaluation of epilepsy. The surgical result is attained basically through the output of the presurgical output. In preprocessing the process of increasing true positives with the decrease in false negatives occurs which results in an effective outcome. MRI (Magnetic Resonance Imaging) outputs are efficient to predict the FCD lesions through T1- MPRAGE and T2- FLAIR efficient output can be obtained. In our proposed work we extract the S2 features through the testing of T1, T2 images. Using RNN-LSTM (Recurrent neural network-Long short-term memory) test images were trained and the FCD lesions were segmented. The output of our work is compared with the proposed work yields better results compared to the existing system such as artificial neural network (ANN), support vector machine (SVM), and convolution neural network (CNN). This approach obtained an accuracy rate of 0.195% (ANN), 0.20% (SVM), 0.14% (CNN), specificity rate of 0.23% (ANN), 0.15% (SVM), 0.13% (CNN) and sensitivity rate of 0.22% (ANN), 0.14% (SVM), 0.08% (CNN) respectively in comparison with RNN-LSTM.
Introduction
Focal Cortical Dysplasia (FCD) is an inborn disorder that occurs due to degeneration of cortical growth and abnormal growth of adult cells, it is often associated with symptoms similar to epilepsy (a cortical disorder that causes seizures), and any tissue which is grown randomly in the embryo is classified as FCD [3]. Focal seizures are not merely a local phenomenon, they can extend to neighboring locations, producing an epileptic network (EN) around the clinically defined epileptogenic zone (EZ). Surgical ablation of dysplastic lesions can only slower or abolish seizures in drug-resistant epilepsy patients [8]. The histopathological result specifies three types of FCD classified based on the deformation of neural structure in the brain cortex. In type 1 the FCD has subtle changes along the cortical membrane. Type 2 includes two subtypes 2a and 2b, in type 2a the structure of the neuron gets enlarged that usually denoted as cytomegalic dysmorphic neurons (CDN). Type 2b are balloon cells in which the whole laminar structure of the neurons gets deformed. The type 3 FCD is similar to the type1 and type 2 that have other lesions [9]. The surgical outcome is efficiently high when the lesions were detected using MRI pre surgically [4]. The common features of MRI to characterize FCD include cortical thickness, calculation of blur in WM (white matter), and GM (grey-matter) [10]. To evaluate the blur at increased grey-white matter boundary width, extraction of GWB region is essential and it is obtained by the FMRIB software library and FMRIB’s integrated registration and segmentation tool (FSLFAST) for GM and WM spatial data [18, 19]. In image classification, false-positive results are produced, hence a size threshold is utilized to minimize the false-positive lesions. MCFO has a major probability of mislabeling tiny subtle lesions as negative. Lesion identification identifies potential sites and warns the doctor to pay attention to those that are questionable. The CNN network of Deep learning can be used to the predict existence of FCD lesions. A customized U-Net architecture is a state-of-the-art fully convolutional network (FCN) model is used for the segmentation of FCD [20, 21]. The prospective of machine learning related to texture feature for the detection of structures in MR images and the recovery of lesion tissues with a smaller number of false-positive within a few cases is possible and also, they can identify cases that are hard to identify with an expert eye [11]. The surface-based features are used for the detection of localized lesions of FCD and DNET’s are used as the major tool for the detection [12]. Selection, evaluation, reference of pediatric epilepsy patients may lead to a better visual analysis by providing putative lesion location by the neuro-radiologist. [23]. The feature differences are represented by the healthy controls, which are derived using localized features and average feature representations [16, 17]. To eliminate false positives, DA and quadratic DA classifiers were built and utilized to categorize MR images using the UVMC approach [13].
The cortical development can be analyzed through DCDH which overviews the characteristic histopathology such as cortical thickness and localized interaction of immature cells which promotes seizures [14]. Ensemble SLM (specific to localized model) is used to separate the train models of temporal and non-temporal FCD subjects where they are very different from the nature of performing. But the temporal zone unfits for the CNN model [15, 31]. Three convolution blocks based on convolution neural network structures use T-F data matrix as input. An individual convolution block comprises a layer of convolution with RLU and MPL (max-pooling layer). The batch control is used to maintain training speed and to overcome overfitting [24–26]. In our proposed system the S2 features of magnetic resonance images are evaluated for the detection of abnormalities in cortical growth in a fetal cohort. RNN is used in our approach to overcome the abnormalities, cortical deformations, and to efficiently identify pediatric epilepsy. The extraction of S2 Features (statistical and surface) increases the number of features and provides a deep vision of the characteristics of the brain image. The RNN structure designed in the proposed technique has simple architecture and effective results. So we decided to come up with a novel DL structure to overcome all the existing drawbacks.
The organization of the paper is arranged as follows; section 2 explains briefly about existing technique. Proposed S2 Feature extraction and RNN classification are explained in section 3. Experimental analysis and state of art comparison are done in section 4 and finally, the conclusion part is in section 5.
Related works
In recent years several machine learning techniques were put forward by researchers mainly to improve the accuracy of MRI brain images. In 2014 Xiaoxia Qu et al. had introduced ILSN (iterating local search on the neighborhood) for the blurring of GWB (gray-white matter boundary) as it calculates blurry region’s width instead of gradient strength. Focal cortical dysplasia lesions were possibly found in the region with increased gray-white matter boundary width. The future enhancement of this research can be made by mapping the GWB width with MRI-based FCD lesions with a developed classifier [29].
In 2017 Anna M. Bianchi et al. had devised the Exploration of ANS based on sleep-related epilepsy detection using HRV along with SEEG for FCD II patients has done. The interrelationship between epilepsy and the Automatic nervous system results in deep learning of sudden death due to epilepsy. The results are unambiguous with delay in initialization and restoration and development measures are to be undertaken for proper and better results and initialization with invariable results [2].
In 2018 Bo Jin et al., have devised video electroencephalography (V-EEG) to explore the NI (neuroimage) and symptoms associated with Sleep-related epilepsy (SRE). Lesions were plotted on MRI. The stable interrelationship between SRE and small lesion size and its volume measurement was studied. But there is a flaw in that the amount of lesion was assessed based on the visually visible lesion on MRI, which may not hold the entire length of the microscopic lesion [4].
In 2018 Xiaoxia Qu et al. had Proposed MCFO (multiple classifier fusion and optimization) for the spontaneous detection of focal cortical dysplasia with minimum FPs throughout the observation of FCD lesions. From the output of the MCFO multiple classifiers the lesion features are identified with the help of constructed object function for maximized detection of F-score lesions. The true lesions were identified in lesser time with the combination of minimal false-positive lesions and a high true positive recognition rate [28].
In 2018 Bo Jin et al. had devised SBM (Surface-based MRI morphometry) along with machine learning for automated lesion disclosure of patients with FCD type II. Nonlinear NNC (neural network classifier) helps to calculate the features and to plot lesion clusters. The shortcoming from the proposed system includes that the FLAIR data was not utilized as multi-component input due to the non-existence of FLARE data in the control subjects which provides false-negative results and the inaccurate delineation of the lesions [5].
In 2019 Aydin Aslan1 et al., (2019) had proposed the diagnostic participation of C-MRI (cranial-magnetic resonance image) and ADC in FCD through individual diagnosis. There exists a diffusion increase in a diffusion-weighted image with the presence of every lesion. The effective and easier diagnosis of FCD is found by the conventional detection of regular MRI findings. The insufficient incorporation of MRI negative results and insufficient rejection of FCD lesions results in the uncertainty of FCD with magnetic resonance image findings is the major limitation [1].
In 2019 Vasileios S. Dimakopoulos et al. suggested Electro-magnetoencephalography which maintains the SNR throughout the overall elliptic spikes rates and two-phase cluster development with the help of SOM. Two tasks of FCD detection have been done using SRA (source reconstruction accuracy), which includes RFA and LPC and only Electro-magnetoencephalography can localize LPFCD. The shortcoming includes the major input results in unstable datasets and fails to extract the input perfectly in the starting period of detection using SOM [27].
In 2020 Cuixia Feng., had proposed a 3D-LM (3D Laplace method) to explore the variations in cortical thickness using Magnetic resonance imaging (MRI) of the patients. Focal FLAIR –negative images of MRI are used to effectively identify the FCD lesions. Though the outcome was good there remain false-positive areas. The false-positive area peaks when the cortical thickness map gets reduced from high to low even though the lesions were identified [6].
In 2020 O. Colliot have developed 3D-DM for the segmentation of focal cortical dysplasia lesions by weighted image based on T1 type in Magnetic resonance image. The DM and visual characteristics of focal cortical dysplasia have been characterized by cortical thickness, intensity, gradient, and hyperintense signal by using a level set method. The correlation of MRI gray level with DM become deficient and lack in comparison of segmented images with poor classifier detection have been studied as a shortcoming [22].
In 2020 Cuxia Feng has developed AMCL for the segmentation and detection of FLAIR negative lesions and identification of Pattern image blocks using a six-layer convolution neural network incorporated with convolution. PIB is comprised of a bright center with a dark surrounding which is used to detect the pattern image blocks which are identical to the lesion image related to Net-pos. Though the location of the FCD lesion has been detected the major impact from the approach arises due to the failure in detecting false positive areas [7].
In 2020 Yoon Gi Chung1 et al., had devised IEEG as a deep examining classifier to distinguish between inter-ictal and pre-ictal states of focal cortical dysplasia type II patients. Image shaping in Electroencephalography was identified using CNN with T-F domain for the classification of FCD using convolution filters. The drawback includes variation in the quantity of seizures calculation which results in short-term surgical outcomes with EEG monitoring. The major disadvantage has been considered as an invasion of intracranial electrodes [30].
Proposed methodology
Preprocessing
Figure 1 shows the proposed structure for the segmentation of FCD. Pre-processing is a significant process that reduces noise and enhances the subtle features of natural medical images. In the proposed work, the preprocessing step involves the removal of noise and undesirable distortion from the exploration of T1-MPRAGE and T2-FLAIR images. The first step of preprocessing is intensity correction in which a Discrete Wavelet Transform (DWT) is used to eliminate the non-uniformity of the image. DWT is a decomposition technique that has been mainly used to compress and denoise medical images. The outer cortical and skull region is removed to enhance the cortical region through skull stripping. The third step includes the exclusion of false-positive lesions as it produces acquisition noise. Figure 2 shows the fluctuations of the actual image and skull stripping image.
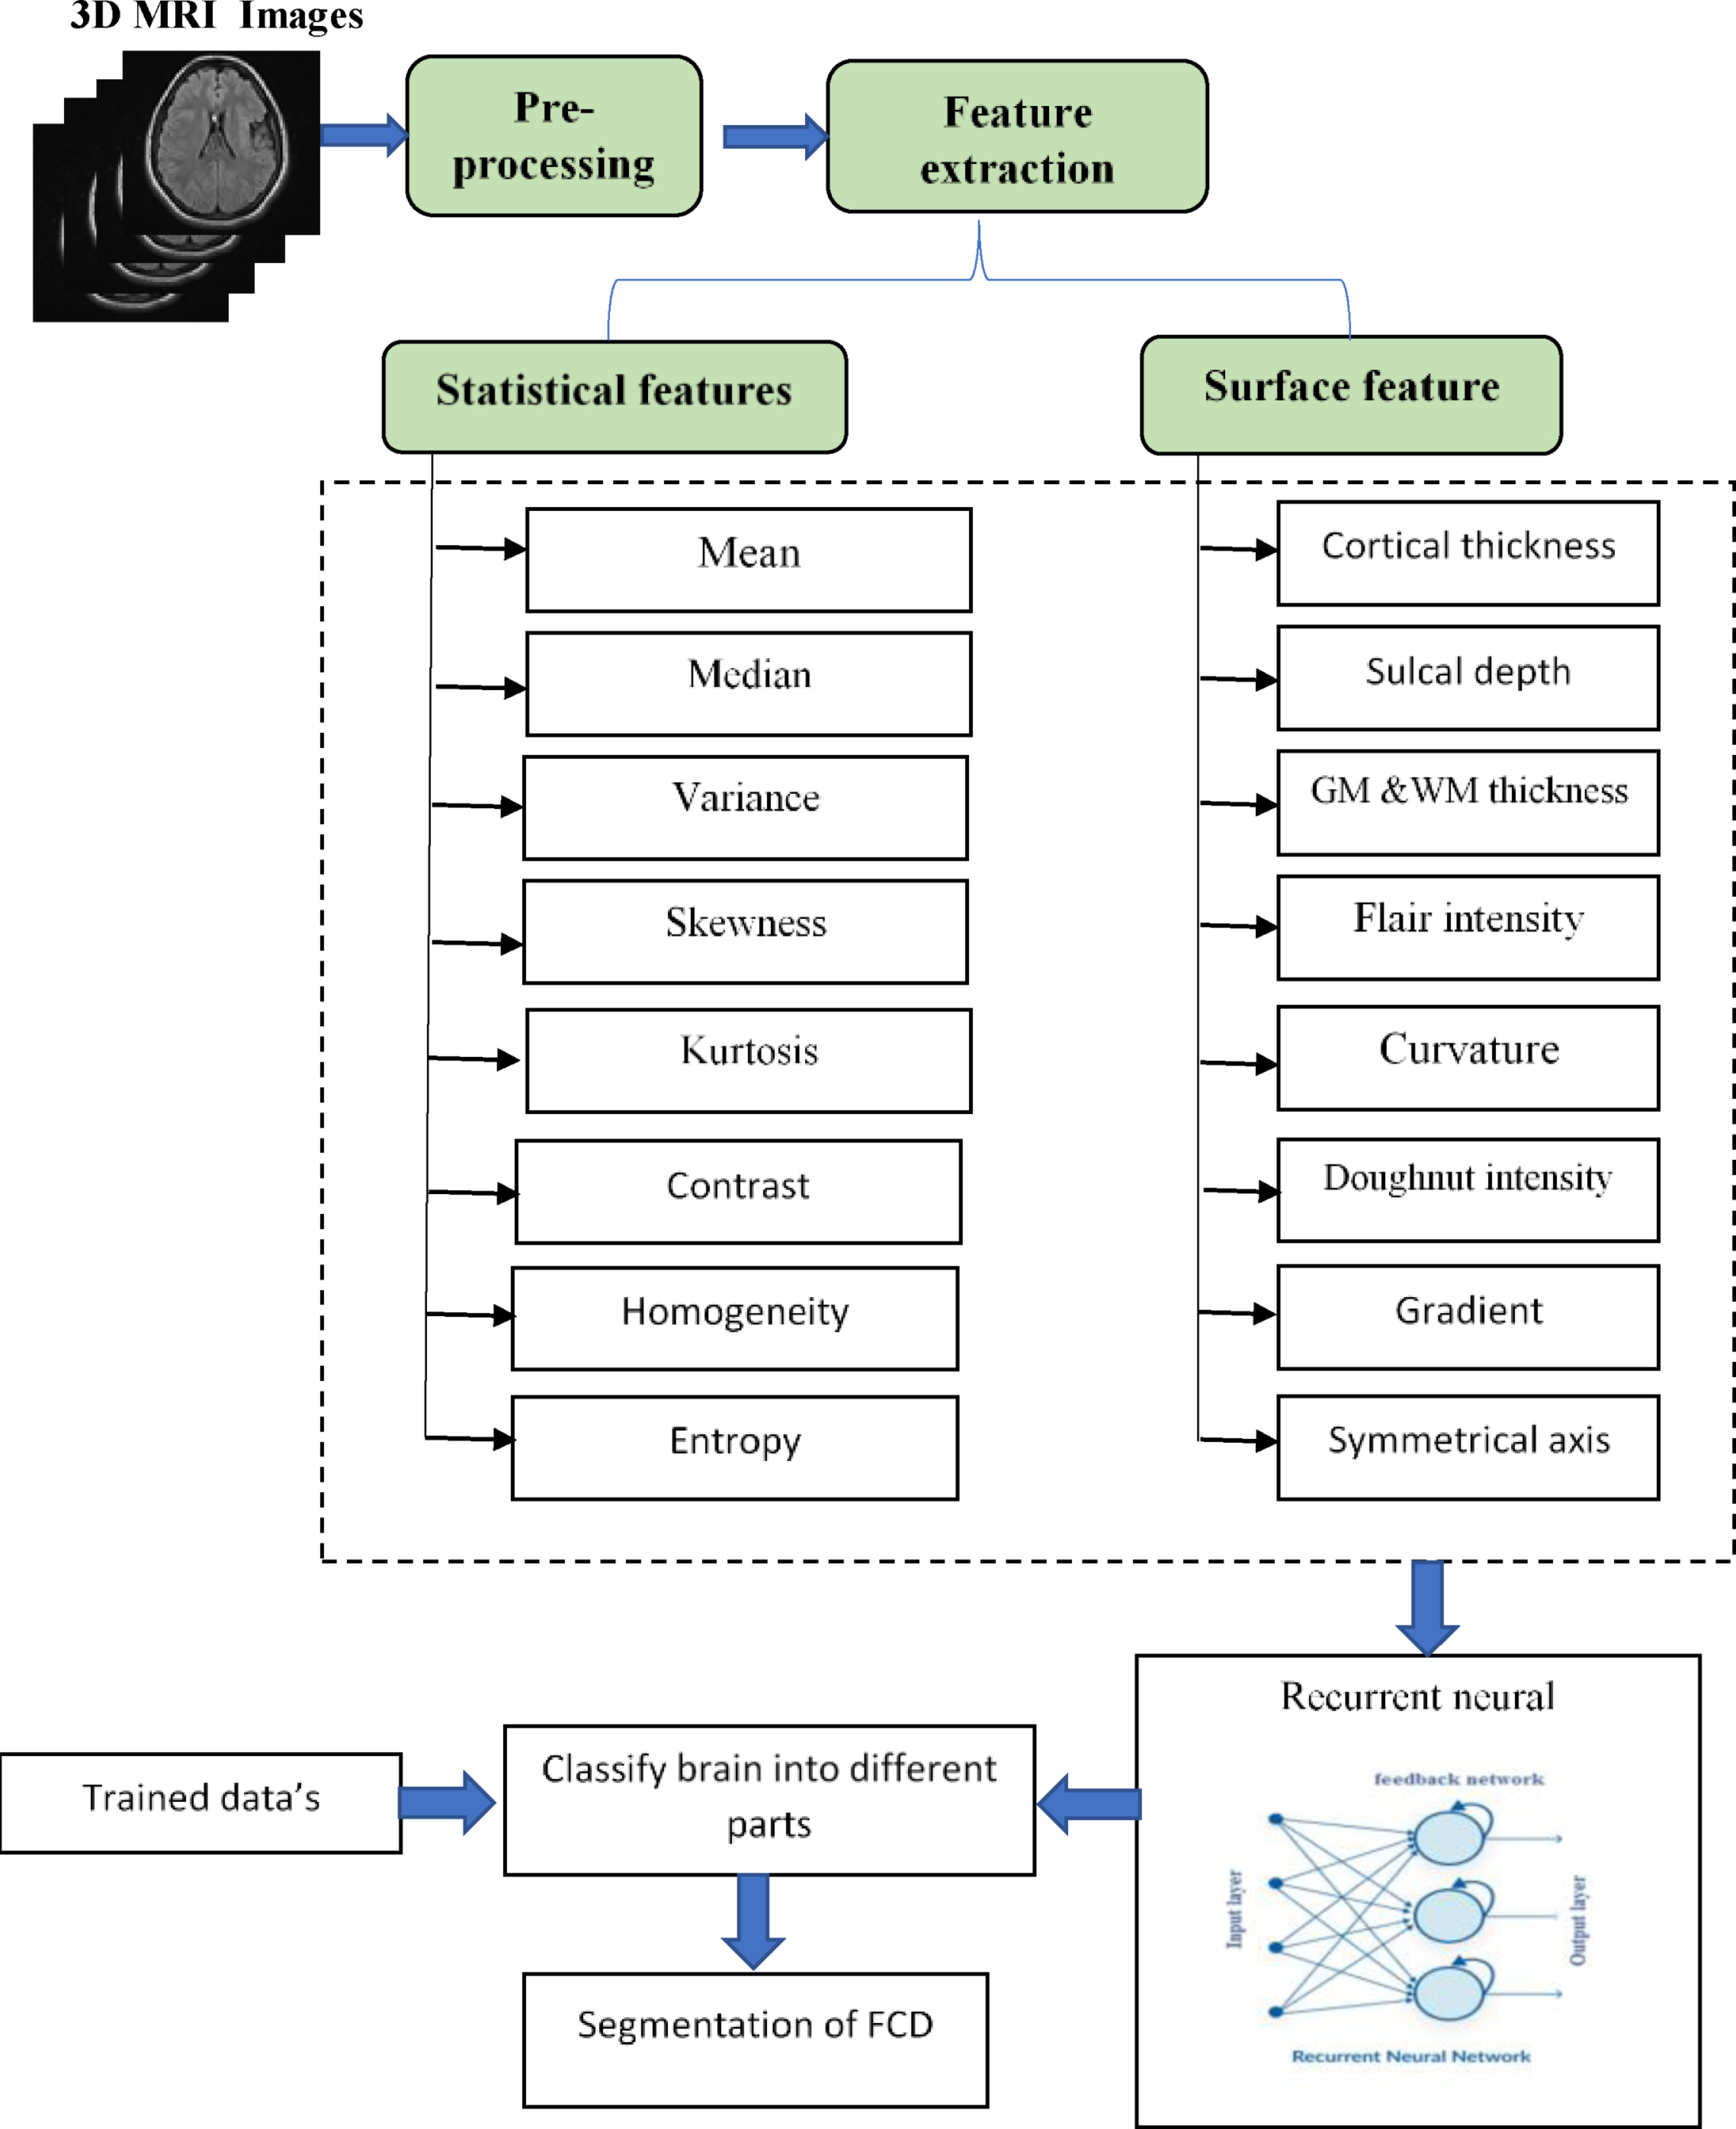
Proposed Structure for the segmentation of FCD.
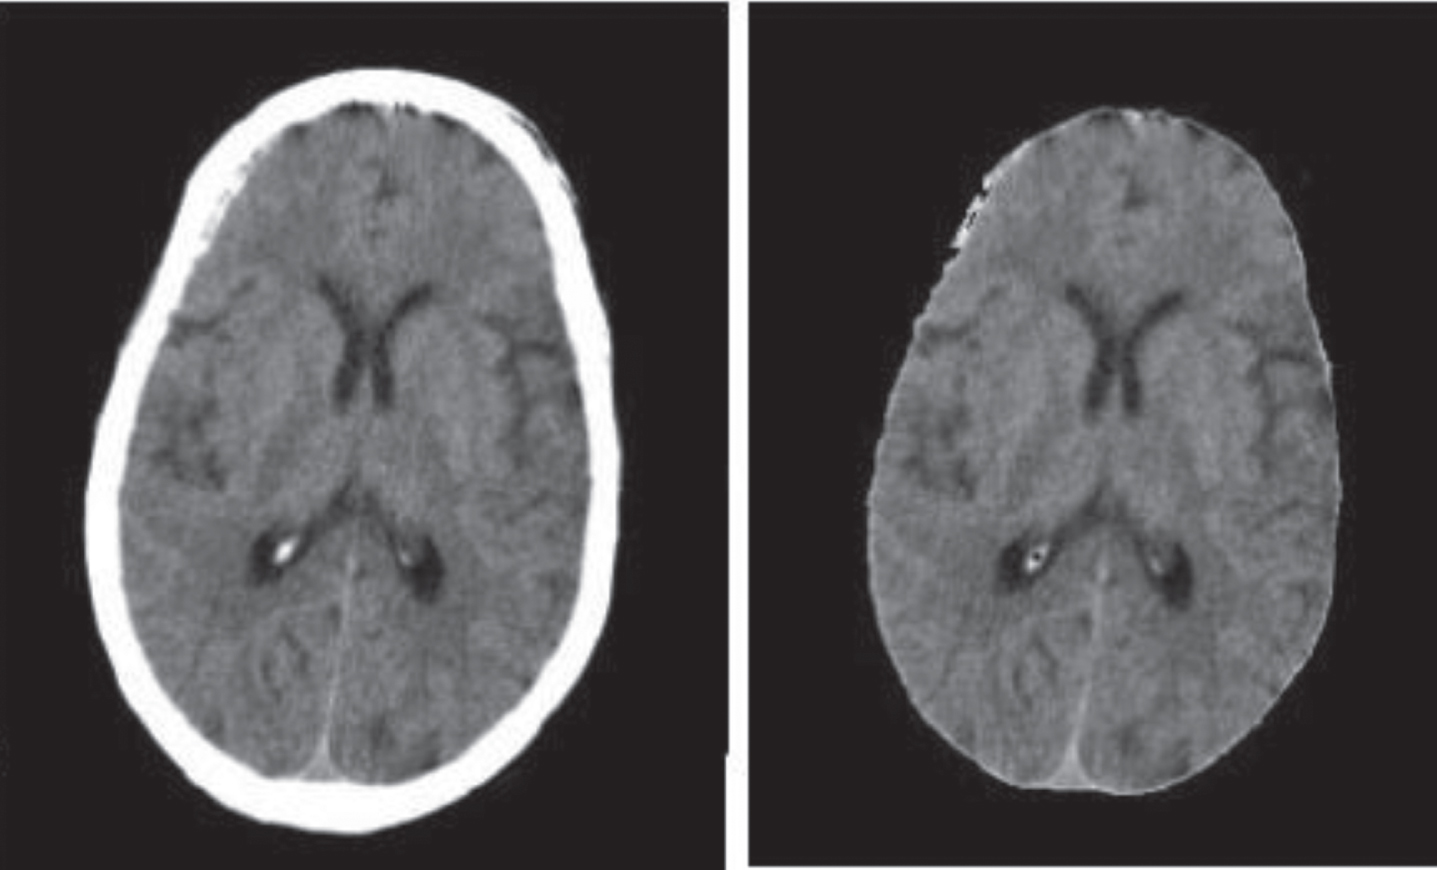
(a) Actual image (b) skull stripping image.
Feature extraction is an important step in machine learning which is used for the encryption of original data by eliminating the unwanted and irrelevant data present in the input and making them into a high-quality compressed perfect output. In our proposed method the S2 features of brain MRI were extracted, where S2 indicates the statistical and surface features.
The resulted output from the feature extraction is the compression of a vast set of data without any loss of significant data. Feature extraction provides easy learning with less amount of effort.
Subsequently, the next step includes the segmentation of brain tissue in which the extraction of the gray, white matter, and CSF (cerebral spinal fluid) based on intensity level and partitioning takes place. The white matter segmentation, patching of GM and WM boundary, alteration of chorography defect are the sections included in the processing of an image.
The BET (brain extraction tool) is used for the instinctive extraction of the negative image from the brain region. The segmentation outcome for each field was visually monitored individually by the skillful user to check the errors in the segmentation. The high-resolution image in the initial stage requires the least correction of errors in the scans of the control and patients. The extraction of the negative image from the normal image occurs with the prepossessing technique. Using the BET image processing tool the disregarded lesions were identified
Statistical feature
Statistical features are the subset of feature extraction which is used to quickly calculate the statistical division of pixels and evaluation of patterns in the image. The statistical features comprising mean, median, variance, entropy, homogeneity, contrast, kurtosis, and skewness were calculated. The mathematical derivation of all statistical features are expressed in the following equations;
Where u -represents a random variable of the pixel and P (u) represents the probability mass function.
Where w
i
-represents the initial value of the pixel and v-represents the final value of the pixel and the distance between them is calculated as (w
i
-v) for the median calculation.
Where u -represents the individual value of the pixel, μ-represents the mean value of the pixels, and n- represents the number of values in the pixels.
Where σ-signifies standard deviation of the pixel, μ-signifies mean value of the pixels, N- signifies the number of observations of the image, p (u)-represents the probability distribution of pixels
Where σ-signifies standard deviation of the pixel, μ-signifies thickness of the layer, N- signifies the number of observations of the image, p (u)-represents the probability distribution of pixels
Where i-represents the lowest value of pixels, j-represents the highest value of pixels, and p (i, j)-represents the variation between the highest and lowest values of the pixels.
Where u-signifies the initial value of the pixels v-signifies the final value of the pixel.
Where p (u)- indicates the probability of uncertainties occurrence in the image.
All these statistical features provide a keen perceptional view to characterize the brain region in an MRI image.
The surface feature provides a clean piece of information comprising the content of the MRI image. It is used to classically identify the individual texture properties existing in a certain region of the image. Surface feature results in detecting the specific structure of an image such as edge, points, and objects. In this study, the surface feature determines the developmental stages of the brain through the study of the potential outline of the brain. Surface features include symmetrical axis, gradient, doughnut intensity, curvature, flair intensity, GM &WM thickness, sulcal depth, and cortical thickness.
The symmetric axis results in the best separation of the planar axis into two halves. If an object results in partitioning into two halves along the line then there exists bilateral symmetry. The main subset of the symmetric axis is the bilateral symmetry axis which is mainly used for the evaluation of symmetrical balance in an image by weighing the image. The asymmetry in the brain image such as in size or shape is also detected using the bilateral axis. Thus, the symmetric axis extracts the asymmetry present in the brain image.
The gradient in an image is used to predict the change in intensity of the image. It plays a vital role in image processing in which it provides the weighing of the image in the correct direction in the right amount in the neural network. The pattern image of the neural network can be analyzed through the gradient. It is used for the automatic detection of FCD lesions in the brain.
The “Doughnut” methods characterize the structure of lesions. Here it is used only in a particular brain region disclosing other contexts without the loss of data. In addition, it is correlated to angiogram and tomography for describing the evaluation of the patients. The mapping of the doughnut method involves the evaluation of gray matter/white matter intensity, cortical thickness, and FLAIR thickness for the identification of focal cortical dysplasia in the pediatric cohort. This computation is replicated for every apex over an inflated surface. The doughnut intensity is used to quantify the localized variation of the intensities existing in the gray-white matter boundary and bi-meridian variation in them. The major findings in this study include the prediction of major changes in the MRI data of the pediatric cohort.
Cortical thickness is measured to estimate the size, shape, and changes in the brain to evaluate the mutual thickness of coatings in the cortex of the cerebellum of the whole brain. The thickness calculation is done with the correlation of some quantity of neurons. The cortical thickness refers to the detection of renal cortex thickness. The thickness of the cortex contributes important data about the changes that occur in neuroanatomy either normality or abnormality present in it.
Cortical thickness is used to determine the distance between white matter and gray matter based on the segmentation of neuroimaging data. The psychiatric malady can be easily detected using the cortical thickness which improves the regional integrity of the cerebral cortex. The thickening of the cortex includes the improvement in the signal of T2-weighted and FLAIR images.
The detachment of the cortical surface and cerebral hull produces the sulcal depth. The computation of sulcal curves is done by the rebuilt cortical surface based on the region of interest. The main objective of measuring sulcal depth is to calculate the structural study of the cerebral cortex. NNC (Neural network classifiers) were used in sulcal depth measurement by the collection of vertices from individual patients. This measurement is undertaken by the calculation of the shortest path of the curve between two points of the sulcal and gyral vertices.
Grey matter/white matter thickness calculation is used to identify the changes in the morphological measures of the brain. It is used to measure the density of brain cells in certain regions. The calculation of grey and white matter thickness result in the identification of energy transferred to the neurons and the communication between them so the movement of the neuron can be studied which helps in detecting the existence of FCD.
Figure 3 shows the Surface features extracted from the T1-MPRAGE and T2FLAIR MRI indicating cortical lesion and S1-S5 illustrate the enlarged lesion area of the surface map using RNN-LSTM. The FLAIR intensity calculation is used as the classifying system for the detection of variation in the GM and WM on the image and the thorough sketch of growth in the individual region of the brain. The flair intensity is calculated by using two techniques –the hotspot method and WROI (whole region of interest). This method is used for the graphical calculation of the prominence of the lesion in FLAIR images. Curvature plays a vital role in the abstraction of the curve and bending of the MRI image and is used to detect the structural efficiency of the image such as pixels, edge points, and priors of the image. The extraction of the Sample s2 feature involves the assimilation of both statistical and surface features. The measurements of statistical and surface features were extracted from the processed MRI image and represented in an 8×8 matrix. In which each row of matrix A and each column of matrix Band represent the numerical measurements of 8 statistical and 8 surface features respectively. Figure 4 Shows the Sample s2 feature calculation matrix.

Surface features extracted from the T1-MPRAGE and T2FLAIR MRI indicating cortical lesion and S1-S5 illustrate the enlarged lesion area of the surface map using RNN-LSTM.
Sample s2 feature calculation matrix.
The RNN is the simplified model of FNN that is used to image the proper functioning of the brain. Figure 5 Shows the Folded RNN architecture. Deep learning with RNN is used to analyze complicated structures in the image. It is different from CNN and ANN as their input and output are certainly independent of each other (feedforward network), but in RNN it depends on the previous state for further output as it is recurrent and all the data delivered as the input is related to each other (feedback network). The combination of RNN with LSTM provides the effective detection of regional pixels. A recurrent neural network can remember the data given as the input to it, so it recollects the data to perform further functions. Due to this benefit, the advantage of the Natural Learning Process such as prediction of sequential handwriting acknowledgment is done predictively as RNN can apply elongated data’s possible to detect the outline of lesions in FCD easily.

Recurrent Neural Network Architecture.
The recursive formula of function at time step t (S
t
)
Where, X t -implies the input at time step t, S t -represents the state at time step t, F w -represent the recursive function.
A recursive function is tan h function and the simple RNN is represented by,
Where W s represents the state of weight in the present layer and W x - represents the weight of the previous layer.
LSTM is the simplified model of RNN in which it solves the problem in RNN by vanishing the gradient. For unknown time and morphological properties segmentation and prediction are done using long short-term memory. RNN significantly extracts the features of the brain.
The crucial step in the training process is the hyperparameter setting. Here the hyperparameters are fixed and tuned as follows: Initially the number of a neuron is set equally in each layer i.e. n = 57. At some point, the neurons range is set between 25 and 100 for the complex level prediction. The activation function predicts the computation values input value to the next layer. The learning ratio (α) set to 0.1, the batch size 512. Small batch size increases the speed learning process with high accuracy. The decay rate and dropout are set to 0.2 and 15% respectively. The learning rate decreases gradually in every epoch of the training process.
Through the RNN network, the input given to the nodes was evoked, the batch size is normalized after the first hidden layer and 15% of the neurons fall from the drop-out layer before values move into three further buried neuron layers. Other techniques such as implicit regularization [32], data augmentation [33], and dropout connect can be interpreted at the loss layer as a regularization function. But in the proposed method adopted a dropout function that showed efficient results in hidden nodes and controls overfitting problems. The changes and differences existing in the lesions such as the thickness of the cortex, gradient, GM/WM thickness can be detected. The result is detected as the result of memory in RNN. It detects and remembers each difference, defect, and abnormalities in the lesion and this function takes place in the hidden layer. The defect identified were highlighted by the network and the output is provided as the highlighted morphological defects identified by RNN.
In Fig. 6 Segmentation is primarily used for the presurgical evaluation of the lesions in which it includes the following steps, Cortical construction Feature measurement Asymmetry calculation of symmetrical axis Move features and lesions to asymmetric template Recurrent neural network (with LSTM)

Segmentation and classification of FCD lesions using RNN (with LSTM).
The FCD lesion segmentation requires the construction, measurement, movement, and estimation of cortical lesion characteristics. The first step includes the cortical construction emphasizes the outline of the brain so that the defects in the lesions can be reliably defined. The second step requires the measurement of features such as GM WM intensity, cortical intensity, sulcal depth, cortical thickness, flair intensity, curvature, gradient, and it is compared with the healthy image to detect the changes and defects present in them. The next step provides the asymmetry calculation of the symmetrical axis within the subject normalization and between the subject normalization to detect the variation in the symmetric properties of the lesions. The next step includes the movement of lesions and features to the asymmetric template for further classification and was done by a recurrent neural network with LSTM and results in the classified lesions.
In the proposed work, a deep learning structure is designed for the FCD classification process to reduce the false positives rate. The main challenge in the detection of FCD is the isolation of appropriate lesions because it often misjudges the growth form of the brain in children. The main objective of the RNN-LSTM model is to differentiate and classify the FCD lesions and the normal brain growth development. The S2 features measured in this technique label each feature and provide accurate values. Moreover, the Feedback RNN-LSTM network analyzed each feature map and classify the FCD lesion efficiently. The experimental result of the RNN-LSTM model is analyzed in section 4.
Our proposed technique is implemented based on image processing using MATLAB 2017. In this result analysis, the output of the MRI image using T-1, T-2 FLAIR segmentation, and its performance were analyzed and compared with classification and segmentation techniques. The comparison rate is calculated based on the variations between existing and proposed techniques.
Dataset/image acquisition
In our work, the T1-MPRAGE and T2-FLAIR MRI images were taken from 12 different patients (age limit 3–19) who had undertaken pre-surgical evaluation with cortical dysplasia epilepsy. The dataset was acquired at Muthu Neurological Hospital on a SIEMEN’s 3D scanner (TIR sequence at 1.5 T (left: TR, 8770 ms; TE, 92 ms; TI, 300; matrix 512 × 256; section thickness, 3 mm; FOV, 220 × 220 mm; bandwidth, 130 Hz/pixel) and 3 T (right: TR, 8890 ms; TE, 95 ms; TI, 300; all other parameters equal), which demonstrates clear depiction of gray and white matter at both field strengths. The selection of the FCD-positive patients is done with the related symptoms notified from the weighted and FLAIR images. The images are visually checked by the expert users to analyze the errors, noises and the existence of epilepsy ids detected. The Segmentation is done based on the size, complexity, dimensions of the image. T-1 weighted image plays a vital role in the major detection of the FCD lesions. The image acquisition is enhanced for the improved result of GM and WM contrast images. Depletion correction in the image is done using dissimilar CT transformation. The surgical plan of FCD is based on the pre-surgical result of epilepsy-positive patients.
In Fig. 7 the MRI image of different FCD positive patients is classified using the proposed RNN-LSTM method and the result is compared with the ground truth value to calculate the efficiency. The extracted image results are as follows,
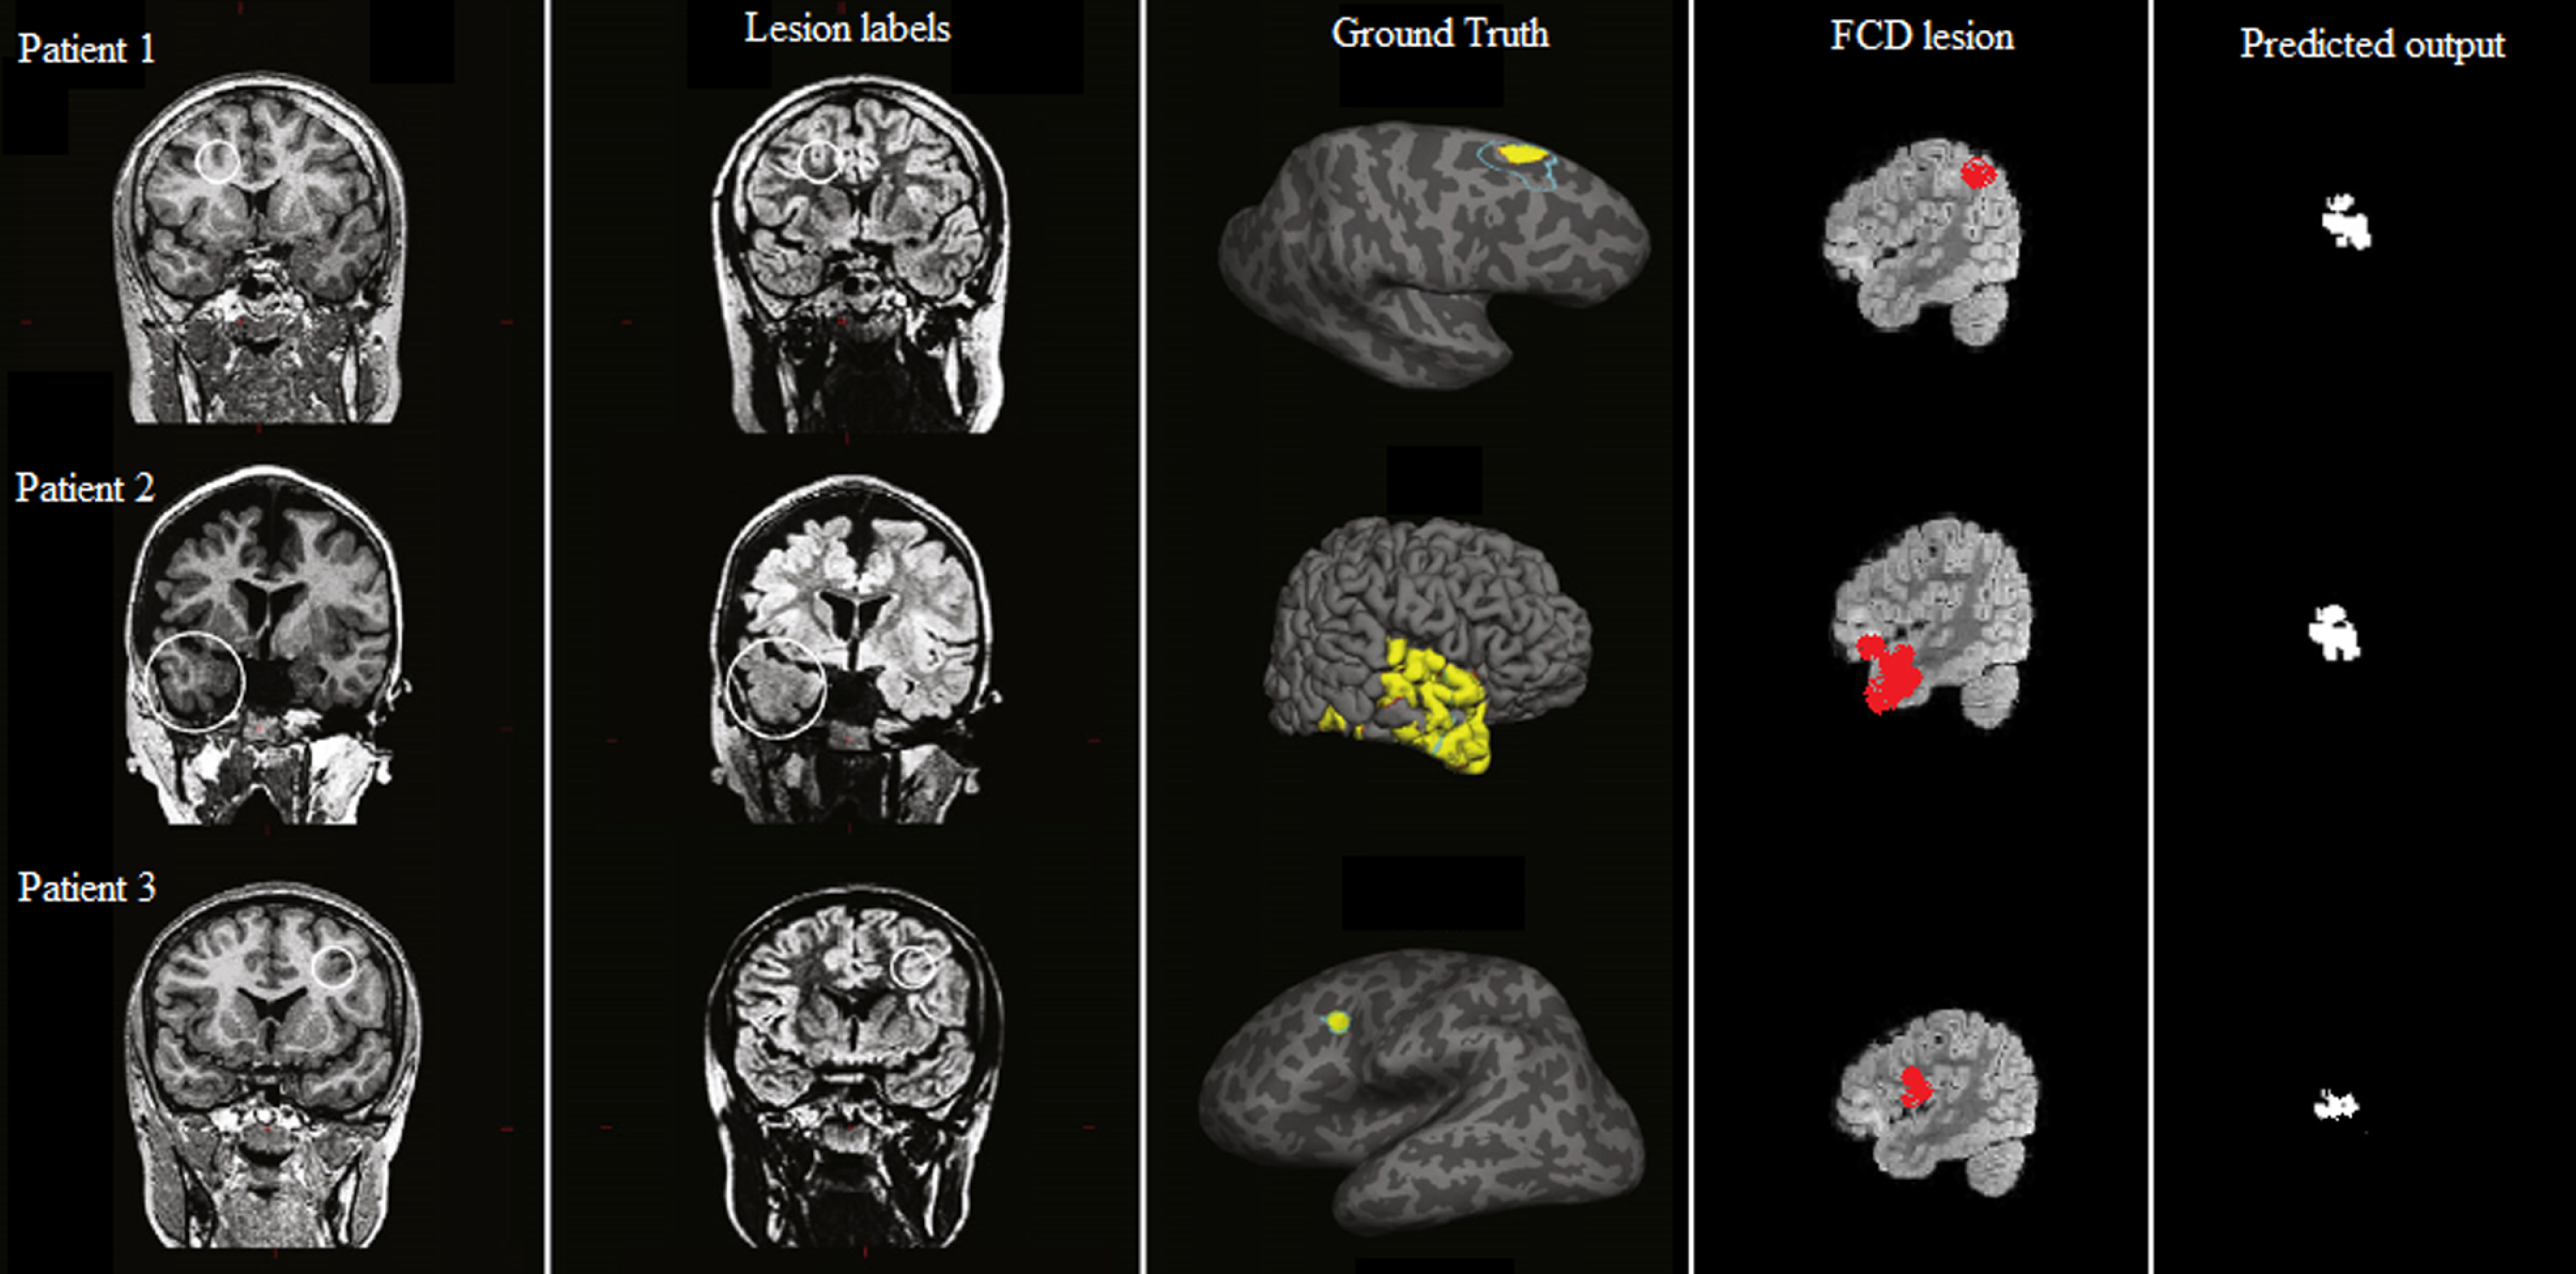
Classification result of T1-MPRAGE and T2FLAIR MRI indicating the FCD lesion using RNN-LSTM with the ground truth value.
The estimation of this experiment result is done based on accuracy, sensitivity, and specificity. The evaluation of the parameters is given below.
Accuracy
Accuracy is the ratio of perfectly classified illustrations of true and false positives and negatives. It is used to extract the peculiar pixel present in the image. It is also used to evaluate the performance of the segmentation of an image. The calculation of TP, FP, TN, FN provides the accuracy of the experiment.
Sensitivity is the accurate measure of disease existing in the patient. It is used to sense the positive result accurately. The true positives in the patients were identified by the grouping of sample images. The experiment with highly sensitive results helps in analyzing the accurate existence of malady.
Specificity is used in identifying the absence of disease in the patient. It specifies the healthy cases and non-existence of disease in the patient. Specificity extracts the negative results in the experiment undertaken. It identifies the true-negatives present in the image and specifies the negative results.
Where TP-true positive, TN-true negative, FP- false positive, FN-false negative.
In this analysis, the statistical features in RNN classification and segmentation results are compared with the existing classifiers namely artificial neural network, support vector machine, and convolution neural network. We have compared the statistical features such as mean, median, variance, skewness, kurtosis, contrast, homogeneity, and entropy of the proposed method RNN-LSTM with the different existing classifiers such as ANN, SVM, and CNN. The A comparison chart is given by, Table 1 and Fig. 8 represent the comparative analysis of statistical features with sensitivity, specificity, and accuracy of classifiers such as SVM, CNN, and RNN-LSTM. In our proposed method the average value of overall statistical features is 93%, the overall statistical feature average values of the existing classifiers such as SVM is 78%, the average value of CNN is 87%. By comparing our proposed method with the existing system, the average value of the statistical feature is improved by 0.36% from the existing method.
Statistical feature comparative analysis of the existing system and RNN-LSTM
Statistical feature comparative analysis of the existing system and RNN-LSTM

A comparative analysis of statistical features.
Important indicators include cortical thickness and blurring of the GWM demarcation, which indicate the presence of dysmorphic neurons and balloon cells in the cortex and GWM junction, ectopic neurons, or axonal loss in white matter. We found minor pseudo thickening (i.e., a slight subcortical signal increase comparable to that of the cortex) in a few individuals, in contrast to the significant thickening described in previous studies. The percentage of error rate for detecting the existence of
FCD based on different surface properties is shown in Table 2.
Comparison of surface features error rate percentage with existing baseline technique and RNN-LSTM
Table 3 shows the comparative analysis of various regularization techniques with RNN-LSTM. The classification accuracy of the regularization techniques is calculated with different regularization models. The dropout model used in this technique is simple and performs effectively in hidden nodes and produced a better result in the classification of S2 features. But, other regularization techniques can also be used for the regularization process.
Comparing the classification accuracy of different regularization performance in proposed RNN-LSTM method
Figure 9 shows the graphical representation of false-positive classification accuracy of RNN-LSTM with existing techniques. From the graph, it is obvious that the proposed RNN-LSTM has 96.24% accuracy with 25% better efficiency in the classification of false positives in FCD MRI images.

Comparison of false classification accuracy of RNN-LSTM with the existing deep learning method.
This paper proposes the classification and segmentation of MRI images using a recurrent neural network classifier with a long-term short memory. It can be trained in all possible ways to detect and classify the FCD lesion with less error rate. The morphological analysis of the FCD-affected patient is done using our proposed system. S2 features were used for the extraction of negative lesions and highlight the affected region in the brain. Image patterns were easily identified for the accessible detection of the malady present. The accurate detection of the FCD is done using the comparative analysis of accuracy, specificity, and sensitivity. This proposed work obtains an accuracy of 92.3%, a sensitivity of 91.8%, and a specificity of 92.2% related to that of ANN, SVM, and CNN. The thickness, intensity, and outline structure of the image were efficiently detected with better results.
Footnotes
Acknowledgments
The author with a deep sense of gratitude would thank the supervisor for his guidance and constant support rendered during this research.
Funding statement
The authors received no specific funding for this study.
Conflicts of interest
The authors declare that they have no conflicts of interest to report regarding the present study.