
Abstract
Although smart grids are characterized by self-healing, economy, high efficiency, and security, many hidden dangers exist in the development of smart grids due to a gradually expanding power grid and the continuous access of new energy to the power grid. Therefore, the development of smart grids, especially their reliability, security, and vulnerability, warrants further investigation. In this study, the vulnerability of smart grids is identified, and the vulnerability elements of smart grids are selected. Based on relevant theories, such as credibility and the combination of the credibility-based moment-generating function and the distortion function, a calculation model and framework of the vulnerability index of a smart grid are constructed. An empirical analysis is also conducted. This study provides a scientific basis for analyzing the vulnerability of smart grids and suggesting reasonable preventive measures and auxiliary decision-making information for relevant planning, design, and operation personnel, which contributes to the sustainable and healthy development of smart grids.
Introduction
With the gradual substitution of renewable energy source for fossil energy, a new era of energy consumption systems is being established. At the same time, the uncertainties of RES bring great challenges to the safe and stable operation of power grid [1]. Smart grid can realize the transmission of energy and information, which is regarded as an important way to consume RES [2]. The key to building smart grid is to realize the conversion of energy resources from exploration and development to the final realization of electricity via an informatized, intelligent, and digitized information platform network system [3]. With the help of these intelligent equipment, the goal of accuracy, complementarity, and mutual assistance will be achieved in energy supply. Compared with traditional power grids, smart grids not only have greater advantages in terms of security, reliability, and economy but also have incomparable advantages in environmental protection and friendly access [4]. The security and efficiency of energy supply and consumption can be substantially improved; environmental pollution, including greenhouse gas emissions, can be reduced; and environmental losses caused by energy development and utilization can be decreased, and greenhouse gas emissions can be reduced, which are the triple benefits of the economy, environment, and users. These characteristics have increased the global popularity of the research and development of smart grids.
Electricity has an indispensable role in people’s daily lives, and as a crucial link to ensure reliable power supply, power grid security has received an increasing amount of attention [5]. In recent years, large-scale blackouts have adversely affected the healthy development of the national economy. In particular, immediate power outage occurred in 6.68 million households (of a total of 8 million households) in Taiwan on August 15, 2017, and the large-scale outage of power grid in southern Texas in the United States on February 20, 2021 have attracted extensive attention from the international community. Therefore, researchers around the world have conducted in-depth studies of the vulnerability of power grids [6]. Power grid vulnerability is mainly manifested by the change in the operational state of a power grid, triggered by some factors, from a safe and stable state to a fault state. In particular, the anti-interference ability of a power grid and the preliminary assessment of the power grid vulnerability have an important role in preventing blackouts.
Based on the development of smart grids and guided by the basic theory of vulnerability research, this paper proposes a vulnerability index evaluation model of smart grids based on the credibility moment-generating function and distortion function that focuses on the security and reliability of smart grid operation. The objectives of this study are to perform a system identification and evaluation study of the vulnerability sources of a smart grid, quantitatively evaluate the vulnerability state of a smart grid, and propose countermeasures for monitoring the vulnerability sources of a smart grid based on the evaluation results. This research provides theoretical and practical guidance for smart grid security management to help avoid and resolve the vulnerability risk of smart grids and ensure their safe and reliable operation.
Literature review
According to the statistical analysis, failure of the power grid is often attributed to the failure of some of the components during operation, which eventually causes the failure of the entire power grid and substantially affects social and economic development. In recent years, researchers around the world have conducted studies of the vulnerability of power grids, which provide a theoretical basis for ensuring the safe operation of smart grids.
Among them, many scholars paid attention to the impact of the potential cyber attacks on the power grid vulnerability. Such as [7], studied the vulnerability of key operation modules in smart grid when receiving network attacks, and proposed a new convex framework based on semidefinite programming [8]. Analyzed the vulnerability of the cyber-physical power system under community attack, and evaluated the impact of different attacks and different networks on the cascading failure process [9]. Defined the optimal k-link attack problem and studied the attack vulnerability of power grid under cascaded faults, so as to provide clues for understanding the vulnerability of power grid and ensuring the security of power grid [10]. Modeled the smart grid as an interdependent complex network, and studied the relationship between the vulnerability of the smart grid and key nodes under load redistribution attack.
In addition to the above studies, some scholars have researched the evaluation methods of power grid vulnerability. Based on the perspective of complex network [11], introduced the network capability and vulnerability index to analyze the key nodes and the vulnerability of power grid under cascading faults [12]. Measured the impact of line trip on system vulnerability in smart grid, by conducting power flow index and vulnerability index [13]. Divided a power grid system into three subsystems, namely, power generation, transmission, and distribution, based on the production process and separately evaluated their vulnerability [14]. Constructed a vulnerability assessment system for power grids damaged by geological disasters and used the analytic hierarchy process (AHP) method combined with the entropy method to comprehensively assess the vulnerability of regional power grids in geological disasters. Based on the analysis of the actual situation of smart grids in China [15], employed the entropy method to assign weights to the evaluation indices and combined it with the relevant gray relational analysis method to construct a comprehensive assessment model of smart grids [16]. Established the vulnerability evaluation index system of urban power grid by using analytic hierarchy process (AHP) from four aspects: power supply composition, power grid structure, power grid operation and important transmission channels. And constructed an artificial neural network model and dimensionless scoring standard to evaluate the vulnerability of urban power grid [17]. Quantified the different effects of the random fluctuation of power demand, the inaccuracy of power grid parameters and the uncertainty of vulnerability model selection, and then proposed a power grid vulnerability assessment framework considering uncertainty.
After evaluating the vulnerability of power grid, some scholars put forward methods to improve the vulnerability of power grid. For example, in order to solve the vulnerability of power grid under external attacks, based on the defender-attacker-defender model [18], proposed an accurate algorithm which integrates the column and constraint generation algorithm to improve the resilience of power grid [19]. Proposed an alternative method of symmetrical super lift multilevel inverter DC/AC technology, and introduced the firefly algorithm to improve the interference of photovoltaic output to grid vulnerability [20]. Designed a statcom based on a modular multilevel inverter and adopted ESOGI method to reduce the current distortion caused by photovoltaic uncertainty interference [21]. Proposed the pulse width modulation method to solve the power quality problem in modular multilevel inverter caused by power grid vulnerability.
The above literatures can provide some reference for the research of this paper, but they did not comprehensively sort out the power grid vulnerability sources, and ignored the impact of the grid structure, environment condition, RES output uncertainties and other factors on the power grid vulnerability in the case of a large proportion of RES access. Based on the analysis of power grid vulnerability sources, this paper constructs a smart grid vulnerability index system, and applies moment-generating function and distortion function, so as to provide new theoretical and methodological support for the smart grid vulnerability assessment.
Construction of a smart grid vulnerability index system
Identification of the vulnerability sources of smart grids
Vulnerable sources refer to a variety of factors that may introduce accident risk to the system, which may be derived from the technical level or natural disasters. Based on summarizing relevant literature on the analysis of many typical large-scale smart grid power outage events and their causes in recent years, the potential vulnerability sources that affect the vulnerability of smart grids are presented as follows: Structural vulnerability: According to the characteristics of a power grid, the structural vulnerability of a power grid can be considered from the perspectives of the power supply structure and power grid operation structure. Based on a previous analysis of multiple grid faults, the reason for these faults is that the structure of the power grid is unjustifiable. An unjustifiable power grid structure may be attributed to the unjustifiable power supply structure or the unjustifiable layout structure of the power grid. If the distance between the power source location and the power load center is large, the unjustifiable power grid layout structure or the unjustifiable power supply structure may prevent the dispatching from being able to maintain the load changes in a timely manner, and the power grid is likely faulty, which leads to the occurrence of fault events. Equipment vulnerability: Smart grid equipment includes primary and secondary equipment. When the equipment is connected to a power grid, if it is not properly operated or if the technology of the equipment cannot satisfy the power grid connection requirements, equipment failure will occur. The power grid equipment needs to be regularly maintained and overhauled. In this process, if the maintenance is improper or the overhaul is not complete, the failure point will not be completely eliminated, which will also cause equipment failure. Technical factors: The construction and development of smart grids require high technical support. When the technology cannot adapt to the developmental needs of smart grids, failure of smart grids will occur. Although the technology has already been able to match the developmental needs of a power grid, the notion that the equipment needed to realize the technology contributes to the technology will also pose a threat to the operation and construction of a power grid. Because smart grids are inseparable from computer information technology, once a network is attacked, the data and information within a smart grid system will be damaged, which causes serious consequences to the security and stability of a power grid. Environmental vulnerability: Environmental vulnerability is mainly manifested in the impact of smart grid vulnerability caused by renewable energy access. Due to the unstable nature of some renewable energy sources, they are also affected when accessible to a power system. For example, wind power is affected by the magnitude of wind speed and is therefore unstable. Therefore, when renewable energy is accessible to the smart grid, the sensitivity of the grid to the environment becomes stronger. Once the environmental factors become unstable, adverse effects on the security and stability of the power grid will occur. Other factors: In addition to the previously mentioned factors that are directly related to smart grids, some indirect factors, such as management factors and policy factors, exist. Irrational management systems, managers’ mistakes in decision-making, insensitivity to the direction of national policies, and market environment changes will affect the operation of smart grids.
Framework of the indicator system
With the guidance of the selection principles of the smart grid vulnerability evaluation indicator system, the assessment of smart grid vulnerability should start from the perspectives of structure, function, equipment, technology, and environment. Therefore, an evaluation indicator system of smart grid vulnerability is constructed for this smart grid project in this study, as shown in Table 1.
Selection of evaluation indicators
Selection of evaluation indicators
Distortion function-based index calculation method
For smart grids, events such as crash and collapse are rare but once these low-probability events occur, they will have a significant impact on a power grid. More attention should be paid to these extreme events with small probability and high risk. The essence is to emphasize extreme events with high risk and low probability. By giving high weights to events with high risk, smart grid managers can have a clearer understanding of power grid vulnerability.
In the financial sector, with increased globalization of financial markets and the integration of credit markets, the tail risk of extreme events with small probability and large value also attracts people’s attention. In this section, we apply the functional risk measurement method in the financial sector to calculate the vulnerability index of the power grid based on the distortion function. The distortion function is described as follows:
Assume that X is a nonnegative loss random variable with a distribution function of F (x) = P (X ⩽ x), and define its survival function as S (x) = 1 - F (x). Its measure is [22]:
Or
The vulnerability index used in this study corresponds to the discrete risk X. We preset five levels of the vulnerability index—slightly vulnerable, mildly vulnerable, moderately vulnerable, strongly vulnerable, and extremely vulnerable—for which we present x = 10, 30, 50, 70, 90, respectively. The discrete probability distribution P (x = x k ) = P k satisfies the conditions of Definition 3. Therefore, the distortion function is appropriate to calculate the final vulnerability index.
In the calculation and analysis of the smart grid vulnerability index, we need to determine the weight of each indicator. The subjective-objective weighting method is mainly used to determine the weight of each indicator. Subjective distortion fully utilizes the knowledge and experience of experts to score indicator weights, and based on the scoring results, an objective analysis method is used to determine the weight of each index. However, when experts make judgments, they need to have a certain scoring rule. Here, the index scale method, that is, the different importance of pairwise indicators is represented by different numbers.
When calculating the vulnerability index of a smart grid, due to the complexity of the smart grid itself and the indicator system, assessing the importance of the pairwise indicators based on the scale method shown in Table 1, which causes a relatively large error, is unrealistic. When scaling, the degree of fuzziness is determined using triangular fuzzy numbers combined with the AHP, and then the reliability is calculated. Based on the obtained credibility, obtain the final expected value of the index. All experts are assumed to score the pairwise indicators to determine a set of fuzzy judgment matrices. However, expert scoring would also be influenced by subjective preference. To minimize the influence and bias caused by subjective factors, the following formula can be used to calculate the comprehensive score:
Judgment matrix: the element in A = (a
ij
) n×m is expressed as aij= [l
ij
, m
ij
, u
ij
]:
The weighting coefficients of the matrix can be determined using a variety of methods. In this study, the “inverse of column sum” method is applied. Denoting
Thus, the weighting of a single hierarchical sequence
Considering the complexity of a smart grid vulnerability assessment, the evaluation indicator is the primary factor in an evaluation. Considering whether the evaluation values of different indicators are balanced, the degree of balance can further supplement and interpret the evaluation results. To more reasonably interpret the values of evaluation indicators, this study introduces the quasi-Gini coefficient in mathematical economy, and on this basis, the AHP is complemented and refined to obtain a credibility-based improved AHP, which is expressed by formula (7) [23]:
Consistency indicator CI is calculated as The random consistency ratio is calculated as CR = CI/RI where RI is a random consistency indicator, which is listed in Table 2.
Random consistency indicator
When CR < 0.1, this judgment matrix is considered to have a high level of satisfaction and is acceptable. Although this matrix has high consistency, it needs to be normalized to make the processed result more reasonable, that is:
Therefore, the single ordering
The total ordering consistency ratio:
If the CR cannot pass the consistency test, then the judgment matrix needs to be adjusted until the adjusted matrix can pass the consistency test before the next step calculation can be performed.
After obtaining the weight for each indicator, normalization can be performed. Each indicator is treated as the discrete distribution of the vulnerability, and the vulnerability index is obtained using formula (2).
The annual sunshine time in a certain place in Northwest China exceeds 3360 hours, and the solar radiation reaches 6400 MJ/m2, which is rich in wind resources and superior wind farm conditions. In order to absorb the renewable energy in this area, China has invested in the demonstration project of smart grid. In this paper, an IEEE 14 buses system in the project is selected as an example, which includes 5 power buses, 3 transformers and 20 branches. A large number of the access to wind resources and the applications of new technologies improve the complexity of power grid structure and increase the difficulty of power control in the smart grid project. And the area is located in the non-load center, and the power load fluctuates greatly, resulting in insufficient support capacity of reactive power and voltage. At the same time, in the process of power transmission, the increasing capacity leads to the increasing scale of transmission channel. If there is a fault, it is easy to cause the line to be blocked. In addition, the climatic conditions in Northwest China are relatively poor due to many sandstorms in spring and fall and low temperature with frost and heavy snow in winter, which have certain impacts on the operation and maintenance of the equipment and transmission lines. Due to a continuous increase in the installed capacity of wind power, “wind curtailment” has always been an issue that plagued the project.
Selection and determination of evaluation indicators
The weights of the secondary and primary indicators are obtained using the credibility-based moment-generating function method described in this study, as shown in Table 3. Similarly, the weights of the tertiary indicators calculated by the above method are correspondingly multiplied by the weights of the second secondary indicators to obtain the final weights of the tertiary indicators.
Final weights of the indicators
Final weights of the indicators
To more clearly and intuitively calculate and analyze the power grid vulnerability index of smart grids, this study divides the state of the grid vulnerability index evaluation into five levels, namely vulnerable, slightly vulnerable, mildly vulnerable, moderately vulnerable, strongly vulnerable, and extremely vulnerable, and the corresponding scores are set to 10 points, 30 points, 50 points, 70 points, and 90 points, respectively. By referring to the laws and regulations formulated by the state, the rules and standards within the industry, and historical data and expert opinions, the occurrence probabilities of different levels are summarized in Table 4.
The occurrence probabilities of different levels
The occurrence probabilities of different levels
When calculating the comprehensive evaluation vector of each primary indicator X i , the analogue of the primary indicator evaluation vector is made to the discrete risk mentioned in formula (3). For the primary indicator A1, its secondary indicators X11, X12, X13, X14 are its probability distribution, x1i ⩾ 0. The sum of its secondary indicators is normalized to ensure that X11 + X12 + X13 + X14 = 1, i.e., (0.053, 0.057, 0.052, 0.046) is transformed to (0.25, 0.27.0.25, 0.23).
Each row in the previous data table is equivalent to the value of its vulnerability. Considering the secondary indicator of the structural vulnerability of the power source as an example, its weight ρ11 = 0.044, and its indicator probability distribution is:
Substitute this distribution into formula 3 and the use of X11 to represent the vulnerability of the power structure calculated by distortion function:
Similarly, the expectations after distortion of all secondary indicators can be calculated. Then, the expectations after distortion of each primary indicator can be obtained by multiplying it with the normalized secondary indicators weight. The results are shown in Table 5.
The Expectations after distortion of the secondary indicator
According to the expectations after distortion of the primary indicators, the final vulnerability index can be calculated as:
The calculation results show that this power grid is mildly vulnerable, and the power grid users can be provided with a reliable power supply. The power grid can withstand most disturbances without power outage.
Analysis of calculation results
By analyzing the previous example and based on the criterion for assessing the vulnerability index level, the vulnerability index of the power grid is between “mildly vulnerable” and “moderately vulnerable” and skewed to being mildly vulnerable. However, a certain risk remains. Based on the specific index of each primary indicator, the foremost factor that causes the vulnerability of this power grid is structural vulnerability, followed by functional vulnerability and equipment vulnerability, while the vulnerabilities of the technology application level and natural environment impact have the lowest degree. Based on the calculation results and the constructed evaluation indicator system, the vulnerability state of the power grid is analyzed from five aspects: In terms of the structural vulnerability, this power grid project is accessed with wind power, which is a renewable energy that has a substantial influence on the power grid structure due to the instability of wind power. Unstable operation of the power grid is possible, and the ability to control the power grid is weakened. When the main power transmission channels are blocked, the networking effect in local areas decreases, which further increases the structural vulnerability of the power grid system. In terms of the functional vulnerability, the load loss rate is higher, and the loss of the power supply capacity of this power grid after being attacked is more severe. The power generation and transmission equipment in the state of continuous operation with high load increases, which causes insufficient power transmission efficiency and bus voltage drop to an excessively low level after the system has an accident, which causes a shortage of reactivedevices in the low-voltage network and reduces the quality and reliability of the power supply. In terms of the equipment vulnerability, because this area is located in Western China, the climate is arid, and the temperature is low in winter. The area is prone to severe weather, such as heavy snow, strong wind, and wind-blown sand. Affected by these environmental factors, power grid equipment and power transmission lines will be affected to some extent. One of the important impacts is the damage to equipment and aging of transmission lines, which causes losses to the power grid and power transmission. This area is not a centralized power load center, and the generated electricity needs to be transmitted to the power load center through transmission lines. Damaged equipment and gradually aging lines have the potential to adversely affect the power grid in operation, which causes severe power grid failures and even large-scale power outages. In terms of the technology application level, the technologies that support the secure and stable operation of this power grid are relatively mature, and the power absorption capacity is excellent. Note that large-scale access to intermitted renewable energy sources renders this power grid increasingly complex. Therefore, security monitoring should be strengthened to efficiently identify and address possible accidents and hidden dangers in the operation of a power grid. In terms of the natural environment impact, this power grid project is located in Northwest China, which has an arid climate and relatively low temperature in winter and is prone to severe weather such as heavy snow, strong wind, and wind-blown sand. The inherent instability of wind power as an unstable natural resource is an important aspect of the impact of the natural environment on the vulnerability of a smart grid.
Case comparative analysis
In order to verify the effectiveness of the method proposed in this paper, two additional cases with the same data in this paper are designed for comparative analysis.
Case 1: implementing the credibility-based improved AHP, moment-generating function and distortion function proposed in this paper (the results have been shown in Section 4);
Case 2: replacing the proposed credibility-based improved AHP, and implementing AHP method in Ref. [24] to calculate the indicators weights;
Case 3: replacing the moment-generating function and distortion function proposed in this paper, and implementing the fuzzy Delphi method in Ref. [25] to identify the final evaluation indicators.
The methods in Case 2 and Case 3 are used to evaluate the vulnerability of the smart grid project in Section 4. Correspondingly, the vulnerability indexes of five primary indicators can be obtained, which are shown in Fig. 1.
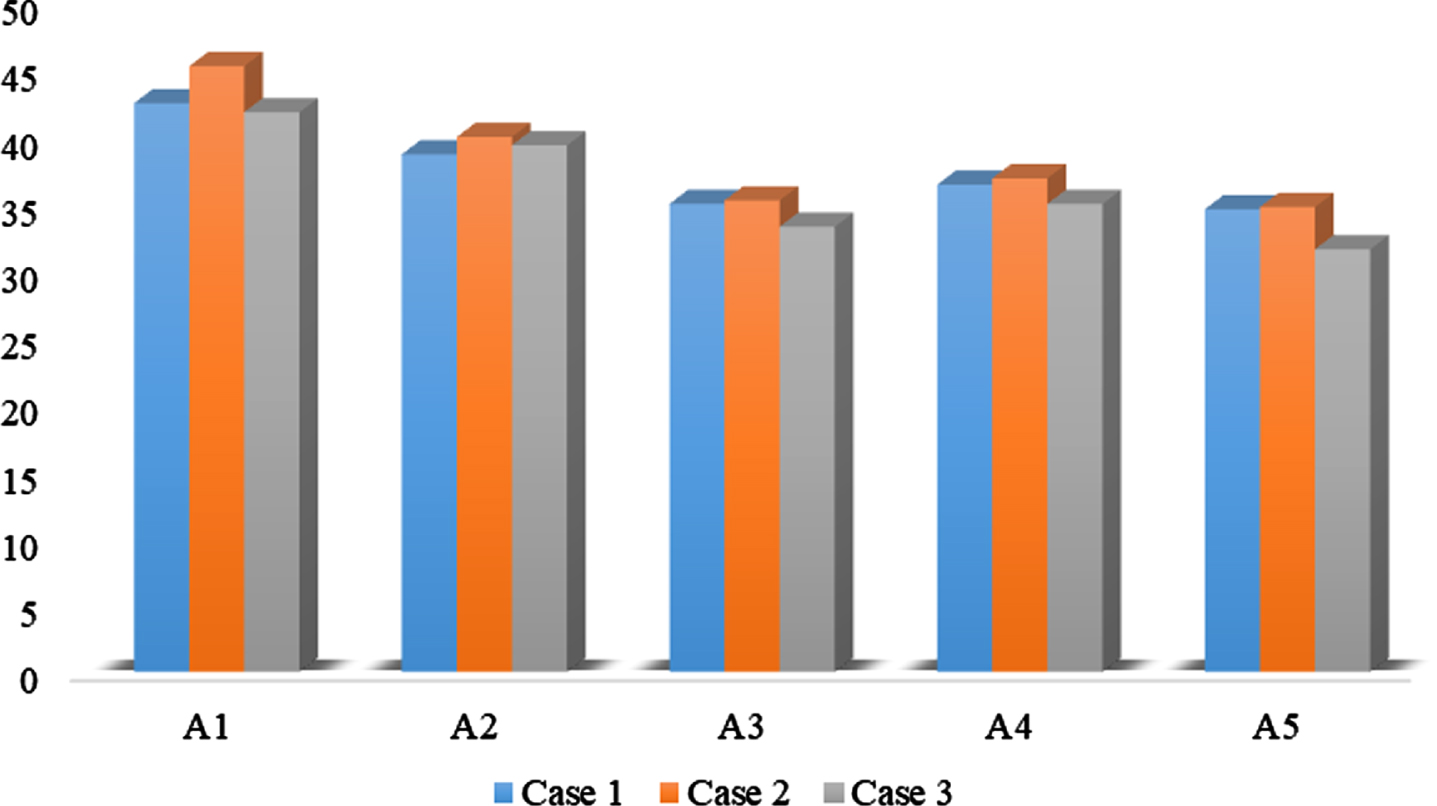
The vulnerability indexes of the primary indicators in different cases.
According to the expectations after distortion of the primary indicators, the corresponding variance and coefficient of variation of primary indicators can be obtained, which are shown in Table 6. And the superiorities of the credibility-based improved AHP, moment-generating function and distortion function proposed in this paper is verified by comparing dispersion of the evaluation results of each case.
The dispersion degree of the vulnerability indexes of the primary indicators
The calculation results show that the vulnerability indexes of the primary indicators in Case 1 have the smallest variance and coefficient of variation, indicating that the dispersion of the evaluation result in this paper is the smallest. In fact, there are a lot of uncertainties and fuzziness in the process of evaluation. The greater the dispersion of evaluation results, the more absolute the judgment that the evaluation object belongs to a certain level, which can not well reflect the objective situation. Therefore, the credibility-based improved AHP, moment-generating function and distortion function proposed in this paper have better applicability.
With the comprehensive construction and wide application of smart grids in various countries, the issue of the vulnerability of power grids has attracted an increasing amount of attention. How to ensure the security and stability of smart grid operation, reduce the incidence rate of smart grid faults, and reduce the possible loss of faults have become an important direction for studying smart grids. Based on the vulnerability of smart grids, this study has proposed strategies to address the vulnerability of smart grids in terms of technology and management.
In this paper, a smart grid vulnerability index calculation model has been established, which also can be used as a reference for the assessment of the vulnerability of other subsystems in a power system. Furthermore, the evaluation method composed of the moment-generating function and distortion function model proposed in this paper can provide a new idea and method for vulnerability assessment, which is useful for evaluating the vulnerability of other similar power grids. The effectiveness of the proposed method is verified by the comparison of numerical examples and different methods.
In addition, it should be pointed out that the research of this paper is mainly used to evaluate the problems in the completed power grid projects, so as to better provide reference for power grid planning and construction in the future. In order to ensure the stable operation of the power grid, we should also pay attention to the use of corresponding technical means to realize the real-time monitoring of the power grid operation process.