
Abstract
Finer-grained local features play a supplementary role in the description of pedestrian global features, and the combination of them has been an essential solution to improve discriminative performances in person re-identification (PReID) tasks. The existing part-based methods mostly extract representational semantic parts according to human visual habits or some prior knowledge and focus on spatial partition strategies but ignore the significant influence of channel information on PReID task. So, we proposed an end-to-end multi-branch network architecture (MCSN) jointing multi-level global fusion features, channel features and spatial features in this paper to better learn more diverse and discriminative pedestrian features. It is worth noting that the effect of multi-level fusion features on the performance of the model is taken into account when extracting global features. In addition, to enhance the stability of model training and the generalization ability of the model, the BNNeck and the joint loss function strategy are applied to all vector representation branches. Extensive comparative evaluations are conducted on three mainstream image-based evaluation protocols, including Market-1501, DukeMTMC-ReID and MSMT17, to validate the advantages of our proposed model, which outperforms previous state-of-the-art in ReID tasks.
Keywords
Introduction
PReID is an important vision task with wide real-world applications such as intelligent video surveillance, smart retailing, etc., aiming at matching person images captured from non-overlapping cameras. However, some problems remain to be solved owing to the challenges of ReID, including changes in camera viewpoints, illumination changes, human pose variation and occlusion. With the rapid development of deep learning based techniques, supervised ReID methods, such as [1, 2], have gained remarkable advances.
In traditional approach of pedestrian representations, it is a common strategy that extract discriminative features from the whole body on images in ReID task, which aims to capture the most salient clues of appearance to represent identities of different pedestrians. However, PReID methods that rely solely on global features of a person are prone to errors in case of occlusion and misalignment. In addition, since global features do not have any local spatial information, key local features are easily to ignore, which limits the improvement of ReID’s accuracy.
To relieve this dilemma, complementing global features with local features and building better person representations has been confirmed to be an effective approach for better ReID accuracy in many previous works. Therefore, part-based models have attracted a lot of attention in PReID research community. Part-based methods for PReID can be divided into three main pathways according to their part locating methods: 1) Methods based on the assistance of external tools, such as human pose estimation models [1, 3]; 2) Methods based on horizontal partitioning or slicing [4, 5]; 3) Methods based on semantic attributes [6, 7]. However, these methods tend to focus only on specific parts with fixed semantics and not cover all the discriminative information. Recently, multiple-branch architectures have been proposed in particular [2, 9] where a shared-net is often followed by multiple sub-network branches, which allow the network to focus on different pedestrian features in individual branches, e.g., on distinct spatial parts or channels. They mostly try to learn global and spatial part features in individual branches or combine part, channel, and global features, either through pooling or attention. However, most multi-branch networks ignore the following points: 1) when extracting global features, only the impact of the final features on PReID result is considered and the intermediate layer features are ignored; 2) the most common in PReID tasks are spatial partition strategies of the persons’ images, and channel partitions are rarely considered. 3) most ReID models are optimized by combining ID loss and triplet loss together. However, the targets of these two losses are inconsistent in the embedding space, which leads to the phenomenon that one loss may be reduced while the other loss is oscillating or even increased.
This motivates the work in this paper, where we propose a novel three-branch architecture for PReID. Specifically, we propose an end-to-end multi-branch network jointing multi-level global fusion features, channel partition features and spatial partition features. It can build robust pedestrian representations for ReID task by complementing global features with local features extracted through partitions. Spatial and channel partition as shown in Fig. 1.

Example of a spatial and channel partition. H, W and C refer to height, width and channel in a deep feature map, respectively. In this example, a whole feature map is partitioned into two channel groups and four spatial parts.
In summary, the contributions of us are threefold:
1) Based on the ResNet-50 baseline, we propose an end-to-end three-branch network for PReID. Its global branch fusions multi-level global features to enhance the richness of global features, its channel branch employs average-pooling layer to extract channel features and its spatial branch employs max-pooling layer to extract spatial features. The proposed architecture is shown to be effective at achieving feature diversity.
2) The BNNeck [10] structure is introduced to solve the problem that the recognition result fluctuates due to the targets of these two losses (ID loss and weighted regularization triplet (WRT) loss is used in this paper) are inconsistent in the embedding space when simultaneously optimize the same feature vector. Experimental results in Fig. 6, Fig. 7 and Fig. 8 show that BNNeck can not only speed up the convergence speed of MSCN, but also improve the recognition performance of it by a large margin.
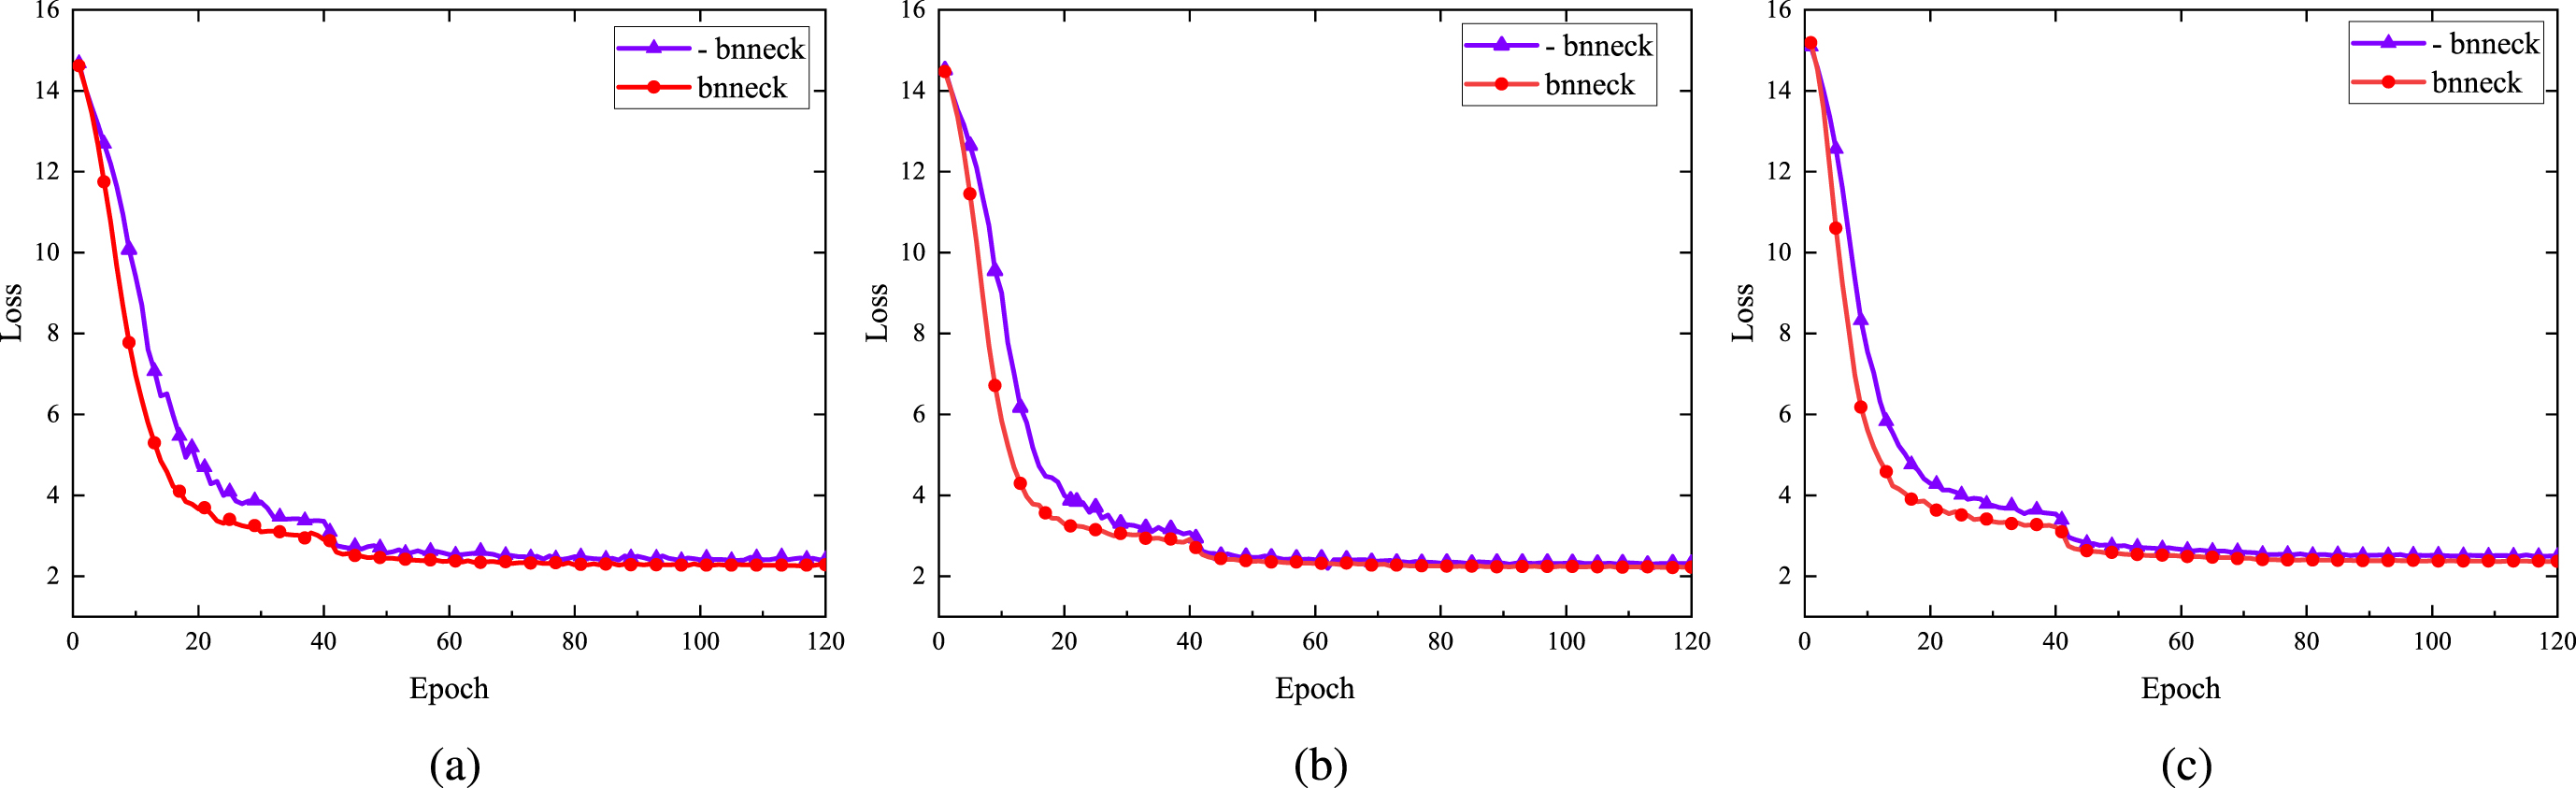
Comparison of the loss function curve before and after the BNNeck is used. Here, (a), (b) and (c) represent experiments are conducted on the Market-1501, DukeMTMC-ReID and MSMT17 datasets, respectively.
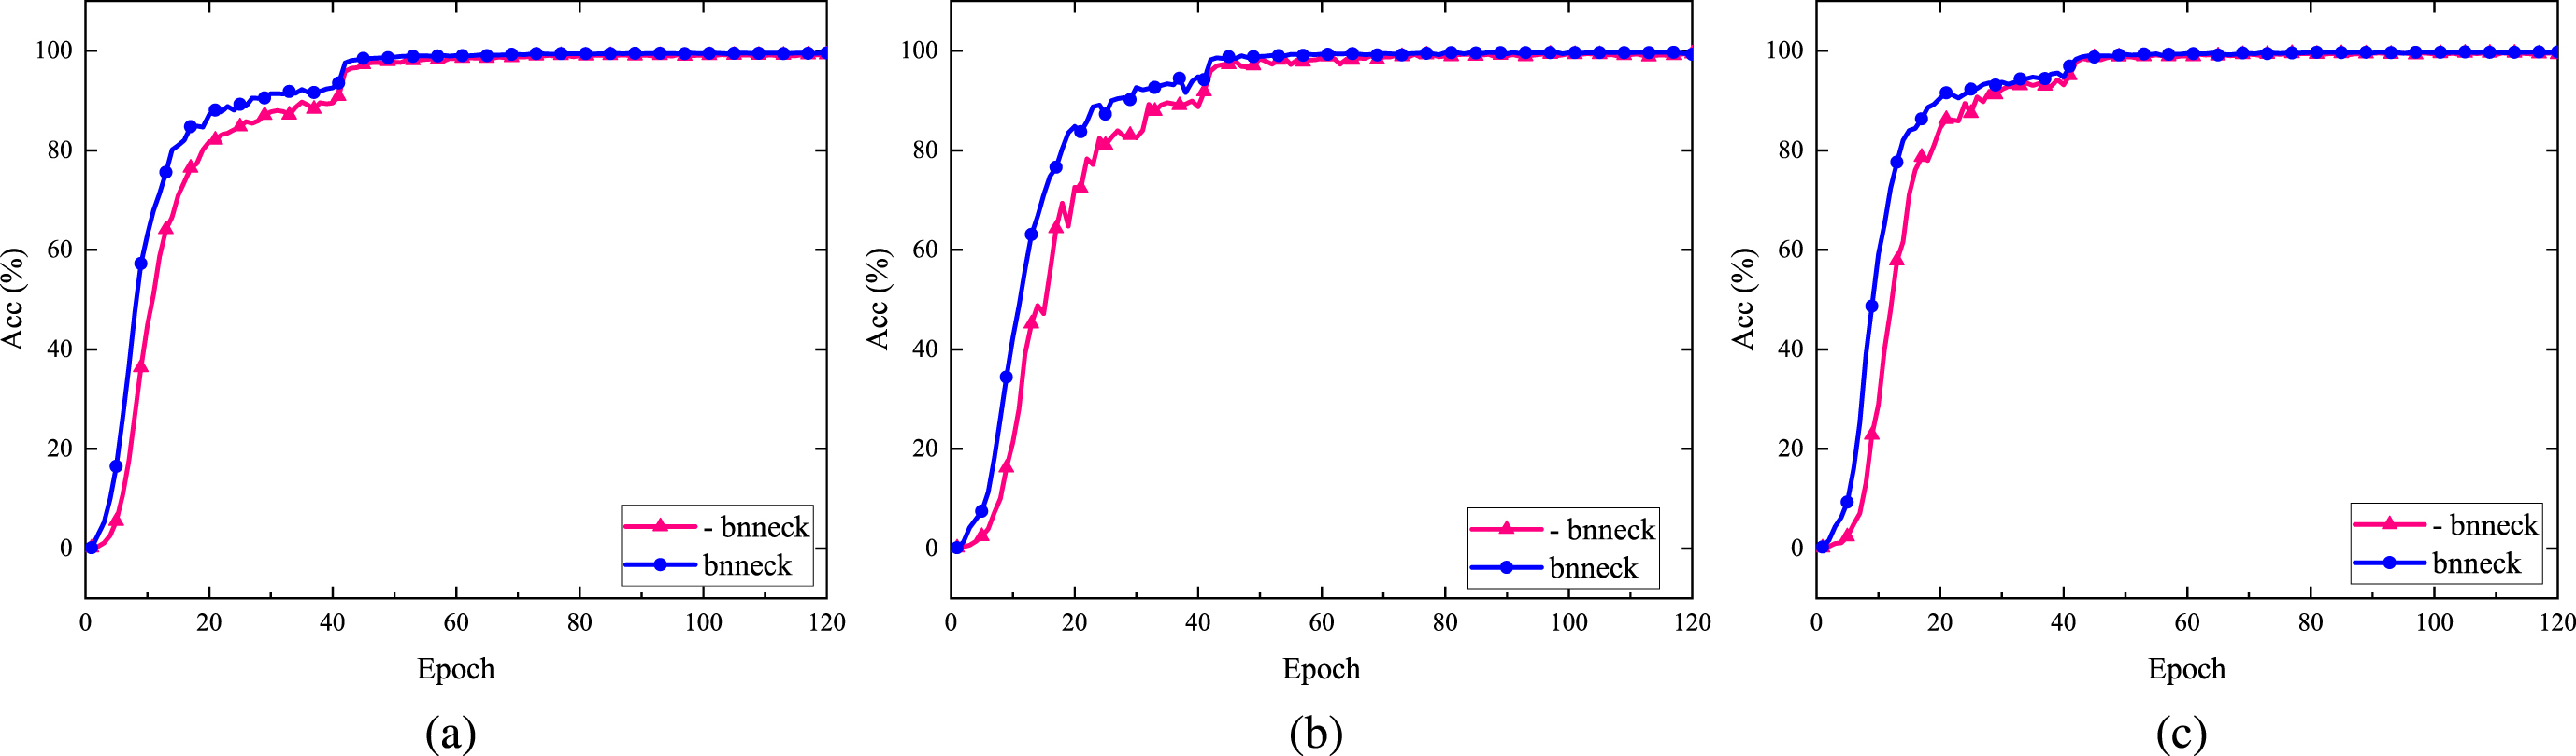
Comparison of the accuracy rate curve before and after the BNNeck is used. Here, (a), (b) and (c) represent experiments are conducted on the Market-1501, DukeMTMC-ReID and MSMT17 datasets, respectively.

Ablation study of BNNeck influences on the Market-1501, DukeMTMC-ReID and MSMT17datasets in terms of rank-1 and mAP. “MCSN (W/O BNNeck)” means BNNeck is removed from our model.
3) Extensive experiments demonstrate the superiority of the proposed MCSN over a wide range of state-of-the-art ReID models on three large benchmarks, Market-1501 [11], DukeMTMC-ReID [12] and MSMT17 [13]. In rigorous ablation studies, we show how three branches improve model performance and why our network performs better than other approaches.
We review three relevant work: 1) multi-branch models for PReID, 2) part-based models, 3) Methods based on multi-loss.
Multi-branch models for PReID
Combining global and part-based features in all feature representation learning strategies is the most effective strategy. Wang et al. [2] proposed a multi-task attentional network with curriculum sampling that includes attention loss, triplet loss and focal loss branches. Wang et al. [8] proposed a multi-branch deep network, which split the last layer of ResNet into three branches and partition feature maps into one, two and three horizontal stripes. In HPM [9], Fu et al. split respectively the entire body feature map into one, two, four and eight identical horizontal stripes, which takes into account both local and global features. In [14], the striped pyramidal block is introduced in a deep architecture at different depths. However, all current methods only consider multiple spatial partitions and neglect the potentially important effects of channel groups.
Part-based models
Finding spatial partitions of the persons’ images is an important research direction. Generally, the input image is divided into several disjoint horizontal space parts to obtain discriminative partition features of pedestrian matching. In previous studies, some methods based on hand-crafted features [15, 16] are used for part-based feature learning. However, these strategies mentioned above are not so robust on large datasets. Recently, part-based deep learning methods have been developed to extracting more discriminative features of pedestrians. Fan et al. [17] proposed a spatial-channel loss to ensure that each channel in the representation pays attention to a dedicated partitioned part of the body. In [18], Sun et al. split respectively the entire body feature map into identical horizontal stripes to extract discriminative features of pedestrians. Some studies have demonstrated the potential of partitioned channel groups as an effective dimension in various visual tasks. For example, MobileNet [19] adopts channel-wise convolutions where the number of groups equals the number of channels. In our proposed model, by simultaneously partitioning channels into two groups and the entire pedestrian body into four identical horizontal stripes spatially for PReID task.
Methods based on Multi-Loss
Loss functions are used as supervisory signals in feature learning. The following two type losses are widely used during the training phase for deep ReID systems: 1) classification loss, e.g., softmax cross-entropy loss, which treats the training process of PReID as an image classification problem [20]; 2) ranking loss, e.g., WRT loss [21], which treats the ReID model training process as a retrieval ranking problem. The classification task and ranking task are complementary to each other. Recently, both classification loss and ranking loss are simultaneously used to optimize the network [8, 22], which is obvious how important it is to PReID tasks. In this paper, we employed the softmax cross-entropy loss and the WRT loss for PReID tasks.
The proposed approach
In this section, the detailed introduction of network architecture is given first in Sec. 3.1, followed by the training and loss functions used in our proposed model in Sec. 3.2. Finally, the differences between our model and other related work are discussed in Sec. 3.3.
Network architecture
The general architecture of our proposed MCSN is represented in Fig. 2. With reference to the most advanced methods [8, 23], we designed an end-to-end neural network architecture based on strong image feature extraction backbones pretrained on ResNet-50 [24]. Based on this backbone, three modifications are conducted: 1) the subsequent part after res_conv2 layer is divided into three independent branches, global (G) branch, channel (P1) and spatial (P2) partition branches, which share the similar architecture of the original ResNet-50 before res_conv2 layer; 2) in the P1 and P2 branch, the down-sampling with stride-2 convolution is replaced by a stride-1 convolution in the res_conv5_1 block; 3) in the G branch, the network structure of multi-level global feature fusion is adopted due to the semantic differences brought by the network output of different layers. Table 1 lists the settings of these branches. Let
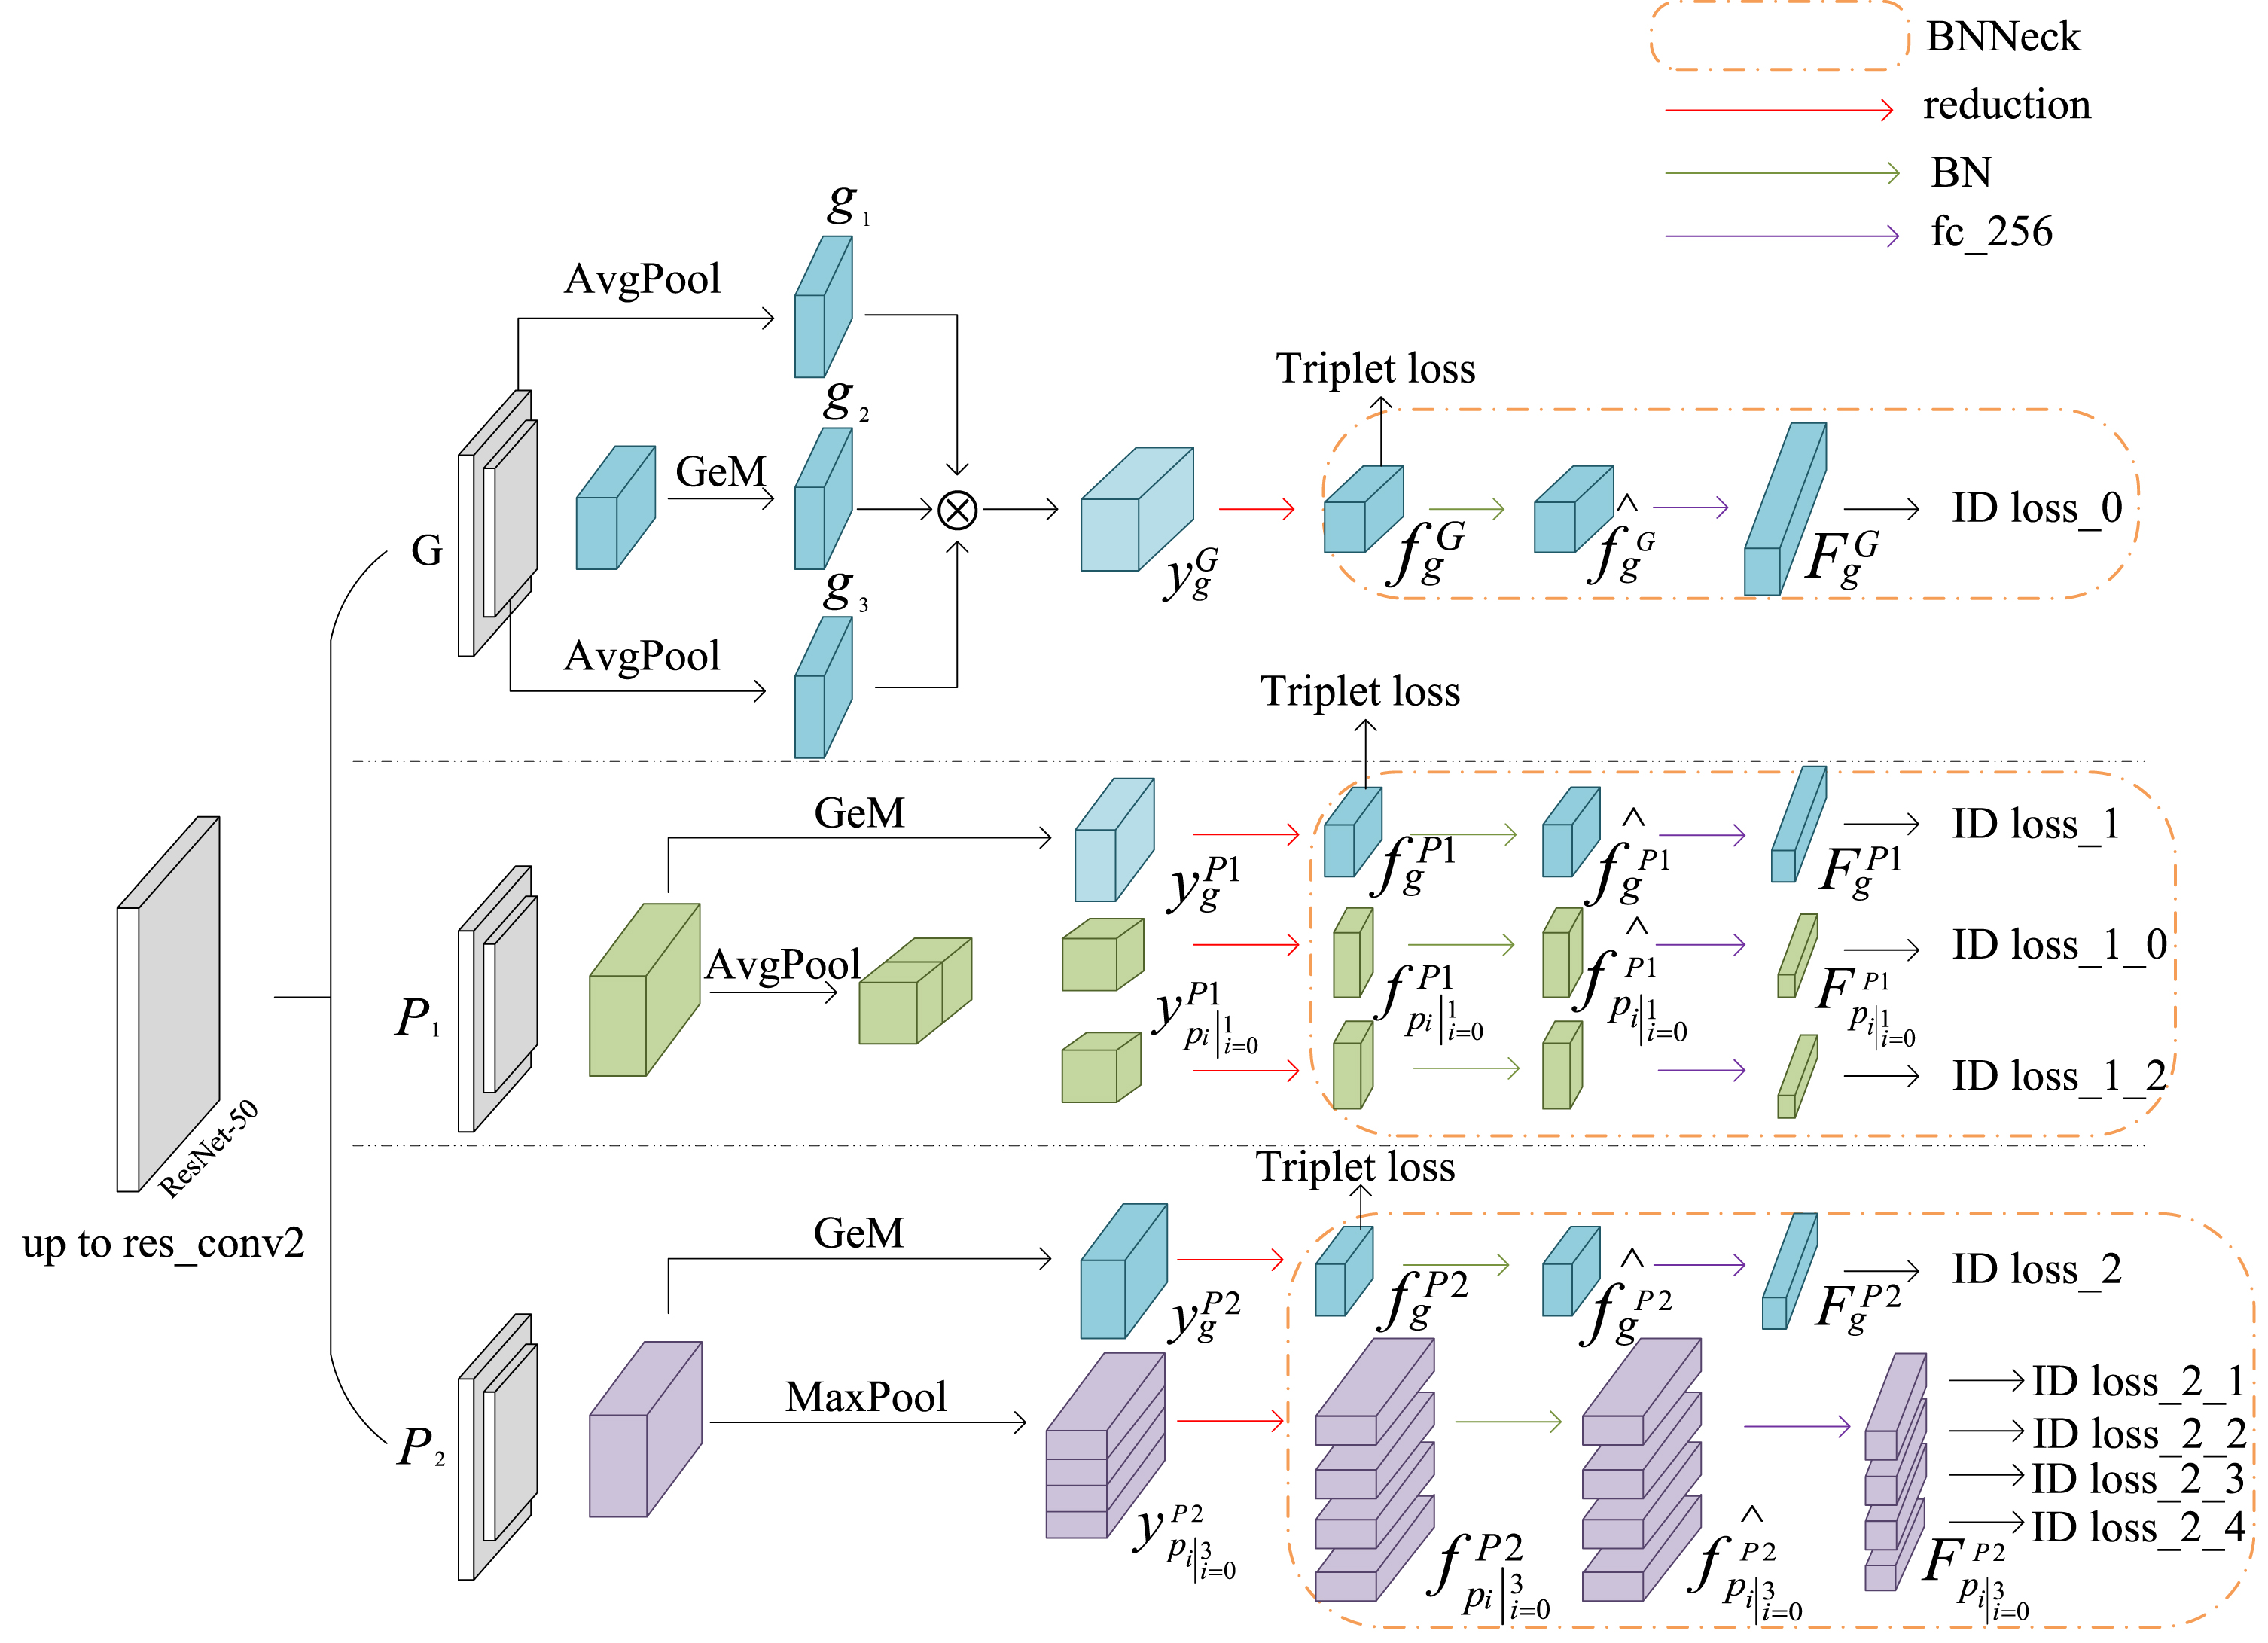
The overall network architecture of MCSN. For the backbone network, the subsequent part after res_conv2 layer is divided into three independent branches, global (G) branch, channel (P1) and spatial (P2) partition branches, sharing the similar architecture with the original ResNet-50. Then, multiple spatial and channel partitions are conducted on the feature maps. After multi-type pooling, dimensions of global branch(dim=2048), channel branch(dim=2048, 1024*2) and spatial branch(dim=2048, 2048*4) features are unified by 1×1 convolution (reduction) and batch normalization (BN) to 256. Then, pedestrian identity predictions of input images are given by fully connected layers (FC). Note that the tensors obtained after the BN layer are concatenated as the final feature to test model performance during testing phases.
Comparison of the settings of three branches in MCSN. Here, the size of input images is 256×128. “Branch” represents the abbreviation for three branches. “Part number” means the number of partitions on each branch. “Map Size” refers to the size of output feature maps after res_conv5 layer from each branch. “Dims” refers to the dimensionality for the output feature representations after BN layer. “Feature” means the symbols for the output feature representations
In the G branch, firstly, the down-sampling with a stride-2 convolution layer is employed in res_conv5_1 block, followed by a generalized-mean (GeM) pooling operation on the corresponding output feature map, we obtain a 2048-dimensional tensor g2. Secondly, we apply adaptive average pooling operation to the tensors of size 512×32×16 and 1024×16×8 to obtain the tensor g1 of size 512×4×1 and g3 of size 1024×2×1. Thirdly, 2048-dimensional multi-level global fusion feature vector
Then, a 1×1 convolution layer with batch normalization and ReLU to reduce 2048-dimensional features
In the P1 branch and P2 branch, the global feature maps
In the P1 branch, Firstly, the initial tensor of size 2048×16×8 is reduced to a 2048-dimensional vector and then partitioned into two vectors of length 1024 each. Then, the 1×1 convolution layer with batch normalization and ReLU is employed to reduce 1024-dimensional features to 256-dimensional vectors
In the P2 branch, inspired by PCB [23], the initial tensor of size 2048×16×8 is transformed into four representations. Specifically, max pooling is used to obtain a tensor of size 2048×4×1 that we split into four 2048-dimensional part-based representations
Then, BNNeck is used in 9 tensors of 256-dimensional to improve model stability in training phases. It is worth noting that the bias of the fully connected layer is turned off. Finally, 3 global feature tensors
Different loss functions have different functions, and the learned representations are also different. To improve the discriminative ability of deep embedding learning, we use the combination of softmax cross-entropy loss and WRT loss in training phases to train the network. The former is employed for classification tasks and the latter is used for metric learning, which are both widely used in various deep ReID methods, and the combination of the two can greatly improve the recognition performance of the network.
Therefore, ID loss can be re-expressed as:
To further boost performance, a warmup strategy [26] is applied to bootstrap the network for better performance rather than traditional step learning rate schedules. Specifically, as shown in Fig. 3, the learning rate first grows linearly from 3.5 × 10⁻⁵ to 3.5 × 10⁻⁴ in the first 10 epochs. Then, the learning rate decayed to 3.5 × 10⁻⁵ and 3.5 × 10⁻⁶ at 40th epoch and 70th epoch respectively. The learning rate lr(t) at epoch t is computed as
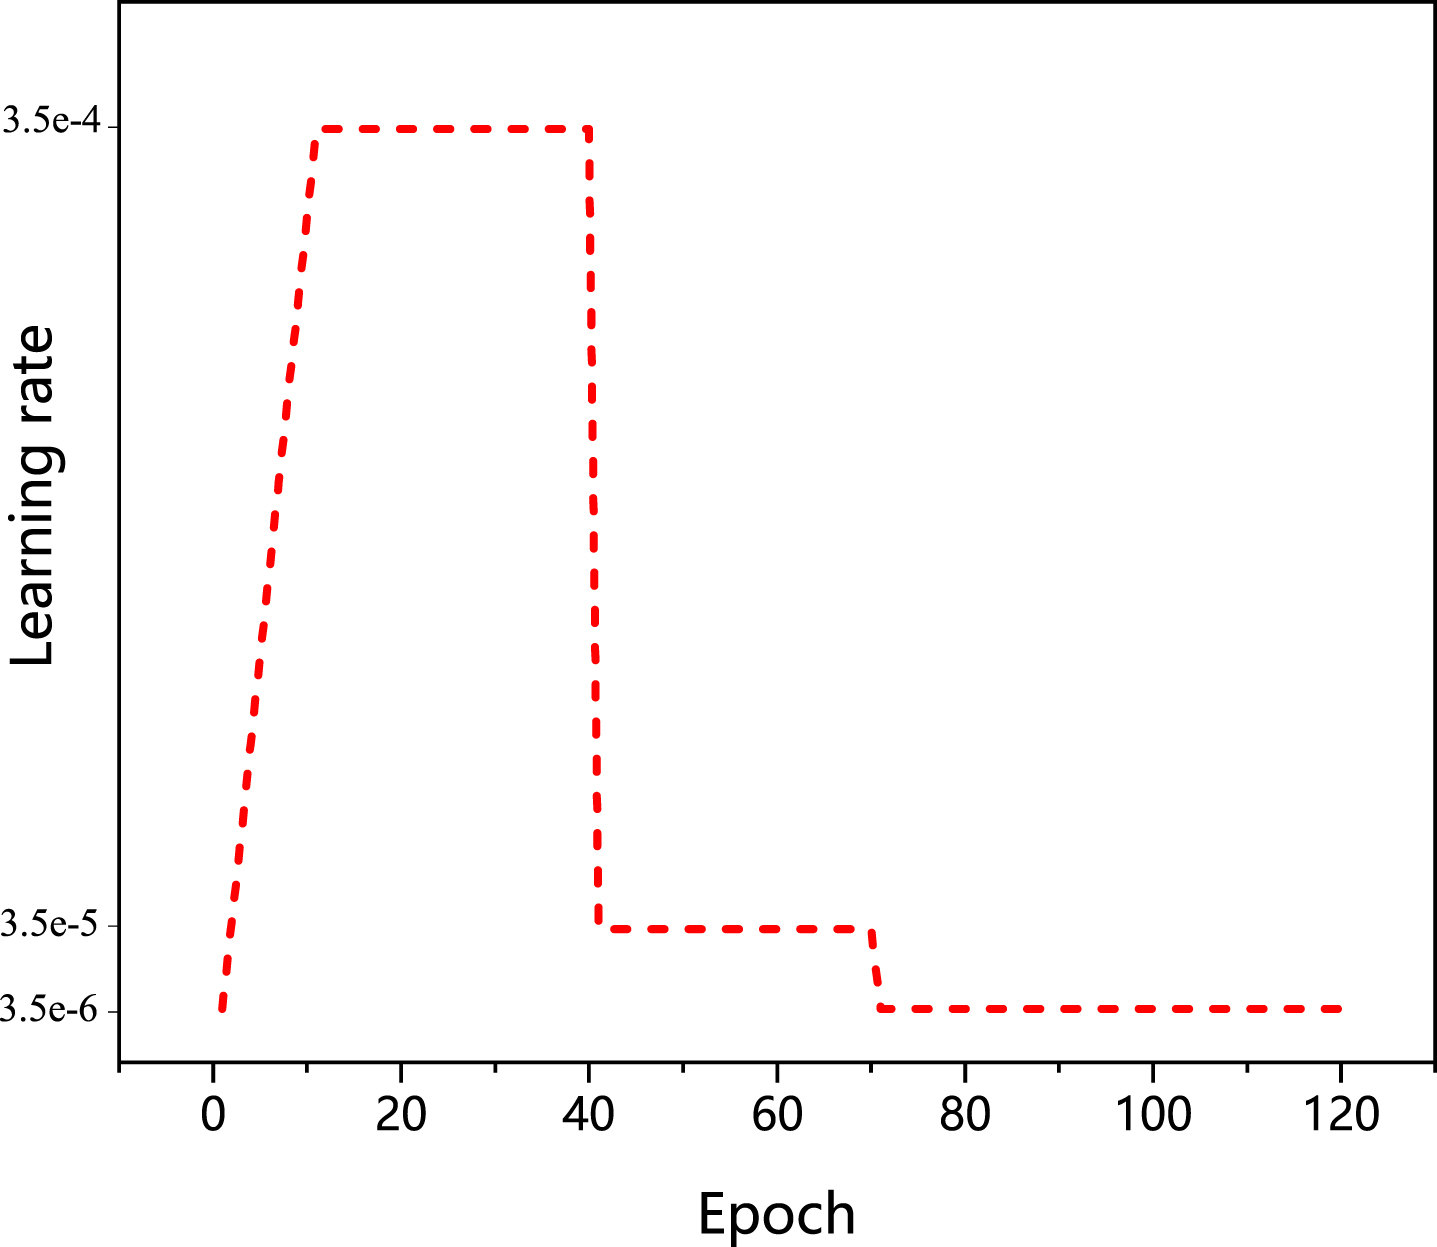
Learning rate schedules with warmup strategy.
In this section, the difference between MCSN and the other two methods based on CNNs are discussed.
The first category is single branch network, such as PCB [23]. Specifically, given an image input, it outputs a convolutional descriptor consisting of several part-level features by a uniform spatial partition strategy, which focuses on spatial discriminative part in feature maps while channel information is neglected. Compared with the spatial part-level feature extraction method above mentioned, our proposed method combines global, spatial, and channel features in a unified architecture to better exploit both spatial and channel information. With this method, MCSN achieves competitive results with state-of-the-art methods, and proves channel partition can complement feature representations of spatial partition.
The second category is multi-branch networks, such as MGN [8], which is a multi-branch deep network architecture consisting of one branch for global feature representations and two branches for local feature representations. The images are uniformly partitioned into several stripes to obtain local feature representations with multiple granularities. Similar to our proposed model is that multi-branch network is used and global and spatial part-based features are considered. In addition, different from the MGN model, the channel partition strategy and BNNeck are introduced in our proposed method, and its performance exceeds that of many previous methods. Besides, our proposed method is completely an end-to-end learning process, which is easy for learning and implementation.
Experiments
Extensive experiments have been performed to evaluate the effectiveness of our proposed approach over three public PReID datasets: Market1501, DukeMTMC-ReID and MSMT17. The results are compared with state-of-the-art methods.
Implementation details
First of all, input images are resized to 256×128 and then augmented by random horizontal flip and random erasing with a probability of 0.5, and normalization mean value of the three color channels of RGB is set to [0.485, 0.456, 0.406], and the standard deviation is set to [0.229, 0.224, 0.225]. The backbone ResNet-50 is initialized from the ImageNet pre-trained model. All the layers after res_conv2 layer are duplicated into three independent branches. Each reduction layer is followed by the BNNeck architecture. Models are trained for 120 epochs for Market-1501, DukeMTMC-reID and MSMT17 with a batchsize of 64. A batch consists of 16 identities, with 4 instances per identity. And then, Adam is adopted as the optimizer with the base learning rate initialized to 3.5 × 10⁻⁵. In the first 10 epochs, the learning rate linearly increasing the learning rate from 3.5 × 10⁻⁵ to 3.5 × 10⁻⁴, then decayed to 3.5 × 10⁻⁵ at 40 epoch and further decayed to 3.5 × 10⁻⁶ at 70 epoch, respectively. The total training process lasts for 120 epochs. To balance the losses, we chose λ=2. In order to get an unbiased comparison, all the experiments were performed on a same PC, which was configured with detailed settings as shown in Table 2.
Detailed settings
Detailed settings
Market-1501 dataset: It includes 1,501 pedestrian images collected from six cameras. The training set has 751 identities with 12,936 images, and each identity has 17.2 photos on average, while the testing set has 750 identities with 3,368 query images and 19,732 gallery images, and each person has 30.8 photos on average.
DukeMTMC-reID dataset: It provides a new video dataset recorded by 8 synchronized cameras with more than 7,000 single-camera tracks and more than 2,700 independent characters. The dataset consists of 16,522 images of 702 persons in the training set and 2,228 query images and 17,661 gallery images of 702 persons for testing. There are 23.5 images per identity in the training set.
MSMT17 dataset: It contains 126,441 bounding boxes with 4,101 pedestrians. Among them, the training set contains 1,041 pedestrians with a total of 32,621 bounding boxes, while the testing set contains 3,060 pedestrians with a total of 93,820 bounding boxes.
Evaluation metrics
Rank-1 and mean average precision (mAP) are used to evaluate the performance of our proposed model. (1) CMC describes the accuracy of the first N elements in the sorted list that are consistent with the target in the detection set, i.e. calculates the hit probability of top-K, which is defined as:
Calculate the average of the average accuracy of all the targets to be queried, i.e. mAP, which is shown in the following formula:
To verify the effectiveness of each component and setting of MCSN, we designed several ablation studies with different settings on Market-1501, DukeMTMC-ReID and MSMT17, including the influence of partition strategies, branches, multi-level global fusion features, channel features, backbones, loss functions, parameters in total loss and BNNeck. Note that all unrelated settings are the same as MCSN implementation detailed in Section 4.1.
Influence of partition strategies
Extensive experiments are conducted to validate the effectiveness of channel branch is split into 2 blocks and the spatial branch is divided into 4 blocks (i.e., P1(2)+P2(4)) by comparing our proposed model with other three partition strategies. These partition strategies are compared on the Market-1501, DukeMTMC-ReID and MSMT17 datasets. Results are reported in Fig. 4. On the Market-1501 dataset, the model with P1(2)+P2(4) partition strategy outperforms the one with P1(2)+P2(3) partition strategy by 0.1% rank-1 and 0.2% mAP. On the MSMT17 dataset, the model with P1(2)+P2(4) partition strategy outperforms the one with P1(3)+P2(4) partition strategy by 0.8% rank-1 and 0.5% mAP. In general, although the performance of our proposed P1(2)+P2(4) partition strategy on the DukeMTMC-ReID dataset is average, it is still the best choice compared with the other partition strategies.
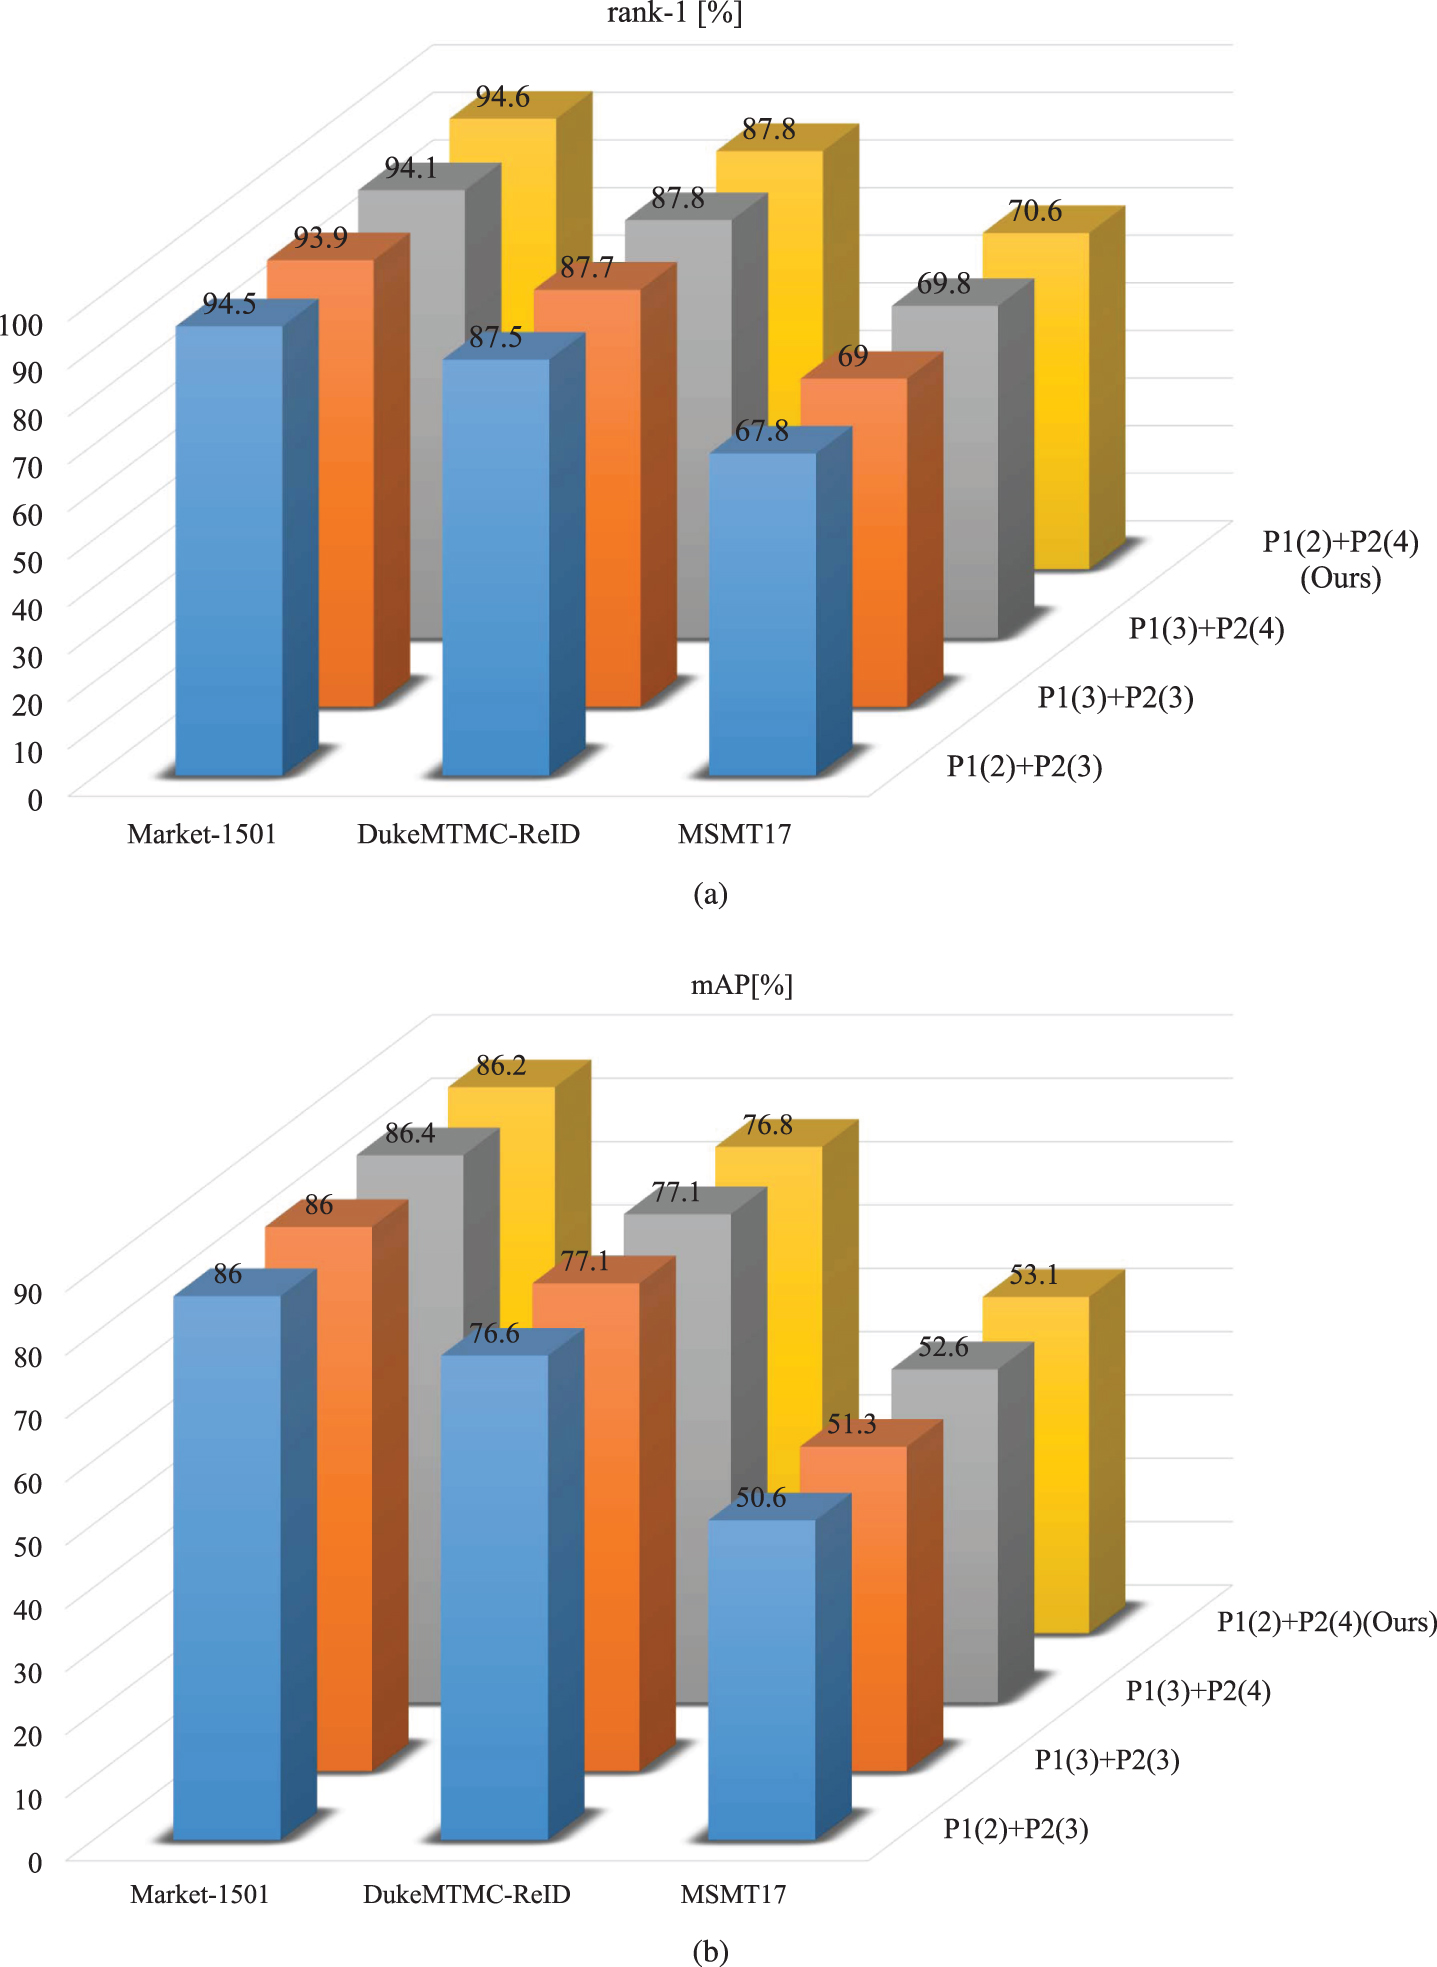
Performance comparison of different partition strategies (P1(2)+P2(3), P1(3)+P2(3), P1(3)+P2(4), P1(2)+P2(4)(Ours)) on Market-1501, DukeMTMC-ReID and MSMT17 datasets. “P1(2)” and “P1(3)” refer that the entire feature map is partitioned into 2 and 3 channel groups in P1 branch, while ”P2(3)” and ”P2(4)” respectively refer to 3 and 4 spatial parts in P2 branch.
Our proposed network consists of global(G) branch, channel (P1) and spatial (P2) partition branches. Table 3 depicts our network’s performance in different branch combinations. The results suggest that the performance of the model increases with the increase of the number of branches. Among all combinations, the model has the lowest performance on the three datasets when there is only a global branch. As can be seen from Table 3, on the three datasets, our model achieves state-of-the-art results in all the combination of branches by using all three branches together, indicating that local features are crucial for generalization.
Ablation study of branch influences. The models’ performance is studied under the different branch configurations, where “G+P1+P2” refers to our proposed model and “P1(spatial)” means that spatial partition is employed rather than channel partition in P1 branch. In addition, “G(w/o Multi)" refers that multi-level global feature fusions method is removed and only the feature after res_conv5 layer is used. The bold font denotes the best result
Ablation study of branch influences. The models’ performance is studied under the different branch configurations, where “G+P1+P2” refers to our proposed model and “P1(spatial)” means that spatial partition is employed rather than channel partition in P1 branch. In addition, “G(w/o Multi)" refers that multi-level global feature fusions method is removed and only the feature after res_conv5 layer is used. The bold font denotes the best result
Different from the previous common global feature extraction methods, e.g., PCB employed a uniform partition strategy to produce part-level features, which did not consider multi-layer global feature representations. However, the proposed MCSN learns the global feature representation of pedestrians by extracting multi-level global fusion features. Several experiments are performed on the Market-1501, DukeMTMC-ReID and MSMT17 datasets to confirm the necessity and efficiency of our proposed multi-level global fusion features setting. The results of the experiment are shown in the last two rows of Table 3 for all the three datasets. Clearly, it achieves consistently improved performance in all three datasets, i.e., our proposed model achieves 0.4% rank-1 and 0.5% mAP improvement on the Market-1501 dataset compared with the model with the multi-level global feature fusions setting not be used, 0.2% rank-1 improvement on the DukeMTMC-ReID dataset and 0.2% rank-1 and 0.1% mAP improvement on the MSMT17 dataset. The results with multi-level global feature fusions are generally better, which proves the effectiveness of our proposed method. The possible reason is that the combination of low-level features and high-level features plays a complementary role.
Effectiveness of channel feature
As can be seen in Table 3, when substituting the two channel groups (G+P1+P2) in P1 branch with two spatial parts (G+P1(spatial)+P2), performance decreases. That is to say, the combination of spatial and channel partitions outperforms the one which only considers spatial partition. For example, our proposed method outperforms the combination G+P1(spatial)+P2 by 1.1% rank-1 accuracy and 0.9% mAP on the Market1501 dataset, 0.2% rank-1 accuracy and 0.3% mAP on the DukeMTMC-ReID dataset, and 0.7% rank-1 accuracy and 0.1% mAP on the MSMT17 dataset, respectively. The possible reason for this result is that the uniform spatial partation by 2 and 4 introduces no overlap areas between stripes, and thus more discriminative overlap areas information can’t be learned.
Influence of backbones
Table 4 shows some examples of the different backbone performances. As shown in Table 4, the ResNet-50 has the weakest performance among all models. Comparing the results of the ResNet-50 with our proposed MCSN, it can be observed that MCSN(ResNet-50) makes a significant performance improvement from rank-1/mAP=87.5%/71.4% to 94.6%/86.2% (+7.1%/14.8%). In addition, the same experiment is implemented with the SE-ResNet-50 and ResNet_se_ibn. Experiment results indicates that MCSN(ResNet-50) achieves 1.1%/1.4% and 5.6%/12.5% gains compared with MCSN(SE-ResNet-50) and MCSN(ResNet_se_ibn) in rank-1/mAP, respectively. This shows that the additional configuration is not the most important to improve the performance of PReID, but the well-designed network architecture. The results above prove that our proposed MCSN has incredible capability of feature representations for PReID.
Ablation Study of backbone influences on the Market-1501 dataset. “MCSN(SE-ResNet-50)", “MCSN(ResNet_se_ibn)” and “MCSN(ResNet-50)” refer to SE-ResNet-50, ResNet_se_ibn and ResNet-50 are regarded as the backbone of our proposed model, respectively. Here, “SE-ResNet-50” refers to Squeeze-and-Excitation structure added in ResNet-50, “ResNet_se_ibn” refers to IN and BN structure added in ResNet-50. The bold font denotes the best result
Ablation Study of backbone influences on the Market-1501 dataset. “MCSN(SE-ResNet-50)", “MCSN(ResNet_se_ibn)” and “MCSN(ResNet-50)” refer to SE-ResNet-50, ResNet_se_ibn and ResNet-50 are regarded as the backbone of our proposed model, respectively. Here, “SE-ResNet-50” refers to Squeeze-and-Excitation structure added in ResNet-50, “ResNet_se_ibn” refers to IN and BN structure added in ResNet-50. The bold font denotes the best result
Several model performances are studied under the specified training modifications in Table 5. Some conclusions are drawn from the experimental results in Table 5: 1) when only the classification loss is considered, it is obvious that the model using label smoothing cross-entropy loss is higher than that of softmax cross-entropy loss in recognition performance; 2) when both classification loss and metric loss are considered, surprisingly, there is a large performance gap between batch hard triplet loss and WRT loss. We can see that the combination of Softmax+LS+WRT has the best performance compared with other combinations, which is the 0.4% and 0.6% rank-1 accuracy and the 0.3% and 0.6% mAP higher than the one with the best performance in others on the Market-1501 and DukeMTMC-ReID datasets, respectively. To form a unified framework, we apply the combination of Softmax+LS+WRT to all experiments.
Ablation study of loss function influences on the Market-1501 and DukeMTMC-ReID datasets. Here, “Softmax” means the softmax cross-entropy loss, “Softmax+LS” means softmax cross-entropy loss with label smoothing, “BHTP” means batch hard triplet loss, and “WRT” represents weighted regularization triplet loss. The bold font denotes the best result
Ablation study of loss function influences on the Market-1501 and DukeMTMC-ReID datasets. Here, “Softmax” means the softmax cross-entropy loss, “Softmax+LS” means softmax cross-entropy loss with label smoothing, “BHTP” means batch hard triplet loss, and “WRT” represents weighted regularization triplet loss. The bold font denotes the best result
To balance the contributions of softmax cross-entropy with label smoothing and WRT losses, the weight parameter λ should be determined. Five possibilities λ = 1, 2, 3, 4, 5 are tested on the Market-1501, DukeMTMC-ReID and MSMT17 datasets. Results in Fig. 5 shows that our proposed model gets the best performance with λ = 2 on all three datasets. To form a unified framework, we set λ = 2 for all experiments.
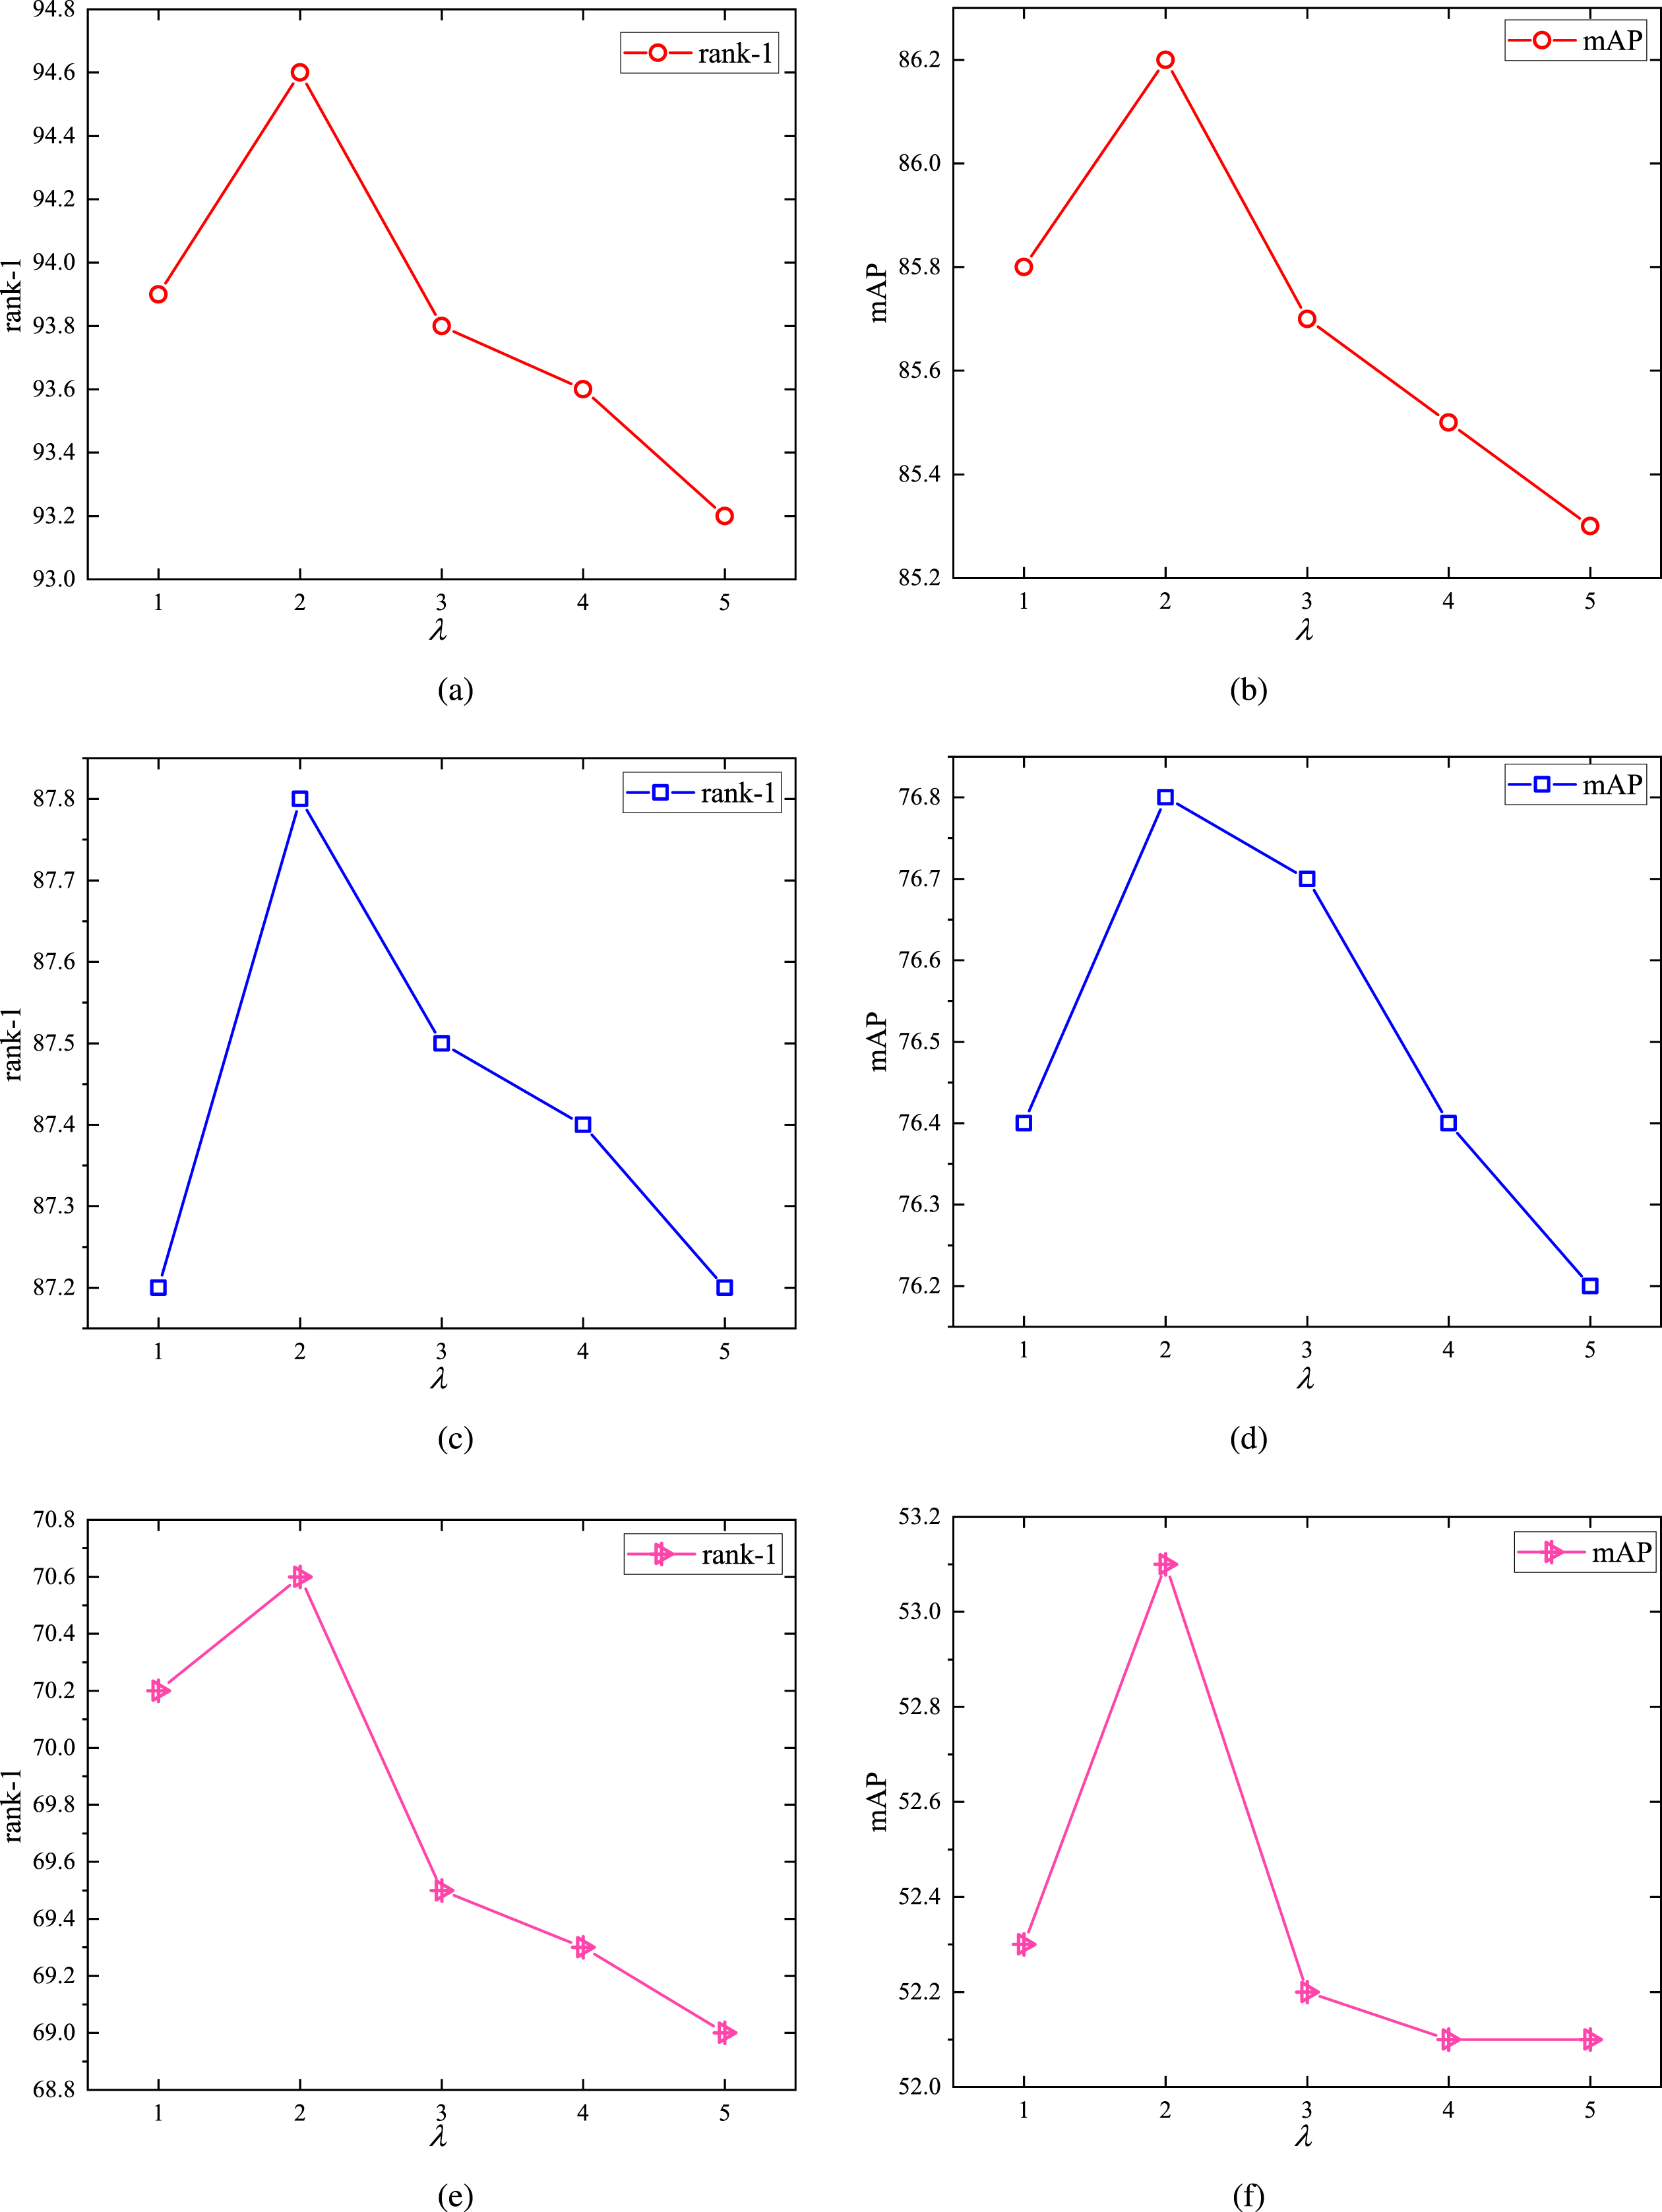
Ablation study of different parameter values for λ from L total . Experiments are conducted on the Market-1501 (as shown in (a) & (b)), DukeMTMC-ReID (as shown in (c) & (d)) and MSMT17 (as shown in (e) & (f)) datasets, respectively.
Most works combined ID loss and triplet loss together to train ReID models. However, the targets of them are inconsistent in the embedding space. Thus, the BNNeck [10] structure is introduced to solve the problem that the recognition result fluctuates due to the targets of these two losses (ID loss and WRT loss is used in this paper) are inconsistent in the embedding space when simultaneously optimize the same feature vector. Comparative experiments are implemented on the loss function curve and accuracy rate curve before and after BNNeck is used. Experiments results are shown in Figs. 7. Clearly, the model with BNNeck achieves faster convergence and higher accuracy rate on the three datasets, which increases the stability of the model in training process. In addition, it also improves the performance of the model. From Fig. 8, MCSN achieves additional +0.6%/+1.5%, +1%/+0.8% and +2.4%/+2.8% gains in comparison with MCSN(W/O BNNeck) in rank-1/mAP accuracy on the Market-1501, DukeMTMC-ReID and MSMT17 datasets, respectively.
Comparison with state-of-the-art
To verify the effectiveness of the proposed MCSN for PReID task, we compare it with some recent remarkable works. All methods have been divided into different types, including pose-guided, mask-guided, global feature, stripe-based, gan-based, attention-based, and are compared over the popular benchmark datasets Market-1501, DukeMTMC-ReID and MSMT17. For a fair comparison, any re-ranking [27] or multi-query fusion techniques [11] are not used in our proposed method.
Results on Market-1501
Comparisons between MCSN and state-of-the-art methods on Market-1501 are shown in Table 6. In the following, we report the performance of some models considering the single-query. Our proposed model outperforms GLAD, which is pose-guided, by 4.7% rank-1 matching rate and 12.3% mAP under single query mode. Compared with SPReID which is mask-guided, our MCSN outperforms it by 2.1% rank-1 matching rate and 4.9% mAP, respectively. We achieve similar performance with the baseline BagOfTricks based on global feature. In addition, compared with the stripe-based models, we reach the second place on the leader board and the best performance is obtained by MGN [8]. Our proposed model MCSN supass the best performance in models GAN-based and attention-based by 1.5% rank-1 and 3.9% mAP. Thus, our proposed method is proved superior on the Market1501 dataset.
Comparison of our method with state-of-the-art. The table lists our results on the two most used benchmarks, Market-1501 and DukeMTMC-ReID. Note that all results are reported without re-ranking. Bold font denotes the performance of our proposed method
Comparison of our method with state-of-the-art. The table lists our results on the two most used benchmarks, Market-1501 and DukeMTMC-ReID. Note that all results are reported without re-ranking. Bold font denotes the performance of our proposed method
Similar to Market-1501, the comparisons between our proposed method with related methods are shown in Table 6. This dataset is challenging, as it has 8 different cameras and the person bounding box size varies drastically across different camera views. Even so, our proposed model achieves even better performance on this dataset. Compared with the state-of-art method BagOfTricks except for MGN, our proposed method achieves an improvement of 0.4% mAP and 1.4% rank-1 performance.
Results on MSMT17
The results indicate that our proposed method achieves the better performance on such a dataset. As shown in Table 7, our proposed model obtains 70.1% rank-1 accuracy and 52.7% mAP, which significantly outperforms some existing methods. In addition, although the accuracy rate on the rank-1 is not the best, on the mAP is the best among the methods mentioned. It indicates that our proposed architecture is able to learn meaningful feature representations as well as a similarity measure with limited data.
Comparison to state-of-the-art methods on the MSMT17 dataset
Comparison to state-of-the-art methods on the MSMT17 dataset
Although there are visual differences between the datasets, such as scene bias and detection bias, we prove that our proposed model consistently improves the performance of PReID. In addition, PReID can be regarded as an image retrieval problem. Therefore, to get a better understanding on how our proposed MSCN can outperform previous state-of-the-art, we compare some retrieved results between PCB and our MSCN on the Market-1501 dataset, as shown in Fig. 9. These results confirm the effectiveness of spatial and channel partition on keeping more salient information.
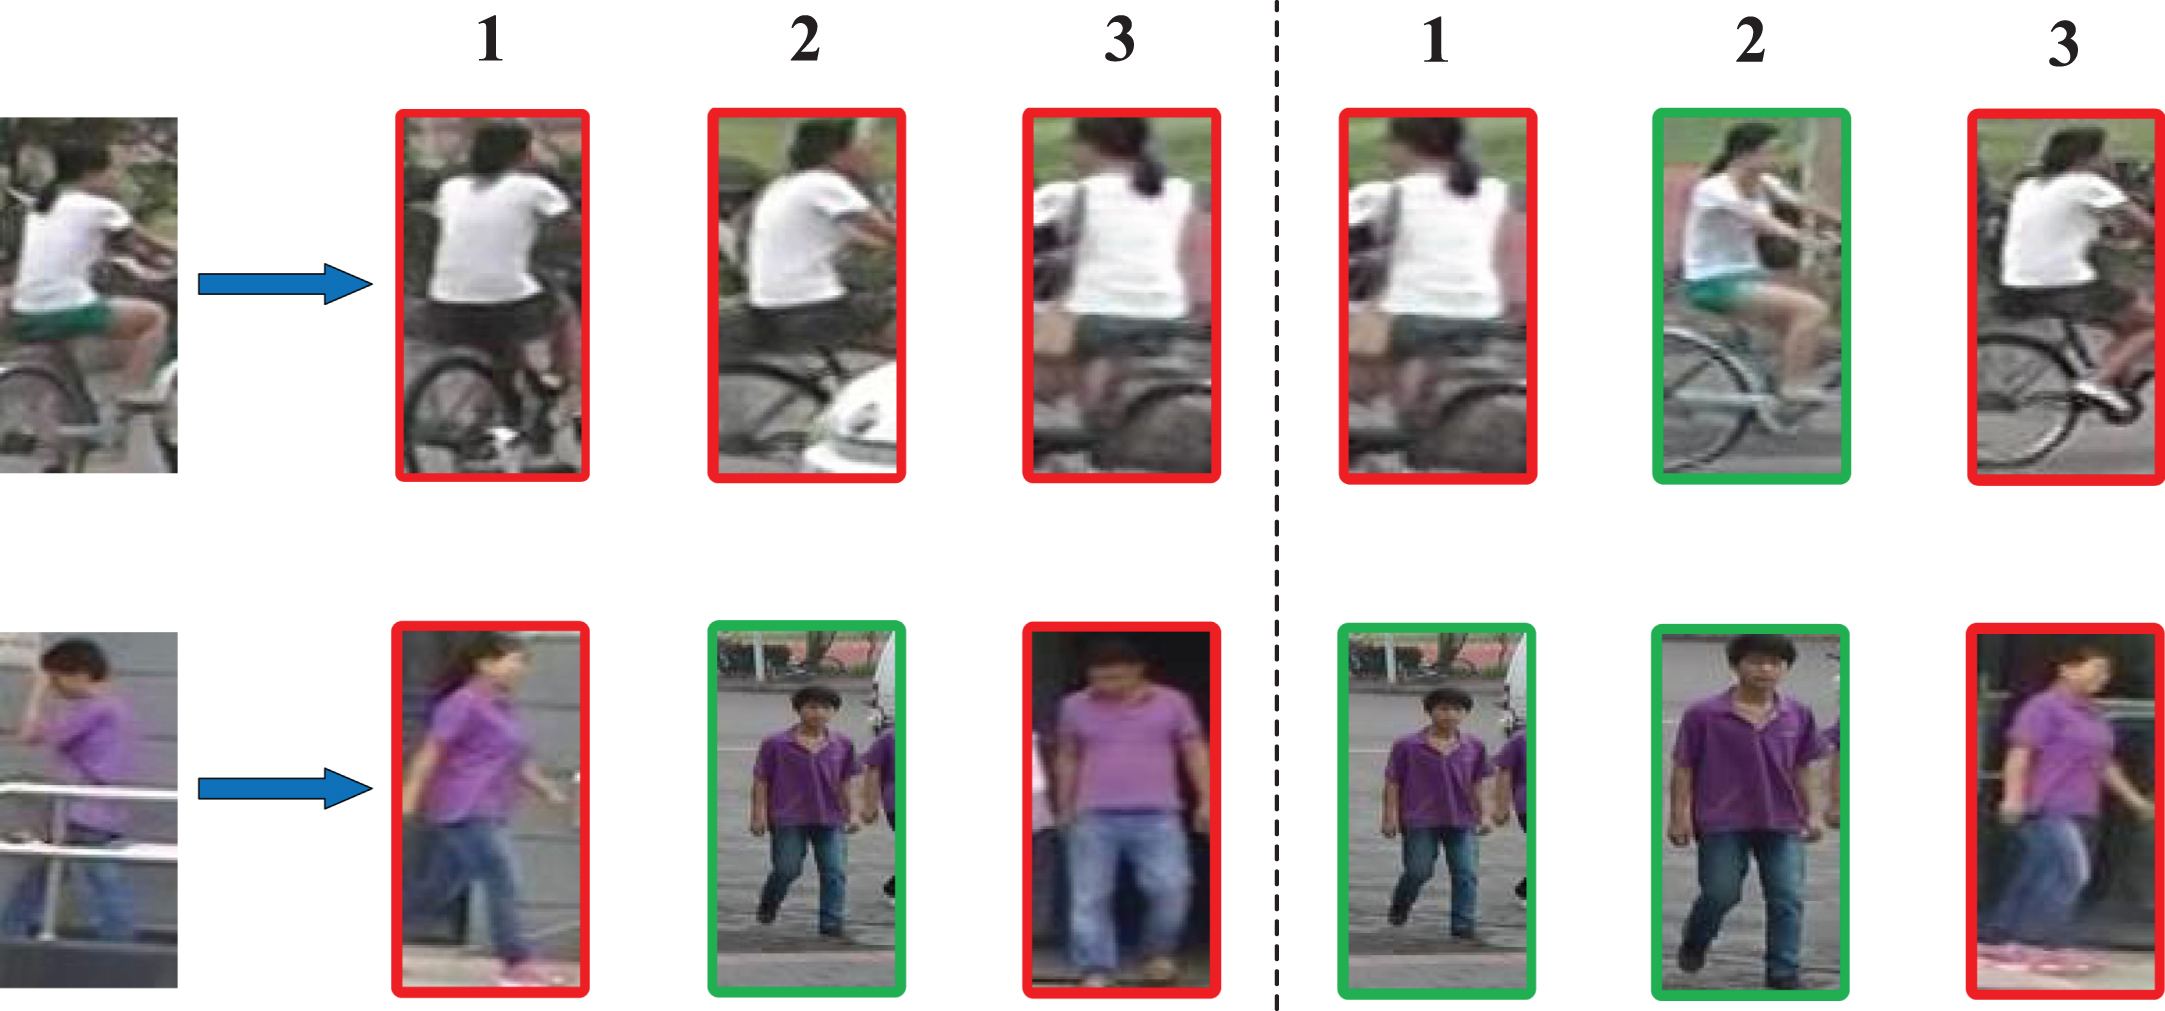
Two examples of MCSN and PCB on the Market-1501 dataset. The retrieved images from left to right are sorted according to the similarity score. For each query, the query results from rank-1 to rank-3 are displayed. From left to right: query image, top-3 results of PCB, and top-3 results of MSCN. Images in red boxes are negative results and in green boxes are positive results. The results show that our proposed model boosts the retrieval performance. The magnified visual effect is the best. It should be noted that we used the retrieval results of PCB in [43].
We have presented a multi-branch neural network that joints multi-level global fusion features, channel features and spatial features to make better use of spatial and channel information. In addition, the BNNeck and the joint loss function strategy are applied to all vector representation branches to improve the stability of model training and the generalization ability of the model. Experiments conducted on three mainstream image-based evaluation protocols including Market-1501, DukeMTMC-ReID and MSMT17 validate the performance of our proposed model, which outperforms previous state-of-the-art in PReID tasks.
Since this paper proposes a multi-branch network, the large number of parameters of the model makes the model less efficient, which is an obstacle that limits the further improvement of model performance. Thus, after the recognition performance of the model has been greatly improved, efficiency is also an aspect that must be considered. In the future, the channel attention “soft” pruning algorithm of channel local correlation will be applied to our proposed model to improve model efficiency. It is worth mentioning that redundant pruning with more local clustering can effectively maintain the original network channel distribution.