
Abstract
Cervical cancer can be cured if it is initially screened and giving timely treatment to the patients. This paper proposes an optimization technique for exposing and segmenting the cancer portion in cervical images using transform and windowing technique. The image processing steps are preprocessing, transformation, feature extraction, feature optimization, classification, and segmentation involved in the proposed work. Initially, Gabor transform is enforced on the cervical test image to modify the pixels associated with the spatial domain into multi-resolution domain. Subsequently, the parameters of the multi-level features are extracted from the Gabor transformed cervical image. Then, the extracted features are optimized using the Genetic Algorithm (GA), and the optimistic prominent part is classified by the Convolutional Neural Networks (CNN). Finally, the Finite Segmentation Algorithm (FSA) is used to detect and segment the cancer region in cervical images. The proposed GA based CNN classification method describes the effectual detection and classification of cervical cancer by the parameters such as sensitivity, specificity and accuracy. The experimental results are shown 99.37% of average sensitivity, 98.9% of average specificity and 99.21% of average accuracy, 97.8% of PPV, 91.8% of NPV, 96.8% of FPR and 90.4% of FNR.
Introduction
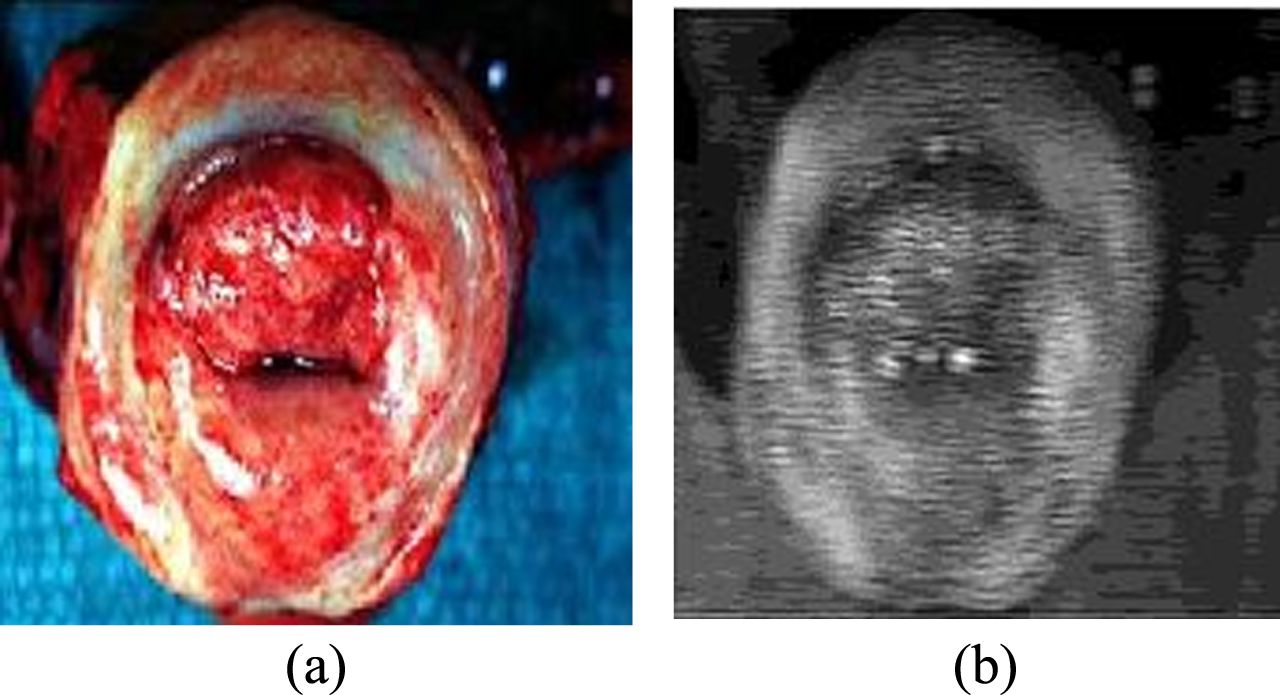
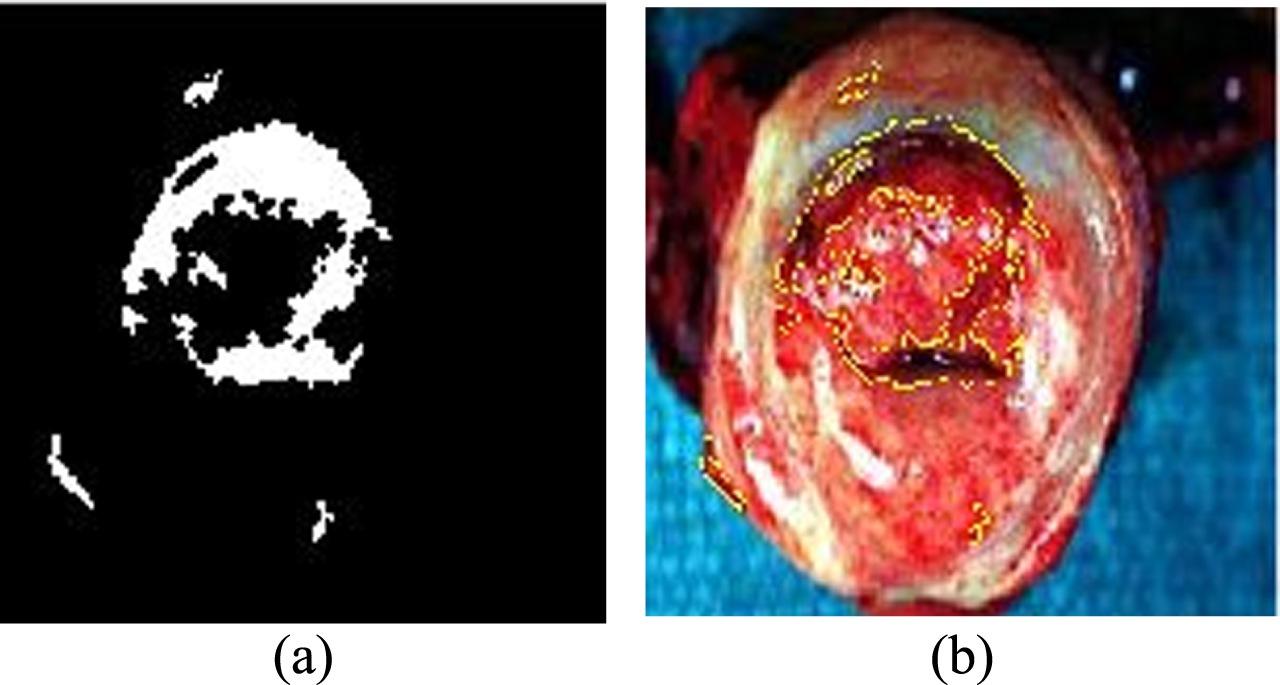
The imbalance development of cells in the human body builds the cancer cells, and based on its severity level, it spreads various parts of the body. Women are generally affected by breast and cervical cancer. Breast cancer appears because of the abnormal growth of the cells in the breast region [1, 2]. The patients affected by breast cancer can check themselves to verify whether they are affected by breast cancer or not. Sudden death cannot be accrued due to this breast cancer. It is identified at the initial stage and the patient feels pain at the starting stage of cancer in the breast [3]. However, cancer cells in the cervix region of the human create cervical cancer [4], and the patient feels bleeding at the last stage of this cancer, which creates sudden death. Figure 1 (a) shows the typical cervical region of the women who are not suffering from cancer. Figure 1 (b) shows the cancer affected cervical cancer image.
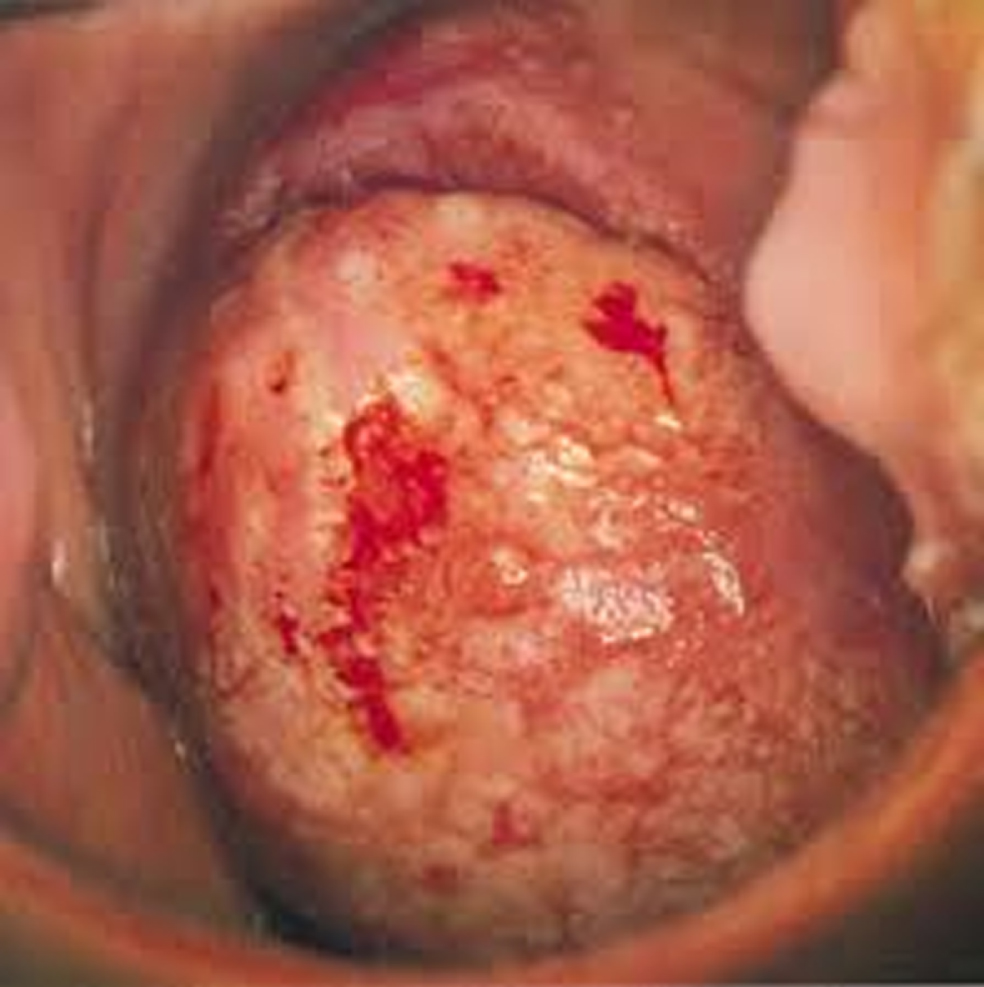
Cervical cancer image.
Human papillomavirus (HPV) in the women’s cervical region is the main reason for cancer formation in cervical regions. World Health Organization (WHO) reported that more than 80% of cervical cancer cases are rising in developing countries due to their lack of knowledge and awareness about the disease. In developing countries, there is an urgent need for screening this cervical cancer using automated machine learning methodologies due to the insufficient radiologist or physician. The present research for cancer region detection in cervical images is used in many clinical or health care centers to assist the radiologist in detecting the cancer regions in an automated manner. Hence, this paper proposes a deep learning-based automatic detection and classification methodology for cervical cancer detection and segmentation using proposed segmentation algorithm
The novelty of the proposed work is also stated for the cervical cancer detection. In this proposed design, novel CNN architecture is constructed to classify the cervical images using feature optimization process. In conventional CNN process, the source cervical images are directly classified by CNN using the internal feature map. In the proposed CNN process, the optimized external features are classified using the developed CNN architecture to improve the classification rate.
This paper is structured, as section II states the existing methods for cervical cancer detection and segmentation [5]. Section III and IV develop a new methodology for cervical cancer detection and classification [6]. Section V deals with simulation results and section VI describes the conclusion of this paper.
Thiyaneswaran et al. used k-mean clutsering approach for the detection and segmentation of cancer regions in skin images. The authors have attained 90.0% of average accuracy with respect toopen access dataset [7]. Zheng et al. [27] used two level data augmentation model in deep learning CNN architecture for the classification process of modulation. This model was entirely based on the spectrum interference and the authors obtained high classification rate using this two level CNN system. Qinghe Zheng et al. [25] classified natural images using full stage CNN architecture. The authors developed and used different full stage data augmentation models to improve the classification rate of the natural language classification system. Zheng et al. [26] devised a probably approximately correct (PAC) Bayesian boundary model for developing deep CNN architectures for the classification process. Drop-path variation in the developed architecture was minimized using the PAC model. Zheng et al. [24] constructed two stage training process flow based deep CNN architecture for the classification of different patterns. This methodology used implicit regularization approach to extract the compound feature map and the constructed feature map was used for the CNN classification process.
Alyafeai Zaid et al. used deep learning classification approach for the detection and segmentation of cancer regions in cervical images.The authors used Guanacase Dataset 2005 and also they attained 97.2% of average sensitivity, 98.3% of average specificity and 98.8% of average accuracy with respect to ground truth images [8]. Wasswa William et al. suggested a Pap smear analysis tool (PAT) for detection of cervical cancer from pap smear images. They attained 99.28% of average sensitivity, 97.4% of average specificity and 98.8% of average accuracy [9]. Kumarganesh et al. recommended an ANFIS classifier method for the classification of tumors from the source images. They achieved 96.6% of classification accuracy [10]. Sachan et al. used ransom forest classification method on the cervical images.They attained from open access dataset achieved 90.5% of average sensitivity, 93.2% of average specificity and 92.9% of average accuracy [11]. Karthiga Jaya et al. used ANFIS classification approach for the detection and segmentation of cancer regions in cervical images. The authors used Guanacase Dataset 2005 and also they attained 97.42% of average sensitivity, 98.3% of average specificity and 99.12% of average accuracy with respect to ground truth images [12]. Kashyap et al. suggested a screening technique for exposing and determining the cancerous parts in cervical images. The composer modeled the independent level set on the source cervical image, and then the points within the level set were extracted. The extracted features were consolidated with Gray Level Co-occurrence Matrix (GLCM) features for improvising the detection and classification of cervical cancer is more accurate. These features set were optimized by Principal Component Analysis (PCA) to select the optimum modeled features from the source cervical images. These features were well trained and classified by Support Vector Machine (SVM) [13]. Soumya et al. transformed the source cervical image by using the contourlet transformation method along with the Gabor orientation technique. The transformed coefficients were consolidated with second-order statistical feature parameters, and these features set was well trained and categorized by using the SVM classifier. The authors obtained 81% of average classification accuracy results in the detection of cancer parts in source cervical images [14].
Kumarganesh et al. suggested an Adaptive Neuro Fuzzy Inference System (ANFIS) classifier technique for the classification of tumors from the source images. They achieved 93.07% of sensitivity, 98.79% of specificity, and 97.63% of cancer segmentation accuracy [15]. Dhumal et al. suggested a direct technique to expose the cancerous area in the input test cervical images. First and second-order statistical features were determined from the source cervical image, and these feature sets were well trained and classified using a linear classification approach. Finally, a morphological segmentation technique was applied to detect the cancer parts in classified result images [16].
Kumar et al. employed feed-forward back propagation neural networks to categorize source cervical images into either benignant or malignant. They determined the random parameters feature from the cervical images to enhance the cancer categorization is more efficient. They attained 82% of sensitivity, 87% of specificity, and 91% of cancer segmentation accuracy [17]. Yung-Fu et al. modeled an optimum method for determining and partitioning the Pap smear cells of the patients. The authors compared and analyzed the segmented nucleus region of the cervical image with the radiologist segmented nucleus regions based on their morphological properties. They attained 93% of average classification accuracy [18]. Rama Praba et al. developed and tested various classification algorithm models on cervical source images for detection and classifications. The authors estimated texture features from the intensified source cervical image, and these features were classified using the SVM algorithm and Neural Network’s classification approach. The authors attained optimum classification accuracy of 89% [19].
Materials and methods
Materials
The cervical images used in this paper are obtained from the Guanacaste dataset 2005 [20]. Guanacaste dataset was created in 1997 by National Cancer Institute (NCI) (NCCC, 2010) in Guanacaste project and updated in every year (http://www.nccc-online.org/index.php/cervicaltumor). Moreover, this is also an open access dataset. This data set contains large numbers of cervical images with corresponding ground truth images, which are marked by an expert radiologist. In this paper, the images from this data set are automatically classified into various severity classifications. In this paper, 100 cancer affected cervical and 75 non-cancer affected cervical images are accessed from the open access dataset. All the cervical images used in this work are having 8 bit pixel resolution and the size of the each cervical image is 128*128, as width and height respectively. This dataset is split into learning and classification mode. 30 cancer affected cervical images and 25 non-cancer affected cervical images are used for constructing learning dataset. 70 cancer affected cervical images and 50 non-cancer affected cervical images are used for constructing classification dataset.
Methods
This paper proposes an efficient technique for determining and distinguishing the cancerous parts in cervical images using an optimization technique. Gabor transform is enforced on the cervical test image to modify the spatial domain pixels into multi-resolution domain pixels. Then, the data augmentation methods are applied on the Gabor image to increase the sample size. The multi-level feature parameters are estimated from the data augmented cervical images for improvising the classification rate of the proposed work. Further, the extracted parameters are optimized using GA, and the optimized features are categorized using CNN classification technique. Lastly, the FSA segmentation algorithm is used to detect and segment the cancer region in cervical images.
Figure 2 shows the proposed technique for detecting and classifying the cancer region in cervical images.
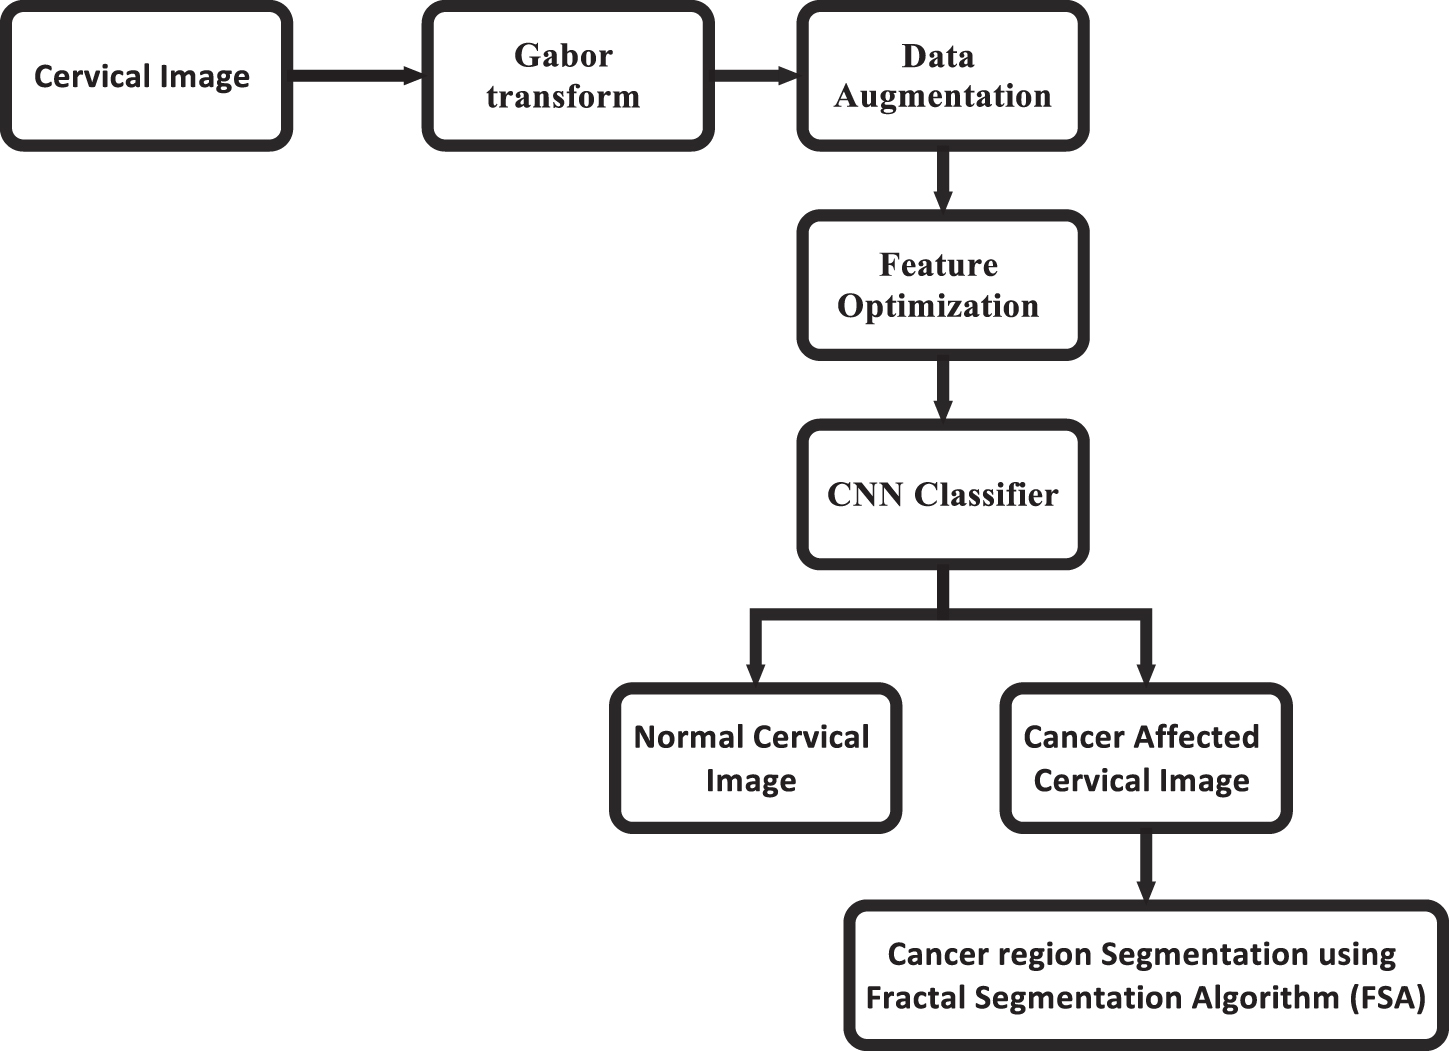
Cervical cancer detection approach using CNN and FSA.
Gabor transformation
The cervical source images utilized in this paperwork are in the spatial domain model, which consists of the time domain pixels. The modification process of spatial domain pixels is very complicated. The optimum transform process is required to be applied to the spatial domain image pixels to modify the time domain cervical image into frequency domain image pixels. It may consist of two components, such as spatial and phase components. Discrete Wavelet Transform (DWT) is a traditional transformation method applied to the spatial domain image to obtain a multi-resolution pixel format. This technique was suitable for cervical image decomposition, but the transformed, resulting image was a high loss, which impacts the degradation in the recovered image. Hence, the Gabor transform technique is applied in this paperwork for this pixel domain format transformation from the spatial domain to the frequency domain. Gabor transform is original, a Gabor kernel which can be convolved by the spatial domain source cervical image. The below equation represents the Gabor kernel,
Whereas the standard deviation is denoted by σ, and the pixels coordinate in a source cervical image is denoted as (x, y).
The Gabor filter is designed using the intrinsic parameters scale and phase orientation. In this article, the scale parameter of the Gabor filter is set to 1 after several iterations to reach high classification rate. The phase orientation is noted as ⊖ and it varies from 00 to 1800 with the phase increment of 10 as an interval slot. The scale (u) value is fixed by one after making much examination. The scale (u) value along with each phase orientation slot is assigned in this mathematical calculation, which creates 180 Gabor kernels. Then the Gabor transformed images produced by convolving these Gabor kernels with the cervical image in the spatial domain model. Finally, by applying the maximum magnitude of each pixel in the Gabor transformed image, which produces the resulting magnitude image. Figure 3 (a) shows the source cervical image and Fig. 3 (b) shows the Gabor transformed cervical image.
(a) Source cervical image (b) Gabor transformed image.
The CNN classifier requires high number of cancer affected and normal cervical images during its training function in order to optimize the cervical cancer classification rate. The open access dataset which is used in this paper are having less number of cancer affected and normal cervical images. In order to increase the number of cancer affected and normal cervical images, data augmentation methods are used in this paper. This method modifies the pixel locationand also changes their pixel pattern in the source image to produce large number of image samples. In this paper, flipping, rotation left, rotation right, shearing left, shearing right, crop function, zoom in and zoom out functions are used as the data augmentation methods. In this paper, 100 cancer affected cervical and 75 non-cancer affected cervical images are accessed from the open access dataset. The flipping function produces 100 cancer affected cervical and 75 non-cancer affected cervical images, the rotation function (both left and right) produces 200 cancer affected cervical and 150 non-cancer affected cervical images, the shearing function (both left and right) produces 200 cancer affected cervical and 150 non-cancer affected cervical images, The crop function produces 100 cancer affected cervical and 75 non-cancer affected cervical images and zoom function (both left and right) produces 200 cancer affected cervical and 150 non-cancer affected cervical images. Hence, the total number of data augmented cancer affected cervical images is about 800 and the total number of data augmented non-cancer affected cervical images is about 600. These data augmented images are integrated with the source cervical images to increase the image counts. Hence, the data augmentation produces 900 cancer affected cervical images and 675 non-cancer affected cervical images.
Feature extractions
The classification of the source cervical image is performed, based on obtaining features from the various regions in an image. The classified resulting cervical image belongs to two categories, either normal (non-cancer affected cervical images) or abnormal (cancer affected cervical images). For the classification image purpose, the feature extraction process is performed. The term ‘feature extraction’ is the process of acquiring or extracting the features of the source cervical image. To classify the cervical images, the following features are procured from the data augmented cervical images.
Pattern features
To obtain the abnormal regions, Pattern features are mainly used to classify the homogeneous regions of the non-homogeneous regions in cervical images. Here p (x, y) is the Gabor transformed cervical image, and W (x, y) is the k*k window which is applied over the Gabor transformed cervical image. The value of k is selected as an odd number. The following pattern features are used in this paper, and they are computed by the below mathematical equations.
The size of the window used in this paper to extract the feature is 3*3 and the size of the Gabor transformed image p(x,y) is 128*128, as image width and height respectively.
GLCM features are texture associated based on the number of pixel pairs with specific intensity values. These are arranged in a particular specific spatial relationship, which is used to analyze the dependencies of the spatial distribution of pixels in a cervical image. The GLCM feature can be established by using any one of the spatial distributions at 00, 450, 900, and 1800. In this article, the GLCM matrix is constructed using 900 of orientation.
Here P (i, j) is a Gabor transformed cervical image, and i and j are the rows and columns of the GLCM matrix, respectively. The following GLCM features are extracted from the Gabor transformed cervical image for distinguishing the abnormal regions and normal regions.
Whereas, p (i, j) is the constructed Gabor transformed image and i and j are the rows and columns of the GLCM.
Where as, μi and μi are the mean of the GLCM matrix with respect to row and column. σ i and σ i are the standard deviation of the GLCM matrix with respect to row and column.
The acquired features are in this research work is non-linear with other features. This extracted feature set is arranged in a suitable matrix-vector form. Then the optimized algorithm is applied over the extracted features so that the extracted feature set length will be reduced. The non-linearity characteristics of the derived features set are optimized with the help of GA. In this research work, the proportions of the features are reduced by using GA, and these optimized sets of features are applied to the input of the classification algorithm for cervical image classifications. The GA algorithm is described in the successive steps. Select the random population with chromosomes to consist of several genes. Here the initial population size is selected by 70. precipitate a random number of weights for all genes conferred in chromosomes. Apply crossover process in the genes which has the weight sequences and its random numbers. To achieve the best optimization here, the crossover probability value is selected by 0.5. Apply mutation function on the result of crossover chromosomes with its corresponding random numbers and weights. To attain the best optimization here, the mutation probability value is selected by 0.2. After the mutation function is completed, then estimate the Euclidean distance metric between each gene in corresponding chromosomes and the select the chromosome which one who is having the minimum Euclidean distance. Repeat steps 2 to 6 until the end of the extracted features set in the feature set matrix.
The split and merge functions are performed in the crossover and mutation process, are set to variable due to the presence of tiny or large derived feature set in the feature vector matrix. After completion of the first iteration, the probability value of spilled and merge operations become stable, and they can be evaluated by the following mathematical equations.
The probability of split operation is obtained as,
Whereas, N is the initial population size, and it is set to 70 in this work.
The probability of merge operation is obtained as,
To categorize the cervical image into either benignant or malignant, various classification algorithms such as Artificial Neural Networks (ANN), Fuzzy Classification approaches are executed in plenty of traditional methods. They led to the high computational cost for the classification of normal and abnormal cervical images [21]. In this paper, the CNN structure is proposed which is basically derived from AlexNet CNN architecture. This proposed CNN structure is designed with Convolutional Layers (CL), Down Sampling Layer (DSL) and Fuzzy-C-Means (FCM) classifier. The proposed CNN structure consists of three CL and three DSL and one FCM layer. The first CL module is designed with 512 filters with the kernel size of 7*7. The second CL module is designed with 512 filters with the kernel size of 5*5 and third CL module is designed with 256 filters with the kernel size of 7*7. The optimized feature matrix is convolved with the filters in first CL and the size of these convolving responses are reduced by passing these responses through the DSL which is placed after every CL in proposed CNN structure. The responses from DSL-1 is passed to CL-2 which has 512 filters and the responses from DSL-2 is passed to CL-3 which has 256 filters, as depicted in Fig. 4. The final responses from DSL-3 are passed through FCM classifier which is the replacement module in conventional CNN structure in place of Neural Network (NN) module. This FCM classifier produces classification results as either cancer affected image or non-cancer affected image.
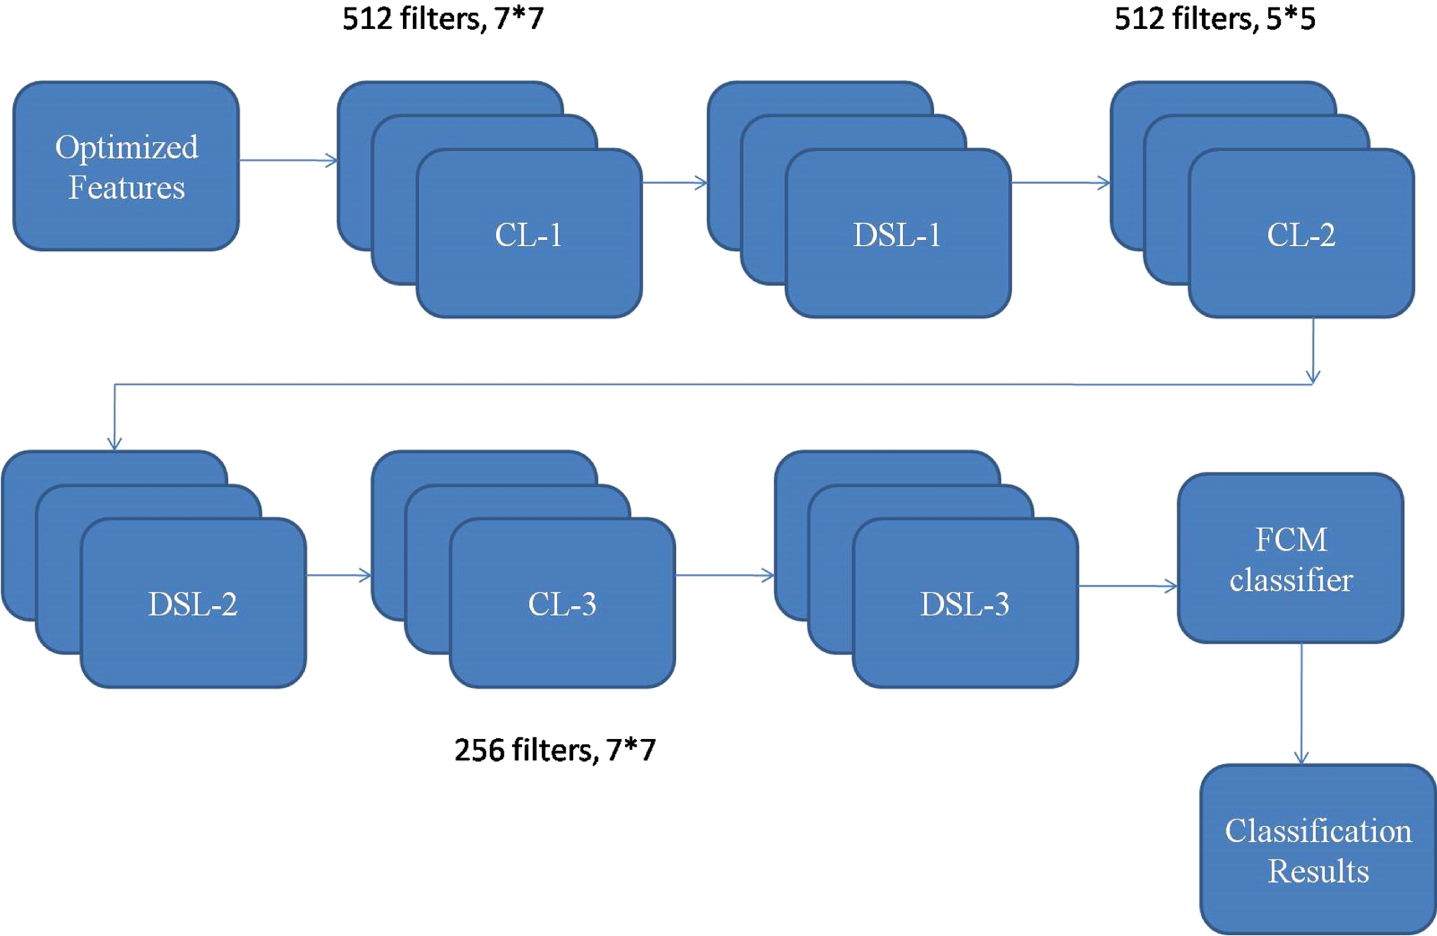
Proposed CNN structure for cervical image classifications.
It is mainly exercised to determine the cancer pixels belong to the classified abnormal cervical image. In this paper, a FSA is applied to segment the cancer region [22], and it is described in the succeeding steps.
Whereas, N is denoted by the no. of surrounding pixel intensities in 3*3 window.
Whereas, x is the center pixel in 3*3 window.
As a result of the computation process, if the center pixel intensity value is greater than the normalized weigh the value, then the center pixel of a matrix is considered as a cancer pixel.
Figure 5(a) shows the cancer region segmented cervical image [23] using a normalized segmentation algorithm which is proposed in this paper, and Fig. 9 (b) shows the cancer region’s distinct image.
(a) Cancer region segmented image (b) Cancer region marked test image.
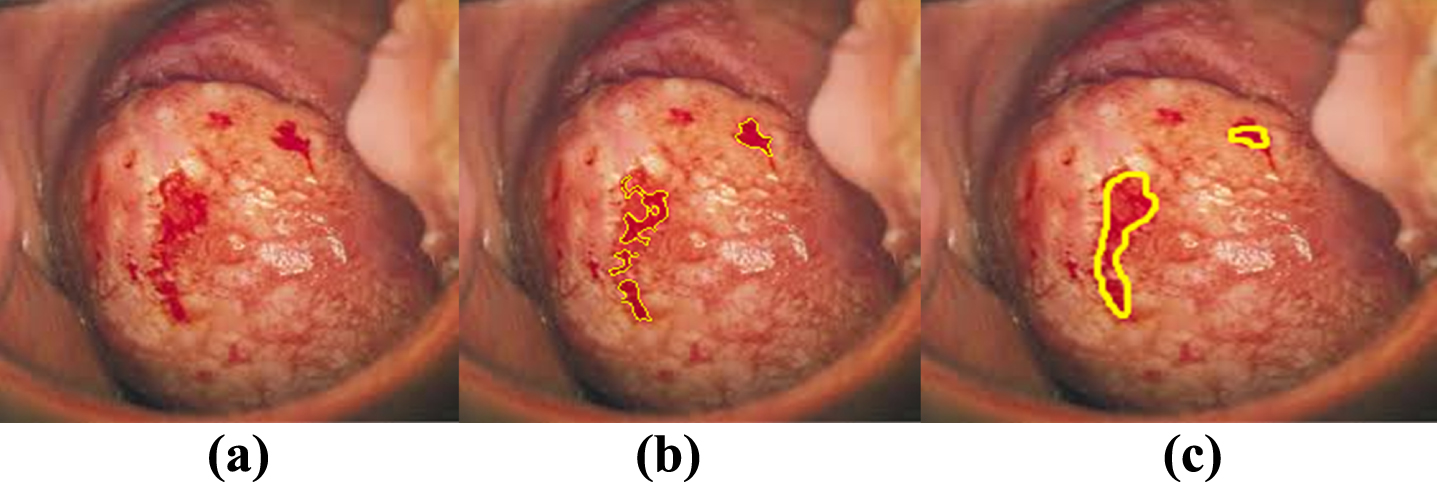
Figure 6 (a) shows the mild case cervical image, Fig. 6(b) shows cancer segmented image by the proposed approach, and Fig. 6 (c) shows the gold standard image.

Mild case (a) Cervical image (b) Proposed Cancer segmentation result (c) Gold standard image.
Figure 7 (a) shows severe case cervical image, Fig. 7 (b) shows cancer segmented image by the proposed approach, and Fig. 7 (c) shows the gold standard image.
Severe case (a) Cervical image (b) Proposed Cancer segmentation result (c) Gold standard image.
The proposed cervical cancer detection and segmentation method are exercised on the cervical images are in the open-access dataset. In this paper, MATLAB R2015 software tool is used for simulating the proposed method using the ANFIS classification approach, which is comprised of GA technique. The performance of this proposed cervical cancer classification and segmentation method is analyzed using the performance estimation parameters sensitivity (Se), specificity (Sp), accuracy (Acc), Positive Predictive Value (PPV), Negative Predictive Value (NPV), Precision, False Positive Rate (FPR), and False Negative Rate (FNR). The below mathematical equations estimate these performance evaluation parameters.
The actual number of correctly depicted cancer pixel is denoted by True Positive (TP), the number of correctly depicted non-cancer pixels is represented by True Negative (TN), the actual number of wrongly depicted cancer pixel is denoted by False Positive (FP), and the number of wrongly depicted non-cancer pixels is defined by False Negative (FN). All these performance evaluation parameters are obtained in percentage and they lie in the range 0 to 100. The low value 0 shows that the proposed system accuracy and the high value 100 shows the proposed system capacity.
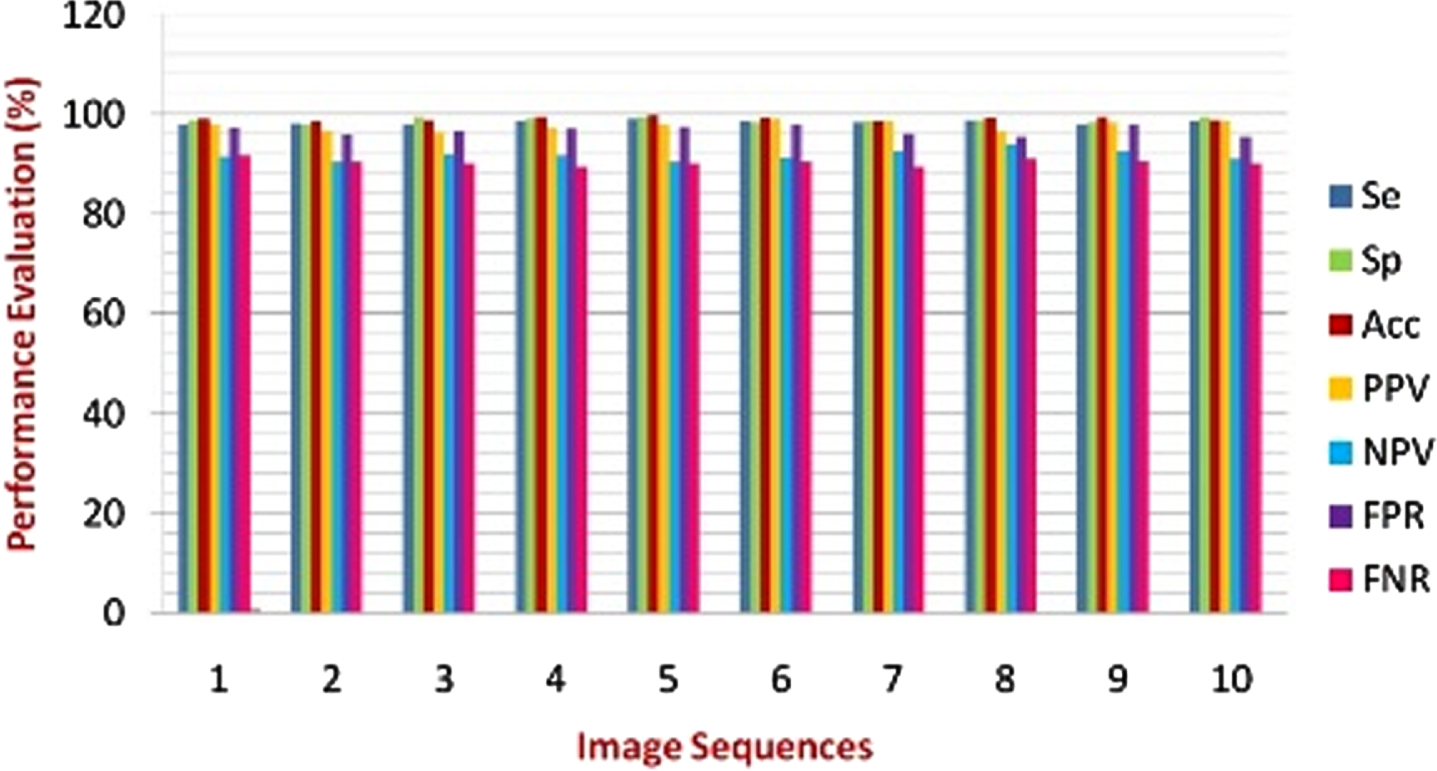
The proposed GA based CNN classification approach for the detection and classification of cervical cancer described in this work obtained 98.5% of maximum average sensitivity, 98.9% of maximum average specificity and 99.21% of maximum average accuracy, 97.8% of PPV, 91.8% of NPV, 96.8% of FPR and 90.4% of FNR, as depicted in Table 1.
Performance evaluation of proposed cervical cancer detection system
Table 2 shows the performance comparisons of proposed method with conventional cervical cancer detection methodologies. The GA based CNN classification methodology stated in this chapter attains 98.5% of average sensitivity, 98.9% of average specificity and 99.21% of average accuracy. Whereas the conventional method stated by Alyafeai Zaid et al., [8] attained 97.2% of average sensitivity, 98.3% of average specificity and 98.8% of average accuracy with respect to ground truth images. Karthiga Jaya et al., [12] attained 97.42% of average sensitivity, 98.3% of average specificity and 99.12% of average accuracy with respect to ground truth images.
Table 2 shows the performance analysis of the proposed system using different segmentation models. The proposed system using FSA segmentation approach obtains 98.5% of Se, 98.9% of Sp and 99.2% of Acc. The proposed system using linear segmentation algorithm obtains 93.9% of Se, 94.9% of Sp and 96.1% of Acc. The proposed system using morphological operations obtains 97.4% of Se, 98.3% of Sp and 99.12% of Acc.
Performance analysis using different segmentation models
Table 2 is the experimental analysis of proposed cervical cancer detection method with and without GA. The proposed CNN model with GA obtains 98.5% of Se, 98.9% of Sp and 99.2% of Acc. The proposed CNN model without GA obtains 90.3% of Se, 93.2% of Sp and 93.1% of Acc. Therefore, the proposed cervical detection system with GA provides significant experimental results over the proposed system without GA.
Table 3 is the significant analysis of extracted features for the proposed cervical cancer detection system. The proposed system using both GLCM and pattern feature alone obtains 98.5% of Se, 98.9% of Sp and 99.2% of Acc. The proposed system using pattern feature alone obtains 67.0% of Se, 67.4% of Sp and 67.1% of Acc. The proposed system using both GLCM feature alone obtains 70.3% of Se, 71.2% of Sp and 70.8% of Acc.
Experimental analysis of proposed cervical cancer detection method with and without GA
Significant analysis of extracted features for the proposed cervical cancer detection system
Performance comparisons of proposed method with conventional cervical cancer detection methodologies
The conventional methodologies Alyafeai Zaid et al. [8] and Karthiga Jaya et al. [12] used different cervical image dataset and different number of cervical image sequences. Therefore, in order to make the comparative un bias manner, the number of cervical image sequences from Guanacaste dataset is used for testing the conventional methods and then the experimental results of the conventional methods are compared with the experimental result of the proposed method.
Shows the graphical demonstration of Performance comparisons of the proposed method.
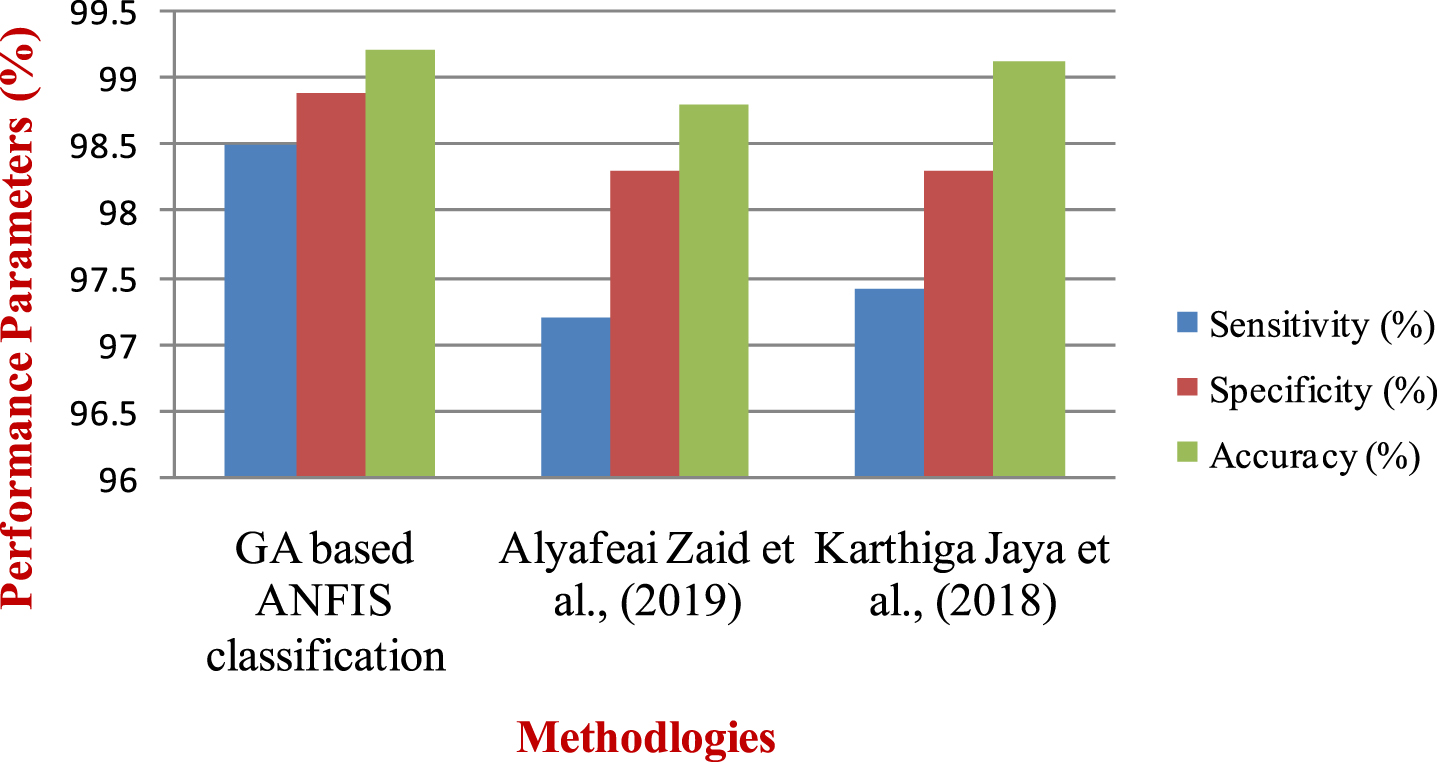
Shows the graphical performance comparisons of the proposed method with conventional cervical cancer detection methodologies.
This paper proposes an optimized classification algorithm based on CNN classification technique for detecting and classifying the cancer in cervical images. The Gabor transform is initially enforced on the cervical images for converting all pixel intensity in a spatial domain into multi-resolution domain. The cervical image is classified into either normal or abnormal depends on features extracted from the various regions in an image. In this work, Discriminant features are separated from the restored cervical image. The extracted parameters from the Gabor revolutionized cervical image are optimized using GA algorithm, then the optimized sets of features are classified using the ANFIS classification approach. The proposed GA based CNN classification method is used for detecting and classifying the cervical cancer which describes the results are 99.37% of maximum sensitivity, 98.9% of maximum specificity and 99.21% of maximum accuracy, 97.8% of PPV, 91.8% of NPV, 96.8% of FPR and 90.4% of FNR.
In the future, some new techniques will be adopted to diagnose the cervical images. It classifies the cervical images based on the severity levels as ‘Early’ or ‘Advance’ or Surgery to prevent unexpected cases. Hence the healthcare professionals can suggest treatment according to the results. And also, the execution time of each stage will be reduced by integrating the pre-processing, segmentation, and classification done more effectively, hence the physician can get results well in advance than the expected time. As a final remark, new hybrid technology like FPGA based IoT and VLSI will be combined to develop a system for cervical image analysis. This system will be helpful for healthcare professionals to suggest treatment in an effective manner. The hardware implementation using FPGA will be done, and it will be tested with a real-time patient monitoring unit using IoT.
Conflict of interests
The Authors declare that there is no conflict of interest.