
Abstract
Purpose:
The purpose of this paper is to propose a pseudo-grey metabolic grey Markov model to deal with the prediction issue in which the original sequences are oscillation sequences.
Design/methodology/approach:
First, the original sequences were processed with the accelerated advection transformation and the weighted mean generation transformation to make them smoother. Then, the mean GM (1, 1) model was applied to the multi-step prediction of the pre-processed data sequences. Finally, with the help of the optimal partitioning method, the pseudo-grey metabolic Markov model was used to correct the prediction results and determine the final prediction values.
Findings:
The results demonstrate that the accuracy of this model is significantly higher than that of the traditional grey Markov model, which further verifies the rationality of the proposed model. Therefore, scientific and reasonable prediction of urban rainfall is of great theoretical significance and application value for the government and decision-making departments to formulate drought prevention and disaster mitigation measures.
Originality/value:
The model in this paper not only provides new ideas for the data preprocessing problem of the grey Markov model, but also solves the problem of errors due to individual subjectivity in state interval division. It provides a novel idea for the development of grey prediction models. The rationality and validity of the model are illustrated by taking the Zhengzhou City of Henan Province as examples.
Introduction
Coming into the twenty-first century, water resources became the scarcest resources and it is also is a key resource for human survival [1]. As we all know, rainfall plays a critical role in agricultural production, industrial construction and water resources flood control [2]. Meanwhile, rainfall is one of the consequential reasons for the occurrence of natural disasters such as floods and droughts. Rainfall changes are highly related to the development and utilization of regional water resources and even affect the development of society and the economy. In recent years, environmental issues caused by human activities and natural factors are becoming more and more severe and the frequency of droughts and floods is gradually increasing, in which society and the economy suffered huge losses. Therefore, accurate prediction of rainfall can provide scientific suggestions for flood and drought prevention and reduce the losses caused by natural disasters. There is large randomness in the rainfall process owing to the variability and complexity of meteorological conditions. How to predict rainfall more accurately has become a popular topic. A considerable amount of literature on rainfall prediction has been published. These studies have shown that the main methods for rainfall prediction include the ARIMA prediction method [3], classical correlation analysis [4] and Markov models. These models and methods have been investigated from different perspectives and obtained many meaningful results on rainfall prediction.
Raval first purposed machine learning algorithms and compared the performance of different models [5]. Then he developed a prediction model using the neural network. Finally, he did a comparative study of new and existing prediction techniques using Australian rainfall data. The results showed that both traditional and neural network-based machine learning models can predict rainfall with more precision. Fan developed a hydrological forecasting system using merged rainfall information from ground-based telemetric gauges and real-time TRMM satellite rainfall estimates [6]. By analyzing the 2011/2012 rainy season flood predictions and comparing results of deterministic and ensemble forecasts for the major flood of 2012/2013, the feasibility of the model was verified. He attempted to combine rainfall prediction from a high-resolution meso-scale weather model and a radar-based rainfall model [7]. Two rainfall forecasting methods were selected and examined: the weather research and forecasting model (WRF) and a translation model (TM). It was shown that results from WRF were very useful as an advisory of anticipated heavy rainfall event, whereas those from TM, which used information of rain cells already appearing on the radar screen, were more accurate for rainfall nowcasting as expected. All the above models can effectively predict rainfall, which lays the foundation for the development of rainfall prediction.
In 1907, Markov chains were first introduced by Russian mathematician A. A Markov. Gabriel investigated the sequence of daily rainfall occurrences and found that the daily rainfall model was consistent with Markov chains [8]. During the next hundred years, the application of Markov chains to rainfall has developed considerably. PEREIRA constructed the two-state Markov chain model [9]. In this paper, an answer to a similar concern about the model developed was given using the Bayesian Information Criterion (BIC) to establish the order of the Markov chain which best fitted the data. It was seen that the data generated using the optimal order are closer to the real data than before, except for two sites. Lu conducted a cellular automata-based Markov chain model based on fuzzy set theory and multi-criteria evaluation [10]. This study highlighted the need for integrating spatiotemporal modeling analyses, such as a statistical downscaling model driven by climate change with remote sensing and GIS. The research findings indicated that the mean rainfall will increase in the future near New York City. Wang proposed a scheme based on the improved residual multivariable grey model and Markov process [11]. First, on the basis of analyzing the multivariable grey model (MGM) and the Markov process, the improved residual MGM-Markov theory was expounded in detail. Second, a dual pre-warning scheme of transmission line icing was proposed based on the improved residual MGM-Markov theory. Eventually, the scheme was applied to predict transmission line icing in a province of China. The error was less than 5%, which proved its accuracy and applicability.
All of the above studies have greatly contributed to the development of Markov chains. Scholars have conducted the following studies for the problem of dividing the state intervals of Markov models and pre-processing the original data.
(1) In the division of state intervals: Ye introduced the central-point triangular whitenization weight function in state division to calculate possibilities of research values in each state which reflected preference degrees in different states objectively [12]. The method effectively solved the problem that the traditional grey Markov prediction model state partitioning process was mostly based on subjective real numbers, which affected the accuracy of the predicted values. Gong divided 61 annual low-temperature weighted indexes of 1951–2011 into five states using the mean standard deviation method [13]. The feasibility of the model was verified according to employing both the weighted Markov method and grey weighted Markov method to the real low-temperature states of 2010 and 2011. Lu divided the data series into several states according to the principle of equal probability, then applied the model to the prediction of Beijing subway passenger flow and verified its applicability [14]. The above models introduce the method of numerical calculation, which provides a new idea for state interval division. However, in terms of application, there are many existing problems about large time complexity and computational complexity.
(2) In the preprocessing of the raw data: Wang used a weighted Markov chain model for prediction. The idea of the model was a sequence of dependent random variables, which the correlation coefficients of each order portray the dependence of various step sequences and their strengths [15]. The optimal partitioning algorithm was used to determine the grading criteria. The annual rainfall data from 1951 to 2004 in Wuhan City was used to predict the rainfall situation in 2008, which proved the feasibility of the model. Chen proposed an improved weighted Markov chain prediction method to address the problem of smoothness of Markov chains [16]. The annual rainfall data from 1952 to 1998 from Hequ hydrological station in Shaanxi province was used to test, which proved the feasibility of the model. Miao established a weighted Markov chain model [17]. The model used the affiliation vector as the initial state vector in prediction and the normalized autocorrelation coefficients of each order as weights. Took the annual rainfall of Yulin City from 2009 to 2015 as an example, the relative errors of all prediction results are within 10%, which indicated that the model is reasonable and feasible.
The above models are considered as weighted Markov models, in other words, the raw data is a sequence of dependent random variables. To some extent, it promotes the diversification of Markov research directions. However, it is a question that how to consider the case where the original data are non-dependent variables.
The factors affecting rainfall mainly include geographical location, ocean currents, vegetation and hydrological conditions, etc. The extent, time, and intensity of rainfall occurring are uncontrollable, which leads to greyness in the statistical process of data. Grey system theory is first proposed by professor Deng, including the grey predicting model, grey decision-making model and grey association model, which is a useful tool to analyze small samples from different perspectives [18, 19]. The main advantage of the grey predicting model is that only a few data are required to obtain accurate predicting results [20]. In Deng’s work, the GM (1, 1) model is proposed, which is a grey model with first-order accumulation and one variable. Additionally, Markov models are suitable for forecasting problems with high randomness and volatility. The combination of both is used to construct the grey Markov model [21]. In the problem of state interval partitioning, the existing grey Markov models have the problem of large time complexity and computational complexity. In addition, most scholars start from the weighted grey Markov model and unbiased grey Markov model in the processing of the original data sequences when a grey model needs to be constructed. Therefore, conducting research from the data itself is an urgent problem to be solved.
Therefore, this paper constructs the following model based on the existing research. First, under the framework of the grey Markov model, we apply accelerated advection transformation and weighted mean generation transformation into the original data sequences filled with high volatility, so that the sequences perform more smooth; second, we use the optimal partitioning method to determine the state interval; finally, we apply this model to the annual rainfall prediction of Zhengzhou City, which verifies the feasibility and validity of the model.
Methodologically speaking, this model not only overcomes the complication of calculation in existing models, but also makes the division of state intervals more scientific and reasonable. The cluttered data series are appropriately transformed and then fitted combined with the mean GM (1,1) model, which promotes goodness of fit and prediction accuracy. In terms of application, the main influencing factors of urban rainfall are temperature, precipitation, unit surface water resources and unit ground water resources. Since scope, time and intensity of drought are uncontrollable, the statistical data often shows the coexistence of grey and randomness. It is reasonable to apply the model to urban rainfall prediction and the model in this paper can also be used for similar prediction problems.
This paper is organized as follows: In Section 2, the conduction of the novel grey model and the modeling steps are given. In Section 3, a practical case based on the data of Zhengzhou’s annual rainfall from 2009 to 2017 is conducted, followed by a further prediction from 2018 to 2020. The practical case is utilized to validate the novel model. And Section 4 is conclusion, which summarizes the whole research.
Model construction
Markov mode have been widely used in various fields since its proposition. Some scholars have extended it to high-order Markov models and combined it with fuzzy theory or grey theory, in which these methods demonstrated better performance. To address the existing problems of grey Markov model, scholars have improved it from the following two perspectives. On the one hand, state intervals are delineated by optimized methods, such as the hierarchical clustering method using Euclidean distance, the mean-mean-squared difference method and the equal probability principle for the delineation of state intervals. On the other hand, raw data is preprocessed. Most scholars used weighted Markov model where raw data is a sequence of dependent random variables. However, there is issues of calculation complexity in former and the processing of raw data is homogeneous in latter. Thus, the question how to resolve the sequence of non-random variables is needed to be done.
This paper proposed a pseudo grey metabolic Markov model to tackle two questions above. The model first processed the raw data appropriately and then applied a modified grey Markov model for prediction. Optimal partitioning is a clustering method that partitions data of n state into k classes where the intra-segment data variation is minimized while the inter-segment variation is maximized. This paper applied the optimal partitioning method to delineate state interval, which is the difficulties of this study. Given that the actual data series are mostly random oscillation series and the mean GM (1,1) model is most suitable for modeling non-exponential growth series, it is novel to firstly process the raw data in this paper. Next, the pseudo grey metabolic Markov model and the traditional modes were applied to predict the annual rainfall in Zhengzhou City, which indicated that the accuracy of this model has improved compared with the traditional model.
Data processing
Theoretically, every simple model describing the trend of monotonic transformation is difficult to describe the variation of oscillation sequences. The characteristics of rainfall data consist of volatility and randomness. Meanwhile, the mean GM (1, 1) model has a considerable advantage in building the model of non-exponential growth sequences. Owing to the reasons above, we adopt the accelerated advection transformation and the weighted mean generation transformation to preprocess the oscillation data sequences.
If ∀k = 2, 3, ⋯ , n,
x (k) - x (k - 1) >0,
the sequence X is a monotonically increasing sequence. If the inequality sign in formula (1) is reversed, the sequence X
is a monotonically decreasing sequence. If ∃k, k′ ∈ {2, 3, ⋯ , n},
x (k) - x (k - 1) >0
and
x (k′) - x (k′ - 1) <0,
then the sequence X is a random oscillation sequence.
M - m is the amplitude of the random oscillation
sequence, where
M = max {x (k) |k = 1,
2, ⋯ , n},
m = min {x (k) |k = 1,
2, ⋯ , n}.
Every sequence can be translated into a monotonically increasing sequence after the accelerated translational transformation.
The weighted mean generation transformation can weaken the randomness of the original data sequences. It also means that the volatility is diminished.
The traditional Markov model divides the state interval division according to the concentration of the error range so that the objective law of state change is satisfied in each interval. However, this division process is highly influenced by subjectivity. Everyone has a varied understanding of the relative simulation error concentration, which results in large randomness in the delineation interval. In order to weaken the randomness, we apply the optimal partitioning method to the division of state intervals. Optimal partitioning is a clustering method that partitions n state data into k classes. This clustering method minimizes the intra-segment data variation and maximizes the inter-segment variation. The detailed process is as follows:
Define state set E = {e1,
e2, ⋯ , e
n
},
and divide the n state into k classes. So we can get
class 1 is {e1, e2, ⋯ ,
e
p
}, class 2 is
{ep+1,
ep+2, ⋯ ,
e
q
}, dots , class k - 1
is {e
r
,
er+1, ⋯ ,
e
s
}, and class k is
{es+1,
es+2, ⋯ ,
e
n
}. Assume that
{e
i
,
ei+1,
⋯ e
j
} indicates one of the classes, whose
mean value of the state data is
Namely,
Calculate the minimum value of D (s + 1, n) and solve for the segmented point t k to obtain the class k, denoted as [t k , e n ]. In the same approach, we get the remaining k - 2 segmentation points tk-1, tk-2, ….
From the theoretical perspective, the traditional Markov model state intervals are divided according to the concentration of the error range, which has a strong subjectivity. This method reduces the randomness caused by artificial selection so that the divided state intervals are more scientific.
The one-step transfer probability matrix is
Marginality test
Let E = (e1, e2,
⋯ , e
n
) be the set of state, and
f
ij
represents the frequency that the
sequence is transferred from state i to state j in one
step, where i, j ∈ E. The sum of the
columns j of the transfer frequency matrix divided by the sum of the
columns of each row is called the “marginal probability”, denoted as
p
j
, where
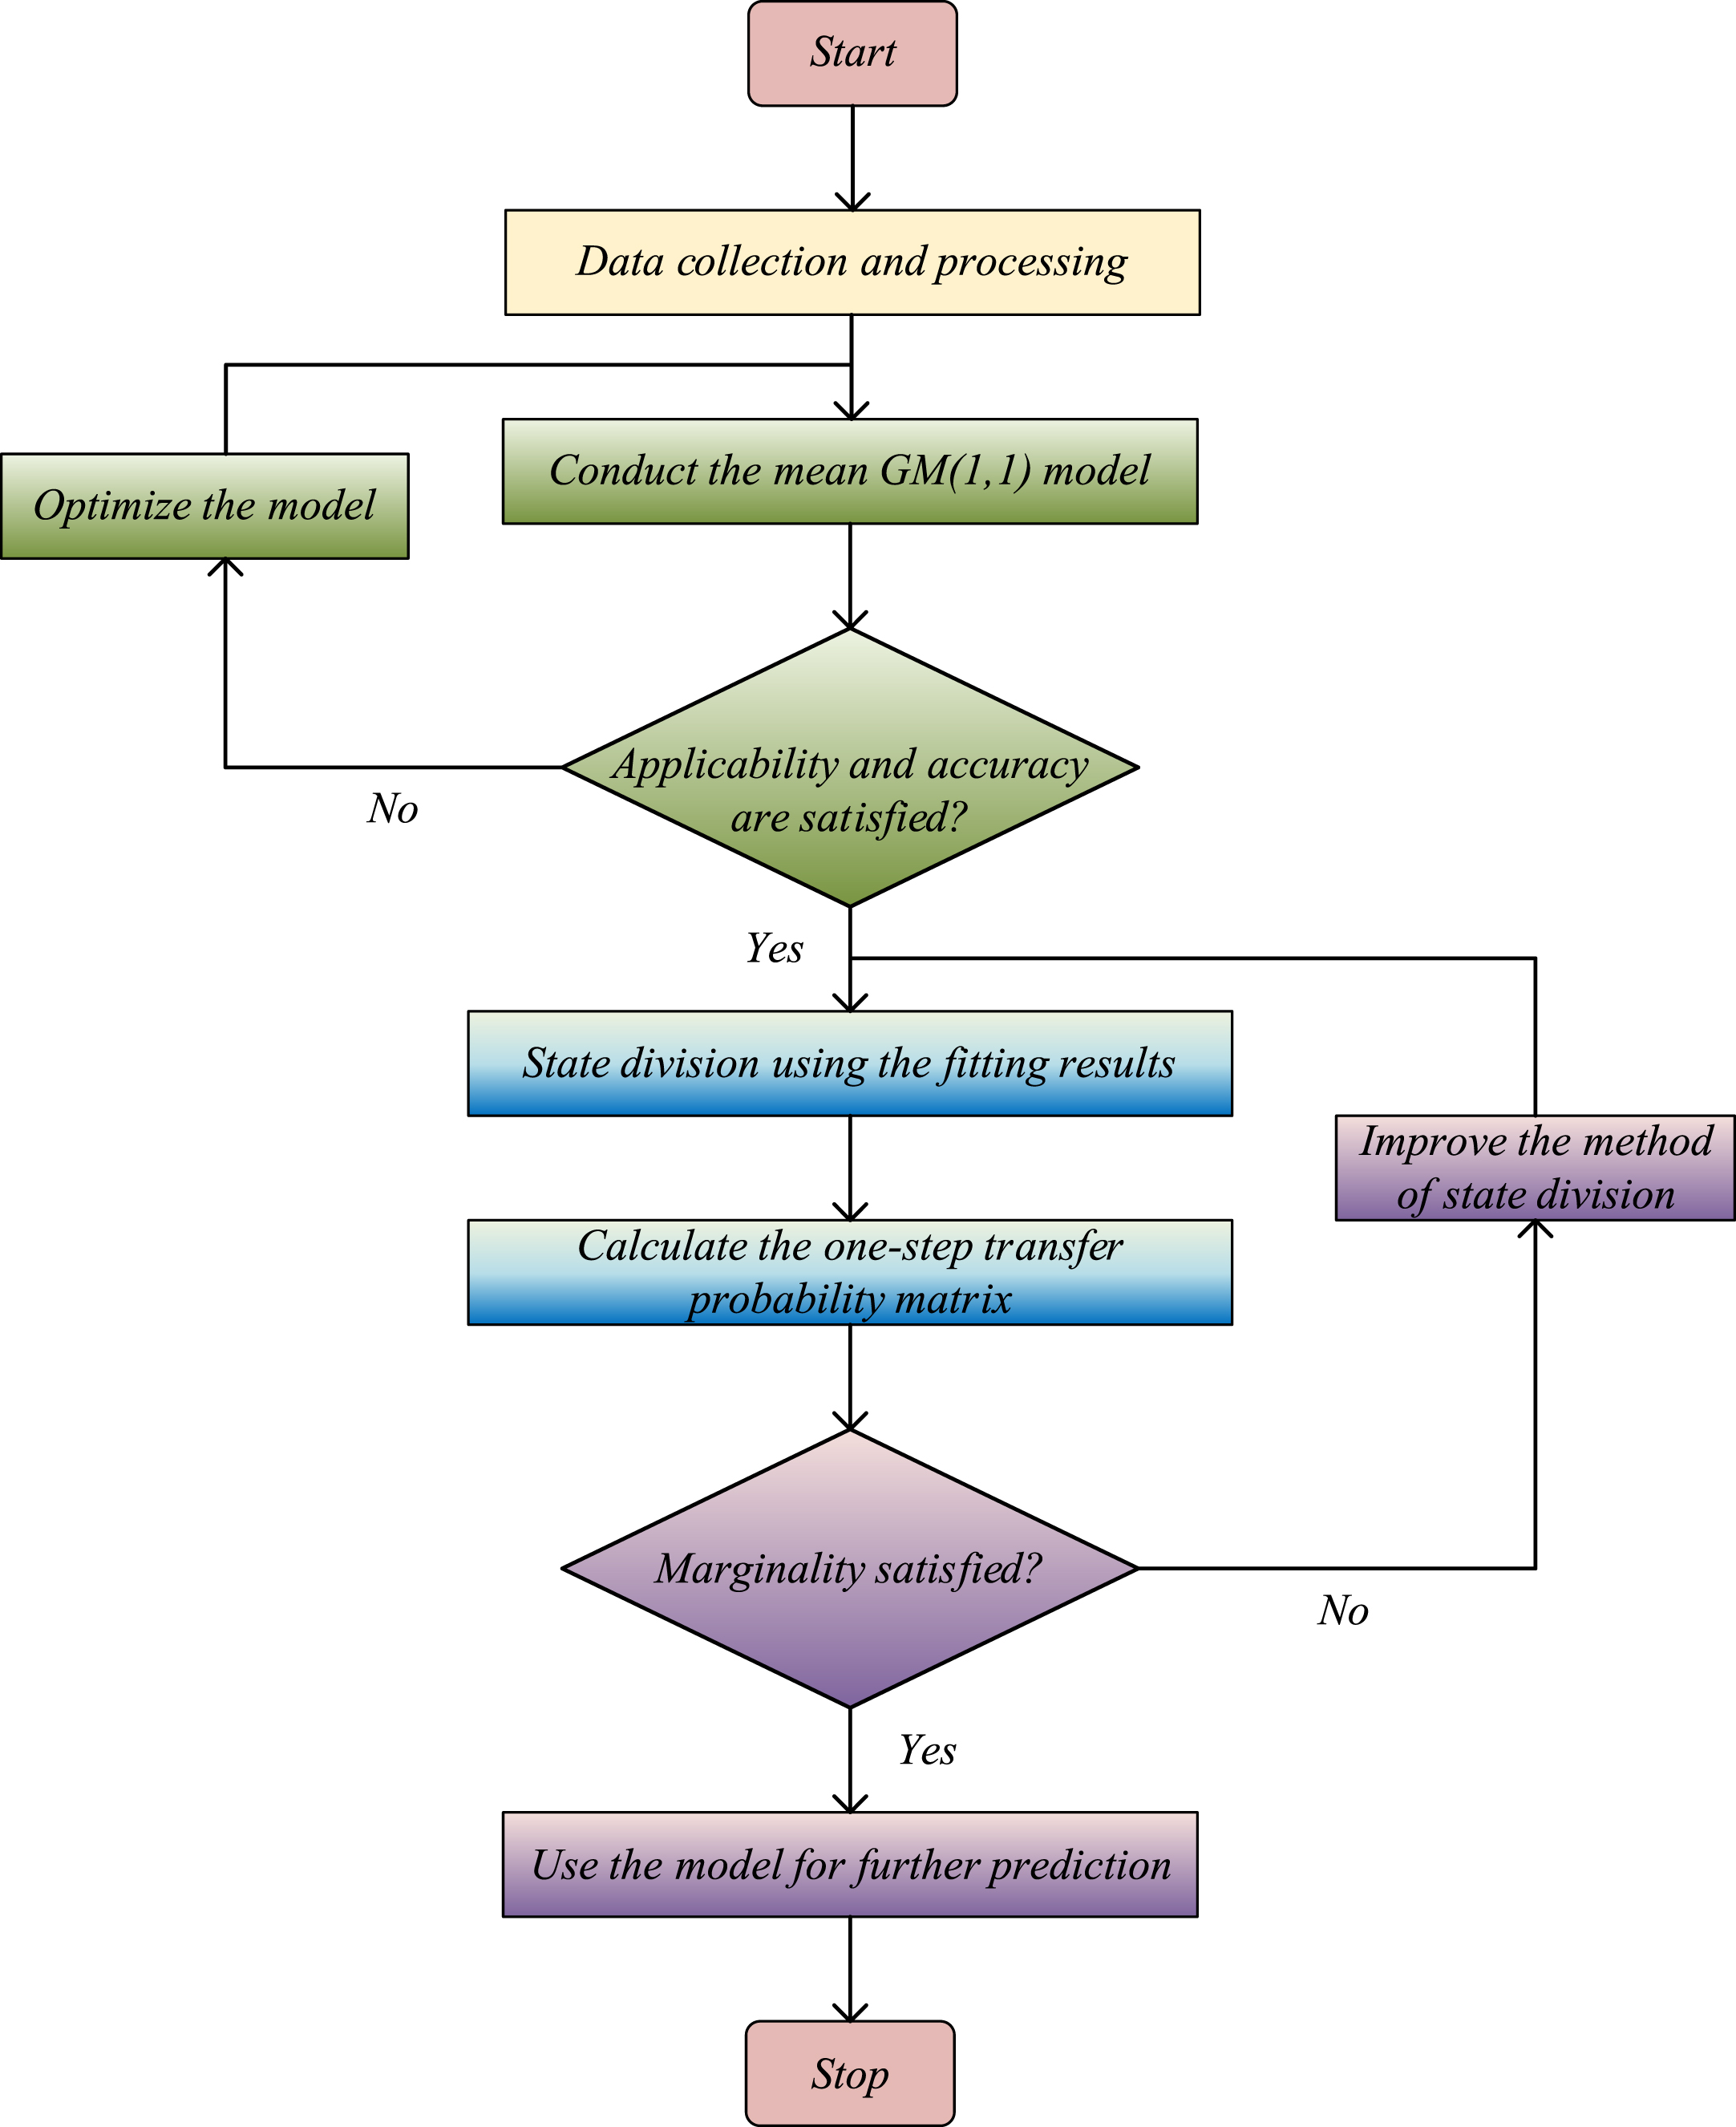
Modeling process of the novel model.
Let the initial moment of the sequence be in the state
e
i
, the initial state vector
Revised predicted values
The revised value of the predicted value is relevant to the next transferred state. Based on the idea of metabolism, we add the latest revised value into the original data in time without deleting the raw data.
Assume that the predicted object is next transferred to the state
e
j
, the revised value of the predicted
value is
Step 1: Transform all the raw data by applying Equations (6) and (7).
Step 2: Establish the mean GM (1, 1) model by regarding the transformed data as the raw data.
Step 3: Test the model’s accuracy and applicability.
Step 4: Delineate state intervals using the relative simulation error results of the fitting model as the set of state.
Step 5: Calculate the one-step transfer probability matrix.
Step 6: Test the Marginality of the model.
Step 7: Correct the predicted values by applying Equation (8).
Study area and data sources
Zhengzhou, the capital city of Henan Province, is located in the central north of Henan Province and the middle and lower reaches of the Yellow River, belonging to the Huai River basin. It covers over 7446 square kilometers (Fig. 2). Zhengzhou spanning 112.42°-114.14°E and 34.16°-34.58°N belongs to the north temperate continental monsoon climate with four distinct seasons, high temperature in summer, cold and dry in winter and uneven distribution of rainfall seasons. The rainfall in Zhengzhou is mainly concentrated in summer and is highly variable in different years, with large randomness of the rainfall process and the large fluctuation of rainfall data. Considering the situation that the rainfall sequence is filled with uncertainty, we apply the model as below to predict the rainfall of Zhengzhou in a more precise method.
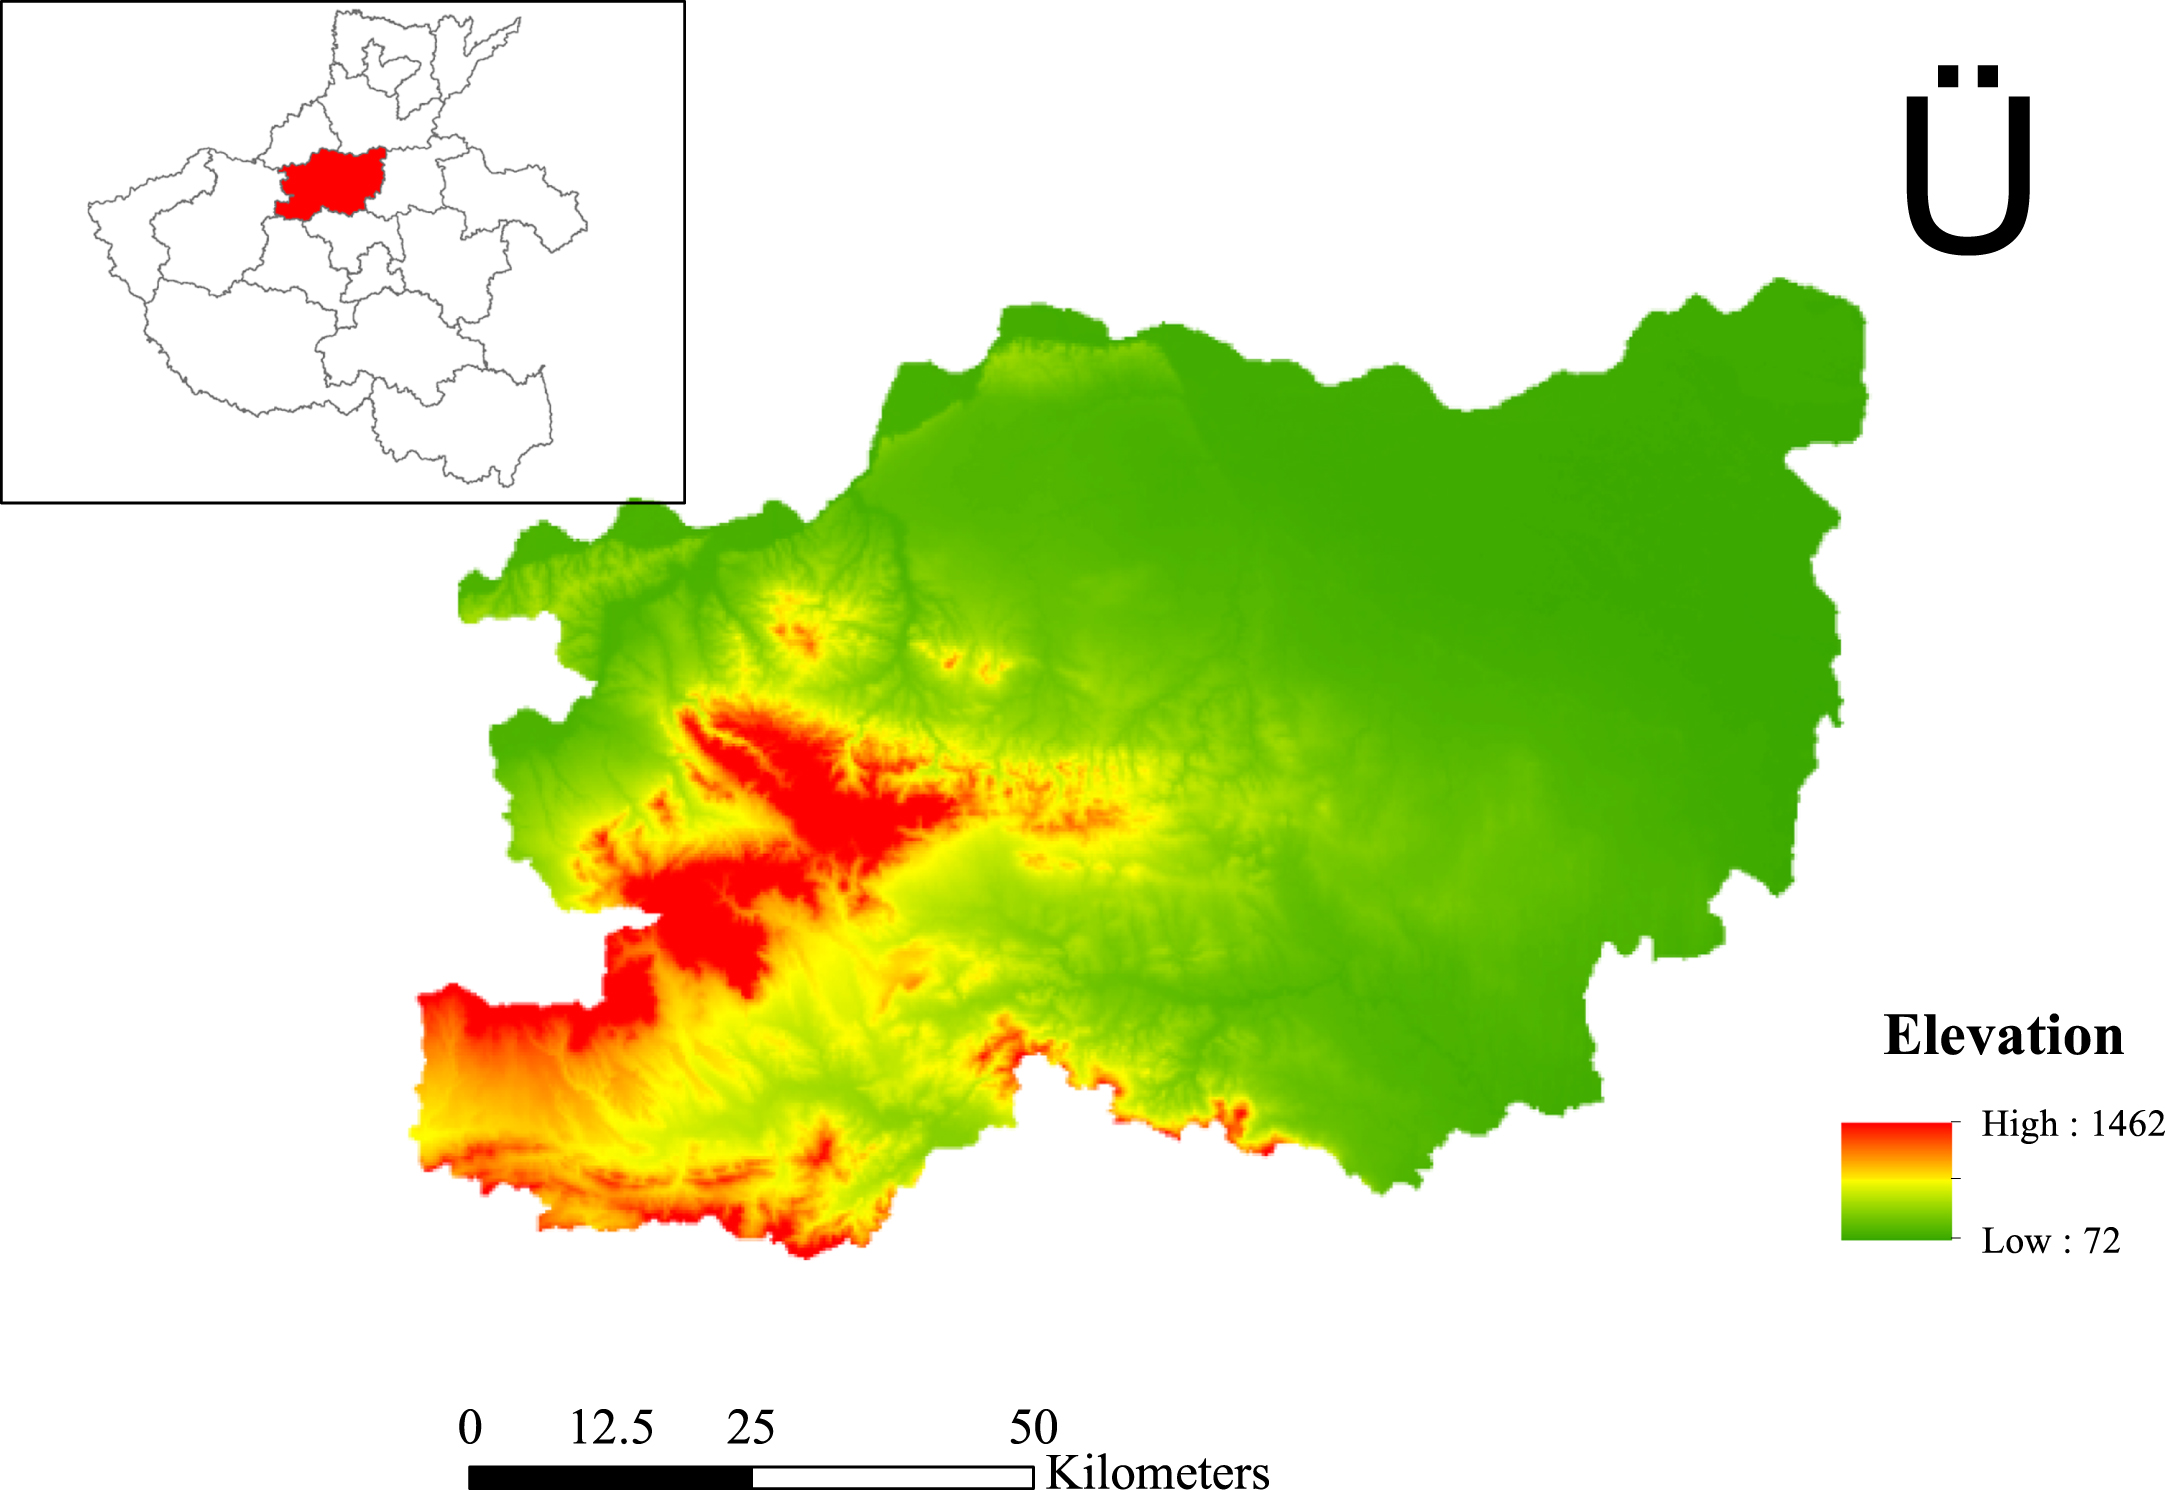
Location of Zhengzhou City.
The data in this paper are from the China Statistical Yearbook (2010–2020) and the National Weather Science Data Center (2020).
1. Data processing
All the raw data are transformed by applying Equations (6) and (7). The processed data are shown in Table 1 and Fig. 3.
Annual rainfall of Zhengzhou City in 2009–2020 (Unit: mm)
Annual rainfall of Zhengzhou City in 2009–2020 (Unit: mm)
Annual rainfall fitting results from 2009 to 2017
Prediction error belongs to the state
Table of marginal probabilities
As can be seen from Fig. 3, the raw data X is significantly volatile. Compared with the raw data, the data sequence d1 (X) has an obvious trend of monotonic growth. Compared with the data sequence of d1 (X), the randomness and volatility of the data sequence d2 (X) transformation d2 have been weakened. Overall, these results indicate that the sequence d2 (X) is the best choice to build the mean GM (1, 1) model because the sequence d2 (X) is more smooth than the other two.
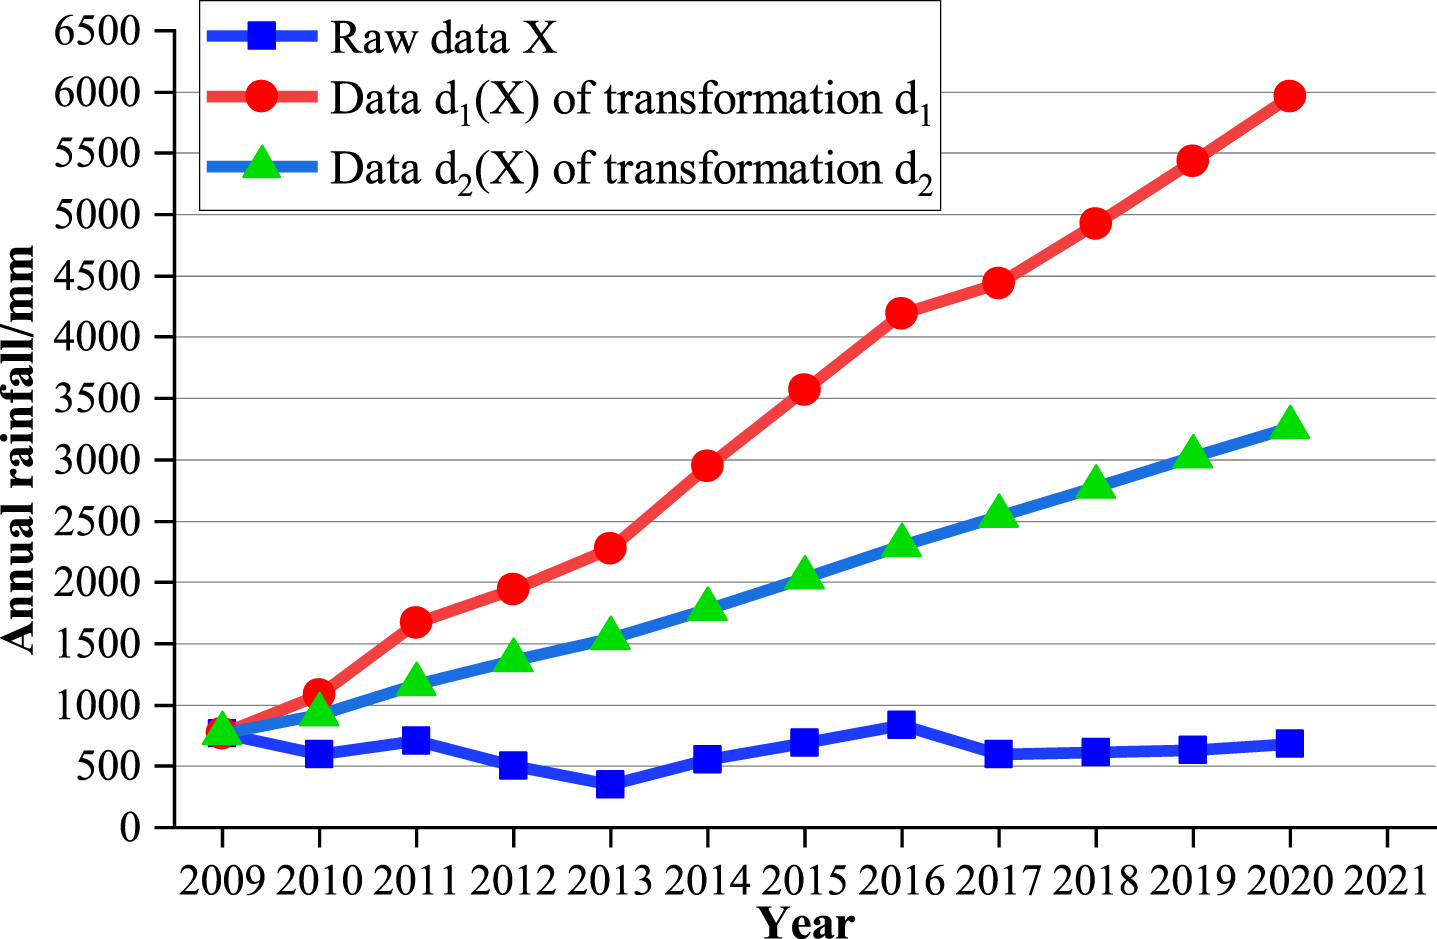
Comparison of two transformations.
2. Establish the mean GM (1, 1) model
We simulate the mean GM (1, 1) model by the method of replacing the raw data with the transformed data sequence d2 (X). The results are shown in the following table.
We apply the mean GM (1, 1) model to the annual precipitation prediction from 2009 to 2017. Figure 4 indicates that the simulation is consistent with the actual value except for 2010. The average relative simulation error we calculated is 2.708%, which has significant superiority in prediction.
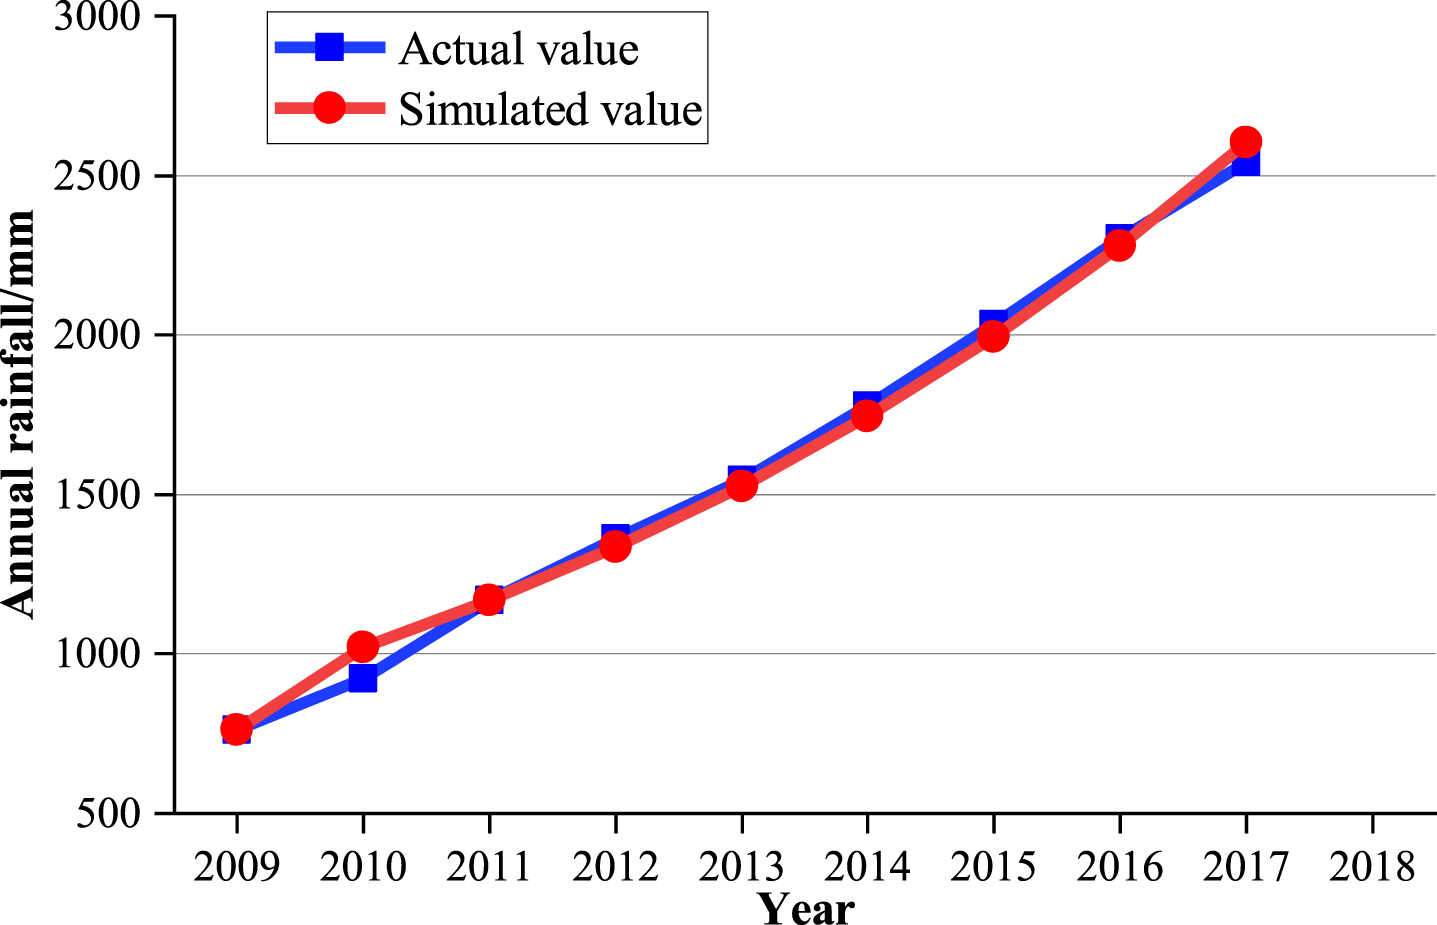
Fitting image of the mean GM (1, 1) model.
3. Model applicability and model accuracy test
The calculation results report that the grey model development coefficient a is –0.134 and the grey effect amount b is 853.290, where -a = 0.134 and -a < 0.3. Therefore, the model can be used for medium and long-term forecasting.
The calculation results indicate that the average relative simulation error is 2.708%,
i.e.
4. State division
The relative simulation error between the simulated rainfall and the actual value according to the mean GM (1,1) model yields the state data as E = {0, - 0 .10926, 0.00127, 0.01954, 0.01157, 0.01919, 0.01987, 0.01089, - 0.02506}. The data state is 9. We are proposed to be divided into four state intervals so that each state interval contains at least two values. The fourth interval is determined by the variance value and it means that the fourth segmentation point t4. It is calculated as follows: D(8,9)=2.7225×10- 8, D(7,9)=2.31267×10- 7, D(6,9)=4.77923×10- 5, and D(8,9)<D(7,9)<D(6,9). Therefore, the fourth-best segmentation point is e8, and it also means that 0.01954. The remaining three segmentation points are obtained in the same way. In summary, the final segmentation results are as follows: the first class: [–0.10926, 0]; the second class: [0.00127, 0.01089]; the third class: [0.01157, 0.01919]; and the fourth class: [ 0.01954, 0.01987.
5. Calculate the one-step transfer probability matrix
The one-step transfer probability matrix is
6. Marginality test
The frequency shift array
(f
ij
) 4×4 and the one-step shift
probability matrix (p
ij
) 4×4 can
be obtained from the above table, respectively.
The corresponding marginal probabilities table can be obtained from (p ij ) 4×4 is shown below.
The statistic
7. Revise the forecast value
We apply the mean GM (1, 1) model to predict the annual rainfall in 2018 and the
predicted value is 2976.8. Then we apply the Markov model to correct the predicted value.
Since 2017 is in the first state, we conclude that 2018 is most likely to be in the first
state. Consequently, the correction value is 2976.8/(1 + 0.5|-0.10926 + 0|)=2823.3; we get
the revised value of 2018 and add the revised value of 2018 to the original sequence to
predict the value of 2019. The predicted value is 3293.9. Thus, we can get the one-step
transfer probability matrix
Table 5 and Fig. 5 indicate that the average relative simulation error is 12.691% when we use the grey GM (1, 1) model to predict directly. The accuracy of the prediction is improved by correcting this predicted value using the grey Markov model. Considering the impact of new information on the sequence and the idea of metabolism, we add the corrected value of 2018 in time without deleting the data of 2009 while predicting the value of 2019. In the same way, we predict and correct the data of 2020. Finally, the prediction accuracy is significantly promoted and the average relative simulation error is reduced to 3.285%.
Predicted values of annual rainfall from three models in 2018–2020
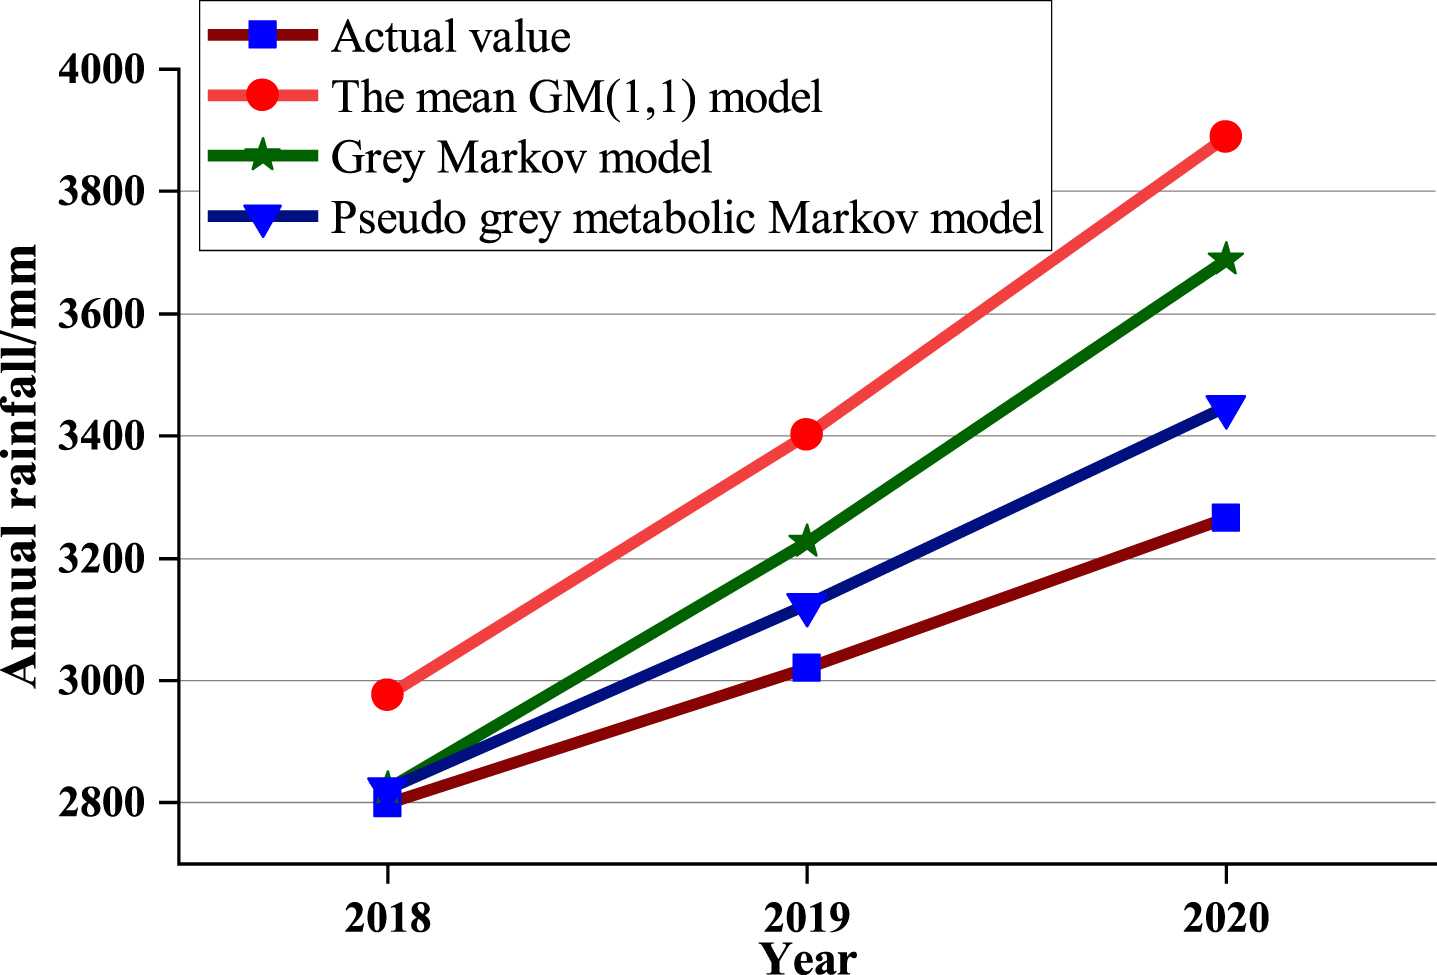
Predicted values of three models.
Urban rainfall data inevitably contain the characteristics of randomness and volatility, while the traditional grey Markov model has the disadvantage of unsatisfactory prediction accuracy. To improve the situation, most scholars try to improve it from the perspective of weighting and unbiased, whereas the problem of directly modeling the raw data has been existing until now.
Based on previous research, this paper uses accelerated advection transformation and weighted mean generating transformation to weaken the randomness and volatility trend of the raw data; constructs a pseudo-metabolic grey Markov model based on the mean GM (1, 1) model; adopts the Markov model to correct the prediction results with the optimal partitioning method. The main goal of the current study is to improve the prediction accuracy of the model using the raw data to the model. We apply this model to the rainfall prediction of Zhengzhou City from 2018 to 2020. The results indicate that the prediction accuracy of the novel model is much higher than any of the traditional grey Markov models. The model in this paper not only contributes a novel method to smooth and steady precipitation sequence, but provides theoretical support for the government and scientific researchers to predict urban rainfall scientifically and reasonably.
Footnotes
Acknowledgments
The work was supported by National Natural Science Foundation of China under Grant 51979106; Scientific and Technological Plan Project of Henan Province under Grant 182102310014; Key Research Project of Henan Universities under Grant 18A630030; and the Quality Curriculum Construction Project of Postgraduate Education in Henan Province (Grey Systems Theory under Grant HNYJS2015KC02). Postgraduate Innovative Project of North China University of Water Resources and Electric Power (No.YK2021-113).