
Abstract
A computational method for detecting pineapple ripening could lead to increased agricultural productivity. It is possible to predict fruit maturity before harvesting to increase agricultural productivity. A ripe fruit’s quality, its standard content of physical and chemical properties will increase the value of a good when traded outside the market. This paper studies and improves the Tiny YOLO-v4 model for identifying the pineapple ripening period. Researchers studied pineapples in a pineapple garden in Vietnam’s central region. They wanted to determine when pineapples were ripe. The API and the website are based on the YOLO innovation model. Apps and website APIs will be available for mobile devices so that people can monitor fruits. Technology transfer and academic research are combined in this study. We prepared the pineapple data set by using 5,000,000 pineapples harvested from the pineapple farm at different stages of growth. To make the measurements, we improved the YOLO-v4 algorithm. This results in a more accurate training model and reduced train-ing time. A 98.26% recognition accuracy is quite impressive. Research takes place at large-scale plantations, so the models are created from the data collected at the plantations and are used as labels; training takes a long time for the tiniest details about pineapples, and finding pineapple-growing regions takes a long time. The deep learning classifier was able to process pineapple plantation photos by using the camera on the mobile phone.
Keywords
Introduction
During the 4.0 revolution, technology access helped agriculture change its fragmented, small-scale, self-sufficient production system. The Vietnamese government is implementing various high-tech applications. In collaboration with technology companies, the researchers in [3] developed a model that provided rice growers with the best cultivating variety. Smart farming (slow fertilization, one-time spraying of probiotics, use of solar sensors to regulate water levels) has helped produce 7 tons of rice per hectare with fewer seeds, pesticides, fertilizers, and sprays, all while saving labor.
In [3], we proposed solutions that enhance productivity, output, and economic efficiency. The solutions created state-invested processes, and our research team created unique product lines. The new products underwent many trials before they reached their market. Besides, they are continuously improved and advanced to meet the constantly changing needs of the market. Though many models lack intelligent applications, for example, recognizing ripe fruit during harvest and identifying microalgae species along Vietnam’s coasts.
Agriculture technology, along with its ancillary industries, is advancing rapidly around the world. Four trends driving the 4.0 revolution are big data, cloud computing, the internet of things, and artificial intelligence. We can automate almost any agricultural task with the Internet of Things (IoT) systems, such as monitoring moisture levels, pH levels, dispersions, watering, etc. We can use artificial intelligence such as deep learning to solve real-world problems. There are concerns regarding the agriculture sector in Southeast Asia, particularly Vietnam. Invasive diseases can severely reduce productivity when planting before testing soils. If we detect ripe and unripe fruits (and sort them appropriately), we can boost harvest yields and quality while predicting harvest times. For example, robot harvesting systems can use this localization system [1, 6].
In recent years, along with the strong growth in output of agricultural products in general and fruit in particular, the issue of food quality and safety has become more and more concerned globally. Survey of non-destructive research methods of fruit from the Scopus database in the period 2016–2020 has many researchers applying this technique. Botany researchers focus on methods such as Methods based on acoustic characterization technology; Methods based on an electronic sense of smell; Near-Infrared Spectroscopy and Computer Vision Methods.
In this paper, we propose improved research based on deep learning and computer vision models. With the improved solution of Loss Function, the training time has been reduced; classification time. Computer vision solution does not destroy ripe fruit only through appearance feature. Based on the external features with internal parameters of fruit, some quality parameters such as maturity, growth, and quality can also be estimated for classification needs using this technique. are us in a research direction of fruit classification and disease diagnosis of pineapples and proposed cure methods. Increasing the input enriches the image data with the improved technology of the object detection algorithm. With the training process, the data set is processed based on the feature labeling technique. The identity test model is improved based on the Loss Function objective function. The detection of objects based on the reinforcement technique can be performed using the Fast R-CNN deep learning algorithms. In this study, we adapted the content from an article published in the proceedings of the IC2IT international conference held in Bangkok, Thailand in 2021.
The rest of the paper is structured as follows. In section 2, we present related work. We describe data accumulation, annotation tool and its usage and literature survey is discussed in section 3. In section 4, we present our proposed approach. In section 5, we present our proposed algorithm improved. Experimental results are detailed in Section 6. Finally, we conclude with future work directions and limitations in section 7.
Related works
Redmon [18] introduced YOLOV1 in his May 2016 paper, "Unified, Real-Time Object Detection: You Only Look Once". By applying this method, real-time object detection can be accomplished. In April 2018, the YOLOV3 algorithm was published along with the paper "YOLOV3: An Incremental Improvement.". YOLOv4: Improved Object Detection Speed and Accuracy was published soon after. The accuracy of YOLOV4 is higher and it is faster than YOLOV3. A significant improvement was made to YOLOV5 by Glenn using PyTorch [27]. YOLOV5 now runs faster than prior versions.
Real-time detection is done with the Tiny YOLOv3. There are seven convolution layers with 3x3 convolution kernels, one with 1x1 convolution kernels, and six layers of max-pooling to reduce the parameters in the Tiny YOLOv3 trunk feature extraction network. Based on the output feature map of a two-scale prediction network, an object is predicted as thirteen by thirteen and sixteen by sixteen.
An improved ResNet50 identity model architecture model was announced by Nguyen [3] In the author’s experiment to identify and classify fruits, the author’s team proposed three additional classes: Dropout, Dense, and Softmax.
Ross Girshick, Shaoqing and Joseph Redmon and colleagues provided the research models here, we found that there are differences in applied algorithms, calculation time and the performance of solutions are different [17, 23]. A neural network-based method for image detection in low visibility conditions was previously described by researchers Nguyen et al. [8].
Two research groups of Zhong-Qui Zhao, Ross Girshick, proposed model (R-CNN) [6, 23]. This is a basic technique that uses Neural networks to detect objects, but this technical solution requires a lot of time. processing time. The input to the technique using the R-CNN model is an image that is extracted into small dimensions called area suggestions for ease of handling. The R-CNN model uses a selective search method to extract reference ranges, areas that can be divided into groups of three objects or a set of objects. Selective search provides a range of candidate suggestions. Next, all of these regional proposals are packaged and sent to the cumulative Neural Network (CNN) [20]. Then, use the Support Vector Machine (SVM) to classify the presence of the object [16].
In recent years, researchers have improved the CNN model that processes each image of one input one after another, announcing the R-CNN improvement model. The R-CNN model has a faster computation time, the research method uses a region of aggregated group of the same size to create a fixed-size vector of regional proposals. Quick R-CNN provides all images based on CNN training techniques to create cumulative feature maps. The Softmax function is used in the FC class to classify objects [6, 21].
Recently, the Fast R-CNN technical solution has shown to be more effective than the R-CNN method, the input images are included in CNN to create feature maps. Regional suggestion network (RPN) is used to create regional recommendations instead of selective search method in R-CNN and Fast R-CNN. RPN method helps reduce the time in the process of making regional proposals. Subsequently, regional proposals were presented for the lumped class to create a fixed size [6, 17].
Mask R-CNN use the same basic structure as Faster R-CNN. The method Mask R-CNN able to align pixel-to-pixel and has a better instance segmentation while the pooling layer in Faster R-CNN unable [6, 18].
Recently when detecting subjects researchers use YOLO algorithm. The YOLO algorithm has effectively brought the fact that it is faster, stronger and more efficient than all previous R-CNN families. For the R-CNN family, multiple regional proposals need to be created and included in CNN to predict and locate objects. The YOLO algorithm used does not need to generate regional suggestions, it uses a single convolutional network and only sees the algorithm of the image once in the image [6, 18].
The image is divided into grid cells then creating bounding boxes. For each bound box, the model gives a layer probability to position the object in the image. Deep learning method is used a lot and performance is increasingly improved. However, if models detect new objects, the model needs to retrain the models to recognize both old and new objects. Usually, training a deep learning model requires a lot of training data due to the large number of model parameters. The detection of objects by deep learning is no exception. It is a process that consumes time and calculation. Therefore, this study aims to propose a model of increasing object detection by quickly detecting and avoiding retraining of [6, 18].
Bargoti [13] used method detect fruit in orchards by implementing a Faster-RCNN to localize fruits (mangoes, almonds, star apple, and apples), but method of Bargoti [13] not to detect ripening stages.
Tian et al. using YOLO-v3 and detecting different growth stages of apples in orchards. The ripening detection problem in requests to train different stages of apple growth as discrete objects and therefore, so it would induce immense training costs [4]. S. Kim et al, proposed detection stage added to the model given by [9].
In the next section, we propose the algorithm to detect YOLO object detection that attempts to reduce the size of members of an input feature to be used for convolution. It differs from the previously proposed ones on the point that it relies on finding the regions of difference within the input features between consecutive frames on a frame by frame basis.
Proposed method
In this section, we firstly give a brief background of the YOLO object detection algorithm. The relationship between the members of features in some layers are highted. Then, we extend the relationship to cover all the layers of the YOLO network in order to accelerate their internal processes. The objective of the article is to provide technical solutions for detecting faulty pineapples for specific classification after the remaining pineapples is free to detect ripe fruits. The proposed method is implemented by the improved YOLO Object Detection Algorithm [18, 28].
YOLO Oject detection
Redmon et al. [18] announced YOLO-v3, is an improvement of YOLO-v2 and YOLO [7]. The technique of YOLO algorithms to detect objects is unlike the method of Faster RCNN, Family CNN was previously published. YOLO-v3 uses a combination of regression techniques, bounding boxes processing, and class probability calculation through regression. This innovative solution has increased the computational speed, thus yielding quite high test results.
The image of input data collected is divided into a matrix grid (S × S) by YOLO V3. If an object with a center is predicted to fall into a certain grid, then that grid is responsible for detecting the object. Check by browsing by column and row of the grid matrix. If no object falls into the grid, the test object cannot be detected, resulting in a zero-trust score. YOLO V3 proposed method in the paper, using the row-and-column calculation to delete the checked objects. This technique will gradually and gradually eliminate the object that has been marked. As a result, the solution selects the best limit boxes if more than one limit box detects the same object. The technique also solves the object layers in individual grids, it also calculates the number of bounding boxes and the probability of detecting the object classes tested [5, 10].
Suppose that we can find a model for each image of a pineapple, illustrated by the coefficient column vector w
i
, and b
n
such that the identification of an image to an item can be calculated using a linear function.
where s
n
is the number of items that the n
th
image:
By using upsampling, the Tiny YOLOv3 predicts accurately and combines features effectively. As part of Fig. 1, the 13 x 13 feature map passed through the convolution layer and upsampling layer. With this method, you’ll get a 26x26x256 feature map from 13x13x512. By concatenating the previous network and the upsampling feature, the 26x26 feature map is also taken from earlier in that network. As a result, a 26x26 output feature map is generated. As all grid cells within a grid are predicted by Tiny YOLOv3, the target is detected. The input image is divided into NxN grids. Finally, the bounding boxes and confidence for each classification for targets are proposed. This formula is
where
where, B
gt
= (x
gt
, y
gt
, w
gt
, h
gt
) represent the position of the ground – truth, and B=(x,y,w,h) represents the position of the predict box. Therefore, the IoU loss function is suggested to be adopted for the IoU metric.
ResNet100 Fruit Recognition Model Architecture improved.
Tiny YOLOv3’s [27] loss function consists of three aspects: bounding box position error, bounding box confidence error, and classification prediction error between the ground truth and predicted boxes. It can be expressed as follows:
The confidence loss function is that
The classification loss function is:
where
The bounding box regression loss function is:
where IoU is intersection over union between the boxes hat are predicted bounding box and truth bounding box. w gt and h gt are the truth width and height of the bounding box, respectively. w and h are the predicted width and height of the bounding box, respectively. ρ2 (b, b gt ) denotes the Euclidean distance between the center point of predicted bounding box and truth bounding box c is minimum diagonal distance of box that can contain the predicted bounding box and truth bounding box.
Where (λ
coord
, λ
noobj
) are the weight parameters and given in advance, the latter is much smaller than the former, (x
i
, y
i
, w
i
, h
i
) is the ground truth boxes after normalization.
And
As demonstrated in the second line, this is the prediction for the level of confidence in the actual box prediction results as compared to 1. Three lines indicate the classification error between the expected and actual results. In addition,
Pineapples regions detected by YOLOV3 R: Ripe UR: Unripe.
Certain conditions must be met before loss functions can be compared to overlap rates. Despite these drawbacks, IoU loss functions can be difficult to optimize. Gradients require that boundaries overlap to function. The bounding box is also an indicator of distance loss (DIoU). The three factors that determine the bounding boxes are the aspect ratio, the distance from the centre, and the overlap rate. Definitions of CIoU and DIoU are closely related. It is necessary to consider aspect ratio consistency when determining the CIoU loss function.
In Fig. 6, c represents the diagonal distance of the minimum closure area that contains both the prediction box and the ground truth, where b and b
gt
denote the centre points of B and B
gt
, p (.) is the Euclidean distance, and c is the diagonal length of the smallest enclosing box covering the two boxes. As shown in figure 6, the d is the distance between o and o′, and the o is the centre of the product box, and o′ is the centre of the ground truth.
where α is the positive trade-off parameter, and ν measures the consistency of aspect ratio. The α is defined as
where
The
Maximum-pooling models are more general because they have fewer parameters. Three levels of pooling are available with SPP-net. Due to its reduced pooling scale, YOLOV3 was also able to process data at a slower rate. The pooling here consists of five layers. Additionally, separating contextual characteristics enhances the receptive experience. With this method, tiny YOLOV3 can be extracted. Two superimposed layers and two convolution kernels are used to produce two different feature maps. Figure 3 illustrates this by using a maximum pooling dimension of 16x16. Since context is absent, there is an astounding amount of receptive information.
Input frame (to the Yolo model) B. Output detections.
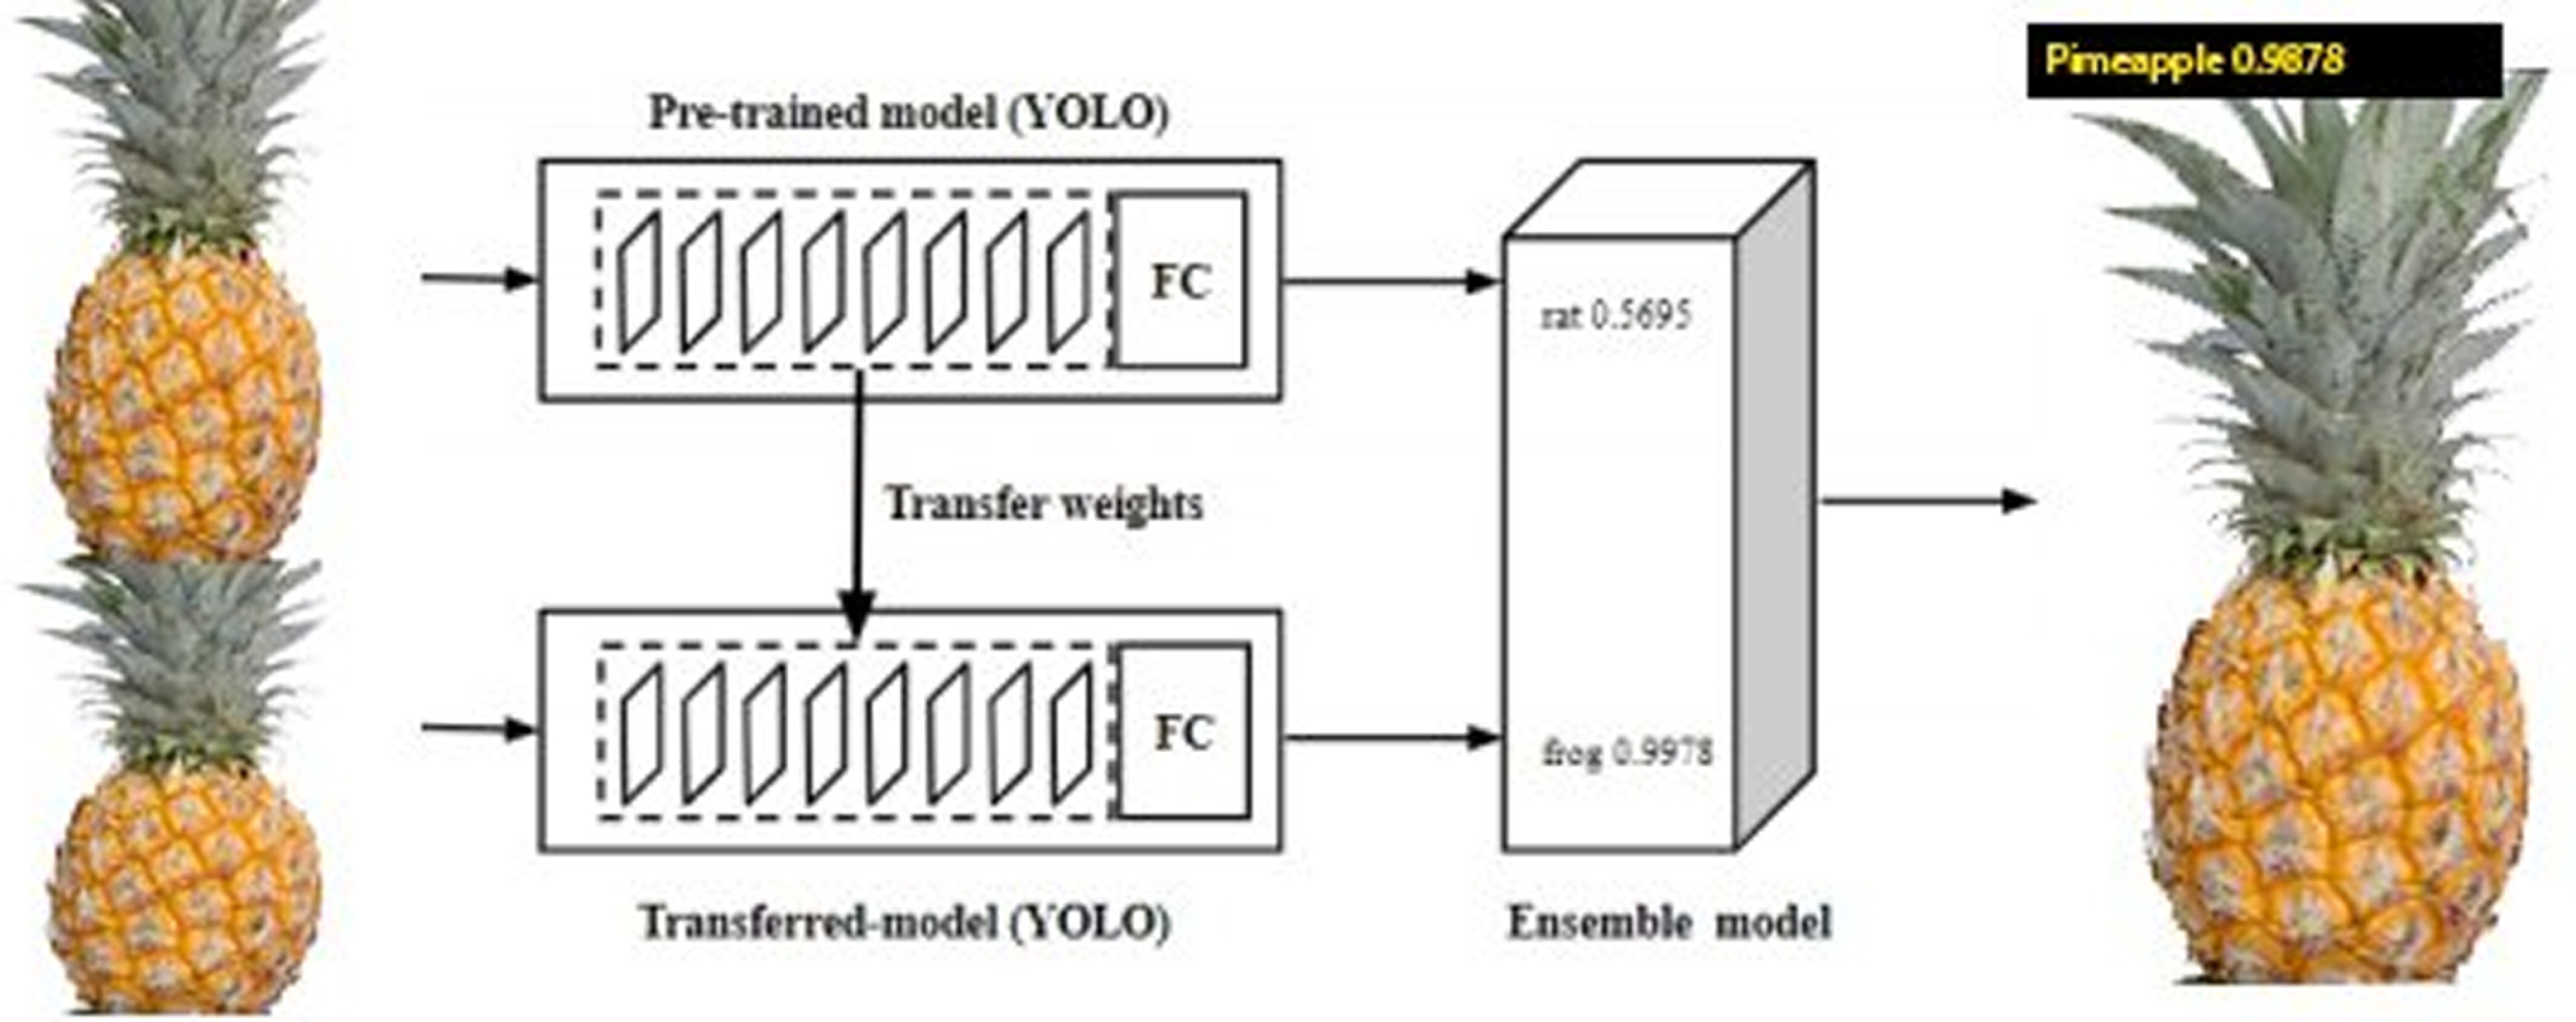
Previous studies have shown that the pre-trained model has yielded satisfactory results in test scenarios such as VGG etc. In the paper, Resnet architecture was used as the backbone for classifying images from images collected by the data warehouse. Resnet technology is assessed quite quickly in training the given sample images, reducing lost signals, increasing the appearance effect and having quite high accuracy. The test scenario has progressed with the Resnet100 architecture for the task of categorizing the training images obtained [19].
Figure 5 illustrates the object detection process by the proposed model of the paper. After calculation, by using the mesh matrix browsing method (SxS), the objects are detected and the probability that the class is detected. The model detected an object of a ripe pineapples when the skin color turned to a glossy yellow with a probability of 0.9868. The following results were tested and continued after that, with positive results. The corporate model should choose the highest probability class as the most accurate final decision [22].
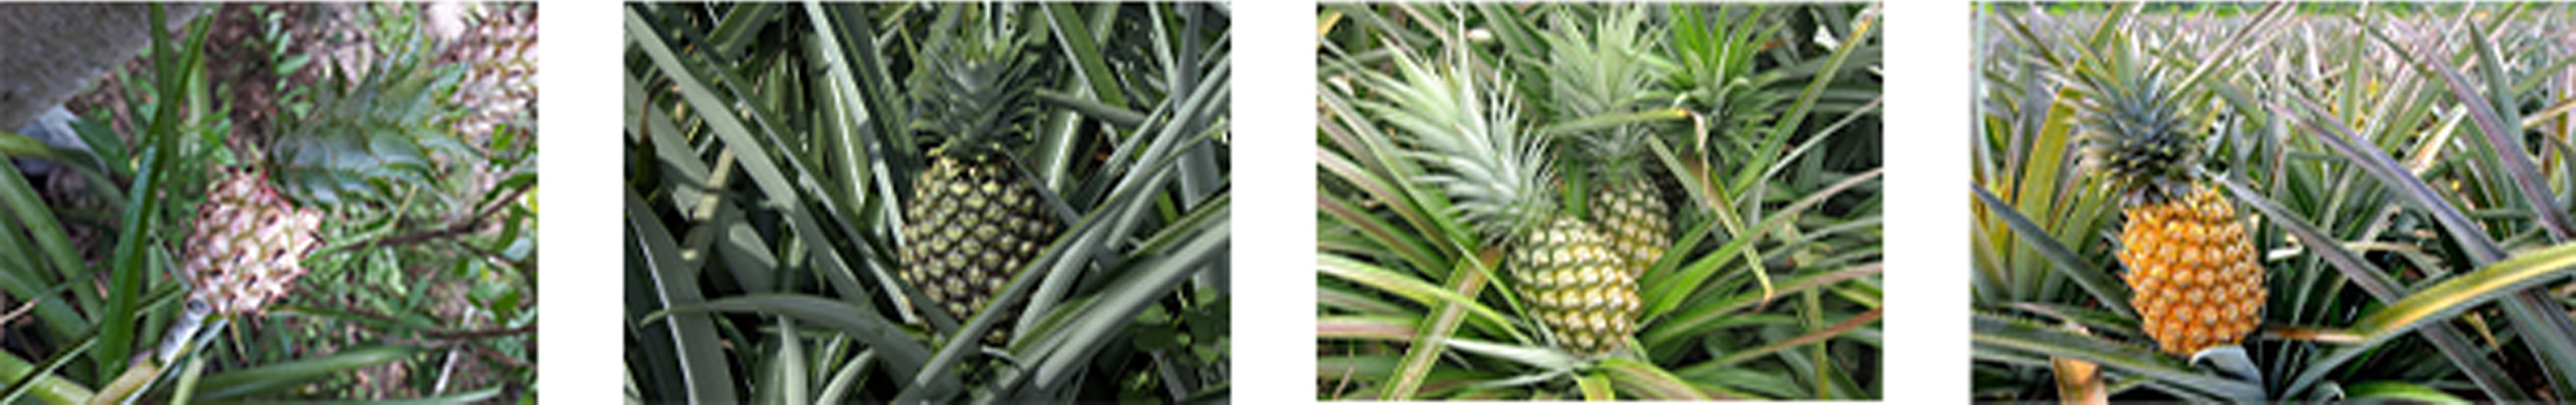
Sample images from the data set.

Resulted performance for Training vs Validation phases (baseline model).
Real time detection of ripe pineapples is an extremely difficult problem. Therefore, in this paper, technical solutions are divided into 5 stages. First, processing input data, sorting, and training data sets are images of pineapples by toolkit YOLO V3 improved.
Secondly, in the step presented to build a degree classification procedure based on CNN Resnet100 architecture. In this step, you can classify ripe or unripe fruits.
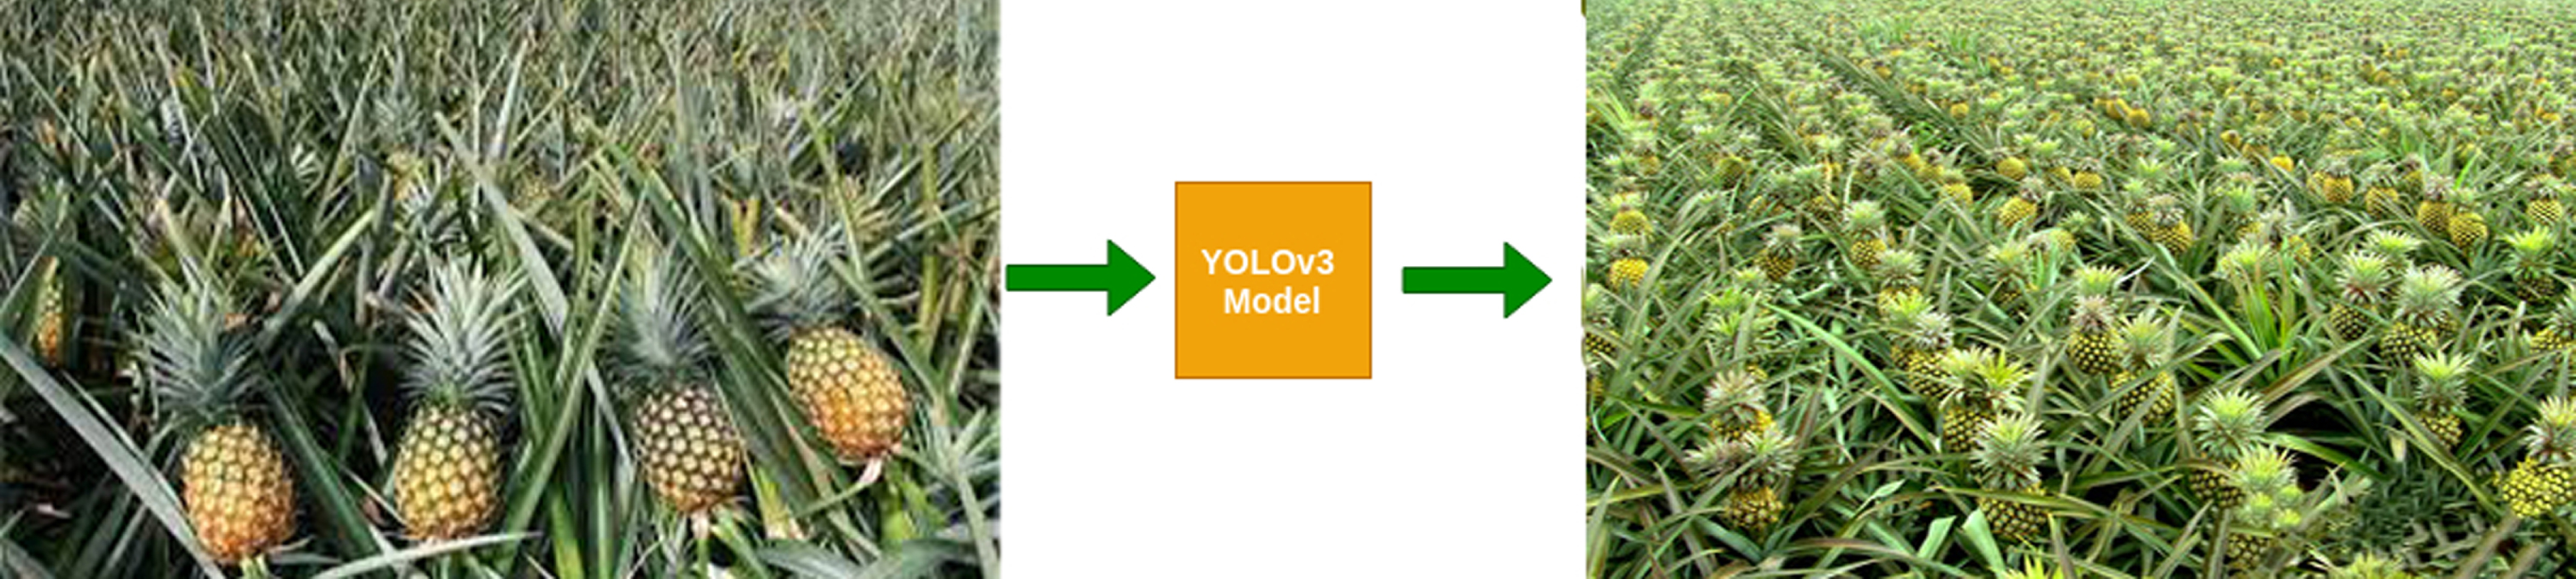
In the real-world scenario, when conducting experiments on agricultural farms in Vietnam, when the input data set is an image of pineapples from agricultural farms sent to the improved YOLO-v3 network. Experiments can detect ripe, unripe pineapples based on the graded frames trained. Through practice, it can be segmented into useful tasks that help warn decisions to assist farmers, in the classification process, as well as diagnose pests and diseases that affect the standard fruits. be planned. Helping farmers to stop growing spraying and preventing pests and diseases, etc.
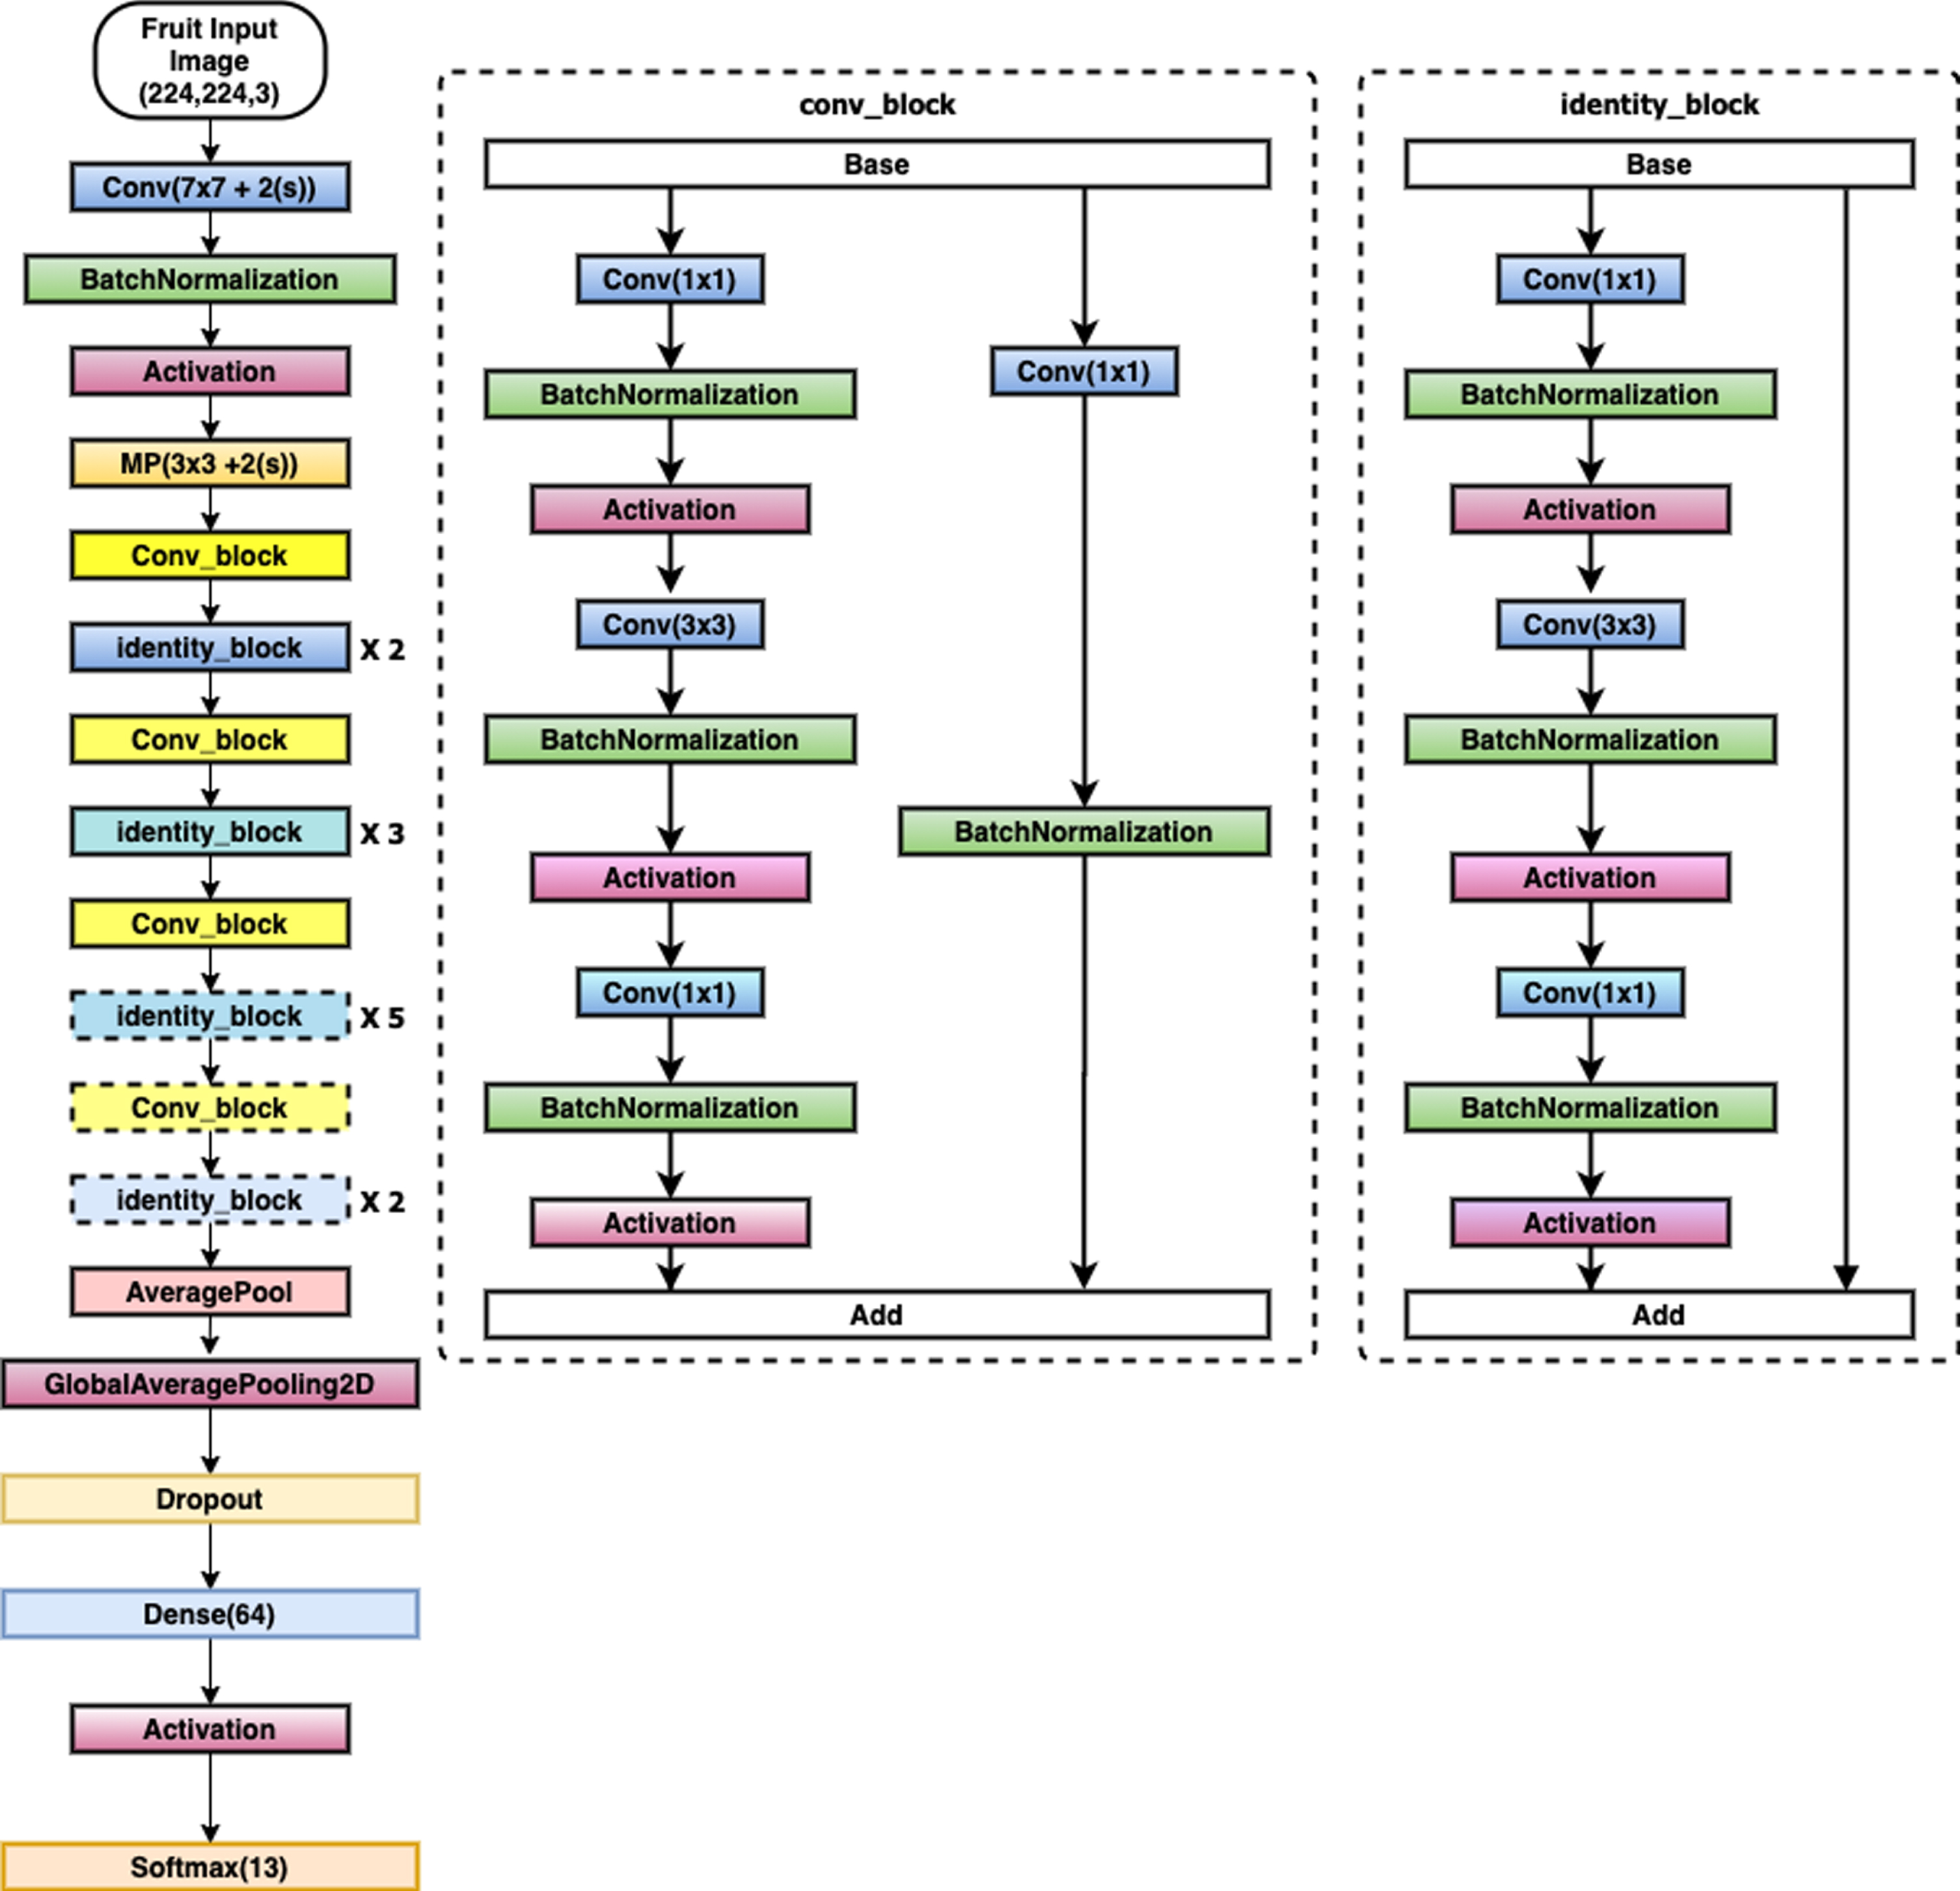
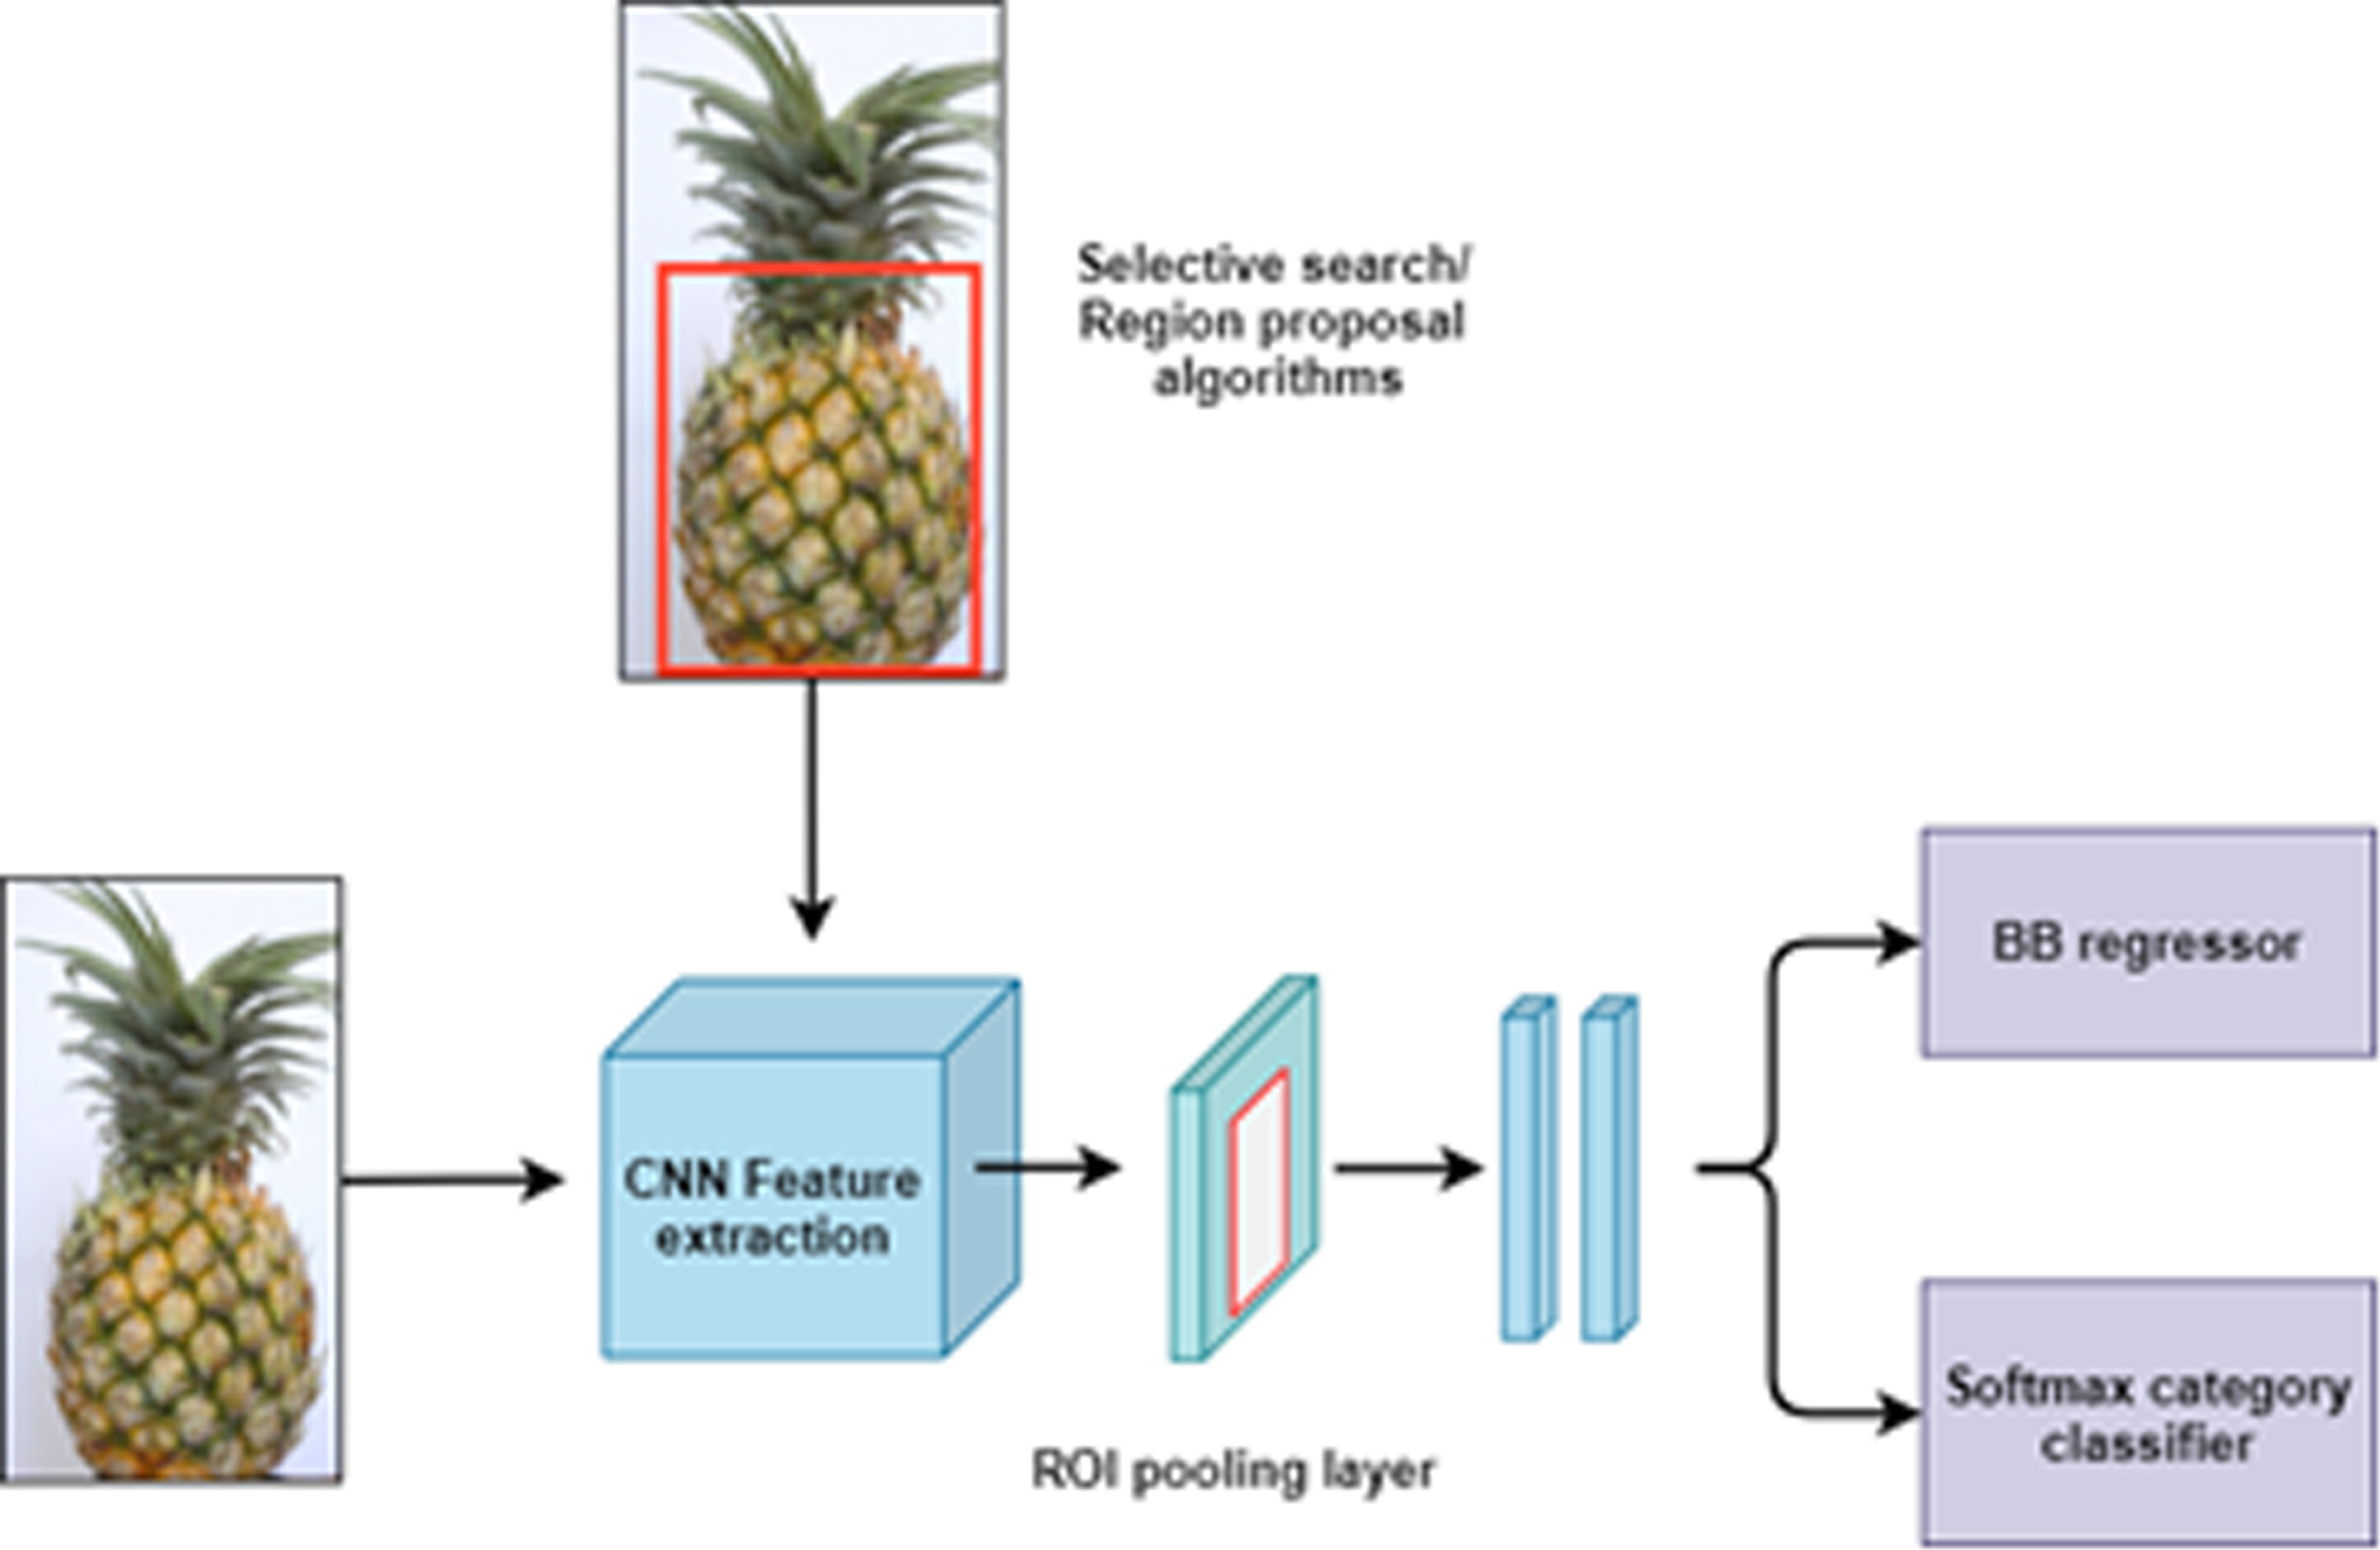
An automatic fruit identification system was developed using computer vision and image processing techniques in the food industry. Segmentation simplifies image analysis by combining attributes of the image and the descriptor used to extract features. Figure 1 illustrates the architecture of the system, which takes into account the fruit’s colour, shape, size, and texture.
The input of the system is a data set of fruit images automatically collected in the actual field by digital means; application of IoT technology in farming [24]. The user must provide an input pineapples to the system by specifying the path of the image. The user will then get the output of the name of the fruit along with the input image. Fruit prediction is performed using the YOLO object detection algorithm improved in Renest100. There are two models, one for identifying fresh fruit and the other for identifying rotten fruit.
YOLO improved model detected only 90 out of 100 pineapples, present in the input frame in Fig. 6 achieving the mean accuracy of 90%.
Fast R-CNN).
Nine steps are involved in the data set processing: The first step will provide the system with an image dataset. The second step is to store the data set in the system’s memory. To process this image data set, we will rough process it by removing image noise to get a clear image. We will further process the image data by extracting its features. Detect and remove image borders by using features such as border detection, patterns, and colours. The pattern of the image is used to identify the defects on the fruit surface and the skin surface of the fruit. To determine the colour of the fruit, the RGB colour model is used to determine the mean and variance. Resnet100 library uses the improved YOLO object detection algorithm based on the above features.
The performance of machine learning, a subset of deep learning, has made it one of the most popular types of data. As an example, we can use Yolo to classify images using deep learning algorithms. By using Resnet100, YOLO models can be built more quickly in Python. Several layers are used in this model to use CNNs, including Conv2D and MaxPooling2D. The 2D convolution layer is also known as the CNN layer used for 2D convolutions. Each layer input is convolutional simultaneously with dozens of outputs. MaxPooling 2D renders spatial data numerically, representing objects by numbers. An aggregation that selects the maximum element as an operand is called a maximum aggregation. The map can then be resized using layer pooling. In artificial networks, this reduces the number of computations and parameters that must be learned.
A list of measurements and an optimization calculator are used to build the model. Adamas is not the only risk function used [18, 19]; categorical crossentropy is also used. After experimenting with many functions and optimizers, two of the results produced the best results. We created a summary using the model. Summary() can be used to generate a summary after completing the first 3 steps. See Fig. 2 for an example.
Using the trained model, we will predict images. We will do this by using the test image. The user must specify the path to the image, which is the location on the computer where the image is stored. The prediction will not be made if the image path is incorrect, and an error will be thrown. Otherwise, the user should be able to get the desired result. The trained model will then test all possible outcomes. Pattern recognition and weighting are two suchpossibilities.
In this paper, used image-net open-source data and images of green pineapples are used on agricultural farms. Advanced search on agricultural farms throughout the territory of Vietnam, allowing to collect delicate data sets of pineapples images from many orchards. The total number of images is 5000000. Here are five sample images from the cumulative dataset Fig. 4.
Total 5,000,000 Images were annotated using YOLO-v3 tool in. To detect and avoid overfitting in classification, in this data-set apply method an augmentation for generating more training data from collection image data. In the test scenario, employed also various image transformations such as zoom, lighting, flip, rotate and warp [7].
Classifier implementation
In the data set in Table 1 explains the causes of the losses, the losses are considered valid and the error rate in 5 training cycles with the learning rate of 0.0005. The accuracy we achieved was 97%. The proposed classification process was based on PyTorch’s deep learning library. We have trained the Resnet100 model with all the fruits in include [25]. The study choose SVM to model classifier implementation because the SVM can work effectively. This search corresponds to a constrained optimization problem.
Parameters for experimental analysis
Parameters for experimental analysis
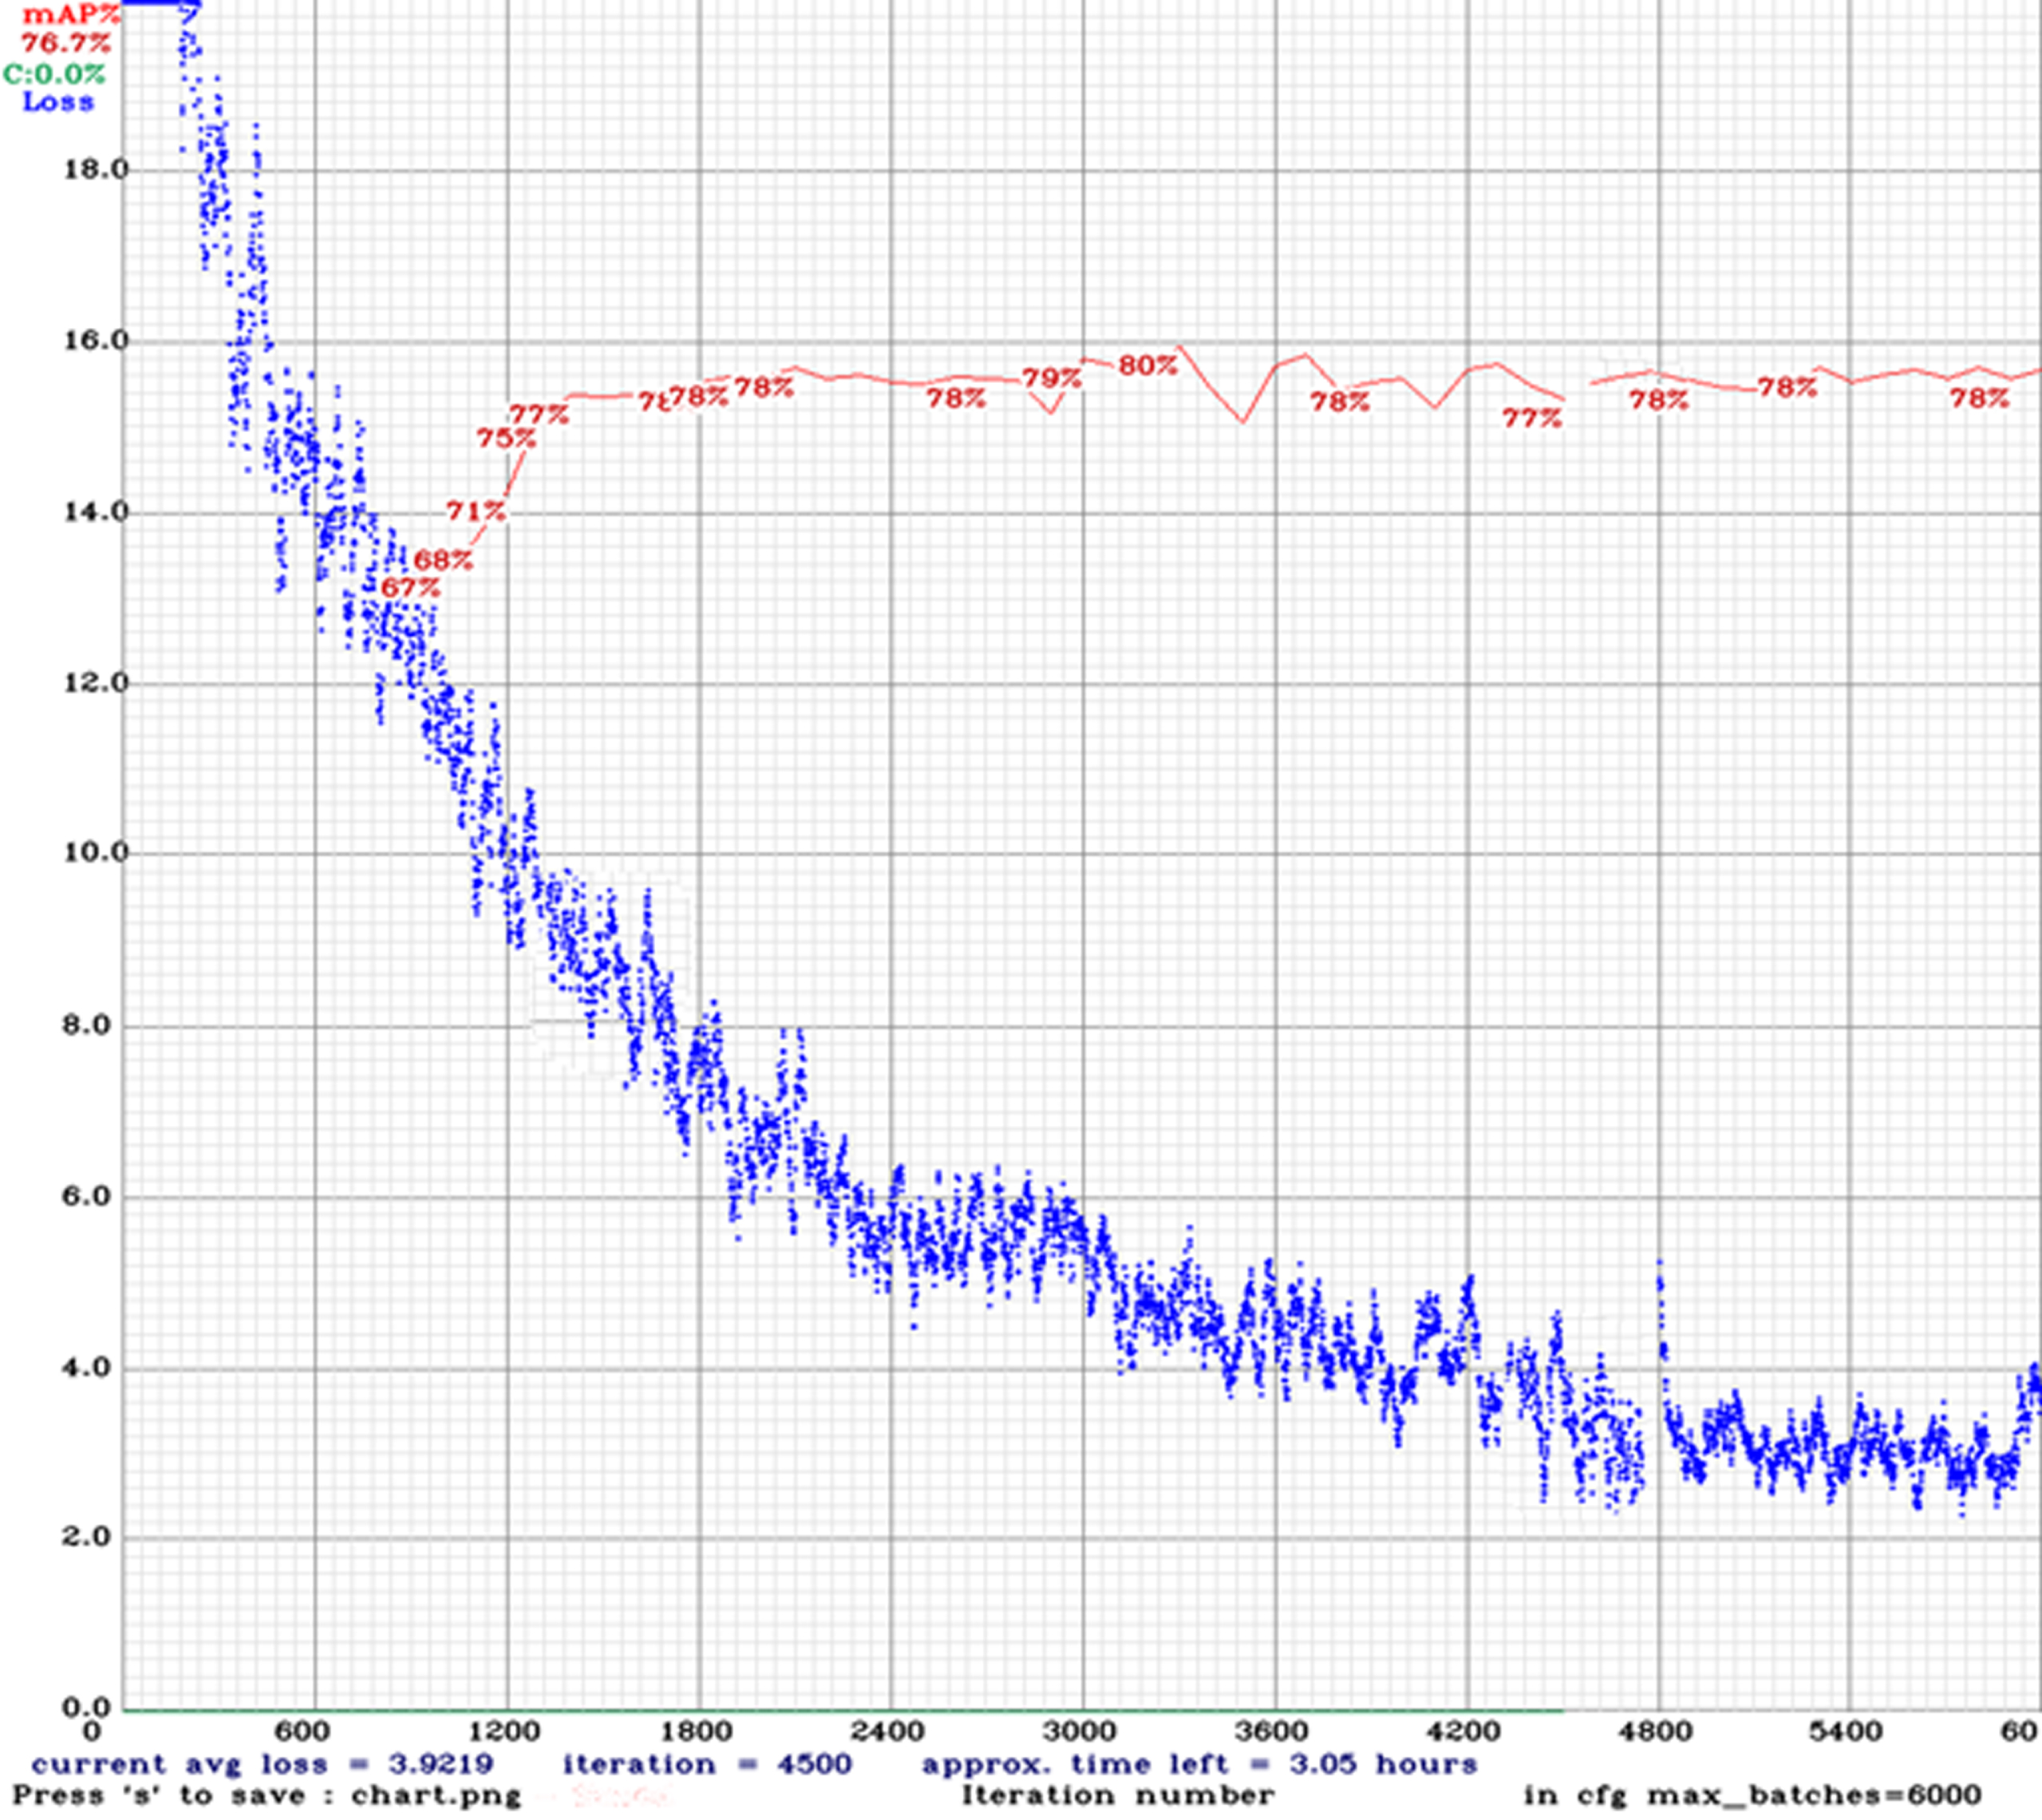
Loss and accuracy in classification
To train YOLO, the following are initial parameters [25].
Improved YOLO model was trained with 5,000,000 training steps on a HP k80 GPU, achieving the mean accuracy of 89%.
Suppose c
j
∈ {1, - 1} be the correct class of image fruit d
j
. Suppose the study used only two classes: rotten fruit and quality fruit. The solution can be:
where v ∈ (0, 1) is a parameter support vectors and error; ɛ is a measure of misclassification error; ρ is the margin. Suppose we have dataset x classes of pineapple images, the decision function that can be expressed as follows:
If we set the derivatives for the primal variables equal to 0, we get:
We apply the Kuhn Tucker condition to α
i
, which are the Lagrange multipliers. The dual optimization problem is given instead of solving the primal optimization problem directly:
where L (x i , x j ) is performed by the kernel function Non-lear mapping.
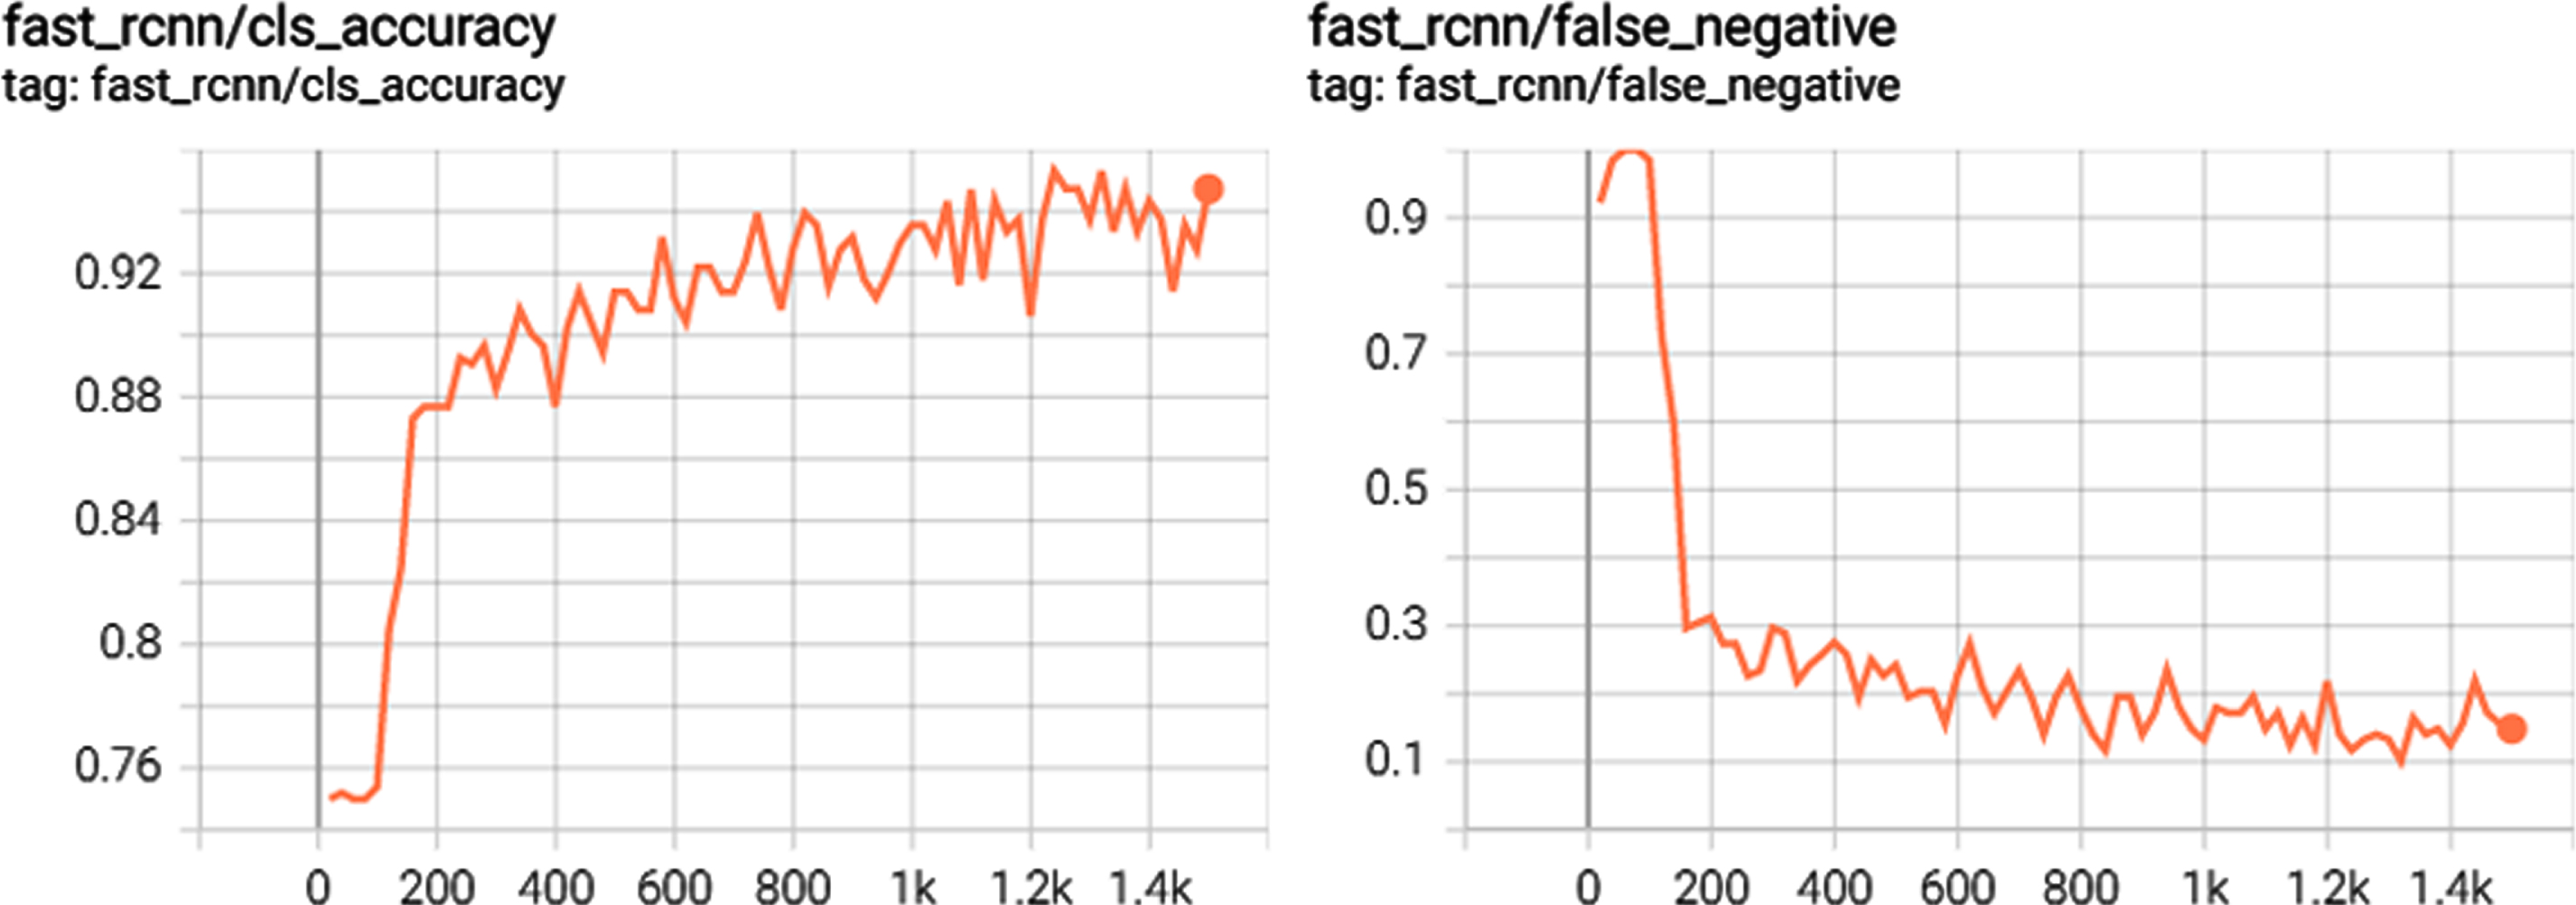
Below is the confusion matrix for the trained baseline model. A confusion matrix helps evaluate the performance of the trained model on a data-set with known target classes. The model was evaluated by calculating precision and recall, using True Positives (TP), True Negatives (TN), False Positives (FP), False Negatives (FN) in the confusion grid matrix.
Predictive values given by Precision = TP / TP + FP. Sensitivity according to Recall = TP / TP + FN. When assessing the results of the test scenarios, the results are predictive values and the sensitivity is equal to 0.967. Figures 7 and 8 confirms the classes processed during the base model training.
Training outcomes with evaluation indicators.
Resulted performance for Training vs Validation phases (fine-tuned model).
Experiments conducted to extract some of the selected data a subset compared to the initially divided classes. Experiment still holds the learning rate is 0.00005 for the initial classes and 0.000055 for the final grades. After 20 minutes of training, the accuracy achieved is 98.33 %.
Finally, to conduct evaluation and make decisions to confirm ripe pineapples with unripe fruit. In the paper, the refining and release techniques were applied to all layers of the input image data dataset trained from the improved YOLO V3 model. In order to maintain the calculation results through the trained steps, the set of typical classes of the trained base model.
Our data produced the expected index when pineapple was detected with Fast R-CNN. Fast R-CNN generates fewer false positives and false negatives compared to traditional R-CNN. Therefore, Fast R-CNN is more flexible in dealing with a changing set of data than traditional algorithms for computer vision based on colour and geometry. An outcome of the simulated image based on the Fast R-CNN algorithm is shown in Fig. 9.
Results of the proposed model.
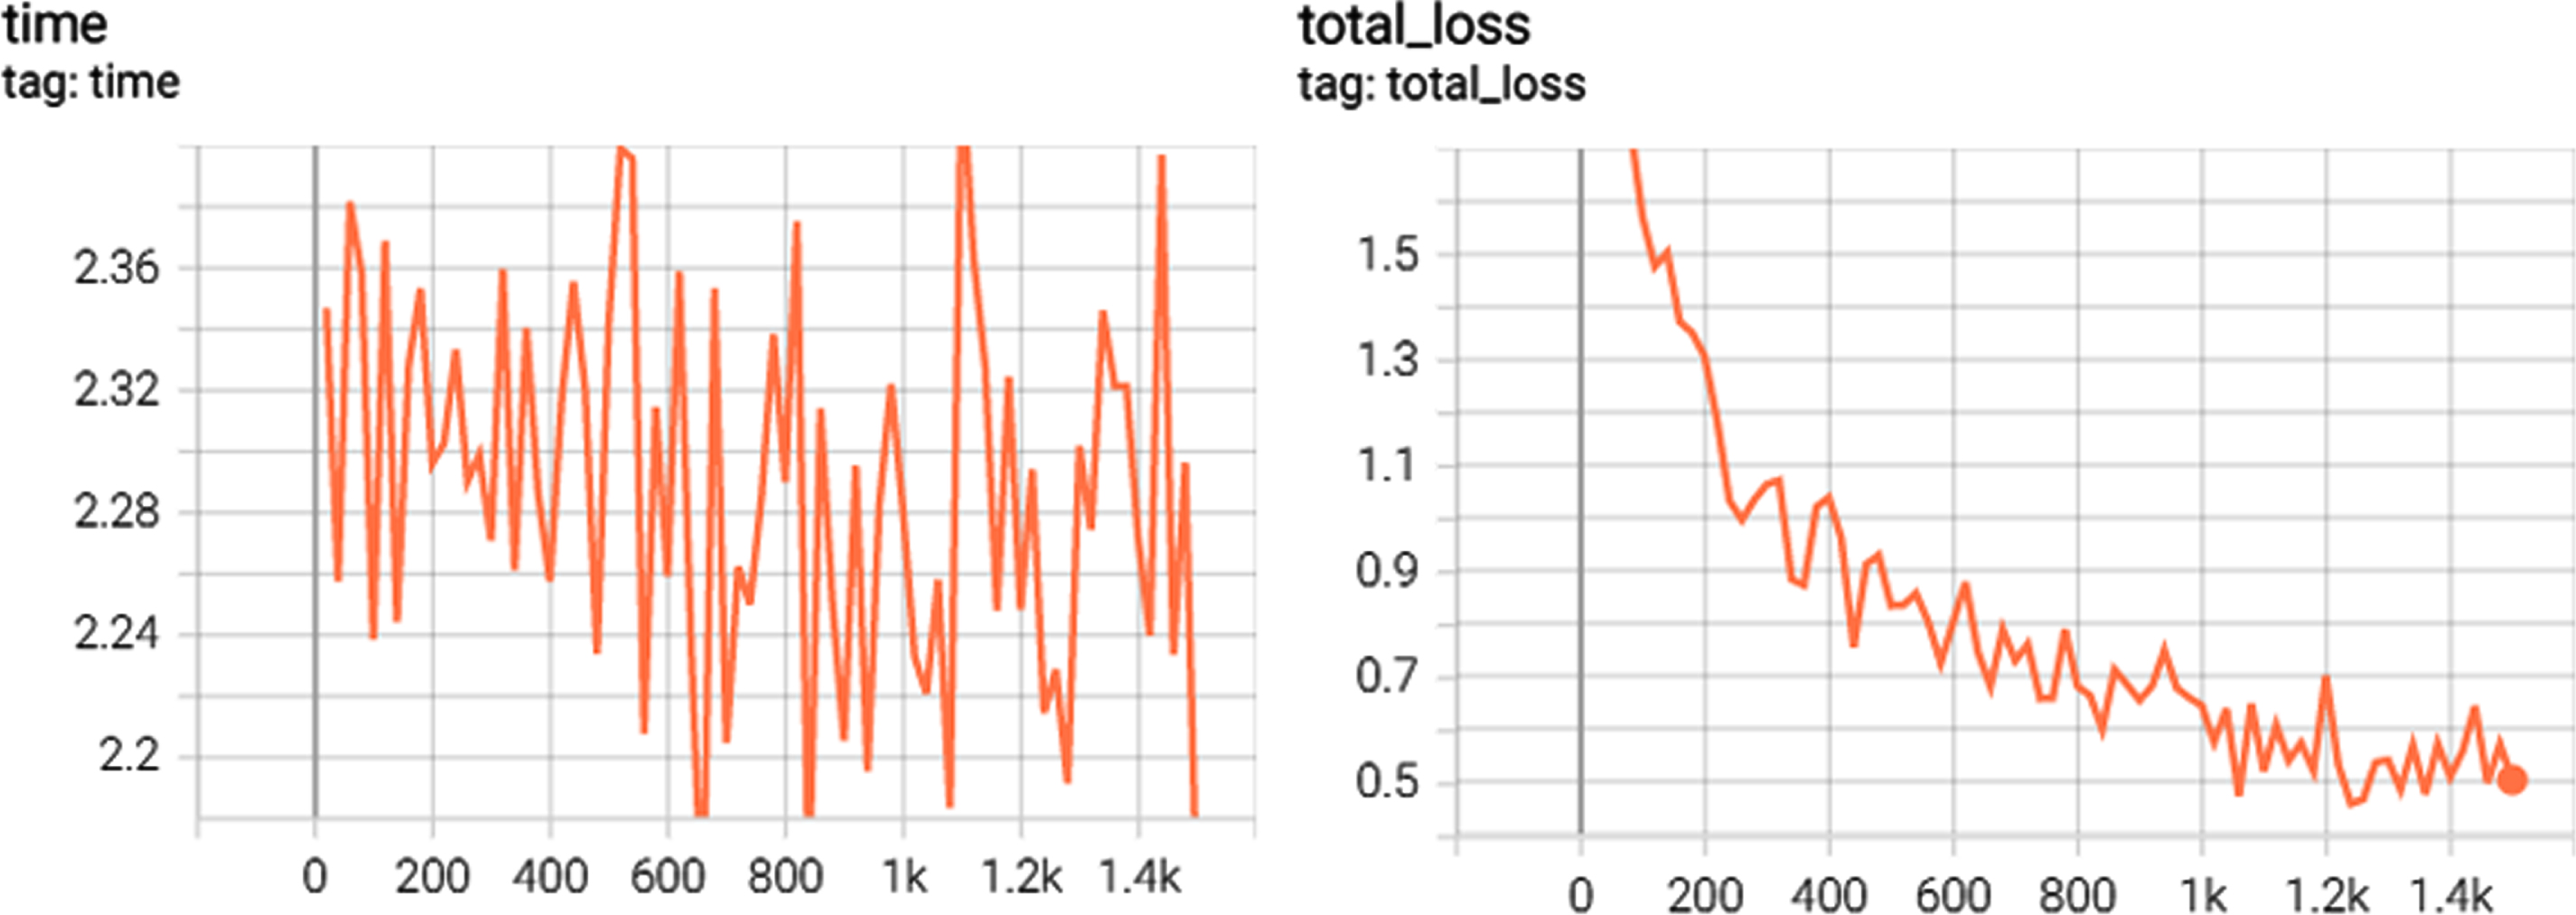
The results obtained from the collection and calculation based on the probability of accurate evaluation and the calculation results from the based on confusion matrix for improved model are 0.97 and 1. respectively. The full observation of the empirical cases the problem of training loss is very low and the technique meeting the results of the high validation is quite high. Therefore, the model is evaluated quite effectively to bring economic benefits to society which is quite high.
As a result of the findings, it was discovered that pineapples could be effectively detected using images captured in real-life settings without the use of specialized equipment. Future automation systems can be based on the collection of large amounts of phenotypic data by CCTV cameras.
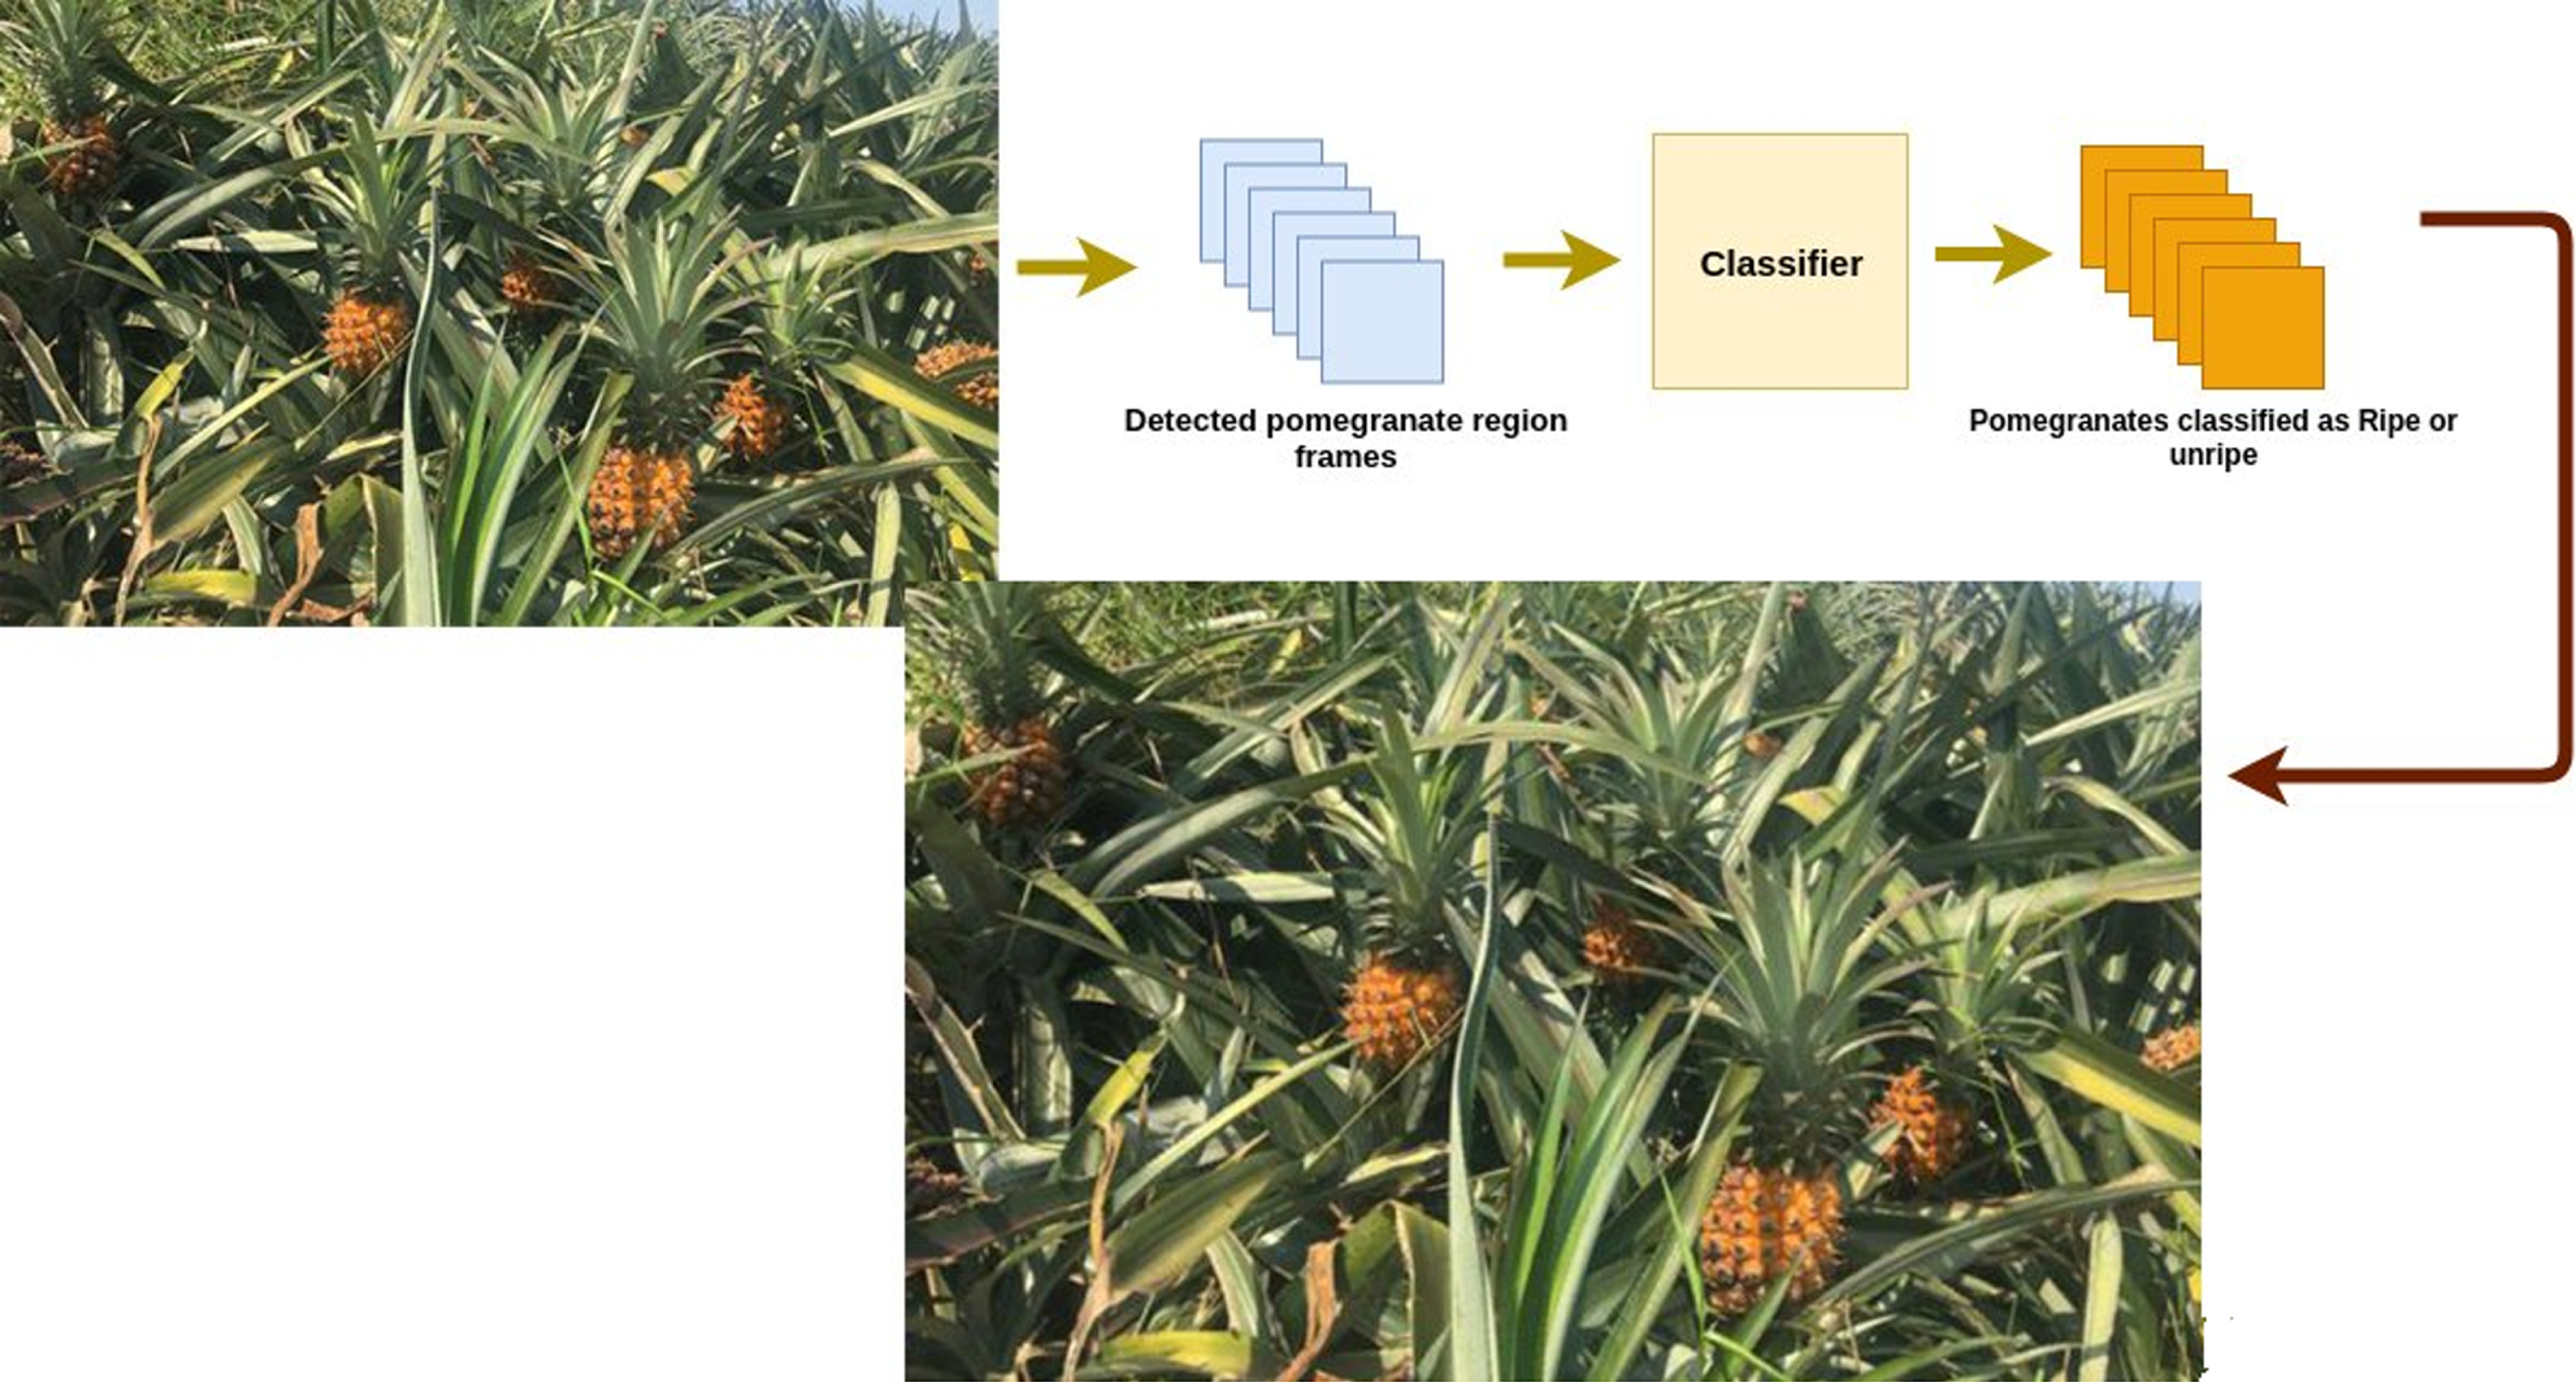
In Fig. 11, ripe and unripe pineapples, discovered from improved YOLO-v3, has been improved to provide trained image classifiers. These results allow farmers to cockroach ripe or unripe fruit. The results of this research are very practical and have brought a lot of benefits to farmers, when conducting the supply to supermarkets and exports to other countries around the world.
The relationships between the relative detection object.

Training, validation accuracy, validation loss.
In our application for detecting pineapples, fast R-CNN was used. There are a variety of practical applications for pineapple detection applications, including testing and evaluating performance. The direction of research for precision agriculture will be centred on finding technological solutions. Farming efficiency and productivity will increase with greater flexibility. We will be using deep learning to determine the identity of other plant parts, such as leaves, eyes, and stalks, at the end of the process.
We implemented the proposed algorithm by use of Python with some C-extendsion. It was experimented on a personal computer with the following specifications: Dell with Intel Core i7 running at 3.5 GHz, 32GB memory. All the execution times were measured by use ò Python’s time module.
A performance and accuracy evaluation of the proposed algorithm was conducted using an optimal calculation. Training outcomes, training costs, recognition accuracy, and loss of recognition are evaluated. Following are the calculated variations for fresh fruit identification using the optimal set Fig. 10.
The first experiment was aimed to study the relationship between the percentage of difference members within the input frames. When compared with all other objective functions, the objective function has the best performance. Because of this, the objective function in the optimization program is highly effective at identifying fresh pineapples. According to Fig. 11, some small fruits were incorrectly identified as pineapple despite their effectiveness. Due to the model based on the input image’s color, pineapple’s colour is incorrectly predicted.
In the second experiment, we studied the impact of the difference threshold to the detection correctness and the relative detection frame per second between our proposed algorithm and the ordinary YOLO object detection. Different optimizations are carried out to test the performance and accuracy of the implementation algorithm for rotten fruit recognition. As a result, training precision, training loss, adjustment precision, and validation loss are represented. There are different optimum values for recognizing rotten pineapple with these variations. Figure 11 and 12 shows the accuracy of the model during training.
Training, validation accuracy, validation loss.
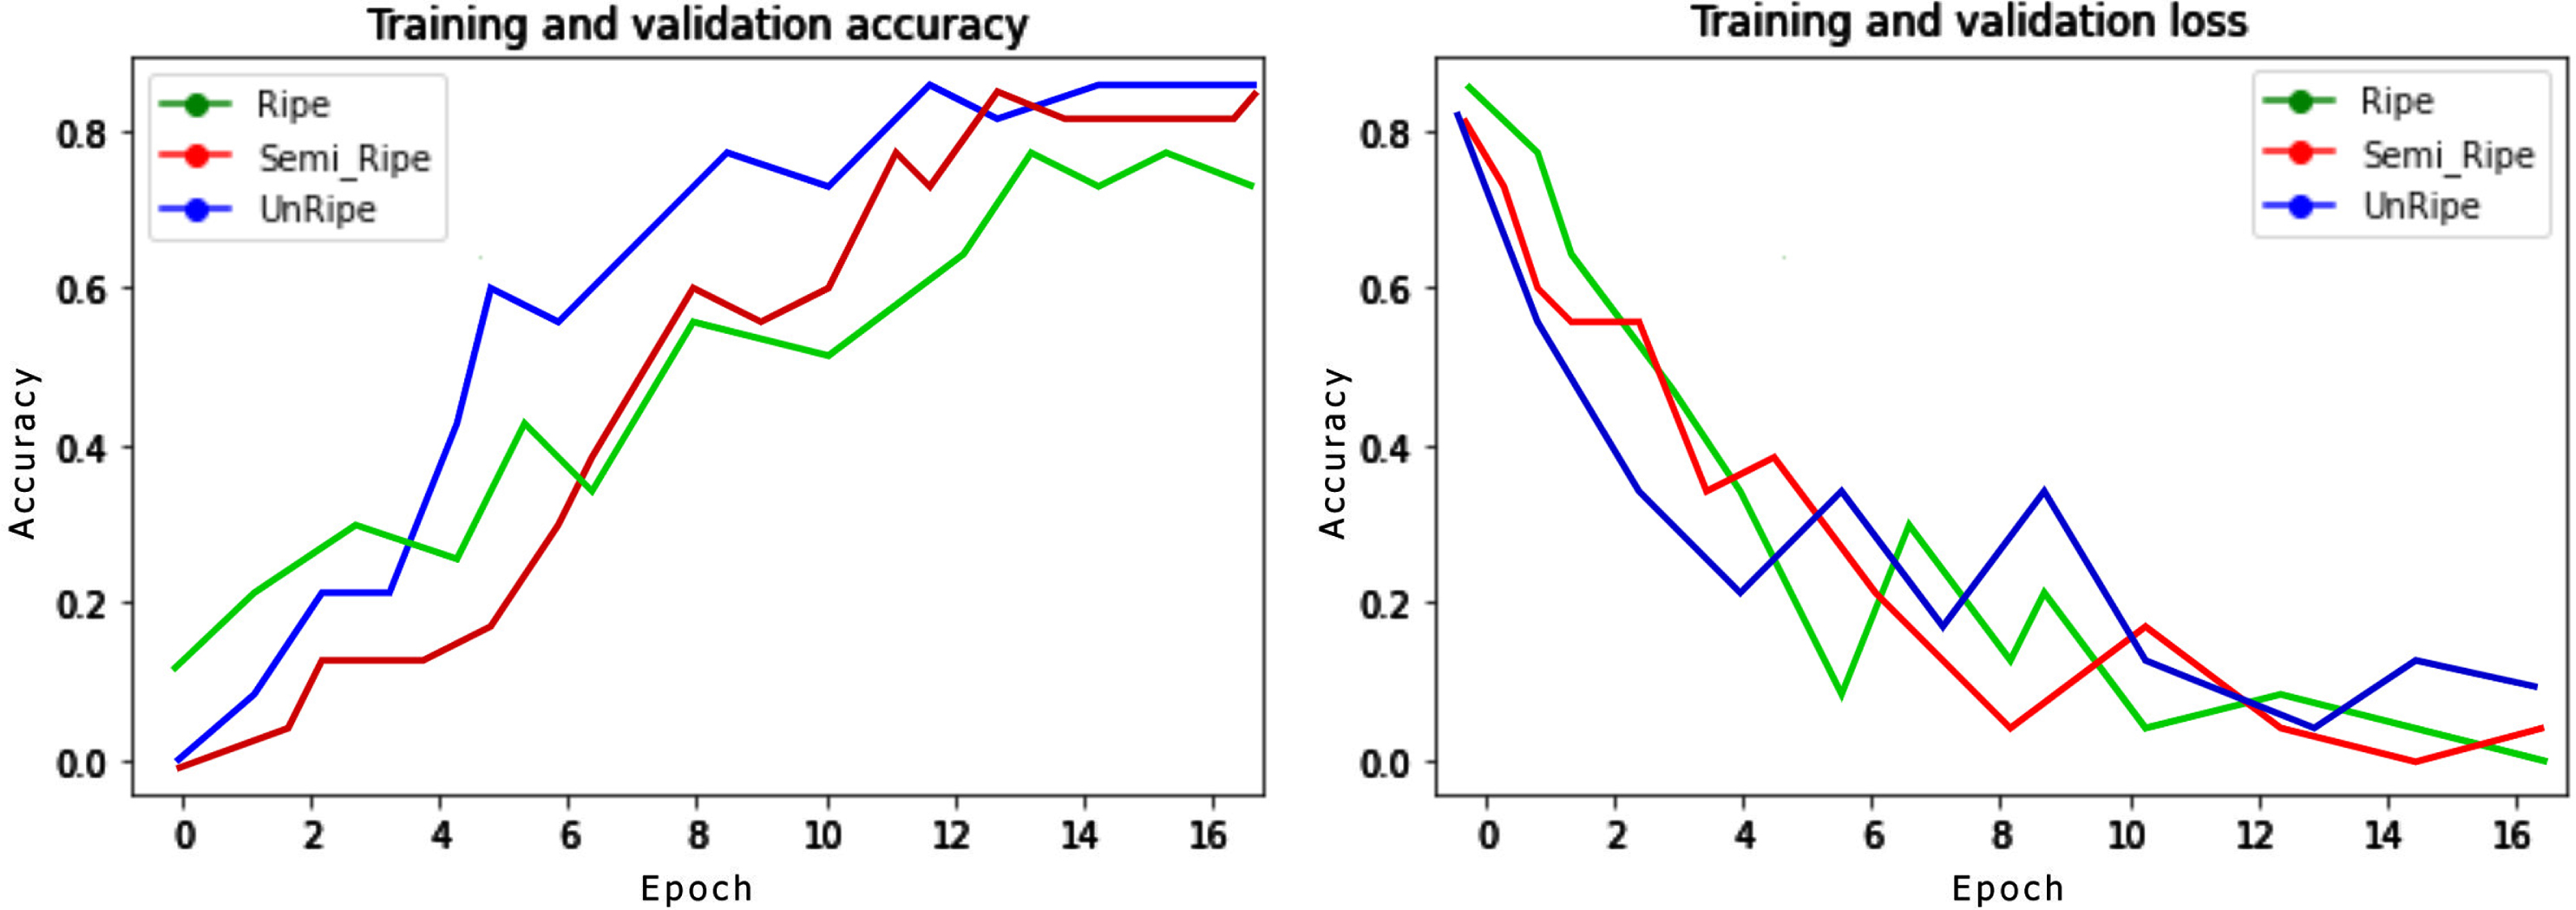
In the third experiments: There are 1000 images of semi-ripe and unripe pineapples in this training database. There are two training datasets and two validation datasets, with 80% and 20%, respectively, in this database. The training database is compiled from two sources: self-collected image data and image data obtained from data sources. We will train the deep learning model after collecting the training database. The quality of the recommender system is directly affected by this task.Accuracy improves after each epoch. At the end of the 20th epoch, the accuracy of the model reached a high level, respectively on the training data set (Training Accuracy) and on the validation data set (Validation accuracy) were 0.98 and 0.988.
Experimental studies were conducted at pineapple farms in the growing areas of Quang Nam province, Vietnam, to find out which pineapples are semi-ripe and unripe. In Fig. 13, you can see that the model is highly accurate for semi-ripe pineapple. In Fig. 14, you can see that the model is highly accurate for unripe pineapples.
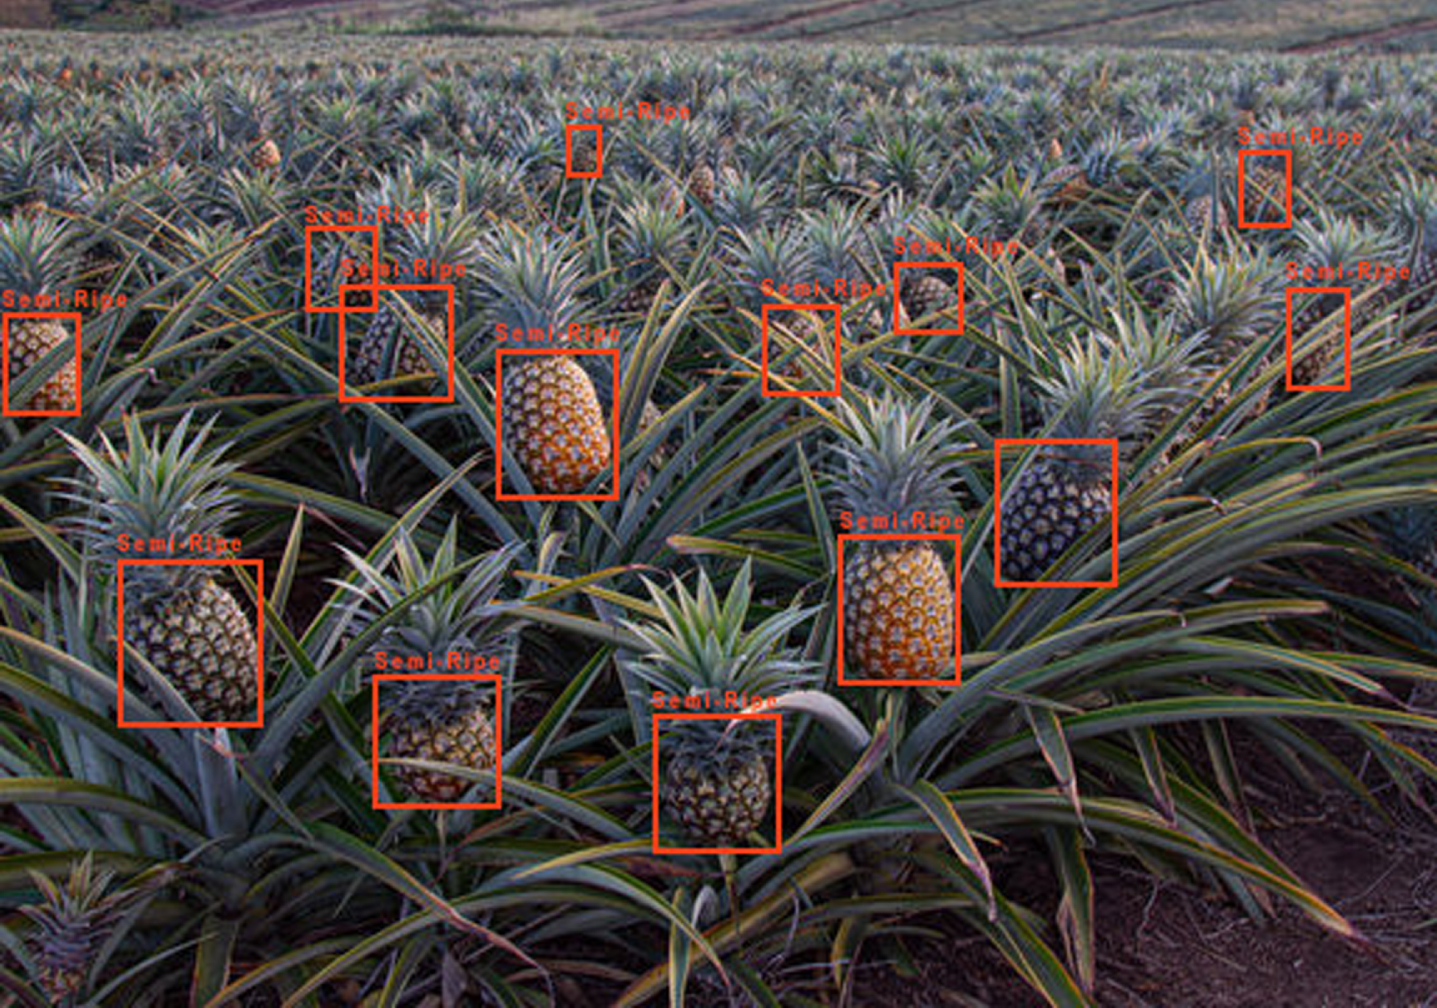
Detecting semi-ripe pineapples using camera images.
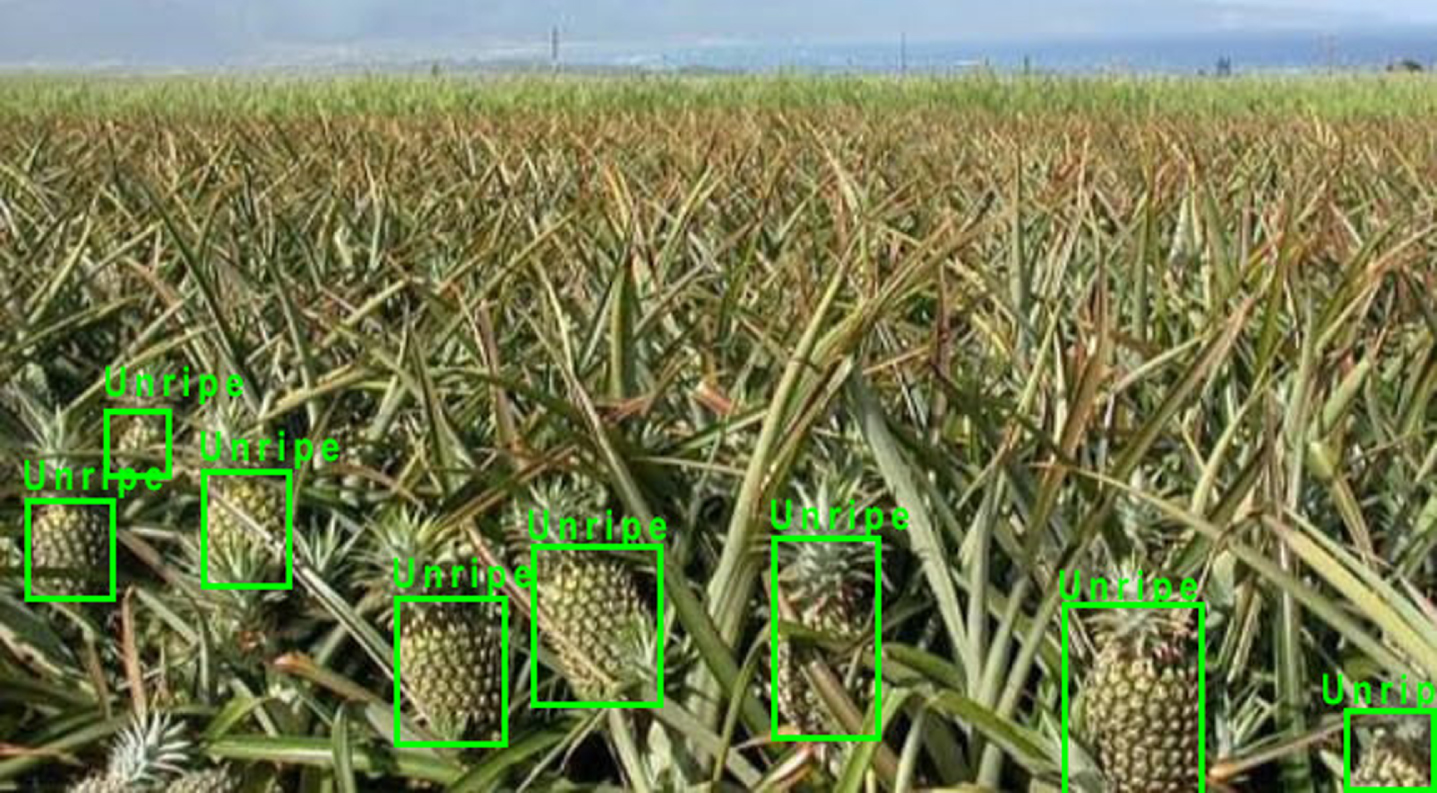
Detecting unripe pineapples using camera images.
A significant improvement in the detection speed of YOLOv4, as well as improved training on GPU systems, has been made. As can be seen, the proposed algorithm can still meet the real-time detection requirements while running on small microprocessors such as FPGAs. Testing the dataset and training Tiny YOLOv3 resulted in a 96.58% improvement in object detection. YOLOv4 has a coefficient of 97.7%, while its improved coefficient is 98.8%. As a result, this model is 2.22% better than Tiny YOLOv3. According to the GPU, Tiny YOLOv4 will run at 65 frames per second. Keeping detection accuracy while reducing the size of the model is the next step. Figure 14 shows that the model has high accuracy with ROTTEN PINEAPPLE, UNRIPE PINEAPPLE, and SEMI-RIPE PINEAPPLE data.
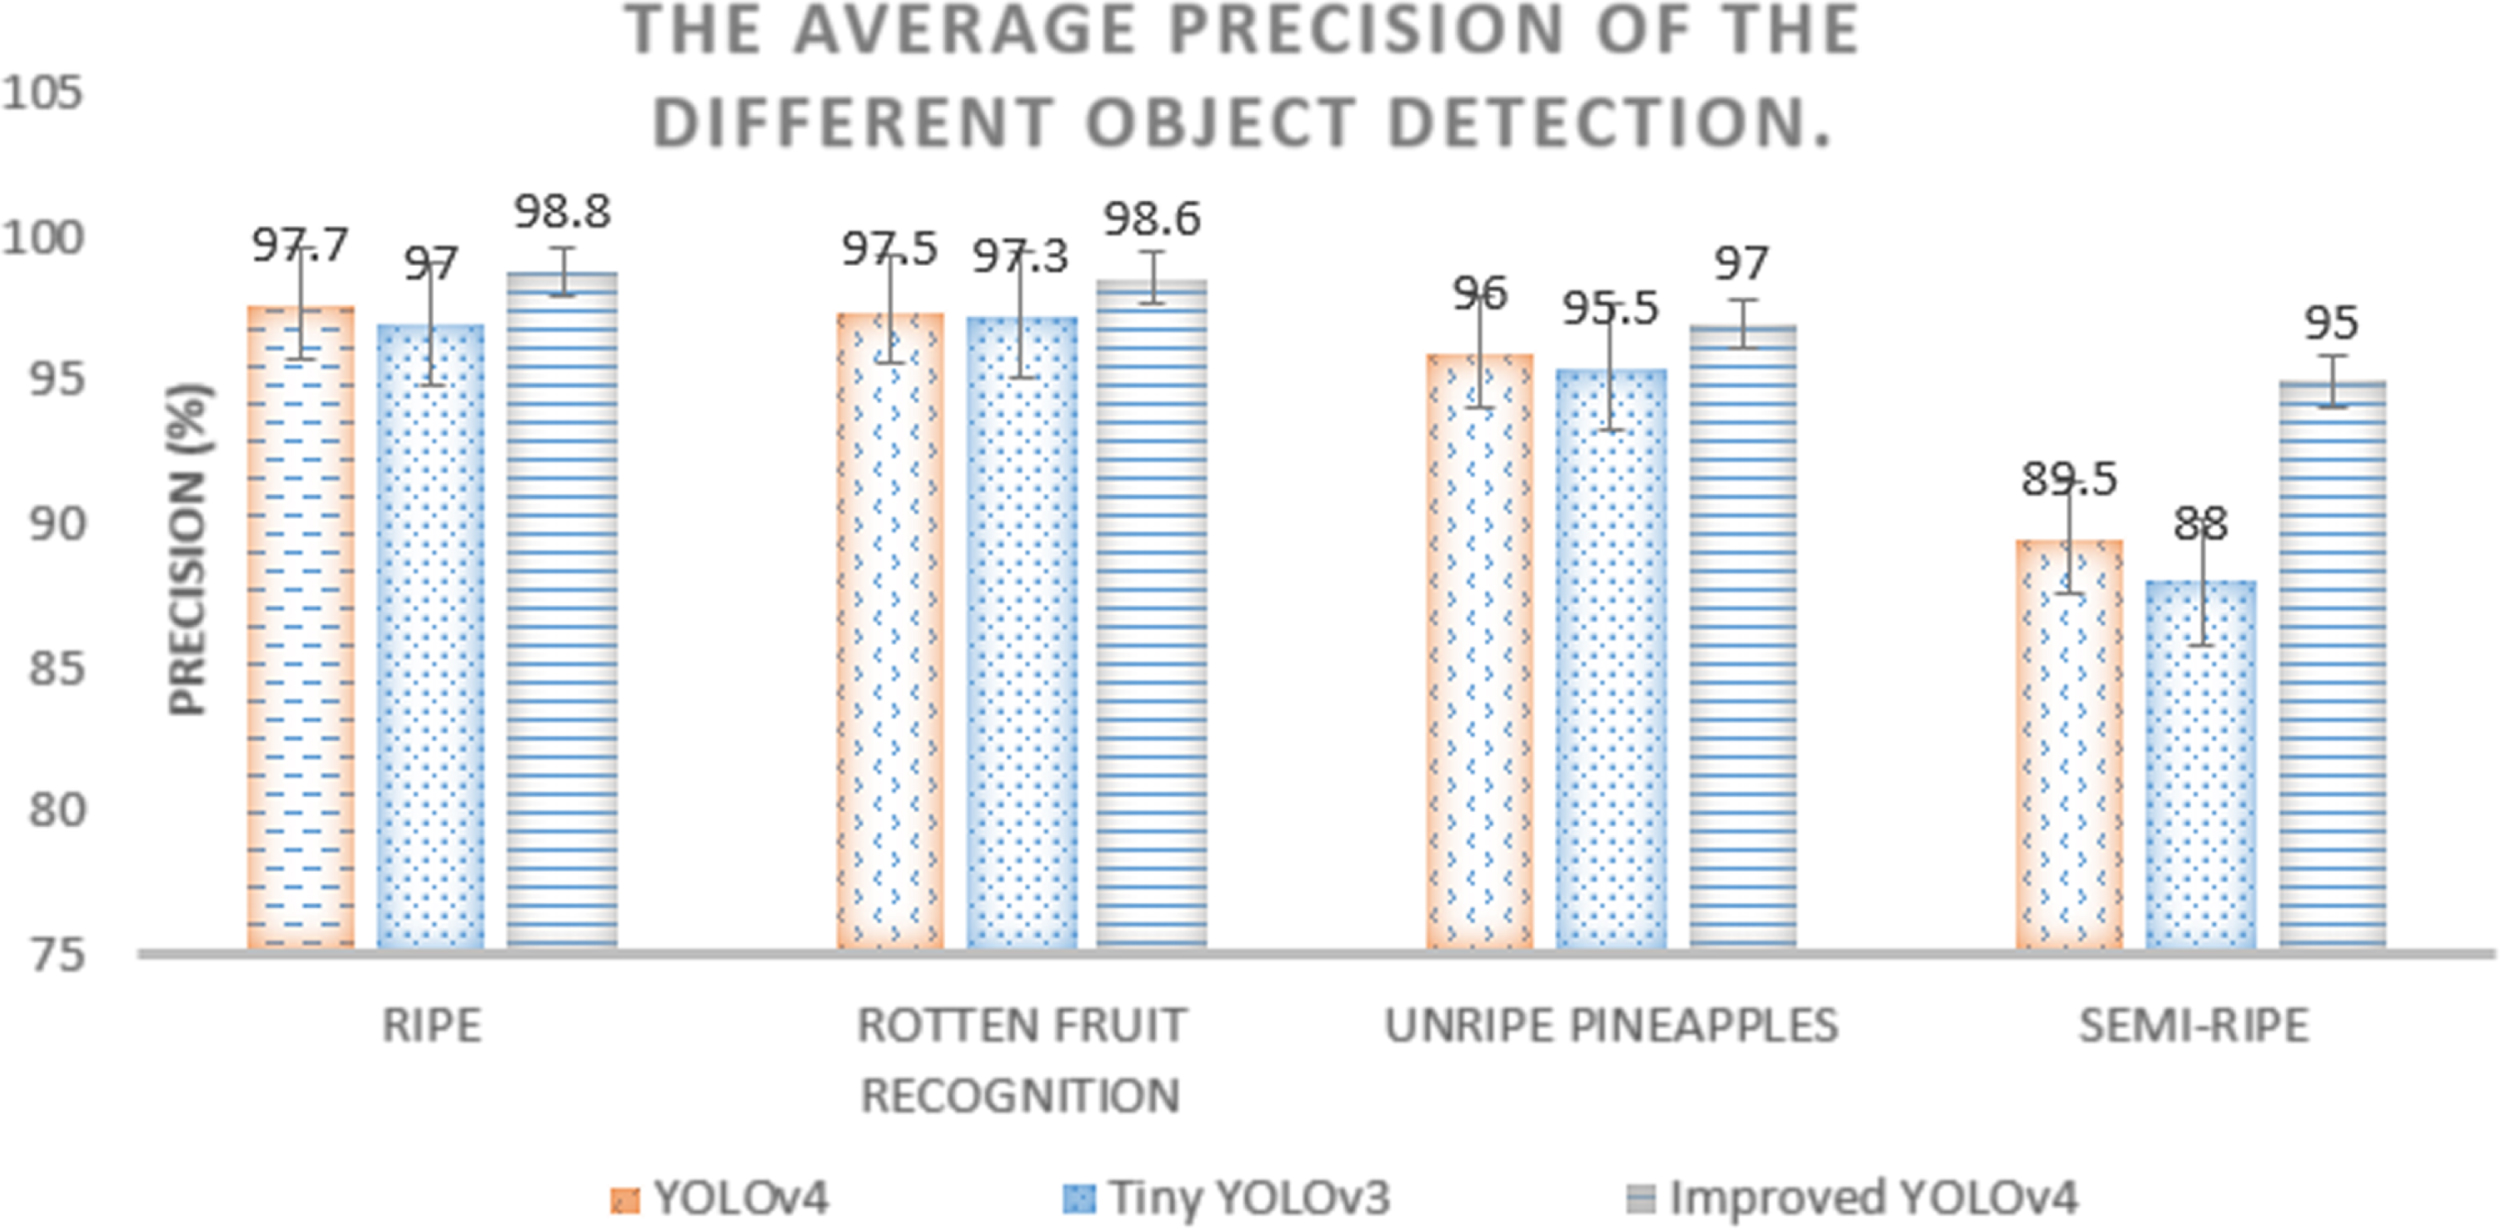
The average precision of the different object detection.
Experimental results show that the detection speed of YOLOV4 is still effective and significantly improved when tested in GPU when replaced by different types of training data such as: ROTTEN PINEAPPLE, UNRIPE PINEAPPLE, and SEMI-RIPE. In training and testing the dataset with ROTTEN PINEAPPLE, the experimental results obtained indicate that the object detection accuracy of Tiny YOLOv3 is 97.3%, YOLOv4 is 97.5%, and the improved YOLOv4 model is 98.6%. Compared to Tiny YOLOv3, YOLOv4 is 1.3% better. With the improved Tiny YOLOv4, the frame rate is 60 fps.
In training and testing the dataset with UNRIPE PINEAPPLES, the experimental results obtained indicate that the object detection accuracy of Tiny YOLOv3 is 95.5%, YOLOv4 is 96%, and the improved YOLOv4 model is 97%. Compared to Tiny YOLOv3, YOLOv4 is 1.5% better. With the improved Tiny YOLOv4, the frame rate is70 fps.
In training and testing the dataset with SEMI-RIPE, the experimental results obtained indicate that the object detection accuracy of Tiny YOLOv3 is 88%, YOLOv4 is 89.5%, and the improved YOLOv4 model is 95%. Compared to Tiny YOLOv3, YOLOv4 is 7% better. With the improved Tiny YOLOv4, the frame rate is 70 fps.
In this paper, we provide effective technical solutions that detect and classify pineapples on Vietnamese farms, based on their ripeness. Our goal in this article is to develop an algorithm that identifies the middle nine stages. Classification of ninth and unripe grades is done using Deep Neural Networks (DNNs). As a result, the solution reduces the costs of heavy training and use the YOLO detection model to classify and detect pineapples simultaneously, reducing the cost of heavy training. In this paper, we propose an aggregation model aimed at increasing the discovery of new objects, reducing the time, and reducing the calculations required for model training. This research technique yields the following results: First, the pretrained model in the experiments is trained with 100 objects, a total of 5,000,000 images from data set. In addition, the transfer model only trains new images containing three additional objects with transfer learning techniques. Model training only takes a short amount of time. As a decision model, we use the bagging technique as the aggregation model. As high as 98.3% accuracy is achieved by our proposed model. In our proposed method, we can easily include tasks such as disease detection in pineapples (for example) in order to make it more flexible.
Footnotes
Acknowledgment
The authors wish to express their appreciation to the Ministry of Education and Training for supporting this research project as part of the Ministerial Program of Science and Technology CTB.2021.DNA. Grant Number: B2021.DNA.09. “Research on applying deep learning model to recognize ripe pineapple period in Quang Nam - Da Nang”.