
Abstract
In the context of this paper a three phase grid connected Photo-Voltaic (PV) system that is used to design with MPPT and developed Grey Wolf optimization (GWO) algorithm for analyzing the power quality issues in the grid system. The proposed Grey Wolf optimization (GWO) algorithm is incorporated in the prototype model and compared with other related optimization algorithms namely Particle Swarm Optimization (PSO) and Genetic Algorithm (GA). The various loading conditions as well as solar irradiances are modeled by using MATLAB simulation and experimentally validated by a DSPIC (DS 1104) based prototype model. A three phase PV grid connected non-linear load is observed in different operating environmental conditions. The optimization control algorithms was developed and implemented in Super-Lift Inverter (SLI) grid connected system. The findings of this work are, grid reactive power demand is compensated using DSTATCOM, and also from the real power of renewable energy system. But, majority of the active power is provided or absorbed by DSTATCOM component. The objective of this proposed work is that the three optimization control algorithms are examined, and the PV integrated grid tied system maintains a compensation power at Unity Power Factor (UPF). The proposed optimization methods produce load output power factor values such as 0.89 (GWO), 0.88, (PSO) and 0.86 (GA).
Introduction
With the advancement of power electronics drives and its related technology integration of renewable energy such as Photo-Voltaic (PV) grid-tied output power becomes an easy task [1, 2]. The integration of solar PV-grid output results are mitigation of without any environmental issues. Grid tied renewable power system are increasing exponentially during past few decades and the determination of capacity for renewable energy system particularly in grid tied power system is more notable [3]. Hence, the modern control technology must be developed to harvest solar energy more efficiently as compared to other energy resources. Therefore, it has increased the trend due to the fall of prices of solar modules. Basically single, two and three diode equivalent circuit of PV module were proposed [4]. The reason behind the mass production of solar energy and also government policies for increasing the renewable energy in the recent decades. Which is to address the minimize global warming issues, and to reduce Green House Effects (GHE). The conventional energy sources for electricity generation are limited in quantity and will last for next few decades. The usage of alternative electrical energy sources needs to be increased in multiple folds. The use of multi-objective optimization for grid tied interconnected system is to analysis the load matching approach. In this electric load has been connected to both grid & non-grid system [5, 6]. If the control operation and integration of RES are important issues of concern to choosing an appropriate equivalent model of a PV cell, which is essential to simulate the actual solar power to the load distribution system. Also by using single diode model and optimizing its component [5], solar cell characteristics near to ideal are obtained. Hence, Power Quality (PQ) is an important aspect for the power distribution system using MPP (Maximum Power Point) approach [7, 8]. In the load compensation is always necessary for keeping the power distribution system, so that based on the parameter under optimization control MPP techniques is used to trigger the switch of converter and SLI to achievable stable power from Solar-PV system [9, 10].
Passive capacitive compensation is broadly used to improve the Power Factor (PF) of the system and it is also support to reduce the reactive power losses in addition to that increase the efficiency level. The dynamic compensation using Static VAR Compensation (SVC) have described [11, 12]. MPP device is always misled, when numerous power maxima exist as a result of non-uniform irradiances. MPP approach based on PSO, GA was compared with high tracking speed for both experimental and simulation results [13]. Automatically the intelligent controller uses to increase the Power Factor (PF) under heavy load grid tied system, that results are inductive condition as well as lightly load and capacitive conditions [14, 15]. The Static Compensator (STATCOM) is latest shunt compensation device, which is advantaged over a SVC that can provide the reactive power compensation to that value of terminal voltage and also compensation of constant over a wide range of terminal voltages [16]. In this paper H bridge inverter having a DC link capacitor is used as DSTATCOM, which requires four pulses for its operations generated by using proper control technique [17]. Using the proper control technique is also very important to effectively improve PQ in the grid tied load system. For distribution system, the DSTATCOM is used to control algorithms such as Synchronous Reference Frame Theory (SRFT), Power Balance Theory (PBT), Instantaneous Reactive Power theory (IRPT) etc [18]. These conventional control algorithms are effective mitigation of PQ issues, but the same time taken to execute their complexity. The optimization of bio-inspired algorithms are faster than conventional control techniques. Maximum Power Point Tracking (MPPT) is positioned in the center of the power electronics converters. The Solar-PV is to reach maximum output with improved accuracy. During the intermittent weather circumstances, overcoming these unavoidable losses and optimizing the grid output was accomplished by using different bio-inspired algorithms [19].
Their limitation may be in optimal parameter selection. These two approaches are used in the proposed methodology to extract the global maximum power point (GMPP), which is referred to as a hybrid of Levy flight and particle swarm optimization (LPSO). The suggested LPSO is tested in three different scenarios: (1) uniform irradiance, (2) non-uniform irradiance, and (3) step-change irradiance [20]. These algorithm may have a fixed step variation or Variable step variation, and their converging process is very high. Several latest optimization techniques such as modified PSO [21], BAT optimization [22], modified GA [23], intelligent algorithms [24] are also discussed and reported in this literature. These algorithms have very precise learning rate selection, if there is slight variation in selection of learning rate parameters like as rather than convergences. Besides these Firefly Algorithm (FA) [25], Variable Fractional Order with Reinforcement Control algorithm [26], Multi carrier PWM [27] etc are also employed in this renewable grid-tied system. These control techniques are adopted for proper control optimization of DSTATOM load compensation approach prescribed. In this proposed study grid connected PV system is discussed, which improves the PQ of the reactive power grid compensation [28]. The optimization control algorithm techniques like as PSO, GA and proposed GWO are implemented on the grid connected PV system. The power electronics circuits are suitable to attain the duty cycle and switching angle by using optimization controllers. Extensive simulation experimental study proves the utility of all three control optimization technique for mitigation of PQ issues such as demand supply unbalance, harmonics in load etc. Therefore, the absence of filter circuit and demand excess power from PV is fed back to the grid. The load demands such as load power, compensator power, and load current are fulfilled by DSTATCOM. Hence, the developed PV system is very unique and the proposed optimization techniques are implemented with DSTATCOM power distribution PV system. The results are obtained both prototype and simulation model are obtainable and the comparison of all three optimization algorithm is presented section 1.1.
System description
Figure 1 shows a block diagram of the proposed three phase grid connected PV system. The PV is connected at the DC link of three phase SLI. The SLI is controlled and integrated with grid system. Three phase grid-tied SLI is modeled H-Bridge configuration. Three-phase non-linear load is connected at Point of Common Coupling (PCC). Real power from PV is extracted via a DC-DC boost converter whose duty cycle is varied as per MPPT. PV cell modeling and design consideration of the proposed system is described in this section.
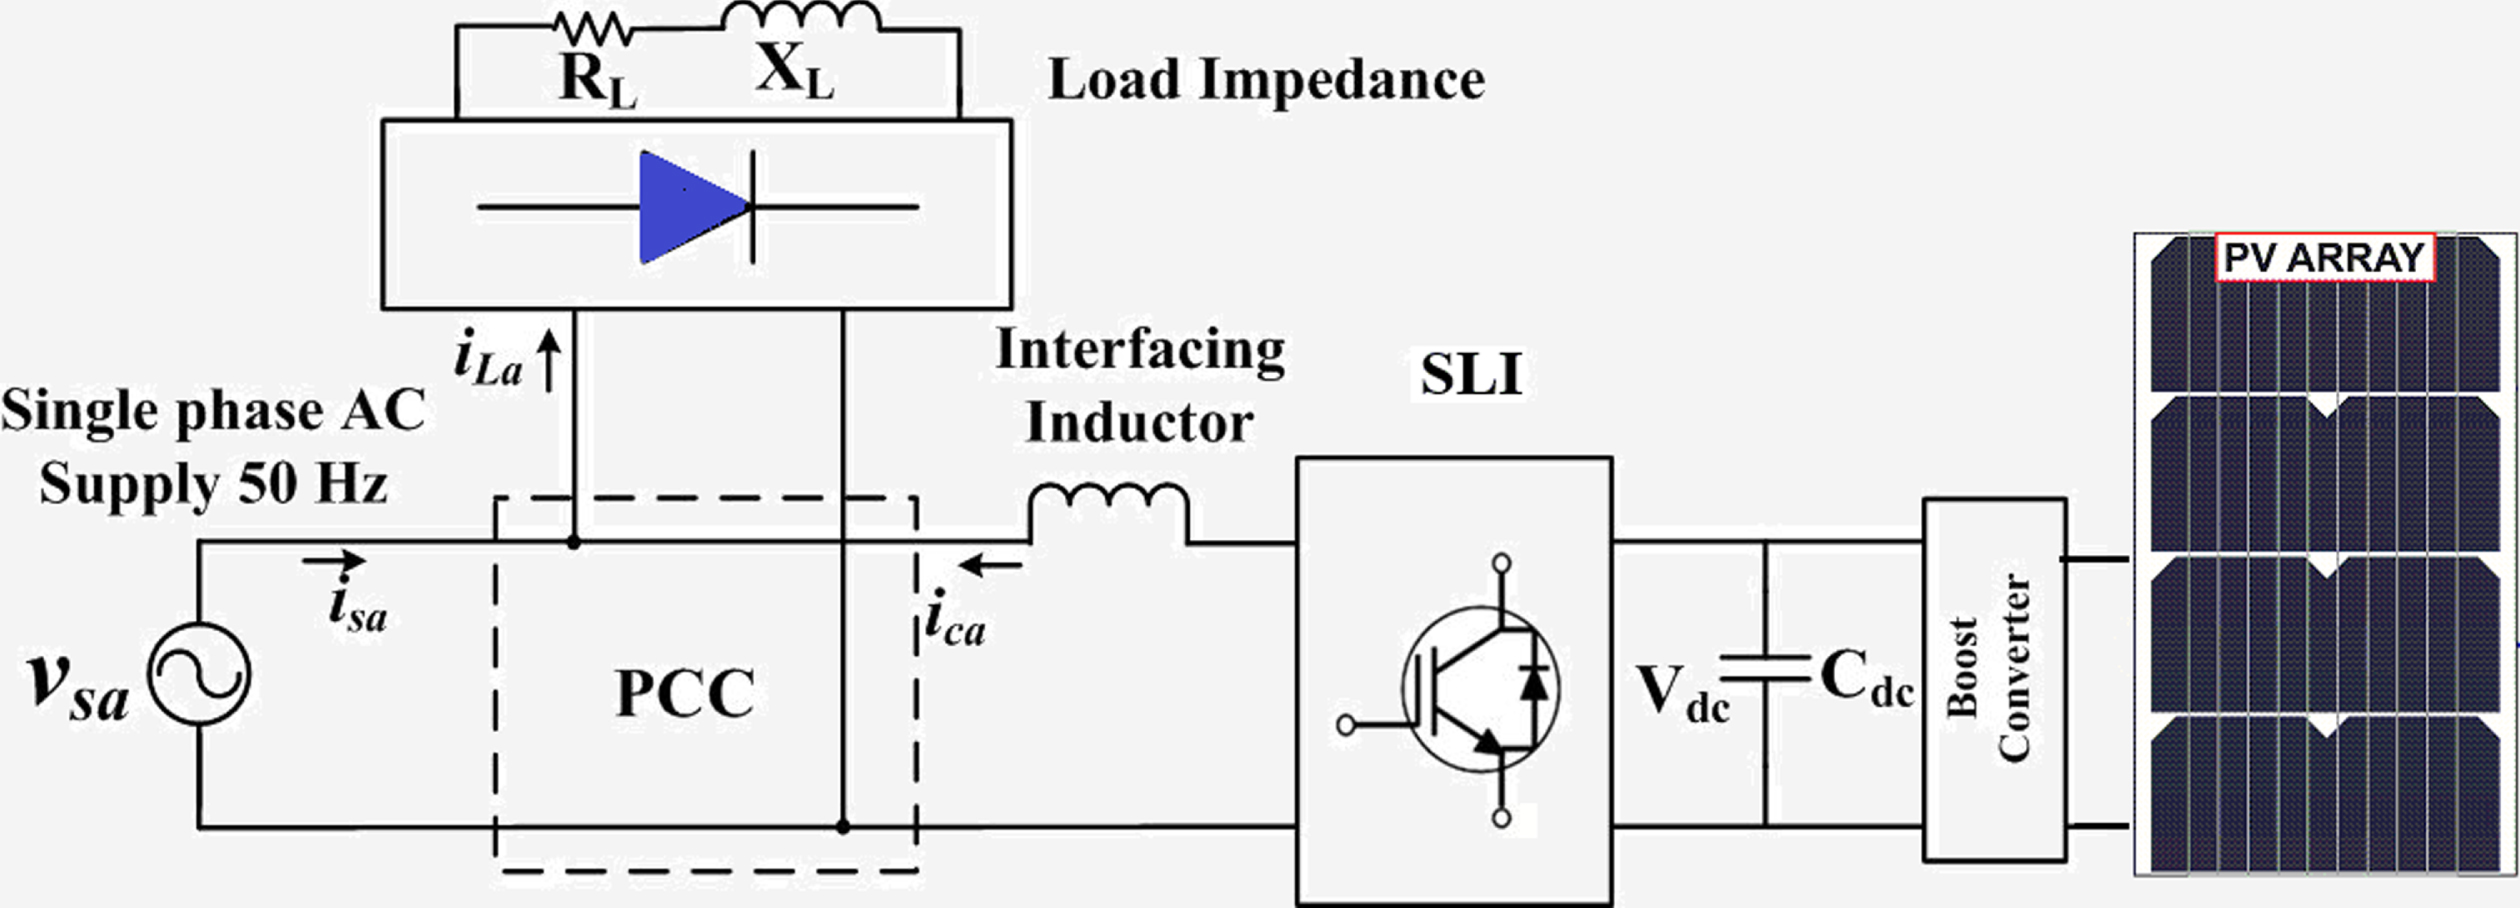
Schematic diagram for proposed PV structure.
Table 1 shows the design parameters, criterion or Equation involved and practical value used. The current and voltage sensors are detect the power from PV system, which is sent it to MPP module. This module extract the estimated PV power. Subsequently, MPP will be connected to the conversion power from control circuit to power circuit. Single diode model was depicted in this proposed work as shown in Fig. 1.
Design parameters of proposed system
Figure 2 (a) shows the circuit diagram of a Solar-PV cell based on single diode model [21]. The output current (Ipv) of PV cell is given as in equation.1

Single cell PV module based on single diode (b) DC-DC converter.
Where Ipv denotes the solar cell output current, Iph is the photon current, Id is the diode current, Ishis the leakage current in the parallel resistor (Rsh). In Equation 2, I0 is a reverse saturation current of the diode, Rs is the series resistor, Vpv is the PV output voltage and ‘£’ depicts the modified ideality factor. Also, Ns = number of series cells in a PV panel, k = Boltzmann’s constant = 1.381*10-23J/K and q = electron charge = 1.602*10-19 C, and Tc is temperature of the panel. As the capacity of PV system increases, we need to design a PV array which consists of number of panels connected in series (N ss ) and in parallel (N pp ).
The PV arrayequation is modified from PV cell equation and is given as (4):
In this section, the optimization control algorithms uses to minimize the power quality problems in three phase grid connected PV. Solar-MPPT techniques that is Perturb and Observe (P&O) method used in DC-DC converter as shown in Fig. 2(b). The power quality improvement by using control algorithms are implemented in load compensation grid connected PV. The simulation and experimental results are discussed by using different optimization control algorithms described in this section.
Generation of unit templates for three phase system
For the generation of reference current for DSTATCOM, unit templates or synchronizing templates must be calculated. The unit templates calculation in three phase system is different from computation in a three phase system. Figure 3 shows the unit templates calculation for three phase system. Figure 3(a) shows calculate of peak magnitude Vt. Figure 3(b) shows computation of unit templates sin θ and cos θ. In the Equations (5) and (6), Vt is peak magnitude of terminal voltage and Vsβ is supply voltage of single line.
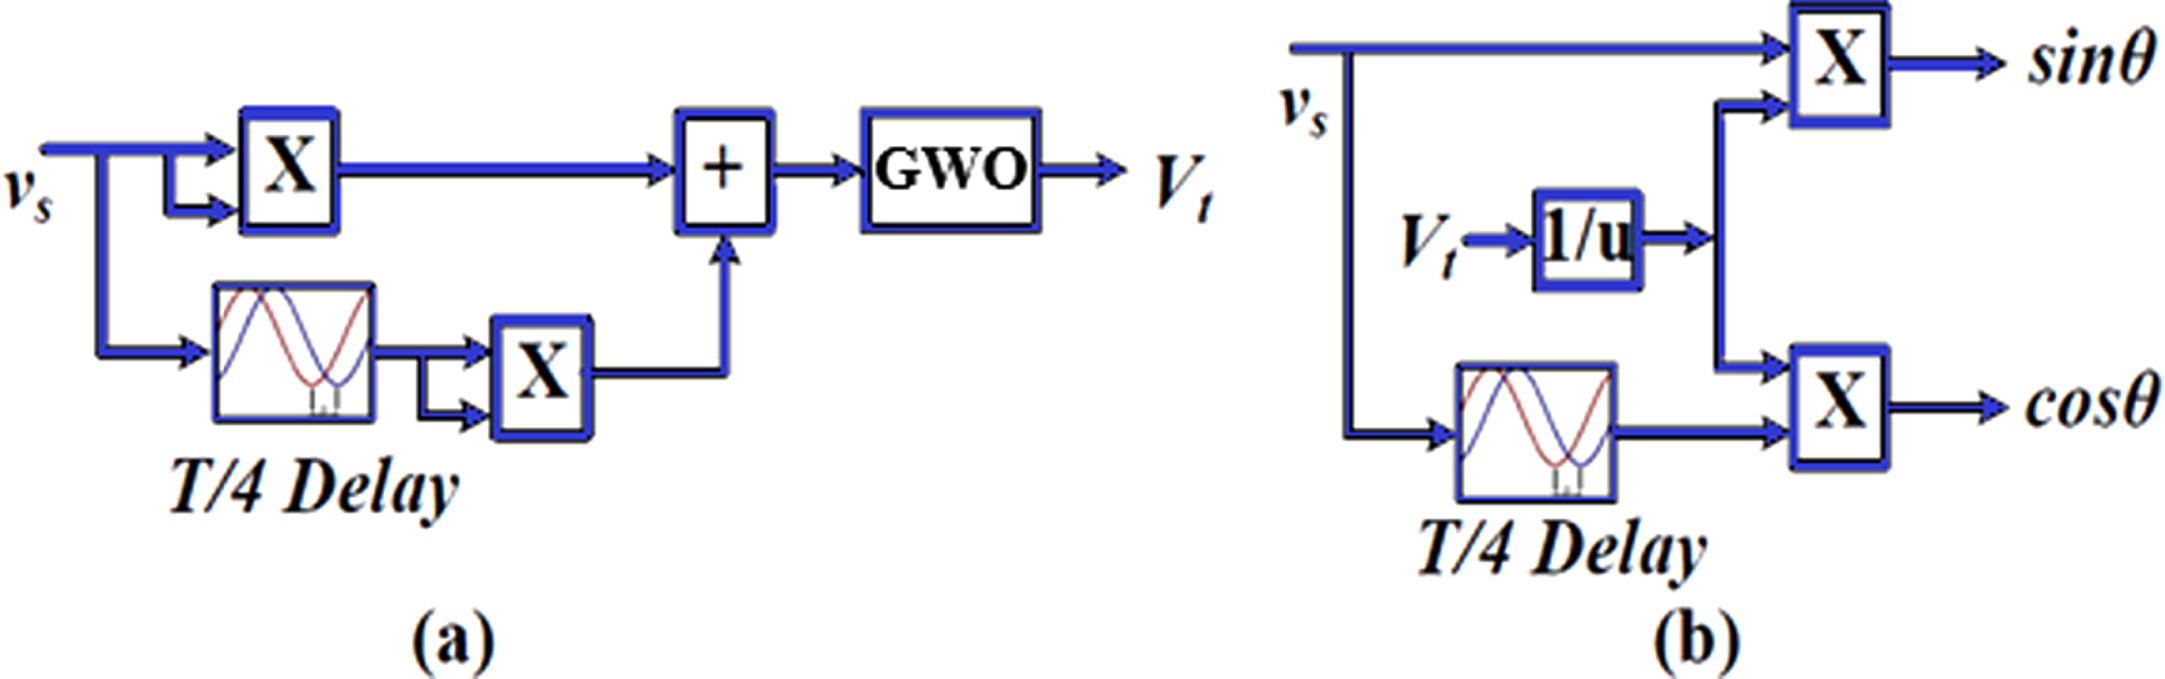
Generation of unit templates (a) GWO approach (b) DSTATCOM approach.
To integrate PV- grid tied system, a feed forward factor (Iff) is calculated as shown in Fig. 4 (a), which is subtracted from the fundamental active load component (ILd/Ip) to compute net magnitude of current required from the grid. The Iff is calculated in Equation (7),
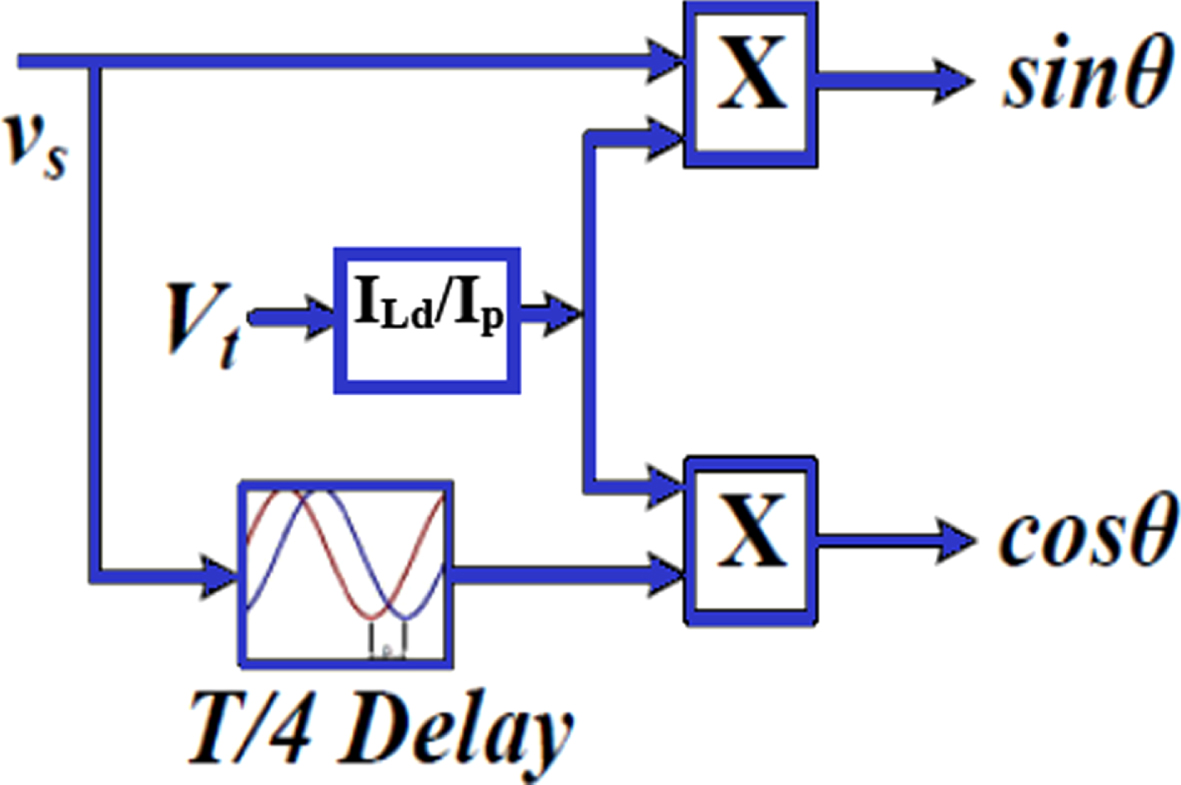
(a) Calculation of feed forward factor using DSTATCOM.
Where Vmp and Imp are MPPT voltage and current respectively. Since MPPT voltage in grid connected system is to be kept at DC link voltage modified as,
Where, Equation (8) shows that Ipv is solar input current at voltage Vdc. This feed forward factor is used to calculate magnitude of reference current for DSTATCOM.
A GWO algorithm is a metaheuristic optimization technique developed from the hunting habit of grey wolves [22, 23]. It’s a form of swarm intelligence algorithm that handles nonlinear optimization problems effectively. The alpha (α) is the group’s leader, beta (β) is the group’s subordinates, and the reaming delta (δ) and omega (ω) are the third and fourth classes of supporting wolves, respectively. The leaders are the alpha wolves, and they provide the best fitness solution for the optimization problem at hand. The following are the stages that grey wolves use when hunting. (1) Prey search, (2) prey encirclement, and (3) prey approach.
Where
The suggested optimization model is employed to improve the output power of a PV array while taking ‘D’ into account as a decision variable.
The population is constrained in the initialization procedure to 0.2 to 1.0 of the D and is represented as,
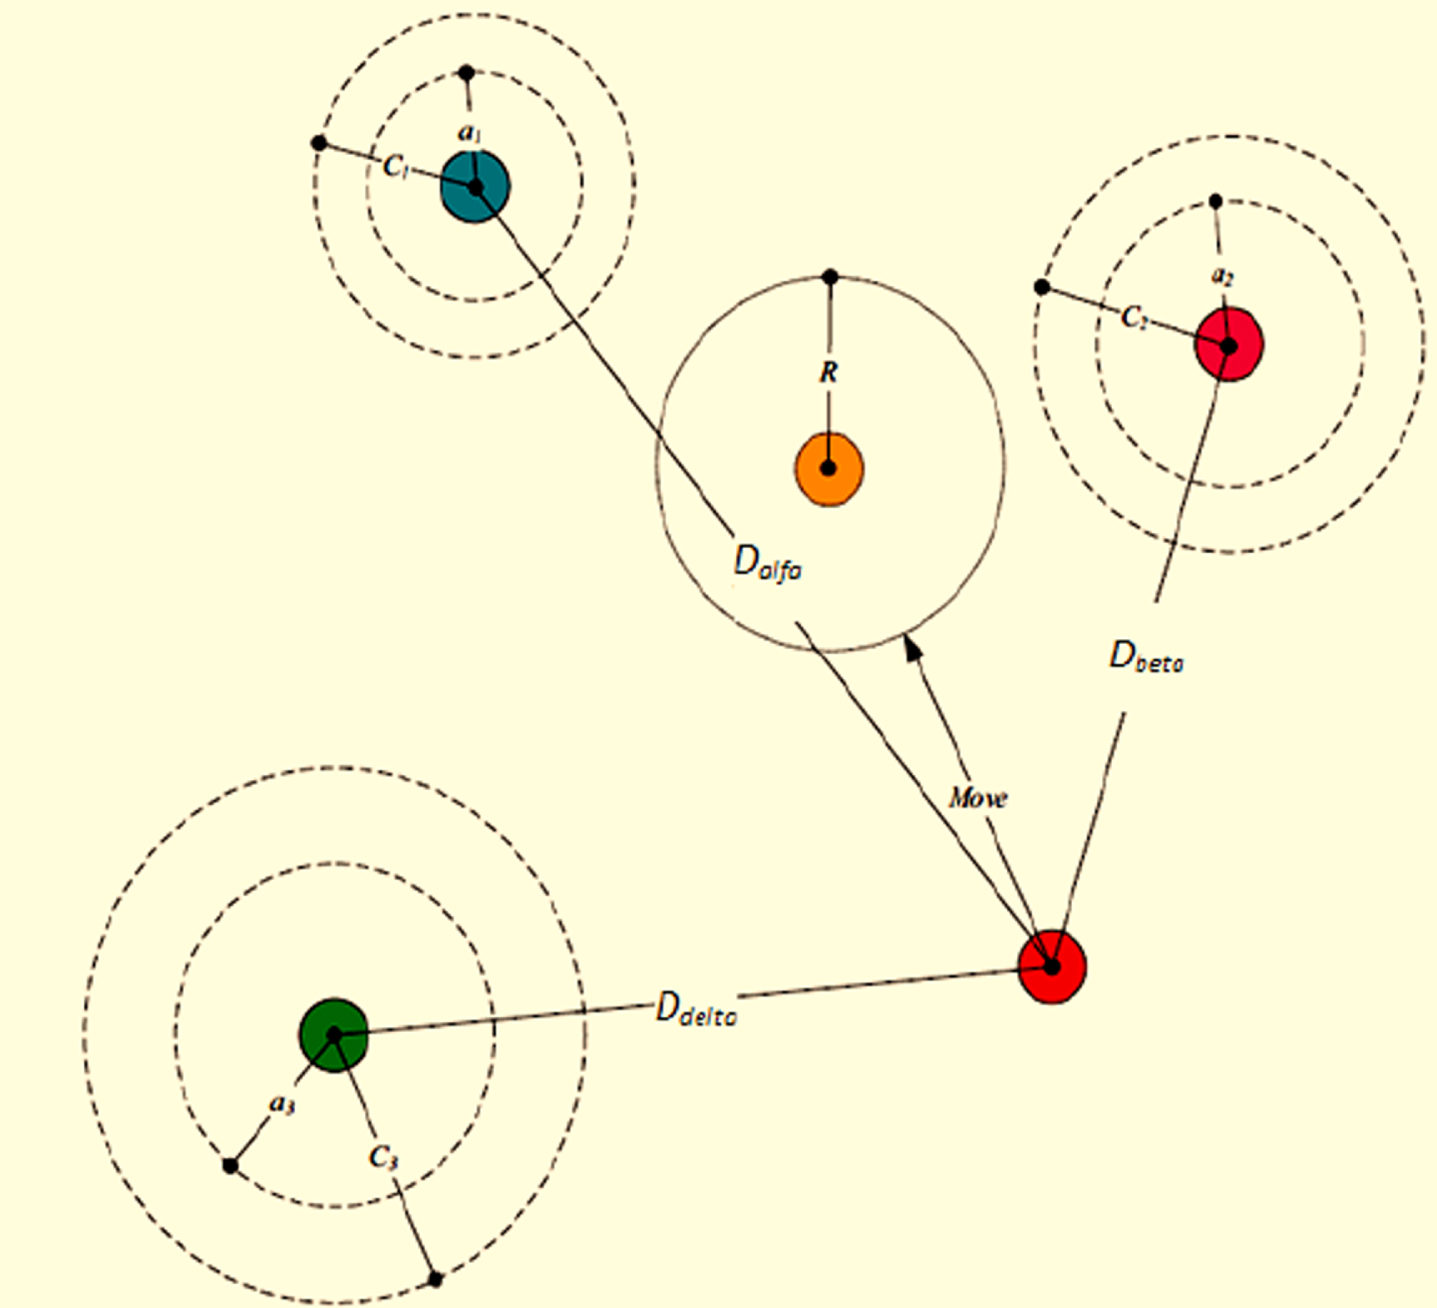
(b) Position update and hunting of grey wolves.
Where d i is decision variable, and the number of initial population is represented as n p which refers to the number of solar systems.
The fitness function is used to calculate the prey’s location. The suggested model considers the values dα and dβ as the top and second-best alternative solution with the best PV output power.To update the position of search agents depending on the position dα and dβis wanted population position &‘D’variables are updated, and presented as,
The powers are computed, and the procedure must be terminated when Pmax is attained. The process’s termination criteria are the maximum iteration and maximum output power, and it may be reinitialized if the power is decreased and the process is specified as,
Where, ΔP represents as last operating point, ppv,l is represents as power at the global (Pmax) point. The process flow of grey wolf optimized MPPT approach is given in Fig. 5.
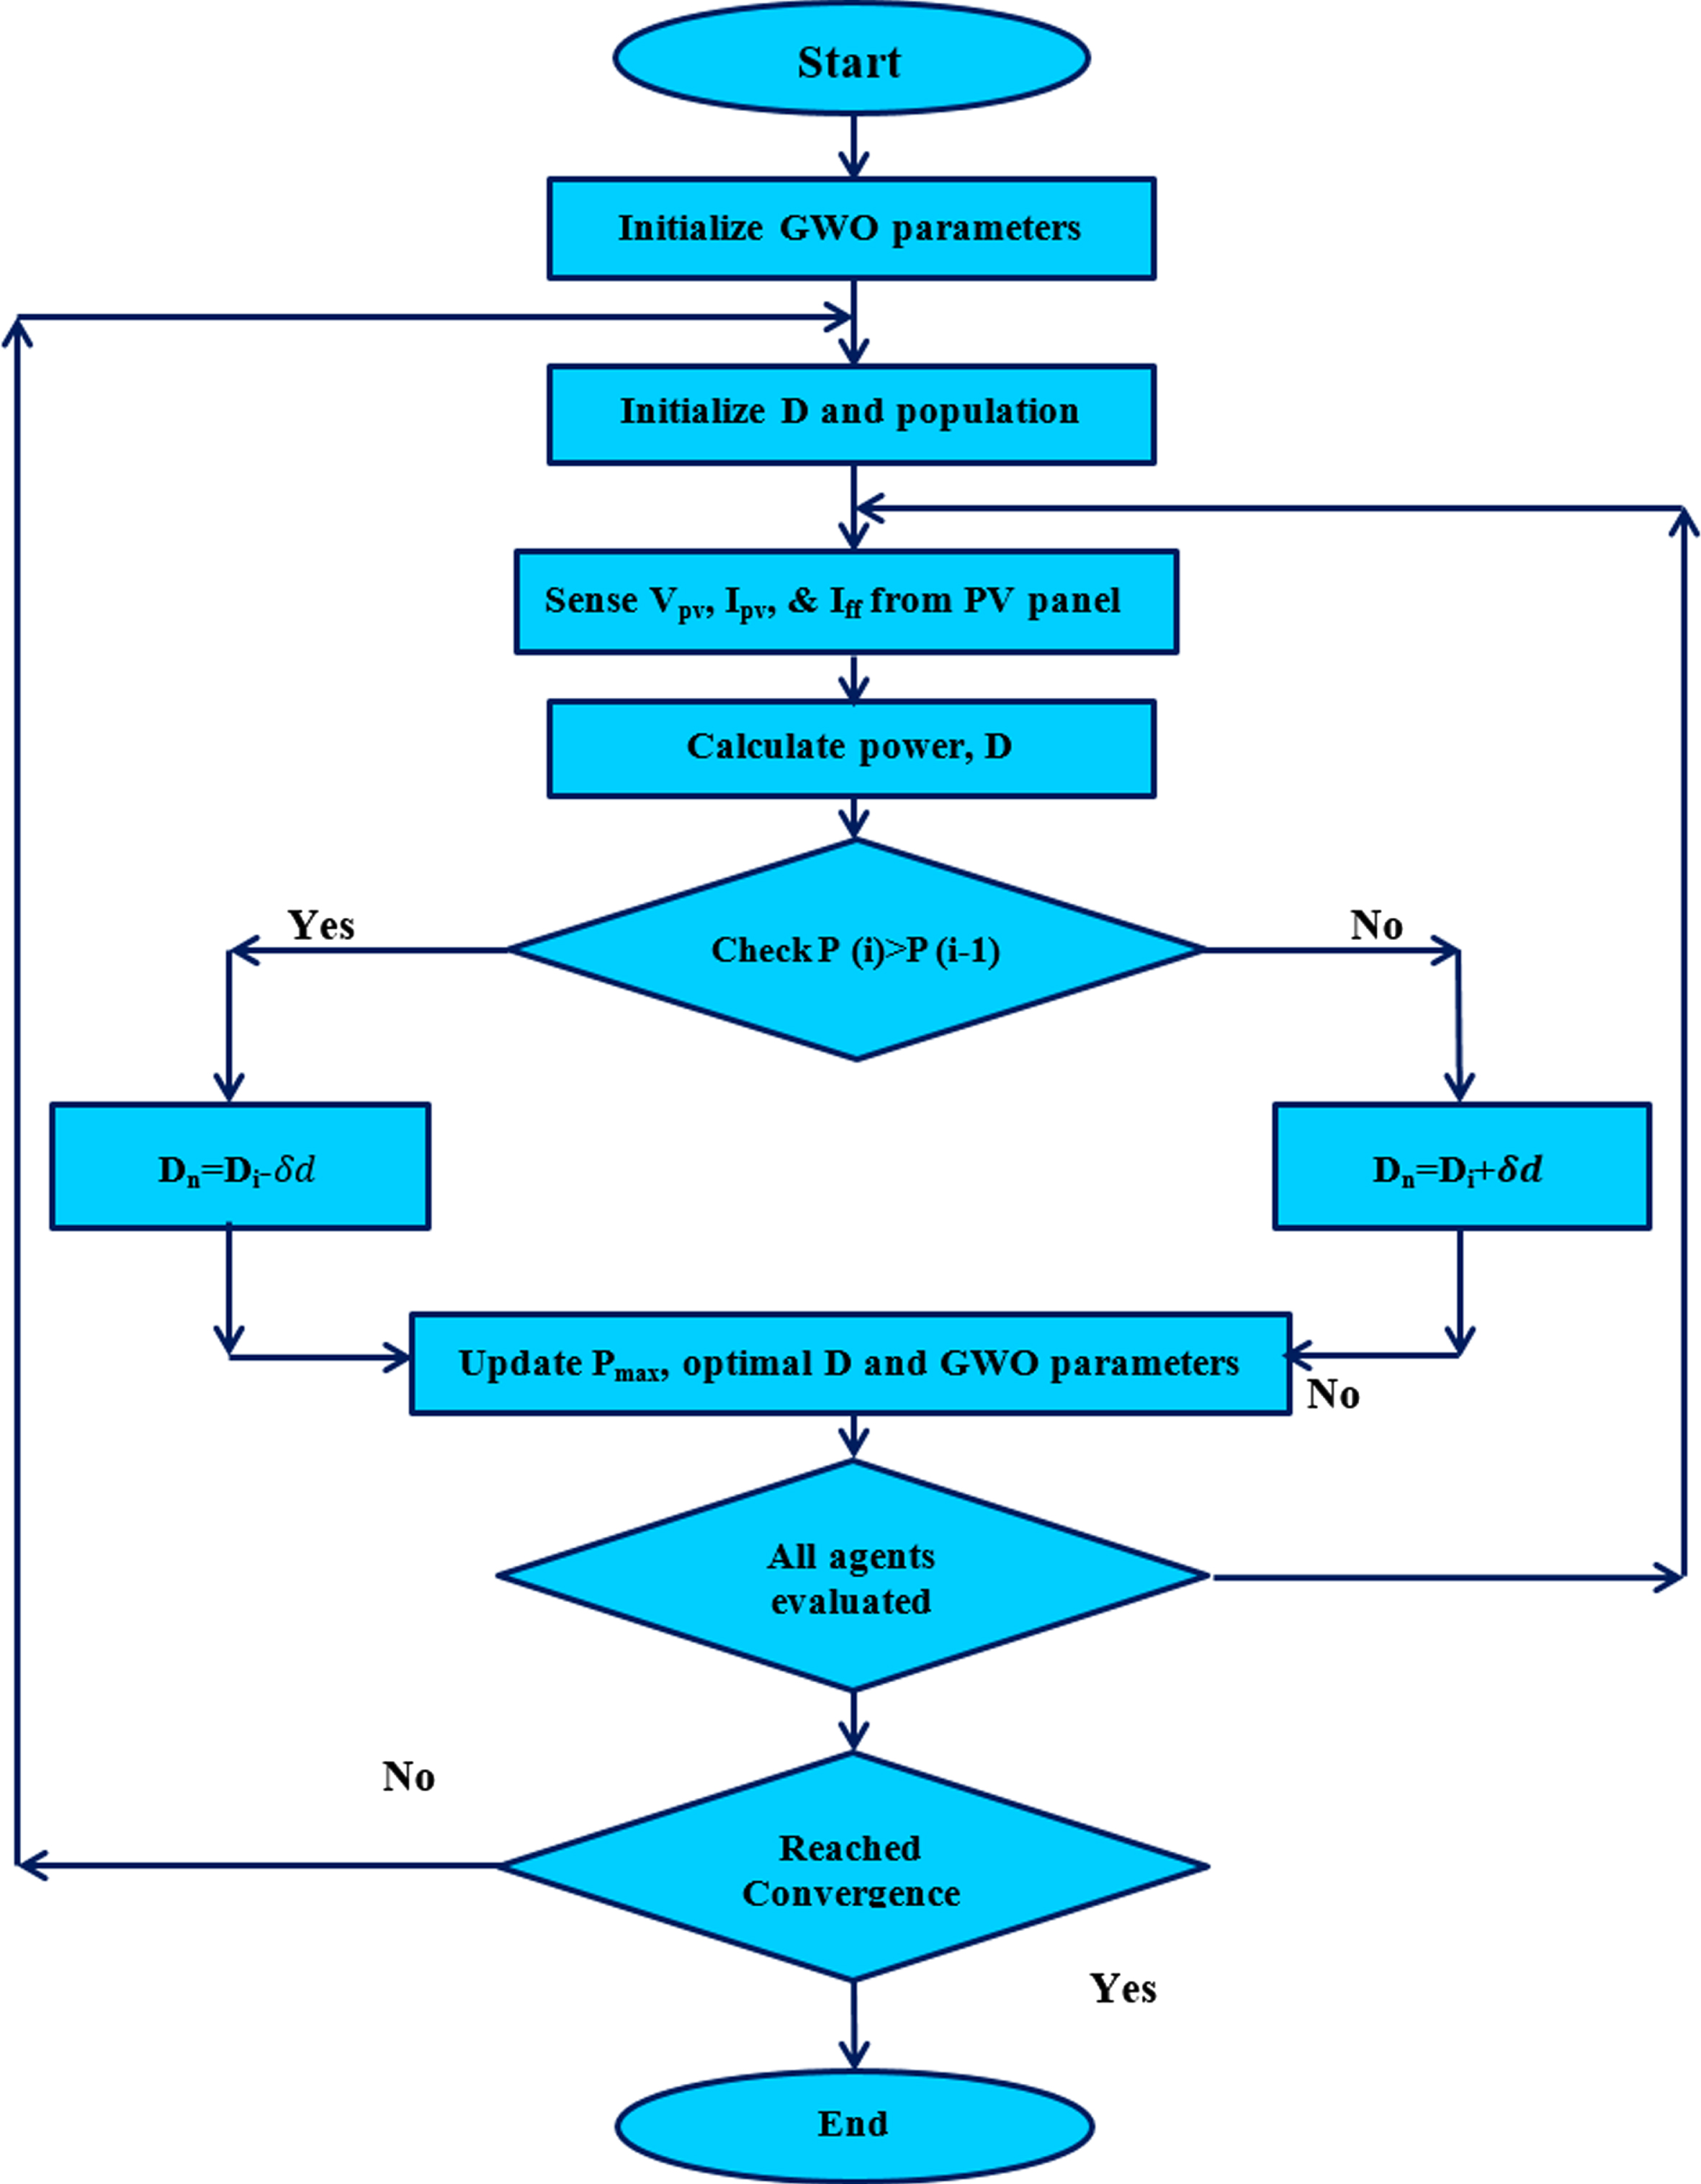
Proposed algorithm flowchart.
The optimization algorithms are tested in MATLAB/SIMULINK environment. The modified system considered for simulation comprises a 2 kW PV system, which is connected to 440 V (peak) three-phase grid supply. Consider the PV module size is more suitable to implemented grid-tied load system. Solar-PV cells are linked to a DC bus, which may provide the data on grid voltage and current relationship of the solar radiation factor. MPPT algorithm can extract power possible by using the GWO algorithms. The converter is used to store data about the amount of power given to the load. This paper focuses on three swarm-intelligent bio-inspired algorithms. Specifically, GWO algorithm is proposed approach selected for this PV system and it will operated the demonstrated capability of adjust power circuits. The choice of GWO parameter’s specification is mentioned in Table 2. The value of the parameters is fixed based on the simulation test with trial and error process, which is used to find the best duty cycle and more suitable grid compensation power. Combination of wolves and maximum number of iterations are varied on the number of particles.
Simulation specification
Simulation specification
The result of the solar-PV test methods are applied into two solar modules, which are linked in a mix of serial and parallel cells. The simulation parameters are used as per the specification mentioned in Table 2. The effects of variation in load and PV irradiance are observed on the grid dynamic performance prescribed in this section. Figure 6 (a-c) shows the simulation results for variation in load and solar irradiance level for three phase grid connected DSTATCOM based PV system controlled using PSO, GA, and GWO respectively. In Fig. 6, the performance of various parameters are observed such as supply voltage (vs), supply current (is), load current (iL), compensator current (ic), DC link voltage (Vdc) of DSTATCOM and PV output power (Ppv). At the beginning period of simulation the solar irradiance is 4500 W/m2. At t = 0.3 sec irradiance is decreased to 2500 W/m2. In Fig. 6 (a - c), decrease in PV output power (Ppv) is observed. Since the load power is same, hence the supply current magnitude is increased during this time. DC link voltage is also affected by irradiance change but settles rapidly. The irradiance is restored back to 4500 W/m2 after 0.1 sec. At time t = 0.5 sec, load is increased and hence an increase in the load current is observed. The PV provides the rated power (4500 W) as before. The DC link shows some transients which get settled due to optimization controller action in steady state. The compensator current also changes and the supply current increases to meet the new load demand. During load change as well as irradiance change, the supply current remains sinusoidal even in the presence of distorted load currents. All three algorithms successfully improved the power quality problems in three phase grid connected PV system. The grid voltage and current has minimum value of the harmonics observed in Fig. 7(a&b). Which is less than 5% of IEEE 519 standard.
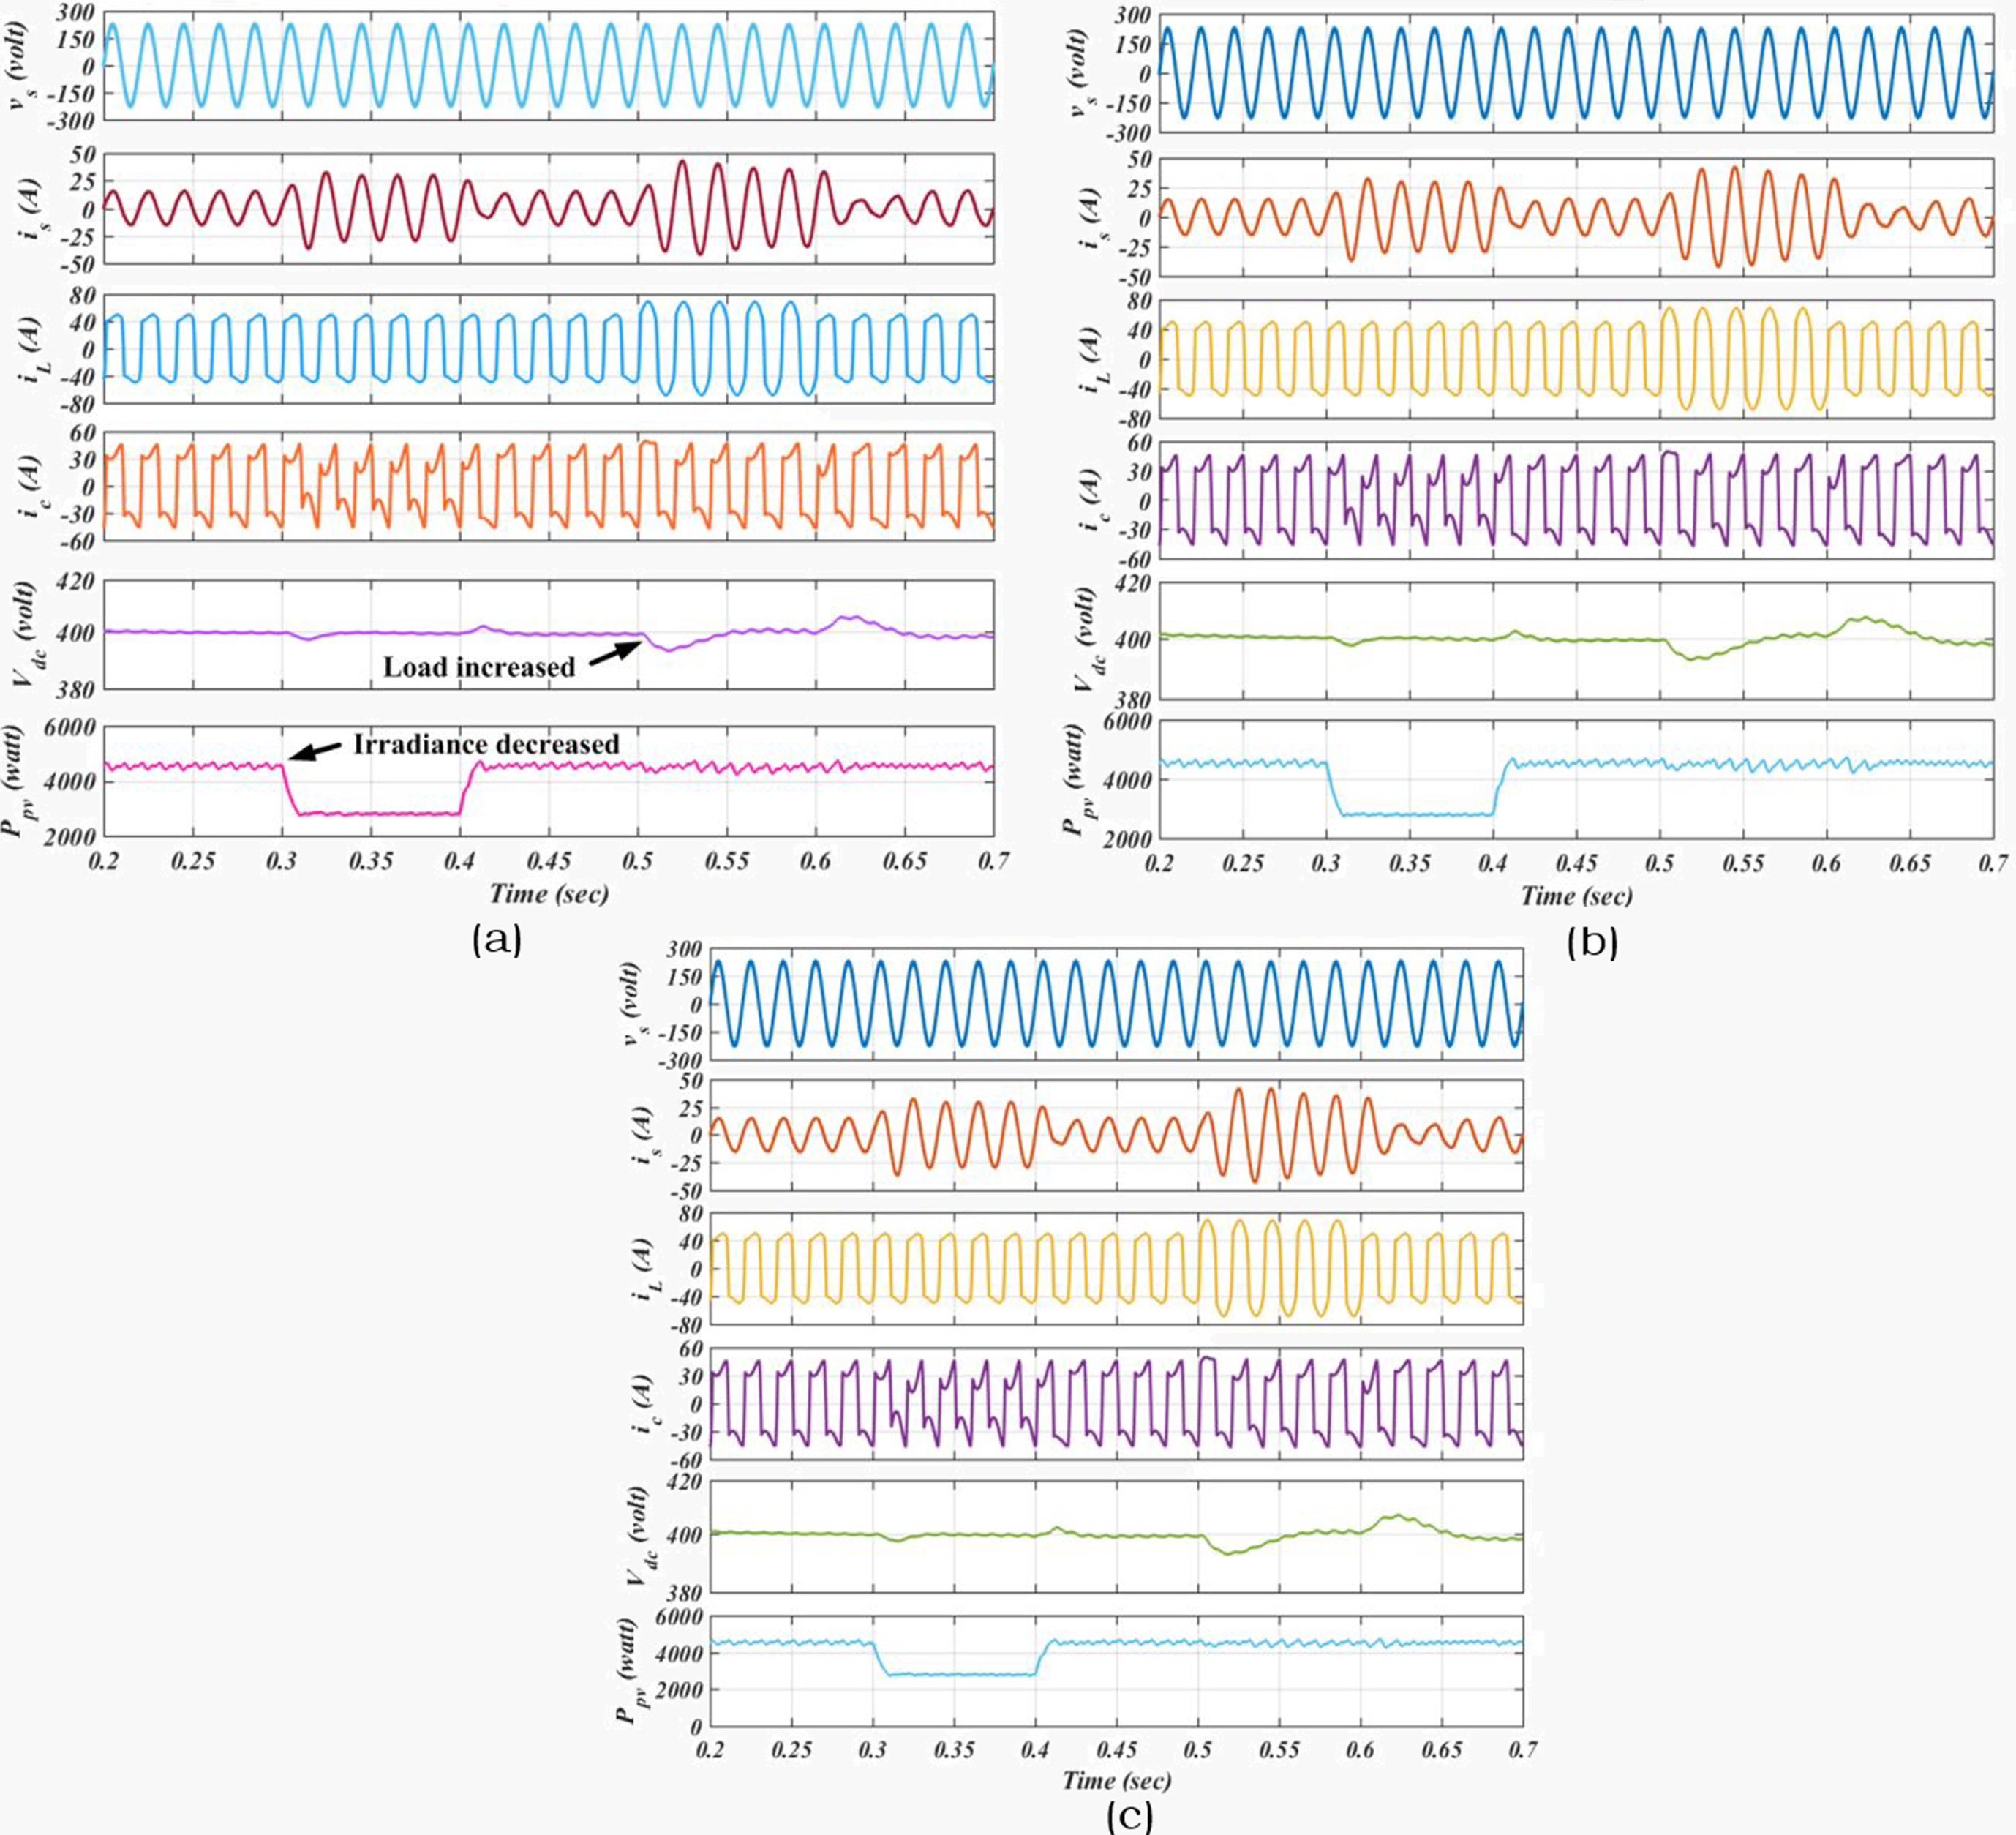
Simulation results for (a) PSO, (b) GA, and (c) GWO based algorithm.
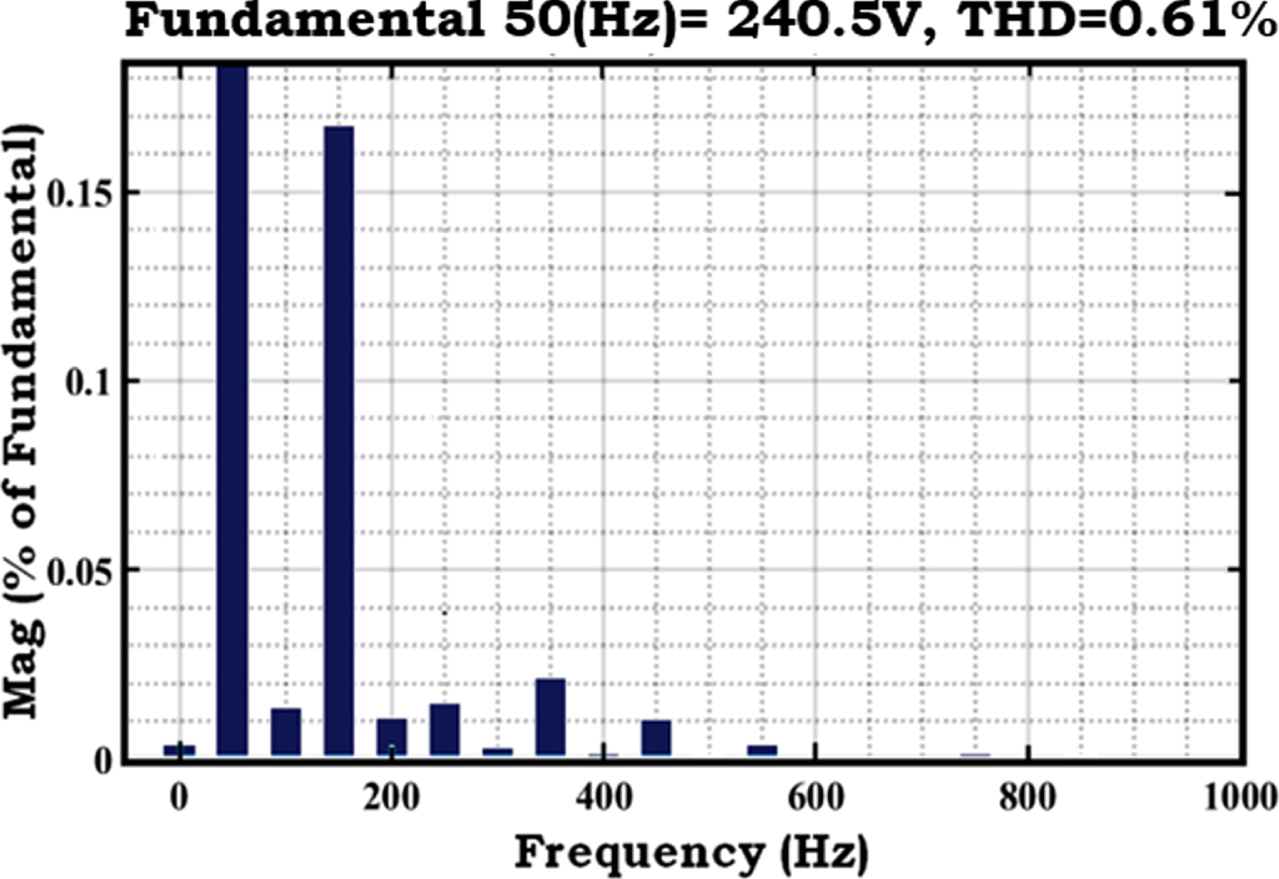
THD of grid voltage.
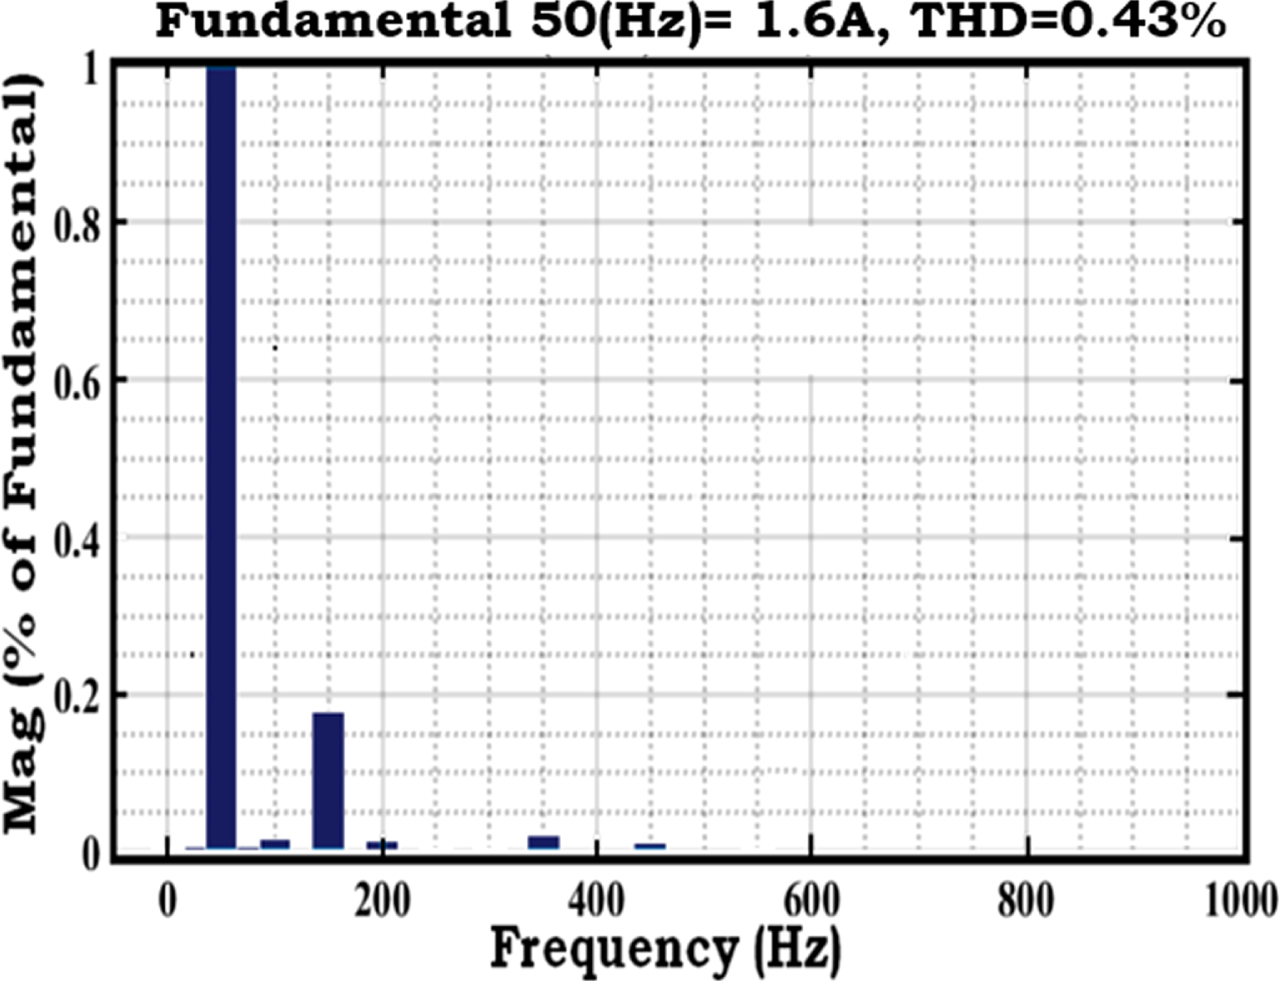
THD of grid current.
The rating of the proposed solar-PV system is 1 kW and the PV panels are connected in series and parallel combinations. In a steady state low input current ripple in grid tied converter system is applicable to reduce the PV panel efficiency. When connected to the non-linear grid tied PV system recommended to the converter should optimizes the amount of power that may be derived from the MPPT based PV array. Without the requirement of additional filter circuit or capacitance the impact of the ripple current can be substantially reduced. With the help of maximum power extract from the MPPT-solar panel different PV irradiance and standard test conditions is 25°C. Per day solar profile with different irradiation climate changes and load demand was depicted as Fig. 7 (c).

Input solar irradiance and temperature values.
The optimization algorithms discussed above are implemented on prototype hardware using dSPACE1104. The different irradiation levels are controlled and tuned by proposed GWO algorithms. The hardware results are recorded with the help of power analyzer and DSO as shown in Fig. 8.
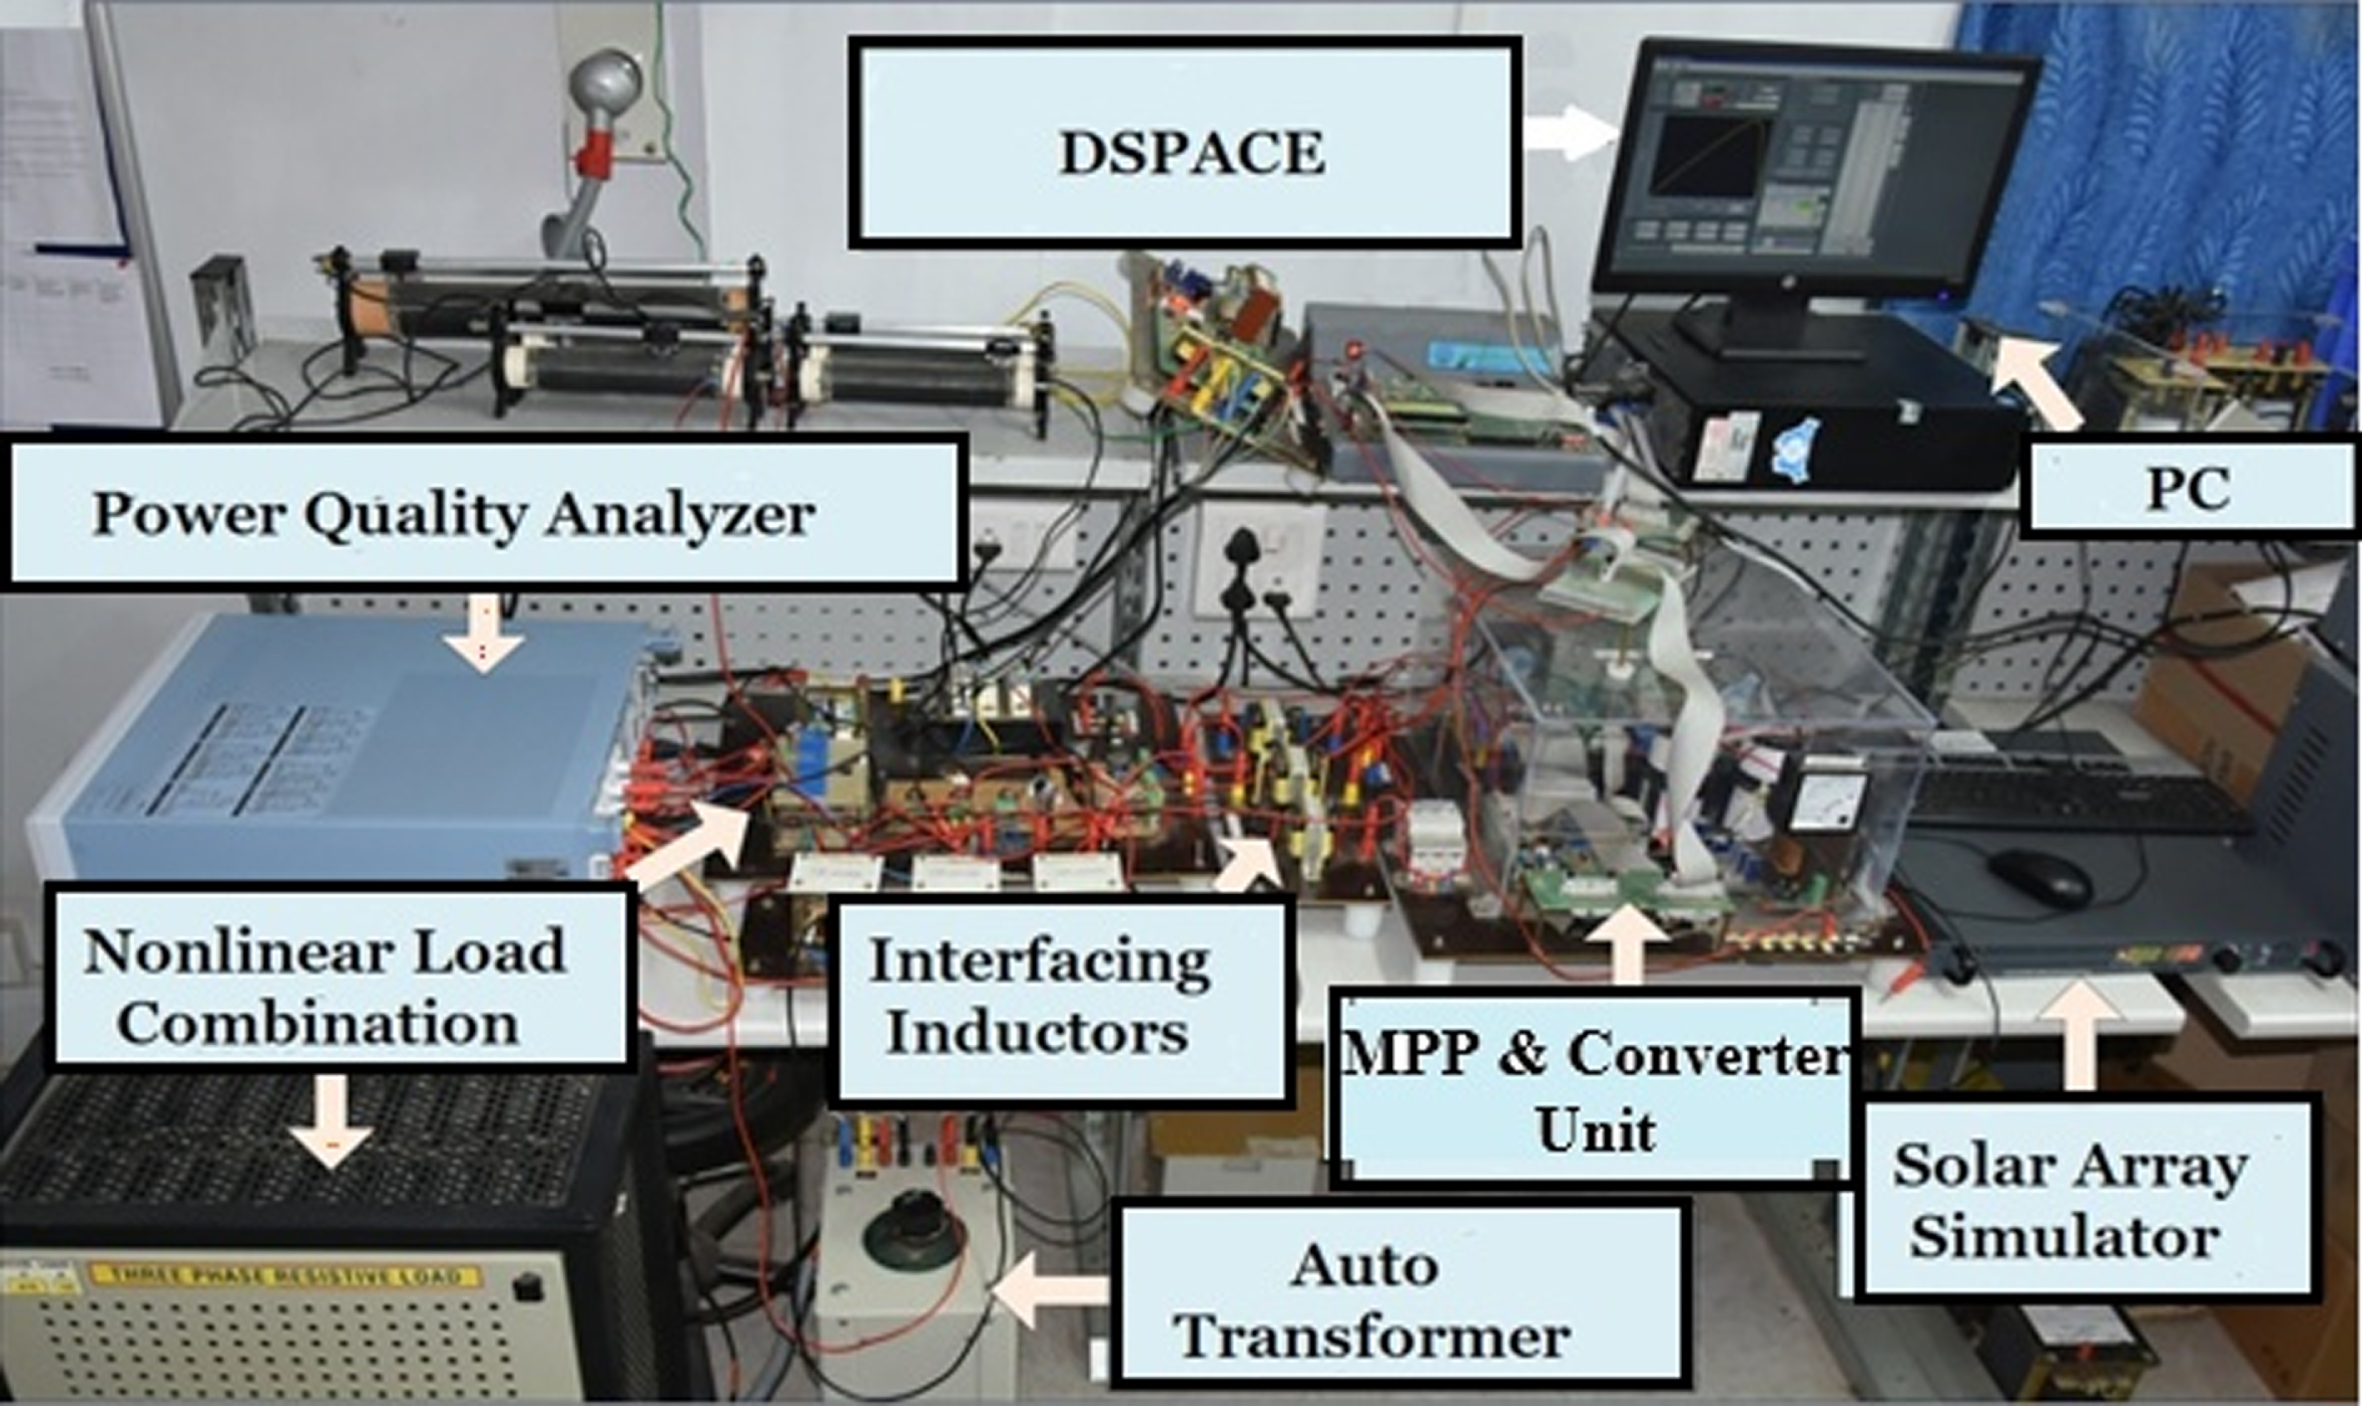
Experimental prototype unit.
A PSO based optimization scheme for PQ improvement and grid integration of (2 panel) 260 W PV system was implemented on the prototype hardware setup of 440 V, 50 Hz, three-phase distribution system feeding non-linear load (grid).
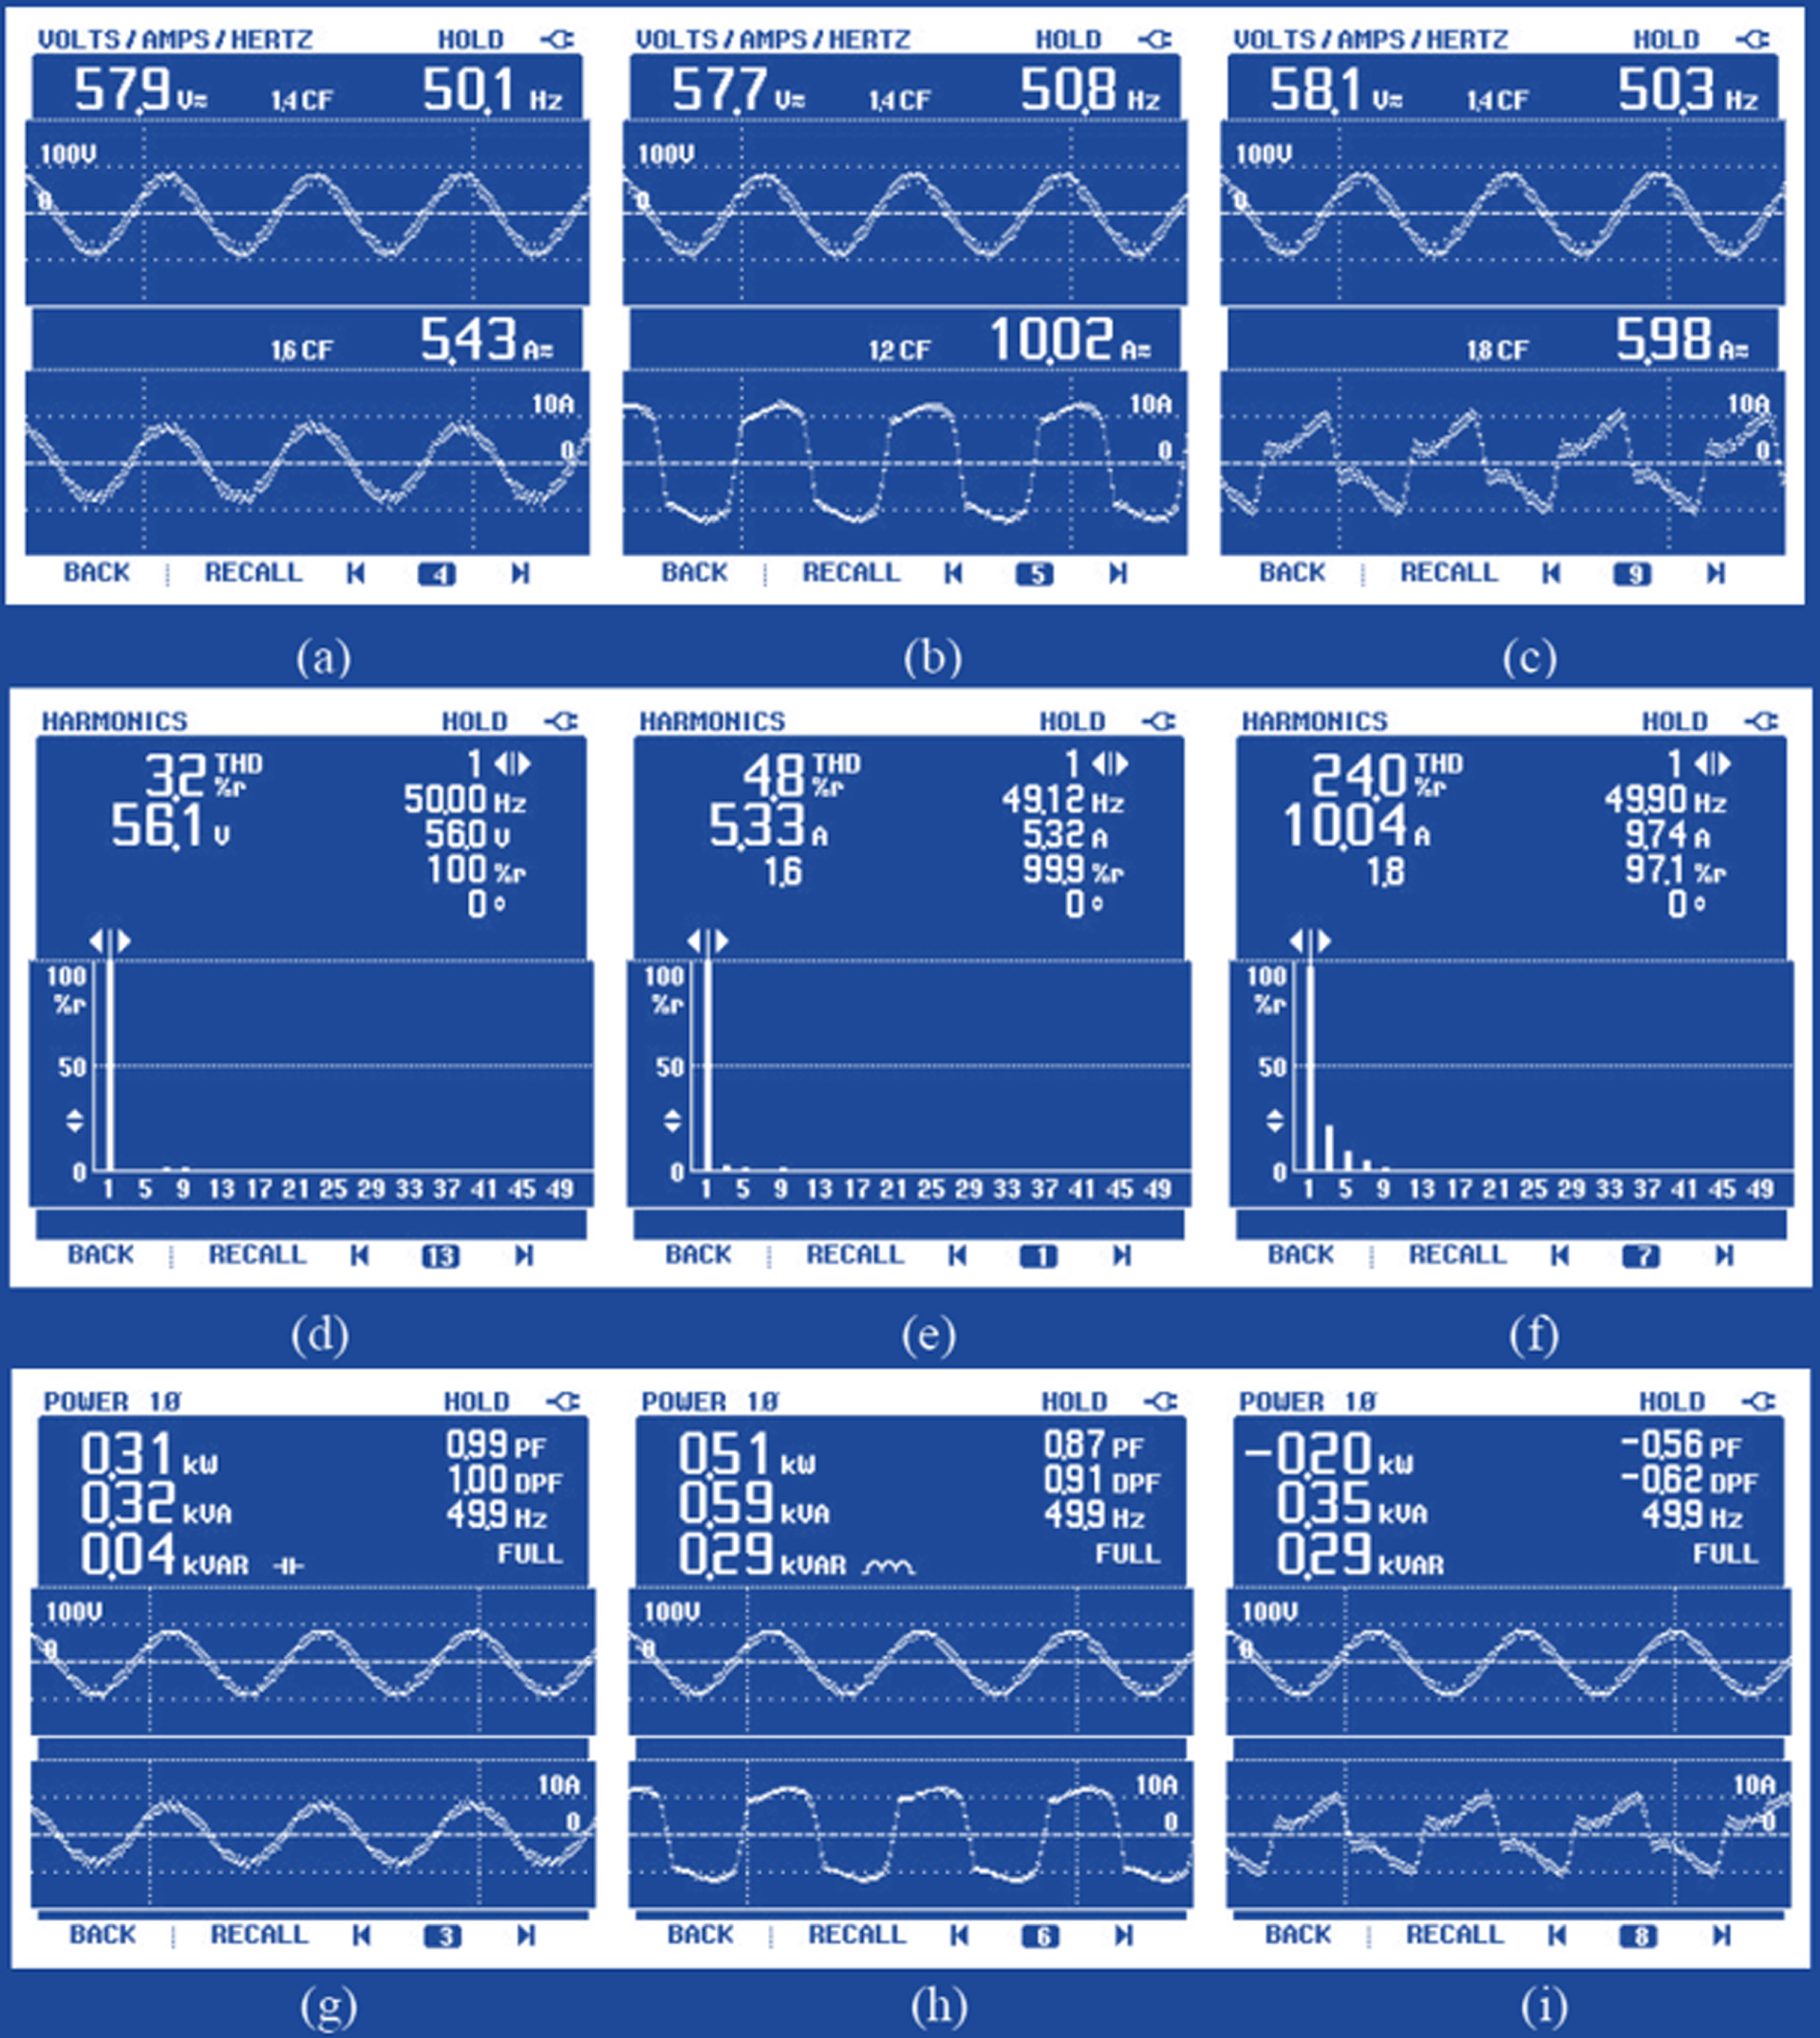
Figure 9 shows the steady state hardware results, which is PV-DSTATCOM connected non-linear load outcome. Figure 9(a)-(c) shows supply current (is), load current (iL), and compensator current (ic) along with supply voltage (Vs) respectively. The supply current magnitude is reduced due to active power injection from PV source. This shows real power flow between PV system and load. Figure 9(d)-(f) shows harmonic content of supply voltage (Vs), supply current (is), and load current (iL). The supply current THD obtained in this case is 4.9% which is less than 5% as prescribed in IEEE 519 [21–24]. Figure 9(g)-(i) shows the power flow between supply, load and compensator. The supply delivers 290 W of real power and 40 VARs of reactive power at PF close of 0.99. The load has demand of 460 W of real power and 250 VARs of reactive power. The DSTATCOM based compensator with PV interfaced at DC link provides 180 W real power and 260 VARs reactive power. When the load is disconnected, it is seen that supply current and compensator current change their phase. Now the supply voltage and supply current are out of phase. This means that the excess PV power enters the grid. When PV source is disconnected and it is observed that compensator current reduces in magnitude significantly. Also the compensator is consuming power instead of delivering it because of absence of PV. The supply current is also in-phase with the supply voltage indicating supply is feeding power to the load. The DC link settles down to the set reference value and the Id reduces to zero. Iff is almost the same, the reference current has phase reversal, and this indicates that the power flows from PV to grid. The PV output power is more than real power required by load. When PV is disconnected, Iff is reduced to zero but Id is remains constant. The reference current phase gets reversed due to absence of PV output and load gets real power fed directly from grid.

Steady state waveforms for grid connected PV system using PSO algorithm (a-c) Waveforms of (a) supply current (is) (b) load current (iL) (c) compensator current (ic) (d-f) THD analysis (d) supply voltage (vs) (e) supply current (is) (f) load current (iL) (g-i) Active and reactive power for (g) supply (h) load (i) compensator.
Figure 10 (a-i) shows the similar steady state hardware results with PV connected for nonlinear load using GA technique. For GA optimization control, the supply current THD is 4.8%., and supply voltage THD is 3.2%. The supply delivers a reduced real power of 310 W and 40 VARs of reactive power. The load has demand of 510 W of real power and 290 VARs of reactive power. The compensator now provides 200 W of real power and 290 VARs of reactive power. The load and compensator reactive power is almost the same.
Steady state waveforms for grid connected PV system using GA algorithm (a-c) Waveforms of (a) supply current (is) (b) load current (iL) (c) compensator current (ic) (d-f) THD analysis (d) supply voltage (vs) (e) supply current (is) (f) load current (iL) (g-i) Active and reactive power for (g) supply (h) load (i) compensator.
Figure 11 (a-i) shows that steady state experimental results of grid integration PV. The DSTATCOM is controlled using GWO technique. The supply current THD is 3.9% whereas the THD of load current and PCC voltage are 24.9% and 2.8% respectively. The supply delivers 239 W of real power and 38 VARs of reactive power at 0.99 PF. The load has demand of 430 W of real power and 220 VARs of reactive power. The compensator provides 190 W of real power and 230 VARs of reactive power. It is inferred that out of total real and reactive power demand of the load, the PV interfaced DSTATCOM meets the total reactive power demand of the load. The PV source injects real power as per its capability. The remaining real power demand of the load is met from the grid. The performance evaluation of three optimization algorithm viz PSO, GA, and GWO have been investigated on three phase PV interfaced grid connected system. A comparison of different performance aspects is described in detail in the next section.

Steady state waveforms for three phase grid connected PV system using GWO based algorithm (a-c) Waveforms of (a) supply current (is) (b) load current (iL) (c) compensator current (ic) (d-f) THD analysis (d) supply voltage (vs) (e) supply current (is) (f) load current (iL) (g-i) Active and reactive power for (g) supply (h) load (i) compensator.
A comparison of all three optimization control algorithms PSO, GA, and GWO is carried out through simulation and experimental studies for a three phase grid connected PV system. The PV system is integrated to the grid and mitigation of PQ problems using a three phase H bridge based DSTATCOM have been studied. The three control techniques under consideration are PSO, GA and GWO. Based on the experimental results, performance of the algorithms has been investigated in presence of non-linear and linear loads under similar test conditions. Table 3 shows that comparison of control algorithms for grid connected PV system. It has been observed that the supply current THD obtained using PSO, GA, GWO technique is 4.9%, 4.8% and 3.9% respectively.
Compiled for a suitable comparison of algorithm
Compiled for a suitable comparison of algorithm
The load current THD in these cases are 24.6%, 24.0% and 24.9% respectively. The supply voltage has THD 2.6%, 3.2% and 2.8% respectively. As observed form the Table, the THD obtained using GWO optimization method is comparatively better than obtained using GA and PSO with PV integrated to the system. Table 4 shows the steady state power flow between supply, load and DSTATCOM when PV system is connected. During the real-time application comparison of both simulation and prototype harmonics level, simulation model is much higher than the hardware model, because of the impedance variation on across the different load conditions.
Power flow measurement in different algorithm
The main contribution of this paper is to develop a grid integrated three phase PV system. It has been observed that the PV system feeds real power into the system due to which active power delivered from grid is effectively increased. Different optimization algorithms was implemented such as PSO, GA, and GW. For all optimization control optimization algorithms were developed and executed. The Soar-PV supply feeds the real power demand of load based on the proposed algorithm. The limitation of the proposed work is that the compensator supplies majorly for load reactive power requirements. The input supply feeds most of the active power required by DSTATCOM. Recommendation of the future scope active power is provided by Solar-PV in all three cases almost the same. The performance of all three optimization control algorithms are compared and nearly UPF is maintained in the grid-tied PV system. The proposed GWO algorithm has better performance than other optimization methods such as PSO and GA based on the observation made on the grid output. Voltage harmonics THD (0.6%), Current harmonics (0.4%), and the power factor (0.89) was measured successfully.
Annexure-1
Proposed Super-lift Inverter (sli)
An extremely significant element within this design of SLI, which is the number of required switches against the required voltage in the multilevel waveform. Its generate multiple output level (+7 V 0 & –7 V), (+6 V 0 & –6 V), (+5 V 0 & –5 V), (+4 V 0 & –4 V), (+3 V 0 & –3 V), (+2 V 0 & –2 V), and (+ 1 V 0 & –1 V). With this, connection expressed SLI number of multilevel has been improved as point out below. Where (C) is specified the number of capacitors adding with only one switch used in the MLI equation as shown in (1),
The benefit of this proposed SLI topology is a less number of equipments, and less voltage stress across the capacitor unit or main capacitor bank. The capacitor unit (C6 –C12) across the Single Pole Multi-Through (SPMT) switch is developed by multilevel output as shown in the equation (21). The main capacitor is combined with SPM-T switch, which is used to divide the MLI output voltage into fifteen levels as shown in Fig. 4. The capacitor band switch (or) SPM-T switch Turn on positive charging output terminal voltage from V7, V6, V5, V4, V3, V2, V1, V0, and negative discharging output terminal voltage turn off are -V1, -V2 -V3, -V4, -V5, -V6, & -V7 respectively in SLI. The advantages of proposed topology are: (1) generates a maximum number of multilevel outputs increased by using multiple capacitors (C6 –C12) without increasing the number of additional switches, and circuit topology, (2) a Minimum number of semiconductor devices are used in SLI, (3) Reducing voltage stress across the semiconductor devices, and (4) the symmetrical SLI strategy utilizes single MOSFET switch and capacitor energy banks connected with the ground, so that the S-PV source voltage level is increasing and this can generate a higher incentive in MLI output voltage. The SLI differ from conventional inverters, as an individual inverter fed into four PV modules are series-connected in a single S-PV module, this may improve the overall efficiency of the system.
Modes of Operation (Positive half cycle (90°–180°))
The Symmetric MLI is operated, when the inverter switch S2 is ON. The inductor (L3), and capacitor (C5) are charged by the DC supply. The output voltage switch position (V0) is in a positive half cycle (0–90° & 90°–180°) mode, when it is at the node in between D7 (diode) and C6,12 (capacitor), there will be a potential voltage across the capacitor Vc6 and Vc12. When the switch is ON condition, the wiper pole terminal voltage (VWN) is equal to the Vdc switching (ON) period. One wiper pole switch is one pole multi-terminal switch, it’s also called as SPM-T. V0 (mode: 1) = 0 (neutral) when it is at the node in between C6 and V0, there will be a potential voltage across the output will be followed by Two Pole Two Through (2P2T) switch, once the 2P2T switch is closed, that forward output voltage will be transfer to the next state of grid load as shown in Fig. 5(a). The SLI Switching methods are shown in Table 4. The same process should be followed,

(a) Mode: 1. (b) Mode 2. (c) Mode: 3. (d) Mode: 4. (e) Mode: 5. (f) Mode: 6. (g) Mode: 7. (h) Mode: 8.
SLI switching method
When it is at the node in between N (neutral) and C6, there will be potential voltage rise across the capacitor (-Vc6), It will be followed 2P2T switch, once that switch is closed, the reverse output voltage will be transfer to the next state of load (R, RL). The capacitor switching voltage across the SPM-T switch as shown in Fig. 7. The same process should be followed in the next negative quadrant cycle of the load (270°–360°).
V1 (mode:2) = +1/1Vdc when it is at the node in between the capacitor C7 and C6, there will be a potential voltage rise across the capacitor Vc6 and finally, the SPM-T switch is at a point V0, that shows the voltage path depicted in Fig. 5(b)
V2 (mode:3) = +1/2Vdc when it is at the node in between the capacitor C8 and C7, there will be a potential voltage rise across the capacitor Vc7, that shows the voltage path is given in Fig. 5(c)
V3 (mode:4) = +1/3Vdc when it is at the node in between the capacitor C9 and C8, there will be a potential voltage rise across the capacitor Vc8, that shows the voltage path is given in Fig. 5(d)
V4 (mode:5) = +1/4Vdc when it is at the node in between the capacitor C10 and C9, there will be a potential voltage rise across the capacitor Vc9 as shows the voltage path given in Fig. 5(e).
V5 (mode:6) = +1/5V12dc when it is at the node in between the capacitor C11 and C10, there will be a potential voltage rise across the capacitor Vc10, that shows the voltage path is given in Fig. 5(f).
V6 (mode:7) = +1/6Vdc when it is at the node in between the capacitor C12 and C11, there will be a potential voltage rise across the capacitor Vc11 as shows that the voltage path is given in Fig. 5(g).
V7 (mode: 8) = +1/7 Vdc under the condition, 2P2T switch is closed. When it is at the node in between D7 (diode) and C12 (capacitor), there will be a potential voltage rise across the capacitor Vc12 as shows in Fig. 5(h). It is taken as the accurate charging output voltage for the positive half cycle of the load. The same process should be followed in the next positive quadrant cycle of the load (90°–180°).
3.1.2 NEGATIVE half cycle of SLI (180°–360°)
The output voltage switching position (-V6) is in negative half cycle mode when it is at the node in between N (neutral) and C11, there will be a negative potential voltage rise across the capacitor (-Vc6), which is named as, mode: 9 = –1/6Vdc, when it is at the node in between the capacitor C10-C11, there will be a negative potential voltage rise across the capacitor (-Vc11), that shows in voltage path is given in Fig. 6(a). -V5 (mode: 10) = -1/5Vdc, when it is at the node in between the capacitor C9-C10, there will be a negative potential voltage rise across the capacitor (-Vc10), that shows in voltage path is given in Figure 6(b). -V4 (mode: 11) = -1/4Vdc, when it is at the node in between the capacitor C8-C9, there will be a negative potential voltage rise across the capacitor (-Vc9), that shows in voltage path is given in Figure 6(c). -V3 (mode: 12) = -1/3Vdc, when it is at the node in between the capacitor C7-C8, there will be a negative potential voltage rise across the capacitor (-Vc8), that shows in voltage path is given in Fig. 6(d). -V2 (mode: 13) = -1/2Vdc, when it is at the node in between the capacitor C6-C7, there will be a negative potential voltage rise across the capacitor (-Vc7), that shows in voltage path is given in Fig. 6(e). -V1 (mode 14) = -1/1Vdc, when it is at the node in between the capacitor C6-N (neutral), there will be a negative potential voltage rise across the capacitor (-Vc6) and V0, that shows the voltage path is given in Fig. 6(f). Mode-15 is the operating point as neutral.

(a) Mode: 1. (b) Mode: 2. (c) Mode: 3. (d) Mode: 4. (e) Mode: 5. (f) Mode: 6. (g) Mode: 7.