
Abstract
Fuzzy clustering is an important research field in pattern recognition, machine learning and image processing. The fuzzy C-means (FCM) clustering algorithm is one of the most common fuzzy clustering algorithms. However, it requires a given number of clusters in advance for accurate clustering of data sets, so it is necessary to put forward a better clustering validity index to verify the clustering results. This paper presents a ratio component-wise design method of clustering validity function based on FCM clustering method. By permutation and combination of six clustering validity components representing different meanings in the form of ratio, 49 different clustering validity functions are formed. Then, these functions are verified experimentally under six kinds of UCI data sets, and a clustering validity function with the simplest structure and the best classification effect is selected by comparison. Finally, this function is compared with seven traditional clustering validity functions on eight UCI data sets. The simulation results show that the proposed validity function can better verify the classification results and determine the optimal clustering number of different data sets.
Keywords
Introduction
With the continuous development of science and technology and the continuous accumulation of network information data, human society has entered a new era of data explosion. In order to obtain valuable information from massive data, data mining technology emerges at the historic moment [1]. Data mining has been widely used in database, artificial intelligence, machine learning and other fields. As an important means of data mining, clustering analysis has also been further developed and studied [2, 3]. Cluster analysis is an unsupervised learning method, and its core idea is to classify the samples with similar attributes in the data without prior knowledge into one category, and the samples with dissimilar attributes into different categories, so that the samples of the same category are as similar as possible, and there are large differences among samples of different classes [4]. Current clustering algorithms are mainly divided into hierarchical clustering algorithm, partition clustering algorithm, density clustering algorithm and model clustering algorithm [5–8]. Hard-partition K-means clustering algorithm [9], as one of the algorithms to divide clustering, adopts an either-or method to divide data, that is to say that each data sample must be clearly divided into different classes. However, in fact, most data are uncertain, and a data sample may belong to multiple classes to varying degrees [10]. In order to provide a better dividing basis for data samples with similarity between clusters and be closer to the real needs [11], Bezdek introduced the concept of fuzzy set [12] into the K-means clustering algorithm and proposed the fuzzy C-means (FCM) clustering algorithm [13]. FCM clustering algorithm has become one of the most widely used clustering algorithms with its characteristics of being more consistent with the actual sample situation, convenient operation and wide application range [14].
FCM clustering algorithm is to determine the best classification results based on the validity function. But because sample data is with a greater difference between the structure and properties of a data set, any kind of clustering validity function is impossible to deal with all of the data set. So based on the status quo, new clustering validity functions were constantly proposed and it has also been favored by scholars at home and abroad. Clustering validity functions are mainly divided into the following two categories.
1) Fuzzy clustering validity function only based on membership degree. For example, Bezdek firstly proposed the validity function partition coefficient (V PC ) [15] and partition entropy (V PE ) [16] for fuzzy clustering in 1974. V PC and V PE have simple structure and small computation, but they show a monotony trend with the change of the number of clusters. Subsequently, Dave proposed an improved partition coefficient (V MPC ) in 1996, which could suppress the characteristic that the partition coefficient decreases monotonously with the number of clusters, but there was no improvement for other disadvantages of V PC [17]. In 2004, Chen and Links proposed a new validity index (V P )based on subtraction form, which has been successfully applied to nonlinear fuzzy model, power system modeling, mechanical performance prediction and other fields [18]. In 2010, Zalik proposed a validity function (V CO ) using membership degree to define overlap degree and compactness [19]. Then Yong-li Liu introduced V CO into the module of separation degree in 2019 and proposed the CSBM validity function [20], thus improving the stability of V CO .
2) Fuzzy clustering validity function based on membership degree and geometric structure of data set. For example, in 1991, Xie and Beni proposed the clustering validity function (V XB ) based on scale operation [21], which was the first clustering validity function considering the geometric structure of data sets, and laid a solid foundation for the field of clustering validity function. However, this validity function has two shortcomings. (1) When the clustering number c tends to the number of data samples, V XB tends to 0. (2) When the ambiguity index is very large, V XB becomes infinite. In 2005, Kuo-Lung Wu proposed a clustering validity function (V PCAES ) based on normalized partition coefficient and exponential operation [22]. Chi Yun et al. proposed the validity function (V FM ) in 2007 [23], which took into account two important evaluation indicators, partition entropy and fuzzy partition factor, and defined the compactness and separation of clusters. But its performance on noise data sets were poor. In 2015, Chib-Hung Wu proposed a validity function (V WL ) [24] by taking into account both the membership degree and the geometric structure of the data set, and could better suppress noise data. In 2019, Ling-feng Zhu et al proposed a new clustering validity function (V ZLF ) [25], which is composed of the ratio of compactness and separation, and can accurately divide high-dimensional data sets. Liu proposed the validity function (V IMI ) in 2021 [26], which is mainly characterized by a new definition of the separation measure and uses the imbalance ratio of two clusters to expand the center between distances. In the same year, Hong-yu Wang proposed a novel validity function (V HY ) based on the ratio of intra-class compactness and inter-class separation [27], etc.
A clustering validity function is composed of several components and different components contain different geometric meaning, but also play different roles in a validity function. Many clustering validity functions are put forward by scholars using components for empirical trial-and-error. This subjective method has a certain degree of contingency, and there are very few researches on fuzzy clustering validity functions based on components. Therefore, six FCM clustering performance evaluation components defined in this paper are continuously permutation and combination in the form of ratio in an objective way, and several newly formed validity functions are verified on the UCI data set so as to analyze the influence of different components and select the best validity function among them. This function is compared with typical FCM clustering validity functions on UCI data sets. Experimental results show that this validity function can obtain correct clustering results on UCI data sets, and can accurately divide high-dimensional data and overlapping data.
FCM clustering algorithm
The fuzzy C-means (FCM) clustering algorithm proposed by Bezdek is the most representative fuzzy clustering algorithm at present. The principle of FCM clustering algorithm is to divide the set X ={ x1, x2, ⋯ , x
n
} composed of n data objects into c fuzzy clustering and find the minimum objective function through iteration, which is defined as follows [28]:
The process of the FCM clustering algorithm is described as follows.
Step 1: Given the cluster parameters c and fuzzy factor m (usually between 1.5 and 2.5).
Step 2: Initialize the cluster center matrix V and membership matrix U, and obtain initial membership matrix U0 and initial cluster center V0.
Step 3: According to Equation (2), update the cluster center Vt+1 ={ v1, v2,⋯,v
c
}. among it, V
t
represents the clustering center at the current time, Vt+1 represents the clustering center at the next moment.
Step 4: According to Equation (3), update the fuzzy partition matrix u
ij
(t+1) = (u
ij
) c×n, where u
ij
(t) represents the membership at the current time and u
ij
(t+1) represents the membership at the next moment.
Step 5: Calculate e =∥ ut+1 - u t ∥. If e ⩽ ɛ (ɛ is a threshold value usually from 0.001 to 0.01), the algorithm is stopped and the final clustering result is calculated; Otherwise t = t+1 and go to Step 3.
Cluster validity evaluation component
Based on the constituent characteristics of typical clustering validity functions, this paper defines six cluster validity evaluation components (CPs). These components are used to represent the tightness, similarity, variation, separation and overlap of data sets respectively.
(1) Compactness
Equation (4) is the criterion function of FCM clustering algorithm, which is used to define the tightness within the data set. Its geometrical significance is the sum of the distance between clustering center v
i
and data sample x
j
. The smaller the value of CP1 is, the closer the distance between the data sample x
j
and its corresponding cluster center v
i
is, that is to say that the higher the similarity degree of the data within the class is, the closer the data within the class is.
(2) Variability
Exponential operation is highly useful in dealing with the classical Shannon entropy and cluster analysis. Because the exponential function has monotonicity, it can suppress the interference of noisy data. At the same time, it can measure the distance between the data object and the cluster center within the interval of (0,1] [22]. Therefore, Equation (5) measures the distance between the data x j and the cluster center v i and the distance between sample points based on the form of exponential function so as to represent the degree of variation of data within the class.
Similarly, the smaller the value of CP2 is, the lower the variation degree of the data in the class is, and the more stable the data in the class is.
(3) Overlap
Equation (6) represents the degree of overlap between data sets based on the membership degree. If the data point x
k
of the overlapping part belongs to the i-th cluster, the membership degree u
ik
will be close to 1, while the membership degree u
jk
of the data point x
k
belongs to the j-th cluster will be close to 0. If the overlapping data is separated better, then the difference of |u
ik
- u
jk
| will be closer to 1, and the value of 1 - |u
ik
- u
jk
| will be smaller. Therefore, CP3 achieves a very small value indicating better classification.
(4) Similarity
Equation (7) represents the square sum of the minimum membership degree of data point x
j
belonging to cluster center v
i
. The larger the value of CP4 is, the higher the membership degree of data point and its corresponding cluster center is, and the more similar the data within the class is.
(5) Separation
Equations (8) and (9) are two components used to define the overlap degree between classes. The geometric meaning of
In order to explore the component-wise design method of clustering validity functions, six components mentioned above are divided into two sets according to their extreme value characteristics: Ω1 ={ CP1, CP2, CP3 }and Ω2 ={ CP4, CP5, CP6 }. The components in Ω1 are valid for the minimum value, and the components in Ω2 are valid for the maximum value. Below, let’s freely choose 1, 2 or 3 components (don’t repeat) from Ω1are combined so as to form the molecular through the accumulation. Optionally choice 1, 2 or 3 in the component (don’t repeat) from Ω2 are combined so as to form the denominator through the accumulation. Based on the ratios to form a new clustering validity function, this composition rule is shown in Equation (10).
A total of 49 different clustering validity functions can be formed by permutation and combination of six components in the form of ratio according to the formation rules shown in Equation (10). In order to better present the results of the experiment, 49 validity functions were divided into 7 groups with 7 in each group. The results are shown in Tables 2, 12 and 14. These tables show the names, combination rules, and function structures of 49 formed validity functions. According to previous prior knowledge [29], fuzzy index 1.5 ⩽ m ⩽ 2.5 and cluster number

Change trend of first group of functions after normalization.
Change trend of second group of functions after normalization.

Change trend of third group of functions after normalization.
Change trend of fourth group of functions after normalization.

Change trend of fifth group of functions after normalization.
Change trend of sixth group of functions after normalization.
Change trend of seventh group of functions after normalization.
UCI data set
First group of clustering validity functions
Optimal clustering number of first group of functions for UCI data set
Second group of clustering validity functions
Optimal clustering number of second group of functions for UCI data set
Third group of clustering validity functions
Optimal clustering number of third group of functions for UCI data set
Fourth group of clustering validity functions
Optimal clustering number of fourth group of functions for UCI data set
Fifth group of clustering validity functions
Optimal clustering number of fifth group of functions for UCI data set
Sixth group of clustering validity functions
Optimal clustering number of sixth group of functions for UCI data set
Seventh group of clustering validity functions
Optimal clustering number of seventh group of functions for UCI data set
(1) First Group Simulation Experiment and Results Analysis
It can be seen from Fig.1 (a)-(b) that only S1 can obtain the correct clustering number c = 3 for Iris and Seeds datasets. Fig. 1(c) shows the clustering validity function S1, S2, S3 and S5 can accurately divide Phoneme data set into two categories. It can be seen from Fig. 1(d) that, except for S7, the other six functions can obtain accurate clustering results c = 2 for the Heart data set. As can be seen from Fig.1(e)-(f), only S4 can correctly divide Hfcr and Segment data sets, the remaining six validity functions cannot obtain the correct clustering number of these two data sets. In the effectiveness function comparison experiment of the first group, it can be found that none of 7 validity functions can achieve the best classification effect for all UCI data sets. Four UCI data sets can be distinguished correctly by S1, three UCI data sets can be correctly divided by S4 and the correct clustering number of two UCI data sets can be obtained by S2, S3 and S5. Only one real data set can be successfully distinguished by S6. However, S7 cannot distinguish any data set due to the irrationality of component collocation.
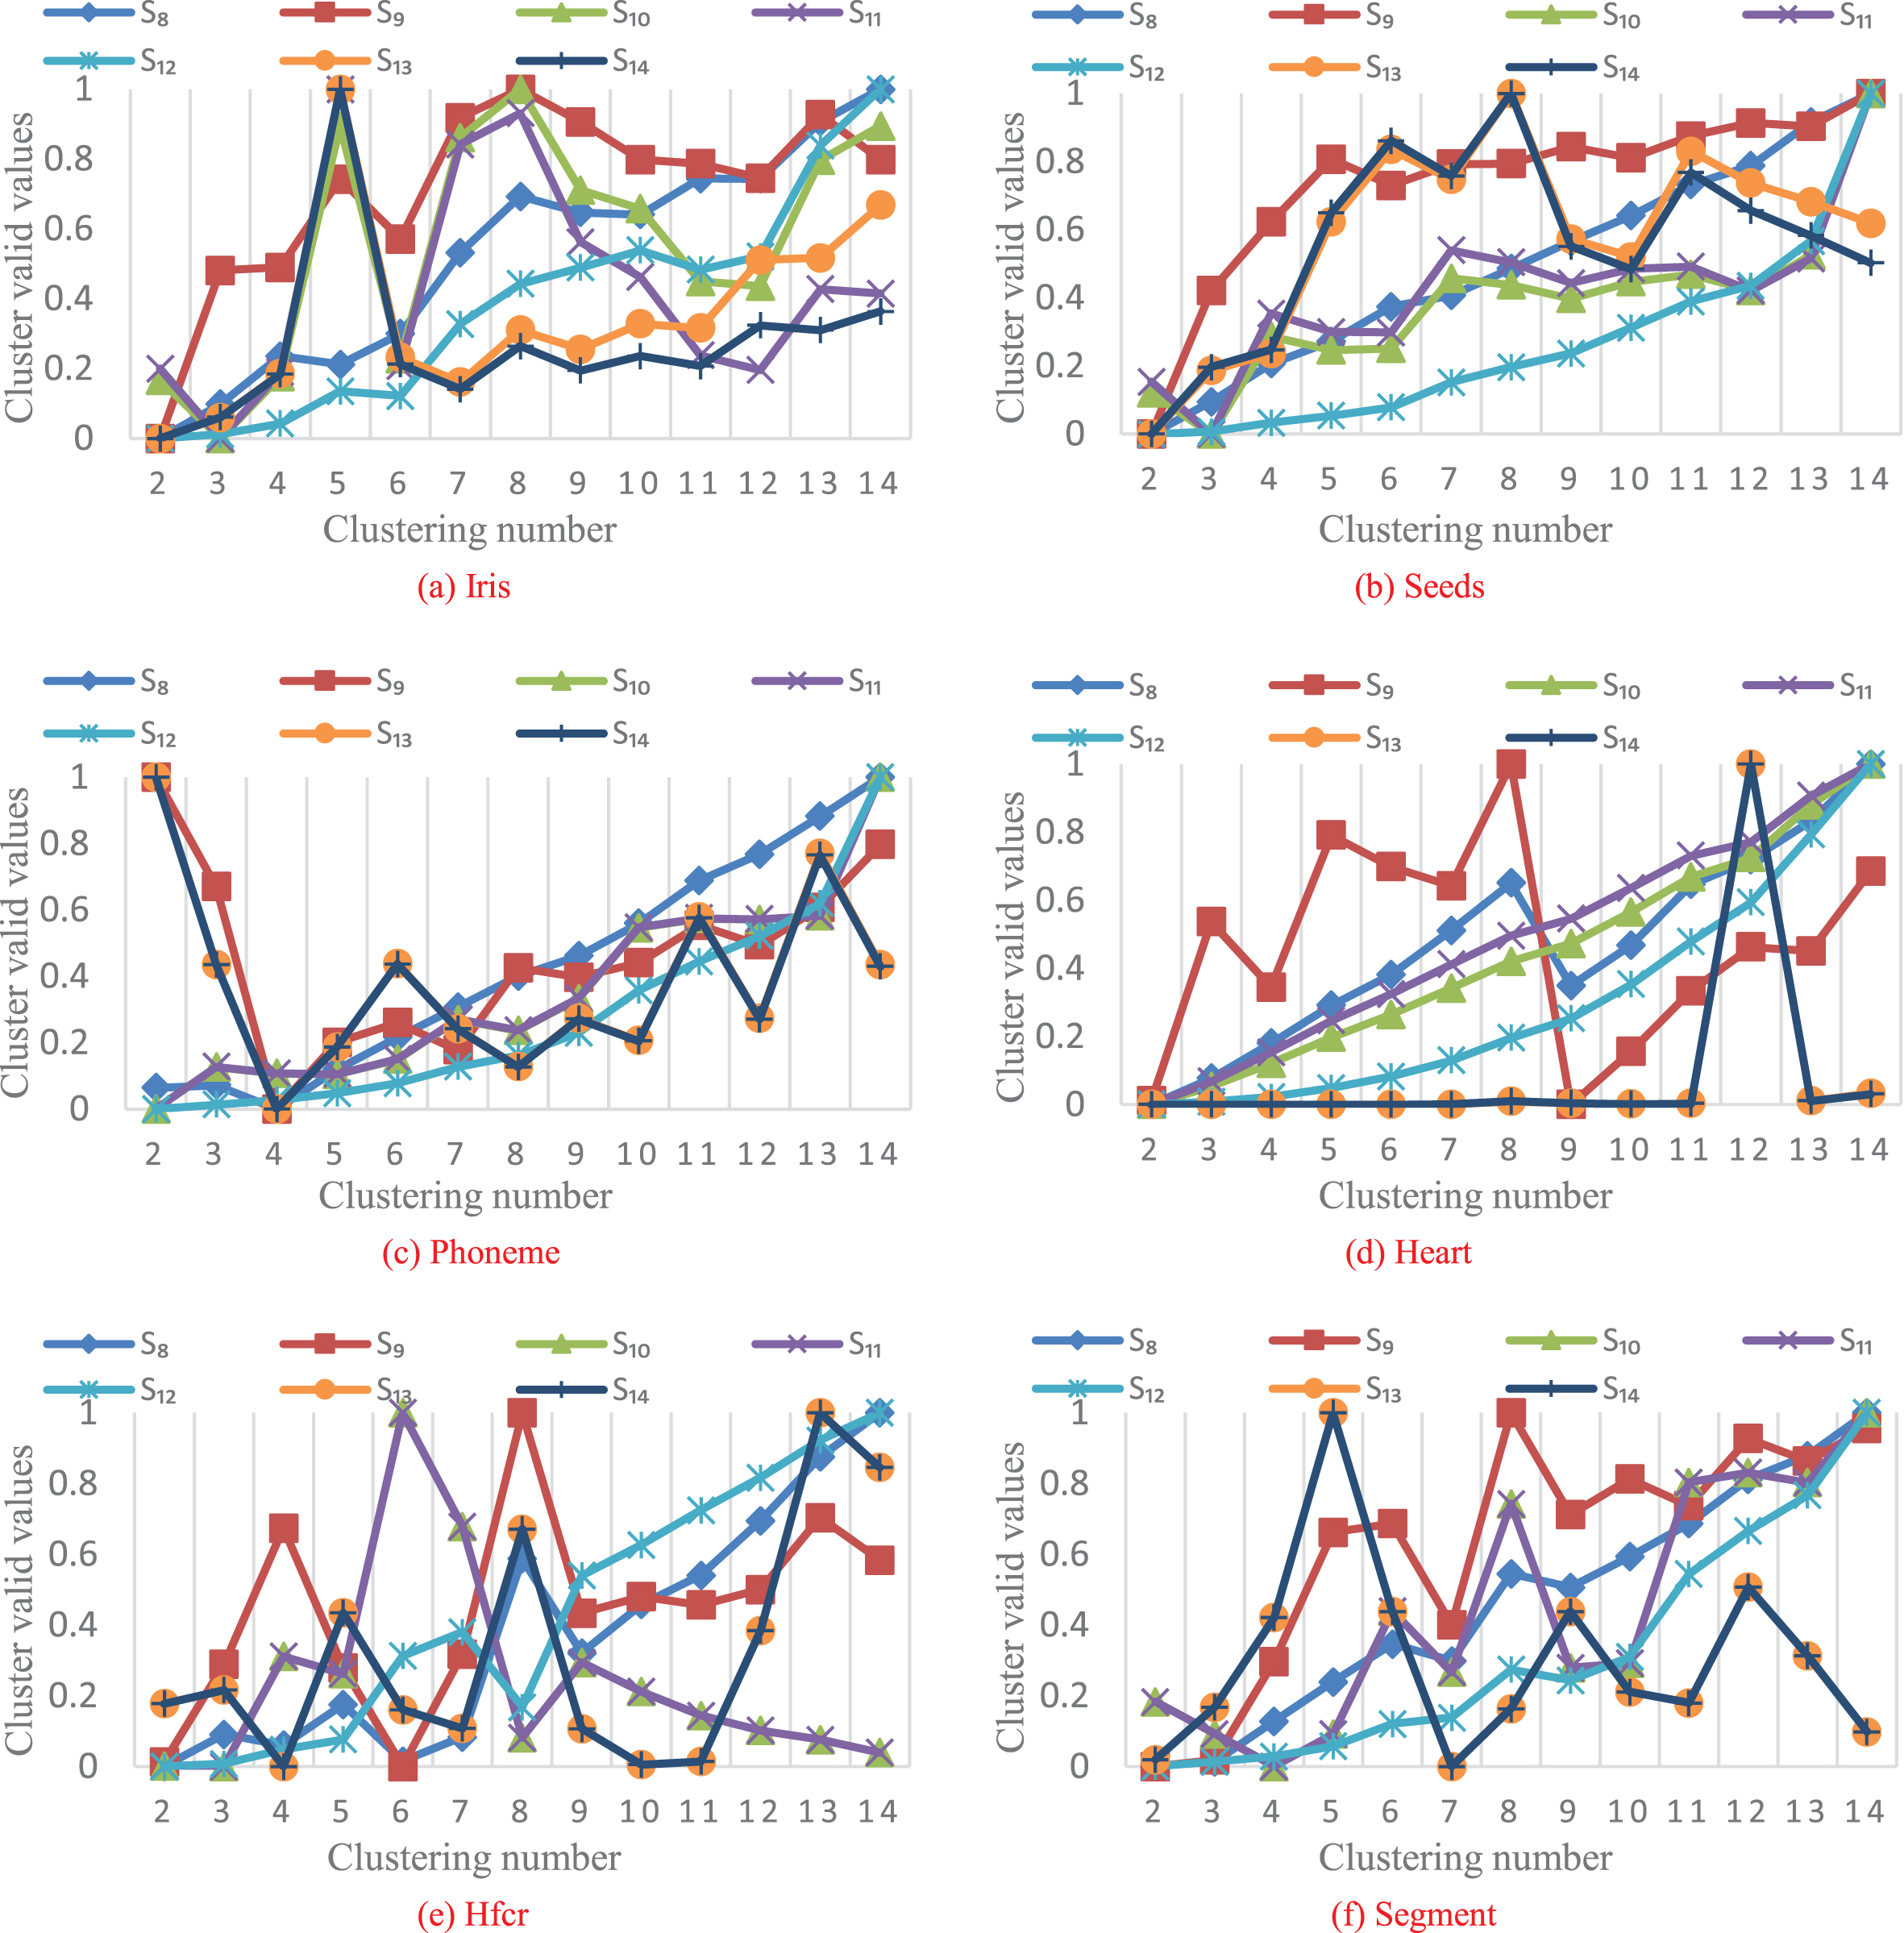
(2) Second Group Simulation Experiment and Results Analysis
It can be seen from Fig. 2(a)-(b) that only S10 and S11 can get the correct classification number c = 3 when facing the Iris and Seeds dataset. As can be seen from Fig. 2(c), S10, S11 and S12 can correctly divide Phoneme data set samples into two categories. Figure 2(d) shows that for the Heart data set, except for S9, the remaining six clustering validity functions can obtain correct classification results c = 2. It can be seen from Fig. 2(a)-(b) that S13 and S14 can obtain accurate clustering numbers for Hfcr and Segment dataset. Through the comparative experiment of the second set of validity functions, it can be found that these 7 validity functions (S8, S9, S10, S11, S12, S13 and S14) still cannot correctly divide all 6 UCI data sets. Among them, S10 and S11 can successfully distinguish four data sets; S13 and S14 can get the correct clustering results of three data sets; S12 can correctly classify Phoneme and Heart data sets; Compared with other validity functions, the performance of S8 is weak, and only one kind of data set can be separated. However, the clustering effect of S9 is the worst, unable to divide these 6 UCI data sets.
(3) Third Group Simulation Experiment and Results Analysis
As can be seen from Fig. 3(a)-(b), S19, S20 and S21 can correctly divide the Iris and Seeds dataset into 3 categories. According to Fig. 3(c), S15, S19, S20 and S21 obtained the optimal clustering number of Phoneme data set c = 2. As can be seen from Fig. 3(d), S16 and S17 obtained wrong clustering numbers for Heart data set, while the remaining five validity functions could be correctly divided. Finally, according to Fig. 3(e)-(f), it can be found that only S19 and S21 can obtain the correct clustering number of Hfcr and Segment data sets, that is, c = 4 or 7. Based on the comparative experiment of the third group of validity functions, it can be concluded that the clustering effect of S19 and S21 is the best, and the six groups of UCI data sets can be correctly divided. S20 can obtain the correct clustering number of four data sets, but the effect is not good when processing Hfcr and Segment data sets. The classification effect of S15 and S18 is poor, and only two groups and one data set can be distinguished respectively. However, when faced with 6 sets of UCI data sets, S16 and S17 could not get the optimal cluster number of any set of data sets.
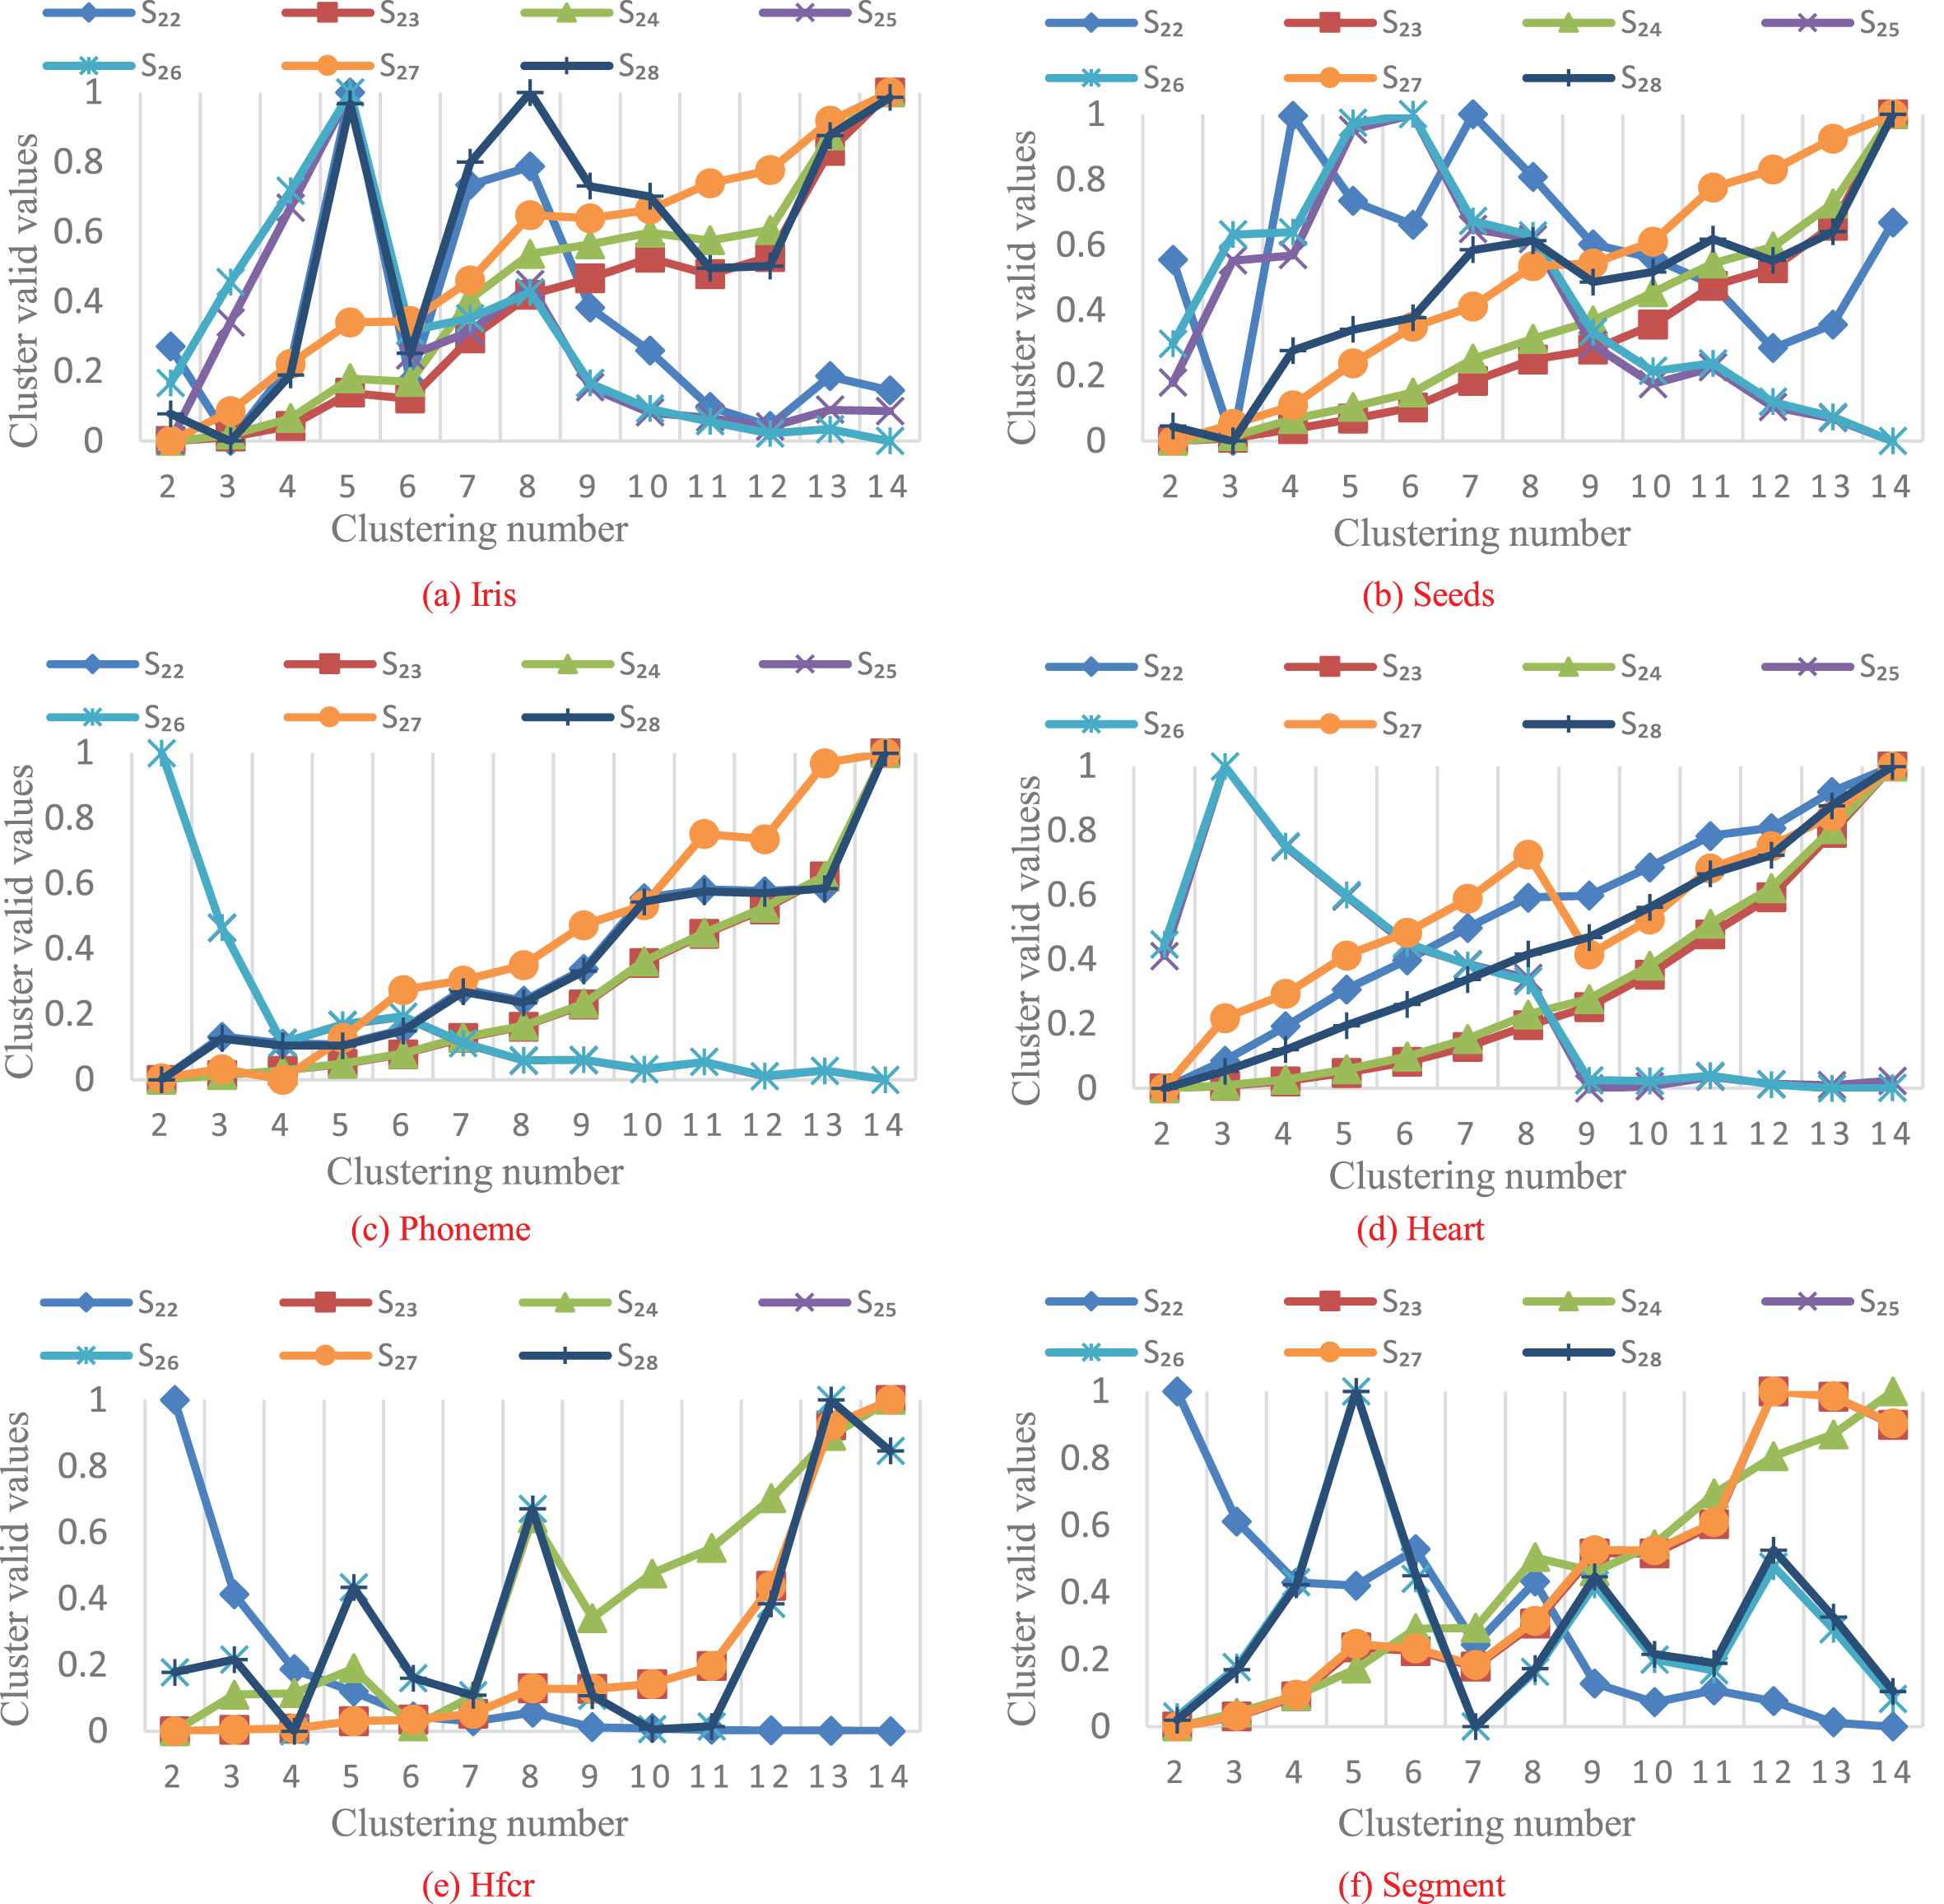
(4) Fourth Group Simulation Experiment and Results Analysis
As shown in Fig. 4(a)-(b), only S22 and S28 can obtain the optimal clustering number c = 3 for Iris and Seeds datasets. As can be seen from Fig. 4(c), S22, S23, S24 and S28 can successfully divide Phoneme data set into two categories. As you can see from Fig. 4(d), S22, S23, S24, S27 and S28 can divide the Heart dataset correctly. Finally, it can be concluded from Fig. 4(e)-(f) that only three validity functions (S25, S26 and S28) can obtain the optimal clustering number c = 4 of Hfcr dataset and the correct clustering number c = 7 for Segment dataset. According to the comparative experiment of the fourth group of validity functions, S28 has the best clustering effect and can correctly divide all six groups of UCI data sets. Among them, S22 can successfully distinguish four UCI datasets, but cannot get the optimal number of clusters when faced with Hfcr and Segment datasets. The classification effect of S23, S24, S25 and S26 is mediocre, and can successfully distinguish two UCI datasets. However, the performance of validity function S27 is poor, and only the optimal clustering result of Heart data set can be obtained.
(5) Fifth Group Simulation Experiment and Results Analysis
As can be seen from the simulation image of Fig. 5(a)-(b), the four validity functions (S29, S31, S32 and S35) can obtain the optimal clustering number c = 3 of Iris and Seeds dataset. According to Fig. 5(c)-(d) of Phoneme and Heart datasets, it can be seen that only S30 gets the wrong number of clusters, and other six validity functions can divide these two UCI datasets correctly. According to Fig. 5(e)-(f), when faced with Hfcr and Segment data sets, S30, S31, S32 and S35 can obtain the correct clustering numbers c = 4 and c = 7 of the two data sets. It can be seen from the comparative experiment of the fifth validity function that the three validity functions (S31, S32 and S35) can obtain correct clustering results when dealing with six UCI data sets. Among them, S29 can successfully distinguish four groups of data sets, but fails to correctly divide Hfcr and Segment data sets. However, S30, S33 and S34 have poor effects among 7 validity functions, and can only get the optimal cluster number of two sets of data.
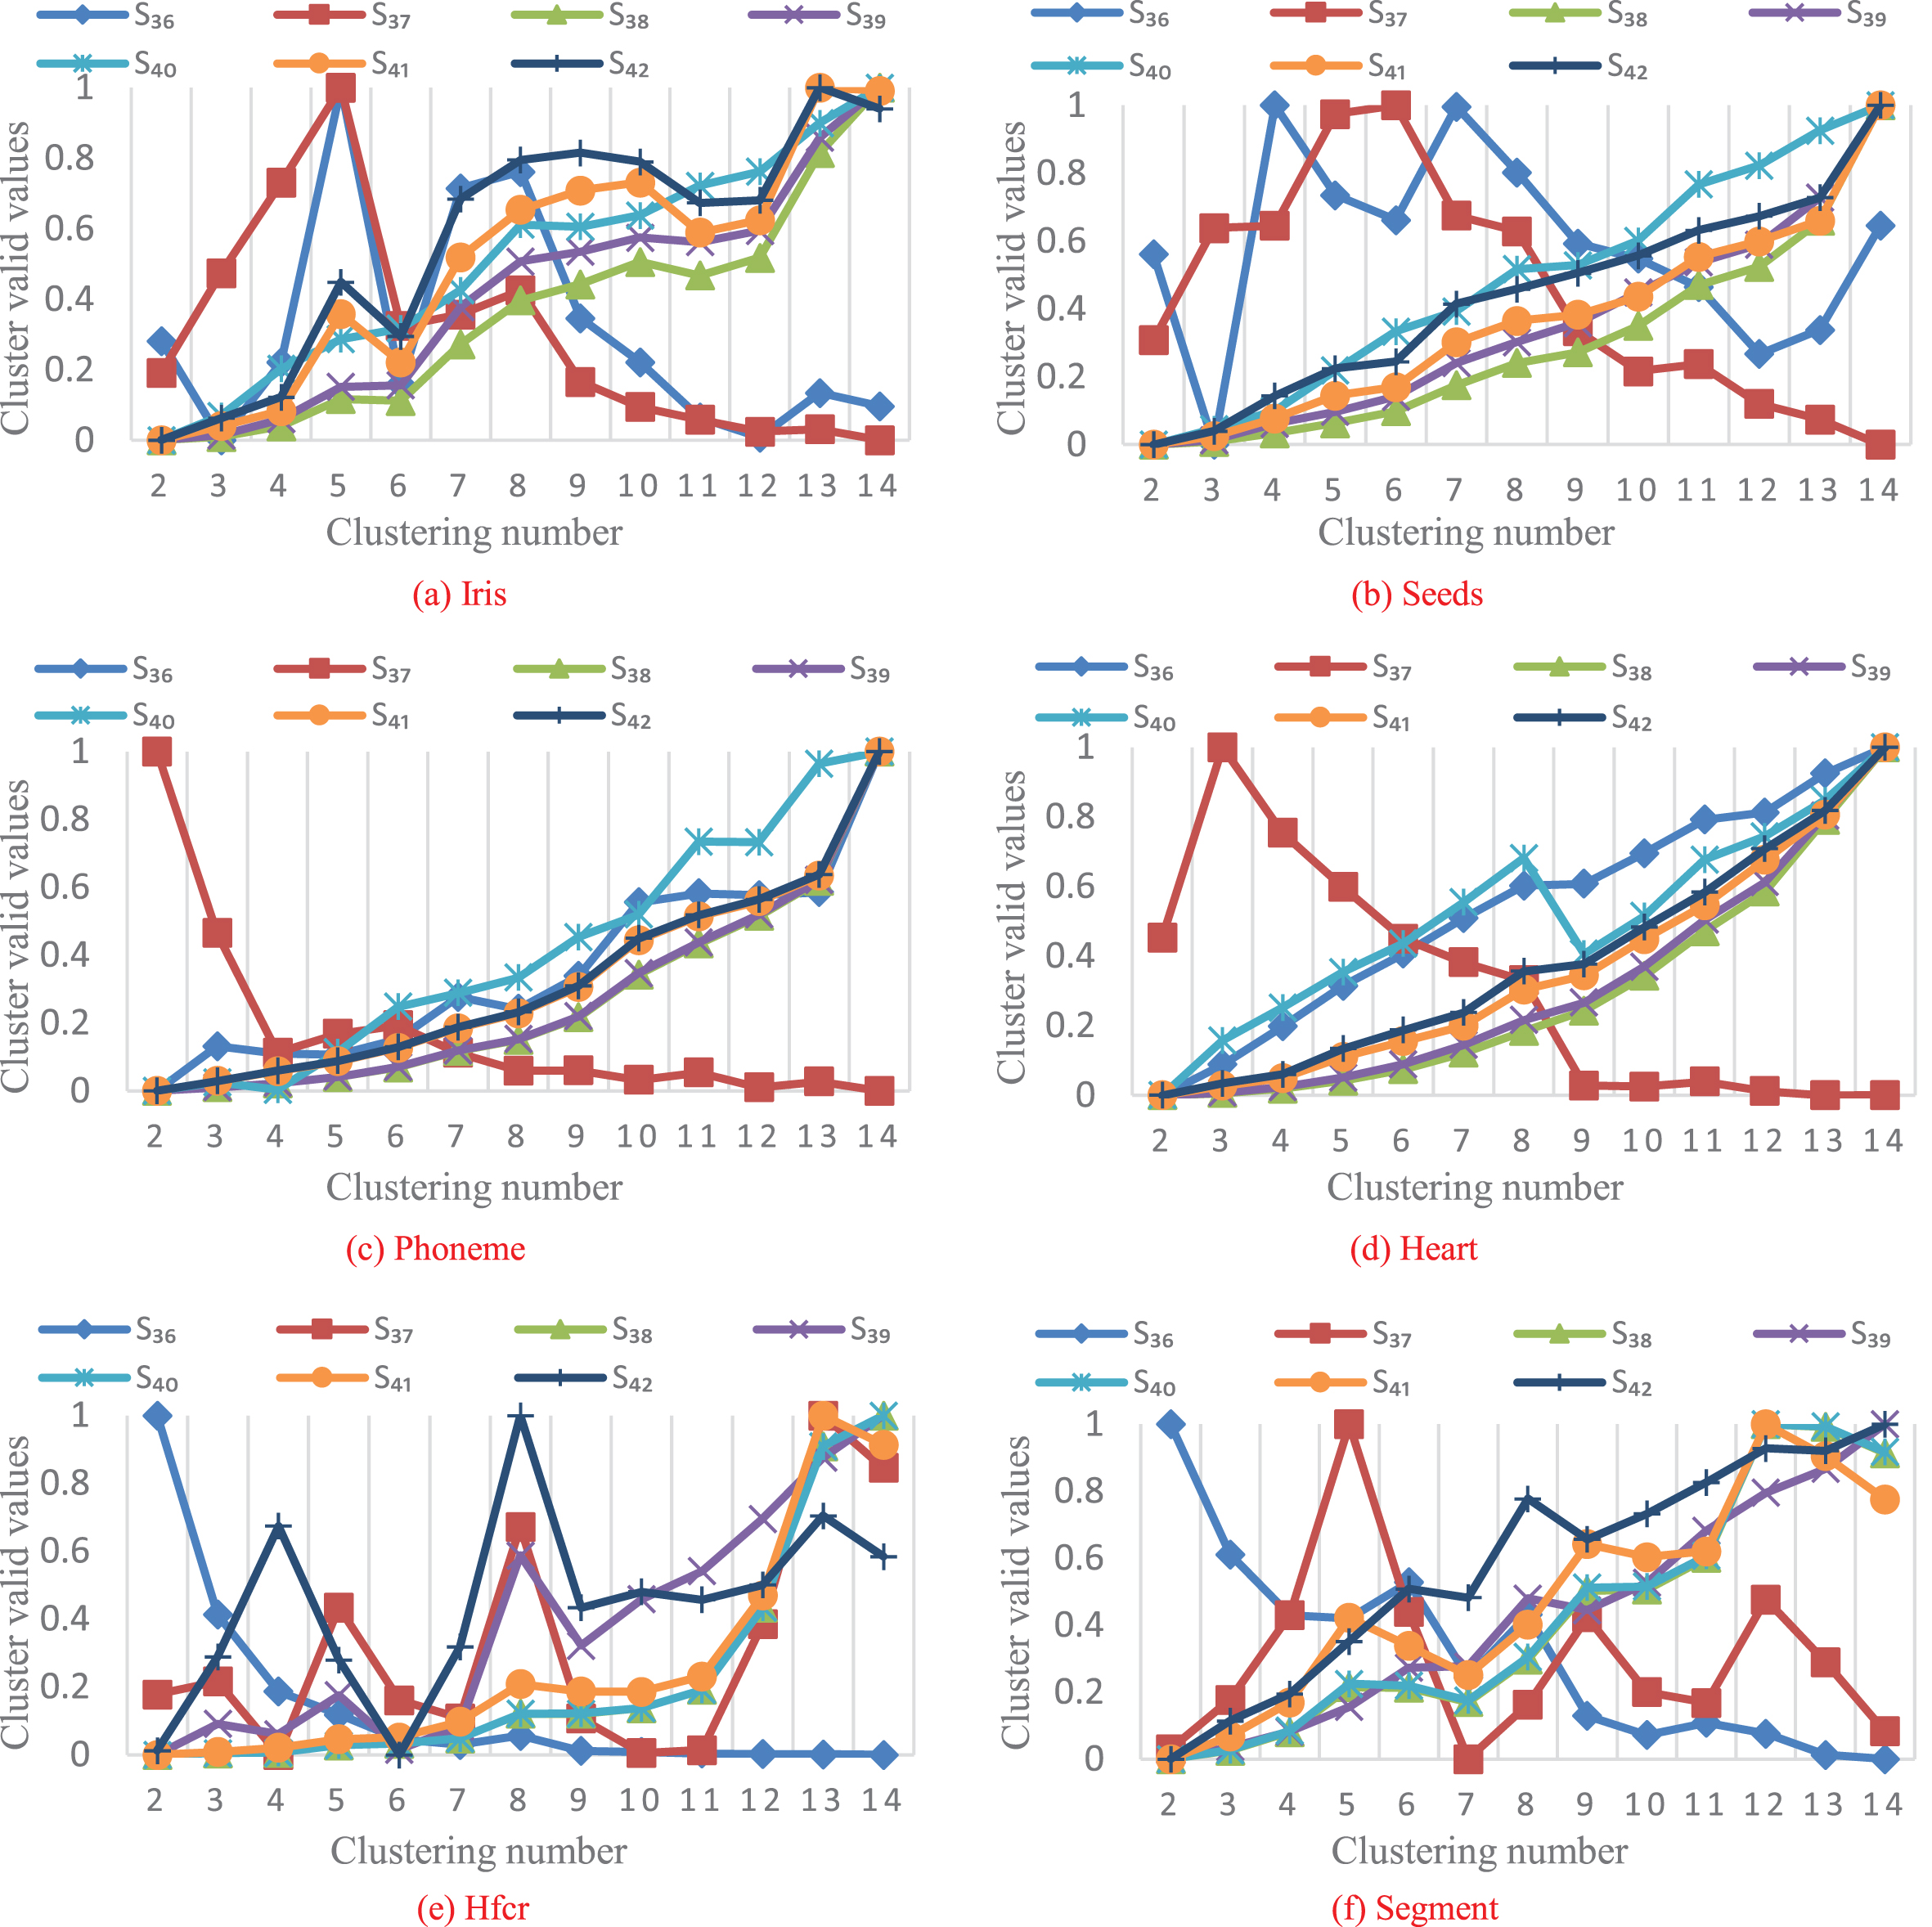
(6) Sixth Group Simulation Experiment and Results Analysis
As can be seen from Fig. 6(a)-(b), only S36 can correctly divide Iris and Seeds data sets and obtain their optimal cluster number c = 3. As can be seen from Fig. 6(c)-(d), both S36, S38, S39, S40, S41 and S42 can successfully divide Phoneme and Heart data sets into two categories, and only validity function S37 can obtain wrong clustering results. However, the classification effect of S37 on Hfcr and Segment data sets is very good, and the optimal clustering number of these two sets of data sets can be obtained c = 4 and c = 7, while the other six validity functions cannot correctly divide these two sets of data sets. This conclusion can be obtained in Fig. 6(e)-(f). The comparative experiment based on the sixth set of validity functions shows that none of these validity functions can correctly cluster the six UCI data sets. Among them, S36 has the best effect and can successfully distinguish four data sets. On the other hand, S37, S38, S39, S40, S41 and S42 can obtain the optimal cluster number of the two sets of data.
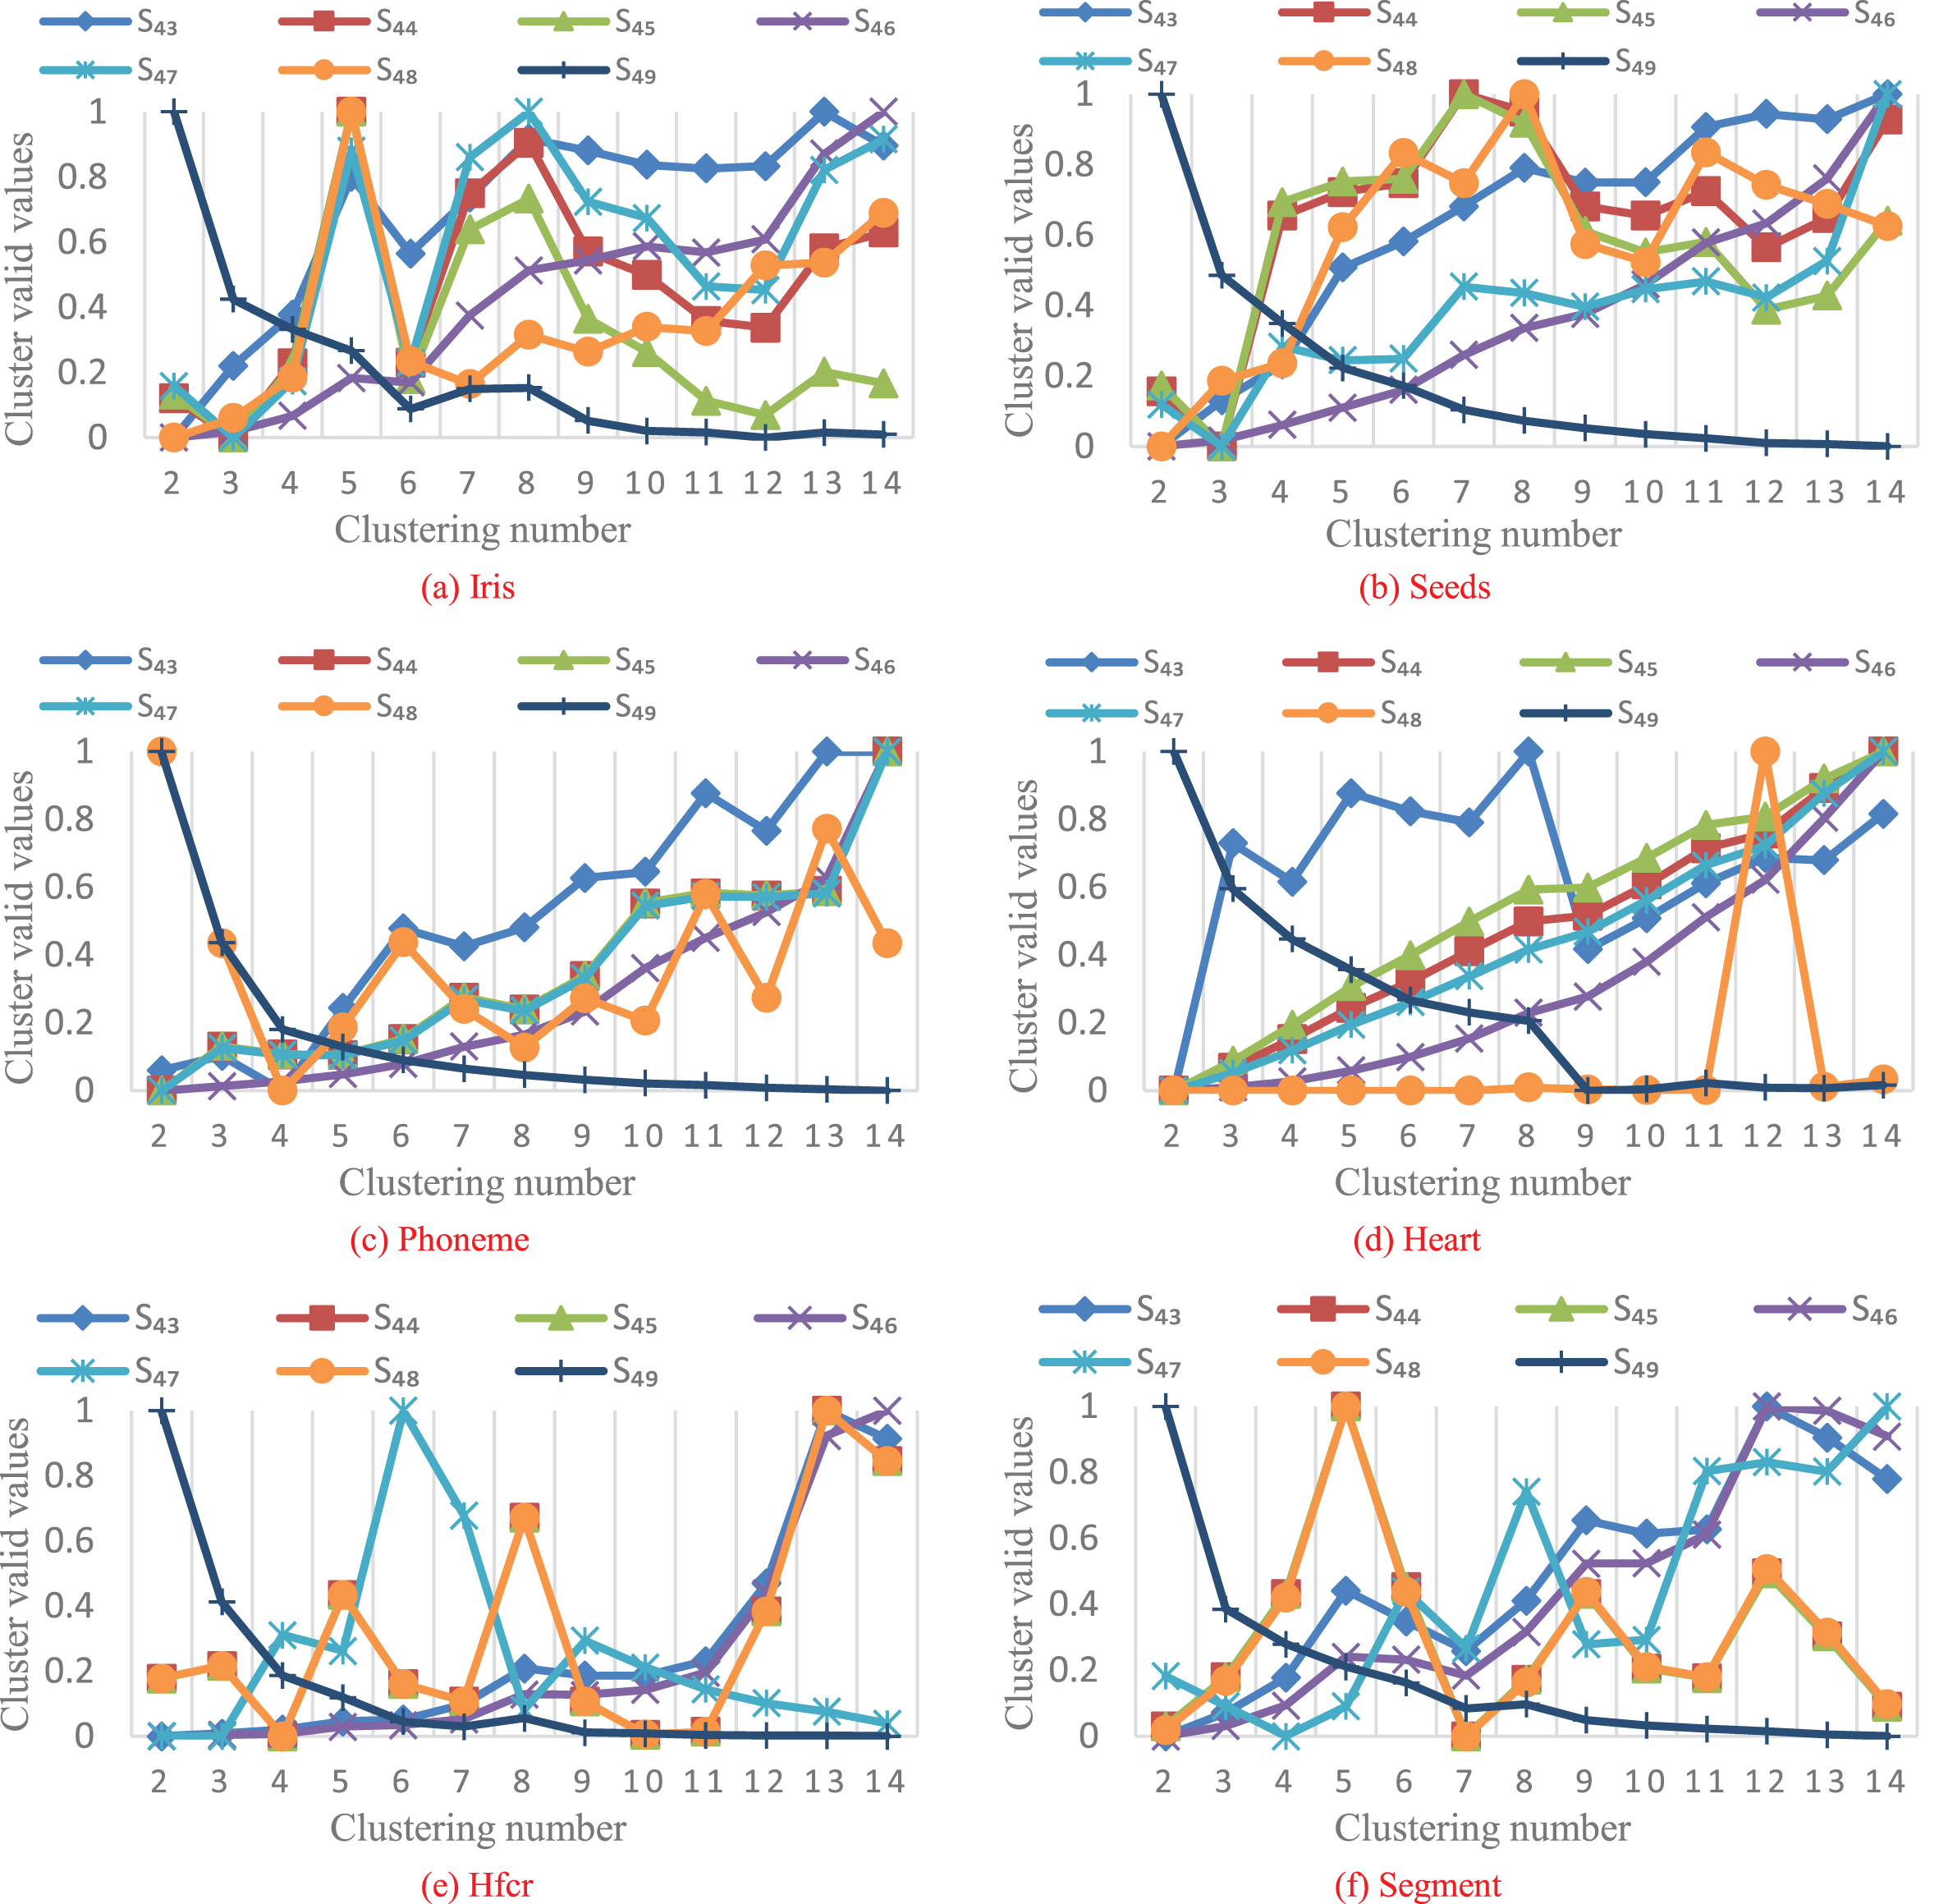
(7) Seventh Group Simulation Experiment and Results Analysis
As can be seen from Fig. 7(a)-(b), S44, S45 and S47 can obtain the correct clustering number c = 3 for Iris and Seeds datasets. Based on the simulation curve in Fig. 7(c), S44, S45, S46 and S47 can successfully divide data samples in Phoneme data set into two categories. As can be seen from Fig. 7(d), except for S49, the other six validity functions can divide Heart data set correctly. Finally, it can be concluded from Fig. 7(e)-(f) that S44 and S45 can obtain the optimal clustering number of Hfcr and Segment data sets, namely c = 4 and c = 7. Through the comparison experiment of the seventh validity function, it can be known that S44 and S45 has the best performance and can get the correct clustering results for all six UCI data sets. S47 can correctly divide four UCI data sets; The clustering effect of S48 is slightly worse than that of S47, which can successfully distinguish three UCI data sets. S46 can obtain the best clustering results of the two sets of data sets; S43 can only correctly divide Heart data set into two categories. In the comparison experiment of the seventh group of validity functions, only S49 got the wrong differentiation result for all data sets, and its clustering effect was the worst.
Through the comparative experiment of the above 7 groups of validity functions, 8 cluster validity functions that can successfully divide 6 groups of UCI data sets are obtained, which are S19, S21, S28, S31, S32, S35, S44 and S45, where, S31 is composed of 6 components, S28 and S45 are composed of 5 components respectively, S19, S31 and S32 are composed of 4 different components, and S35 is composed of only 3 components. By observing the structure of the eight validity functions, it can be found that these validity functions all contain three components CP1, CP4 and CP5, which indicates that these three components have a greater impact on the clustering performance and mathematical dimension of the clustering validity function than CP2, CP3 and CP6. S35 is the simplest form composed of CP1, CP4 and CP5. Based on the prior knowledge of time and space complexity [30], it can be concluded that S35is the optimal among 49 clustering validity functions.
Table 16 lists the number of data samples, attributes and categories of UCI data set selected for this experiment. Haberman and German data sets are added in the comparison process to increase the persuitability of the experiment.
Typical clustering validity functions
Typical clustering validity functions
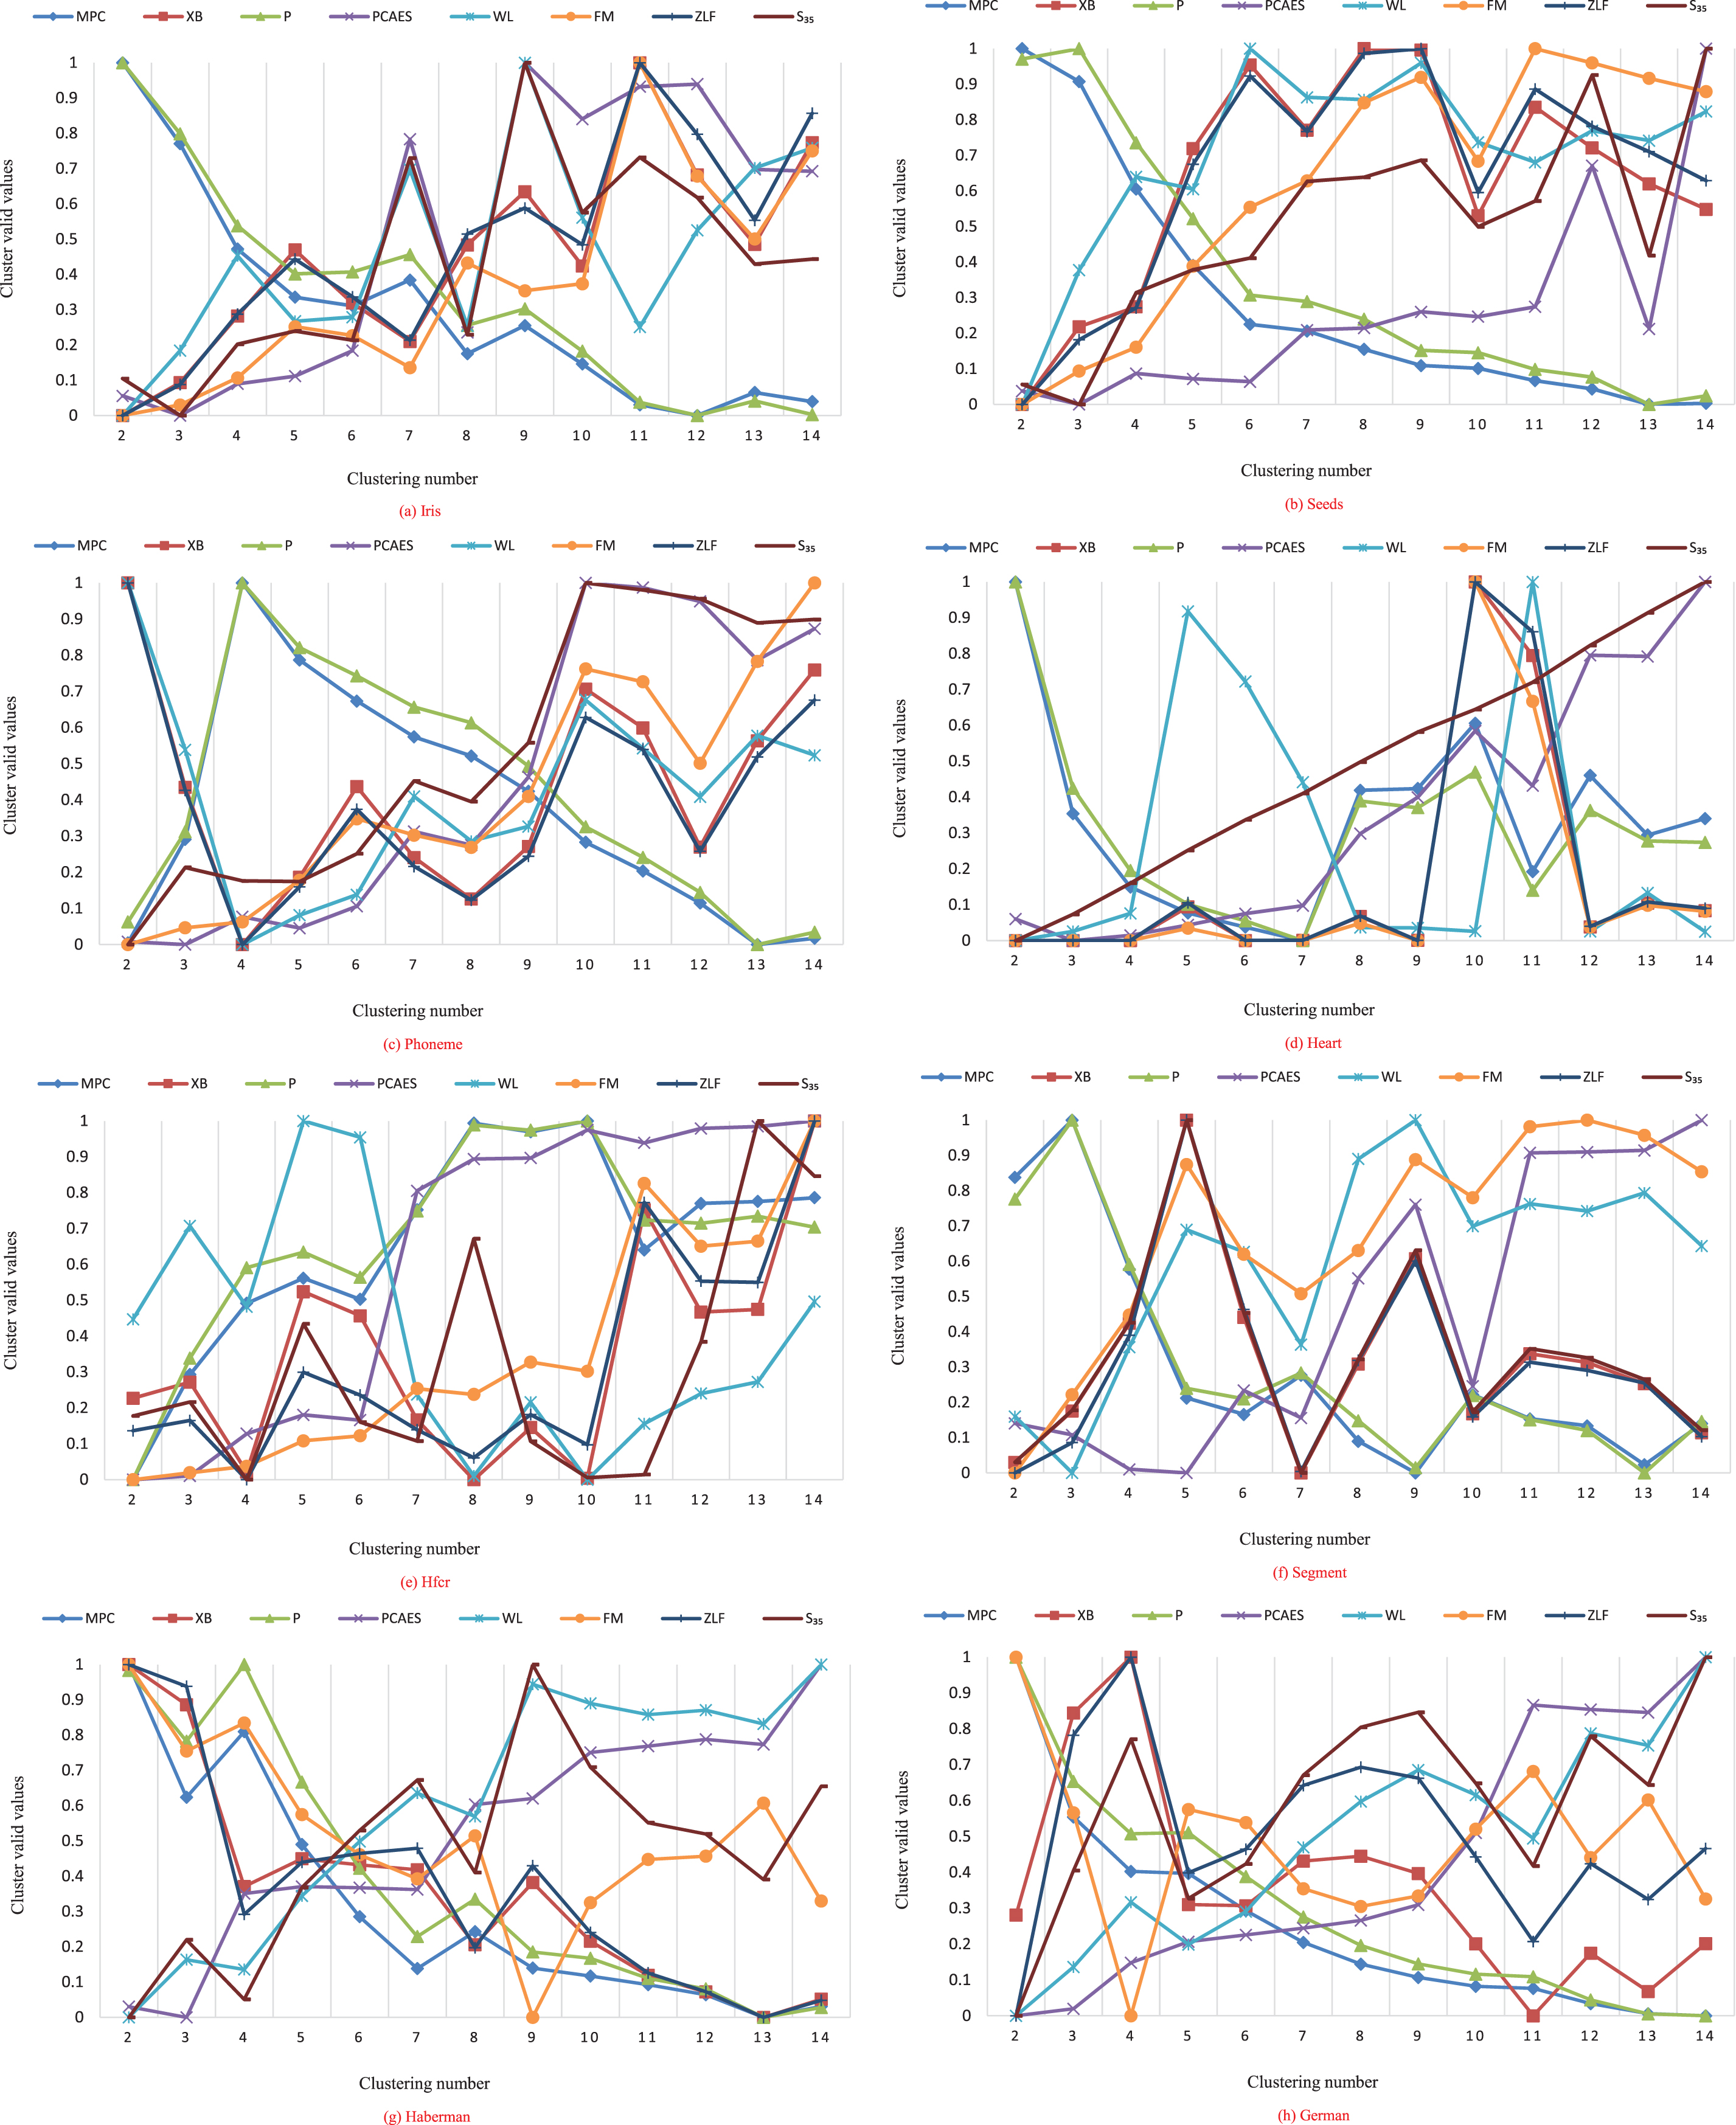
In order to better reflect S35’s classification effect, this experiment selected 7 typical clustering validity functions (V
MPC
, V
XB
, V
P
, V
PCAES
, V
WL
, V
FM
and V
ZLF
) to conduct a comparative test with S35 on UCI data set. The function description and optimal clustering number of these 7 typical clustering validity functions are listed in Table 17, where
Variation trend of normalized clustering validity functions.
UCI dataset
Optimal clustering numbers of different validity functions for UCI data sets
It can be seen from Fig. 8(a)-(b) that S35 can successfully divide Iris and Seeds data sets into 3 categories, and V P can correctly divide Seeds data sets, while other validity functions all get wrong cluster numbers. This indicated that when dealing with data sets with higher dimensions such as Iris and Seeds, S35 had better classification ability than other typical clustering validity functions. Figure 8(c) shows that only S35 obtained the optimal number of clusters for Phoneme data set, that is, c = 2. It can be seen from Fig. 8(d) that, except V PCAES , the Heart data set cannot be correctly divided, the other 8 validity functions have obtained accurate classification results. Figure 8(e) shows that S35 and V ZLF can accurately divide samples in the Hfcr dataset into 4 categories. As can be seen from Fig. 8(f), S35 and V XB can obtain the optimal classification result when facing the Segment data set, that is, c = 7. Figure 8(e)-(f) simulates Hfcr and Segment data sets, and only S35 can correctly classify them. This means that when the number of samples and complexity of the data set are relatively high, the clustering effect of S35 is obviously better than other validity functions. According to Fig. 8(g), V MPC , V FM and S35 successfully obtained the optimal clustering number c = 2 of Haberman data set. Finally, Fig. 8(h) shows that V MPC , V P , V FM and S35 can correctly distinguish German data set, while other validity functions have obtained wrong clustering results. As can be seen from the experimental results in Fig. 8(a)-(h), only S35 can find the optimal number of classification for all UCI data sets, and the ideal number of clustering can still be found in data sets with overlapping samples, noisy data and high dimension.
In this paper, a component-wise design method of FCM clustering validity function is proposed based on six components that define different characteristics of the data set. Based on the UCI data set, six components are permutation and combination experiments in the form of ratio, and the validity function with the simplest structure and the best effect is selected. Finally, the optimal clustering validity function and 7 kinds of typical clustering validity function are adopted to carry out the contrast experiments on UCI data sets. The experimental results show the proposed validity function can get the optimal clustering number of 8 groups of UCI data sets. The classification of the data set with high-dimensional, noise and overlapping features is better than the other typical validity functions. It also proves that the component-wise design method proposed in this paper is very objective and can avoid the contingency of using subjective trial and error method to put forward the validity function. This design method also has universal applicability to other components and has certain guiding significance in constructing new clustering validity function. However, the component-wise design method only considers the ratio form of component combination and does not verify other mathematical forms. For this reason, the future work will study the composition of components based on subtraction as well as exponential and logarithmic forms to enrich the integrity of the system.
Footnotes
Acknowledgment
This work was supported by the Basic Scientific Research Project of Institution of Higher Learning of Liaoning Province (Grant No. LJKZ0293), and the Project by Liaoning Provincial Natural Science Foundation of China (Grant No. 20180550700).