
Abstract
Diabetic retinopathy becomes an increasingly popular cause of vision loss in diabetic patients. Deep learning has recently received attention as one of the most popular methods for boosting performance in a range of sectors, including medical image analysis and classification. The proposed system comprises three steps; they are image preprocessing, image segmentation, and classification. In preprocessing, the image will be resized, denoising the image and enhancing the contrast of the image which is used for further processing. The lesion region of diabetic retinopathy fundus image is segmented by using Feature Fusion-based U-Net architecture. A blood vessel of a retinal image is extracted by using the spatial fuzzy c means clustering (SFCM) algorithm. Finally, the diabetic retinopathy images are classified using a modified capsule network. The convolution and primary capsule layers collect features from fundus images, while the class capsule and softmax layers decide whether the image belongs to a certain class. Using the Messidor dataset, the proposed system’s network efficiency is evaluated in terms of four performance indicators. The modified contrast limited adaptive histogram equalization technique enhanced the Peak Signal to Noise Ratio (PSNR), mean square error, and Structural Similarity Index Measure (SSIM) have average values of 36.18, 6.15, and 0.95, respectively. After enhancing the image, segmentation is performed to segment the vessel and lesion region. The segmentation accuracy is measured for the proposed segmentation algorithm by using two metrics namely intersection over union (IoU) and Dice similarity coefficient. Then modified capsule network is constructed for classifying the stages of diabetic retinopathy. The experimental result shows that the proposed modified capsule network got 98.57% of classification accuracy.
Introduction
Diabetes is a global epidemic that has made excessive blood glucose levels. When the same scenario persists for an extended period, significant blood vessel damage occurs. Diabetes can cause kidney failure, eyesight loss, bleeding teeth, lower limb paralysis, nerve difficulties, and other symptoms. It has the potential to cause a heart attack or stroke in diabetics. Damage to the nephrons in the kidney causes diabetic neuropathy, while damage to the neurons in the brain causes diabetic retinopathy (DR), which leads to retinal infection. Diabetic retinopathy is an eye disease caused by diabetes. Diabetes is the sixth most deadly disease, as per the World Health Organization [1]. According to statistics, approximately 61.3 million persons between the ages of 20 and 79 are diagnosed as diabetic patients [2].
Blood vessels are considerably damaged by this increase in blood glucose, leading to blood leaks in the eyes and a loss of vision. A constant rise in blood glucose levels harms the retina. The human body has an intriguing feature in that it may implicitly heal itself. When blood leakage is detected, nearby cells are activated to deal with the situation. Diabetic retinopathy causes an abnormal increase in the number of blood vessels and these newly created blood vessels are weak, which may cause vision problems [3]. It has a short-term effect on the patient’s vision. As a result, a diabetic patient’s retinal diagnostic should be done regularly. Fundus photography is a common type of eye examination that is used to detect diseases in their early stages. The presence of an abnormality and its size are utilized to assess the disease’s severity. For more than 50 years, the World Health Organization (WHO) has maintained general diabetes diagnosis and classification standards [4]. Non-proliferative diabetic retinopathy (NPDR) and proliferative diabetic retinopathy (PDR) are the two main kinds of diabetic retinopathy. The type of diabetic retinopathy images is illustrated in Fig. 1.
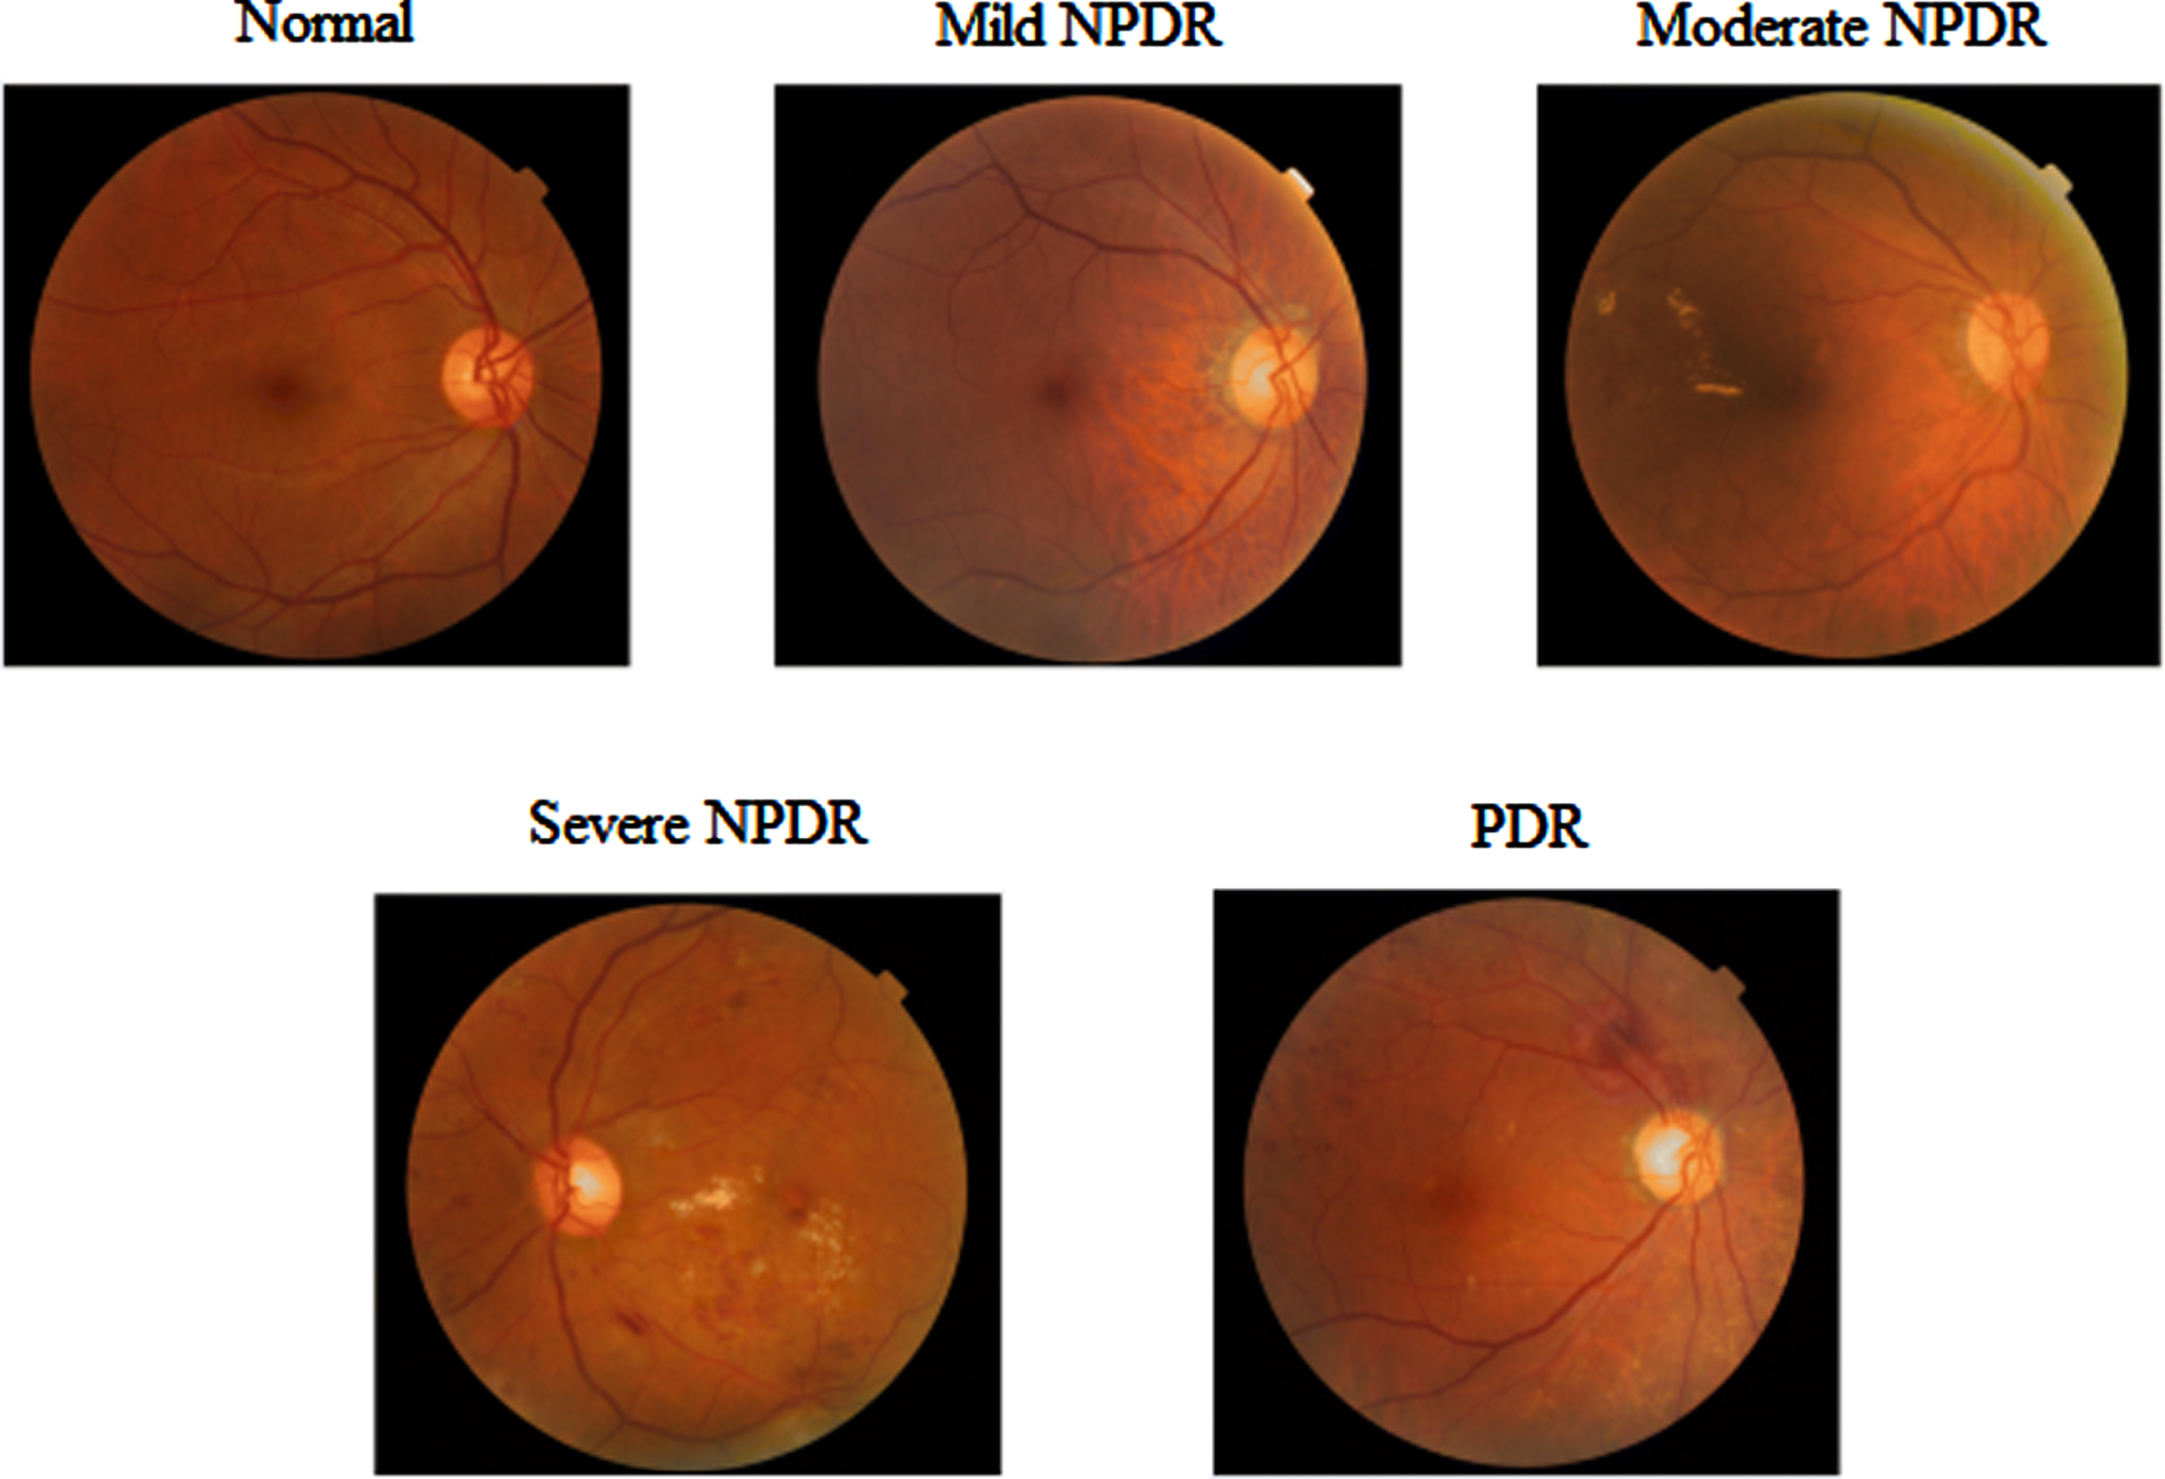
Diabetic retinopathy grades.
Diabetic retinopathy was first classified as nonproliferative diabetic retinopathy (NPDR), which is separated into three stages: mild, moderate, and severe. In the mild NPDR stage, the retina has one micro-aneurysm (MA) and a little circular red dot at the terminal of blood vessels. Micro-aneurysms break into deeper layers of the retina at the Moderate NPDR stage, generating a flame-shaped hemorrhage. There were over 20 intraretinal hemorrhages at the severe stage in each of the four quadrants, with visible venous hemorrhage and intraretinal microvascular anomalies.
PDR is a more advanced form of Diabetic Retinopathy that causes neovascularization or the natural formation of new blood vessels on the retina’s inner surface in the form of functional microvascular networks [5]. By 2025, the number of DR patients in the world is predicted to rise from 382 million to 592 million [6]. According to a poll done in Pakistan’s Khyber Pakhtunkhwa (KPK), 30 percent of diabetics have DR, with 5.6 percent of those affected becoming blind as a result. Floaters, blurred vision, distortions, and gradual loss of visual quality are some of the early signs of DR. As a result, detecting DR early is difficult but essential to avoid the worst consequences of later stages.
The main contribution of this paper in the early detection of diabetic retinopathy is described as follows, Image preprocessing: To improve the quality of the original image, image resizing, color channel extraction, modified contrast limited adaptive histogram equalization, and noise reduction with a Gaussian filter were utilized. Image segmentation: SFCM and feature fusion based U-Net are used to segment blood arteries and lesion locations from retinal fundus images, respectively. Classification model: To classify the processed and segmented fundus images, modified capsule networks were created. The results were assessed and compared to those of other procedures.
The remainder of this paper is organized as follows: The brief literature survey is presented in section 2. The proposed framework is described in Section 3, the experimental findings and comparison analysis are presented in Section 4, and our proposed work is concluded in Section 5.
Muhammad Nadeem Ashraf et al. investigated a variety of tasks that occur during the preprocessing stage of a diabetic retinopathy detection system.The preprocessing step includes image contrast enhancement, balancing the illumination imbalance caused by a retina’s spherical shape, noise reduction, image resizing to allow multi-resolution, color normalization, and the extraction of a field of vision. Because the optic disc and blood vessels in the retina have features that are comparable to diabetic retinopathy lesions, finding the lesion area is extremely challenging [7]. Dilip Singh Sisodia et al. use green channel extraction, histogram equalization, picture enhancement, and scaling algorithms to pre-process raw retinal images.The features are extracted from the preprocessed fundus image. The tests are performed on the Kaggle Diabetic Retinopathy dataset, with the results analyzed using the mean and standard deviation of the obtained features. The exudate area is the most useful feature, with a mean difference of 1029.7 [8]. AsimSmailagic et al. present a learning pre-processing technique for automatically diagnosing diabetic retinopathy on eye fundus images. Shadow reduction and color correction are part of the preprocessing stage of an eye fundus image.A Shadow Removal Layer that improves the comprehension of a preprocessing function of a specific activity.The network’s performance on the Diabetic Retinopathy Detection Test improves after learning the pre-processing function [9]. SeyedHossein Rasta et al. used color retinal images to test several illumination and contrast enhancement algorithms to find the most successful strategy for image enhancement.To offer a statistical evaluation of the lighting correction procedures, the coefficients of variation were calculated. When calculating the background, the division strategy with the median filter produced the lowest coefficients of variability in the red component. Because of their low coefficients of variation, the quotient and homomorphic filtering algorithms performed well when combined with the division strategy. By using contrast-constrained adaptive histogram equalization, the vascular segmentation algorithm’s sensitivity was enhanced by 5% while keeping the same level of accuracy. As a contrast enhancement strategy for vessel segmentation, the contrast-limited adaptive histogram equalization technique has higher sensitivity than the polynomial transformation operator [10]. The use of image preprocessing in the classification and diagnosis of diabetic eye disorders was examined by RubinaSarki et al. Green channel extraction, contrast limited adaptive histogram equalization (CLAHE), and illumination correction was used to improve the original image [11].
FadhilahQalbiAnnisa et al proposed the morphological features to segment diabetic retinopathy images. Examining retinal fundus imaging for bleeding and hard exudates, which suggest the early stages of the illness, is the most typical technique to discover DR.For bleeding and hard exudate detection, morphological segmentation of the green channel image revealed 88.6 percent and 82.3 percent accuracy, respectively [12]. Adversarial Learning was used by Qiqi Xiao et al to improve the segmentation of lesion areas in diabetic retinopathy images. The Indian Diabetic Retinopathy Image is one of the publically available labeled datasets for DR (IDRiD). On retinal fundus images, it comprises pixel-level observations of microaneurysms, hemorrhages, soft exudates, and hard exudates. After solving a semantic segmentation challenge on this dataset with the HEDNet edge detector, an end-to-end system for pixel-level segmentation of diabetic retinopathy lesions is built by merging a Conditional Generative Adversarial Network (cGAN) with a Holistically-Nested Edge Detection (HEDNet) network.The tests suggest that adding adversarial learning to the baseline enhances lesion segmentation performance [13]. Diabetic retinopathy identification utilizing semantic segmentation and optic disc localization is presented by Aswathy K.P and Dr. D. Vimal Kumar. It developed a new method for diagnosing diabetic retinopathy using semi-supervised semantic segmentation and image-segmentation feature localization.Because all DR categories receive the same quantity of data because the data is processed at the same time, preparation bias is eliminated. A support vector machine has been developed for the categorization of diabetic retinopathy, with a classification accuracy of 97.3 percent [14]. Mohammad Javeed and M Senthil Kumar present a novel hybrid fuzzy K-means clustering segmentation approach for segmenting the lesion area of diabetic retinopathy images. The threshold value of the fundus image is used in this procedure.Improving the fundus image is also important in the image segmentation technique.Density clustering approaches are useful for separating discrete lesions and should be used in conjunction with procedures for removing, extracting, and classifying positive vascular trees [15].Pedro Furtado et al. have proposed a deep learning-based convolution neural network for diabetic retinopathy lesion segmentation.It uses the publicly available fundus dataset for the segmentation process. The two DCNNs are tested to get a preliminary assessment of their strengths and limitations [16]. T. Jemima Jebaseeli et al. used depigmented diabetic retinopathy images to segment retinal blood vessels. The input fundus images are preprocessed using contrast-limited adaptive histogram equalization techniques. The Tandem Pulse Coupled Neural Network (TPCNN) model is then used to segment the retinal vasculature. The support vector machine, which is based on deep learning, extracts feature vectors from blood vessels and classifies retinopathy grades [17].Cheng Wan et al have proposed an EAD-based convolutional neural network. It is a new lesion segmentation approach in diabetic retinopathy. Three modules make up the system: an encoder, an attention module, and a decoder module. Furthermore, tests on a local dataset show that the EAD-Net beats the original U-net in nearly every statistic, including sensitivity and F1-score.When segmenting four various types of lesions, delivers good results. These superior segmentations have a lot of therapeutic value in terms of DR monitoring and diagnosis [18]. Soomro et al. have suggested a SegNet architecture which is a semantic segmentation network. The initial step was to transform the color fundus image into grayscale data using principal component analysis (PCA). In the second stage, semantic segmentation is accomplished using convolutional neural networks. After that, a post-processing strategy was used to fine-tune the segmentation [22].
Pratt et al. [19] suggested a CNN technique for DR diagnosis and grading, which performed well on a large dataset. Hu et al. proposed a convolutional neural network and conditional random fields to segment retinal arteries in fundus images. CRFs were utilized to improve the final output after the image was processed with a multistage CNN architecture with an improved cross-entropy loss function [20]. Das et al. trained and classified a diabetic retinopathy classifier using a CNN. A mixture of squeezing and stimulation and bottleneck layers, one for each class, as well as a convolution and pooling layer design for classification between the two classes, make up the classification structure of a convolution neural network. Experimental results showed that when compared to traditional methods, the proposed technique produces better outcomes [21]. The Multi-Cell Multi-Task Convolutional Neural Network (M2 CNN) was introduced by Zhou et al. [23], which comprises an Inception-ResNet-V2 stage connected to a Multi-Cell stage. The depth and kernel size of the network, as well as the resolution of the input image, is gradually raised. Finally, a Multi-Task stage is used to generate both a classification and a regression score. G. Kalyani et al. developed a capsule network for identifying and classifying the diabetic retinopathy grades. The Messidor dataset [24] is used to validate the effectiveness of the classification network on four performance parameters. K. Xu et al. created a CNN architecture that automatically identified the Kaggle dataset’s images as normal or DR images. The database yielded a total of 1000 images. The data was enhanced and scaled to 224*224*3 before being transmitted to CNN. Eight Convolution layers, four max-pooling levels, and two FC layers made up the CNN design. For classification, the SoftMax function was applied to the final layer of CNN; this method was 94.5 percent accurate [25].V. Gulshan et al. [26] developed a CNN approach for detecting diabetic macular edoema and DR (DME).To test the model, they employed the Messidor-2 and eyepacs-1 datasets, which contain 1748 and 9963 images, respectively. Before being fed into the CNN, these images were normalized and resized to a diameter of 299 pixels. They used the pre-trained Inception-v3 [27] architecture to train 10 CNNs with varying amounts of pictures, and the final result was produced using a linear average function. To classify the five DR stages, B. Harangi et al. [28] employed pre-trained AlexNet and hand-crafted criteria. On the Kaggle dataset, the CNN was trained, and the IDRiD dataset was used to test it. The average accuracy is 90.07 percent.T. Shanthi and R. Sabeenian [29] used a pre-trained architecture Alexnet to detect the DR phases of the Messidor dataset. Before being fed into CNN, the photos were scaled and the green channel stripped. The accuracy of this CNN was 96.35 percent. Imani et al suggested a mechanism for identifying and classifying DR lesions [30]. The input image is initially pre-processed with the Otsu thresholding method to isolate the green channel and remove any unwanted artifacts. The image features are then generated using the morphological component analysis (MCA) technique, which is then utilized to train the support-vector machine (SVM) classifier. In terms of accuracy, sensitivity, and specificity, the main goal is to exceed existing deep learning models. Performance of reviewed DR detection and classification models are shown in Table 1.
Performance of reviewed DR detection and classification models
Performance of reviewed DR detection and classification models
The proposed diabetic retinopathy detection and classification system are depicted in Fig. 2.
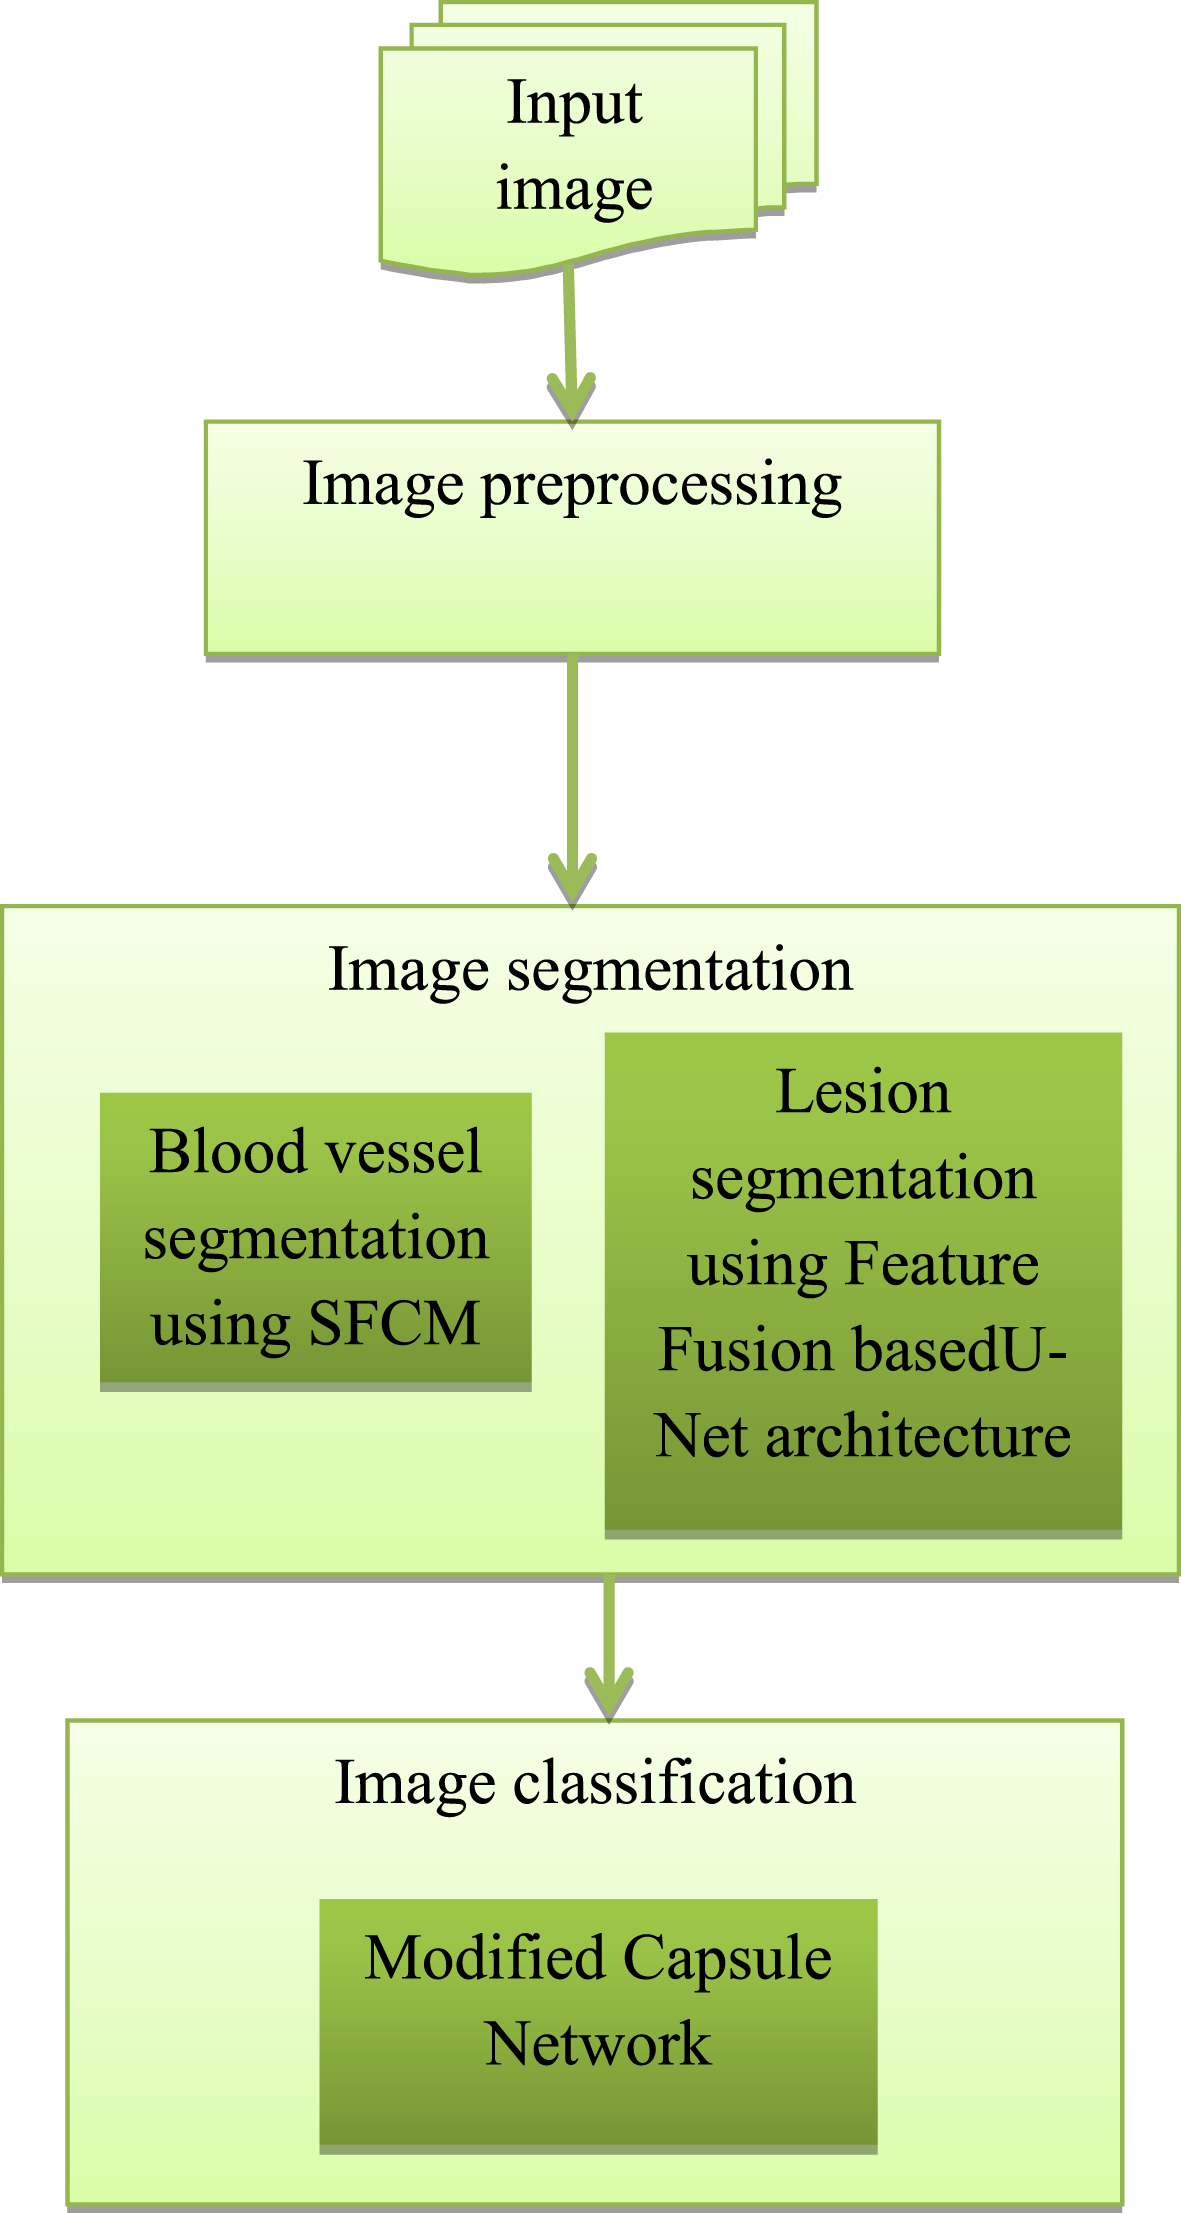
Block diagram of proposed diabetic retinopathy detection and classification method.
Preprocessing is the essential part of the detection technique using image processing. The preprocessing phase improves the image quality and contrast by removing noise and fluctuation from the retinal fundus image. A raw color fundus image is included in the data collection. Pre-processing is essential before running the image through any model because it can be captured in a variety of locales and under a range of conditions. Pre-processing is required to bring many images to a near degree of intensity, color, scale, and other parameters because they were acquired with separate cameras of varied power and under different lighting conditions. The data in the proposed model has been pre-processed using a variety of ways.
The flow diagram of phases for pre-processing procedures is depicted in Fig. 3. Resizing, channel extraction, denoising, and contrast enhancement are among the pre-processing stages. To allow the deep learning model to analyze the images properly, all of the images are first downsized by lowering the number of pixels. After that, channel extraction was carried out. The green channel is used to acquire a better picture of the characteristics of the diabetic image. The smoothened images are then created through denoising and contrast enhancement procedures.
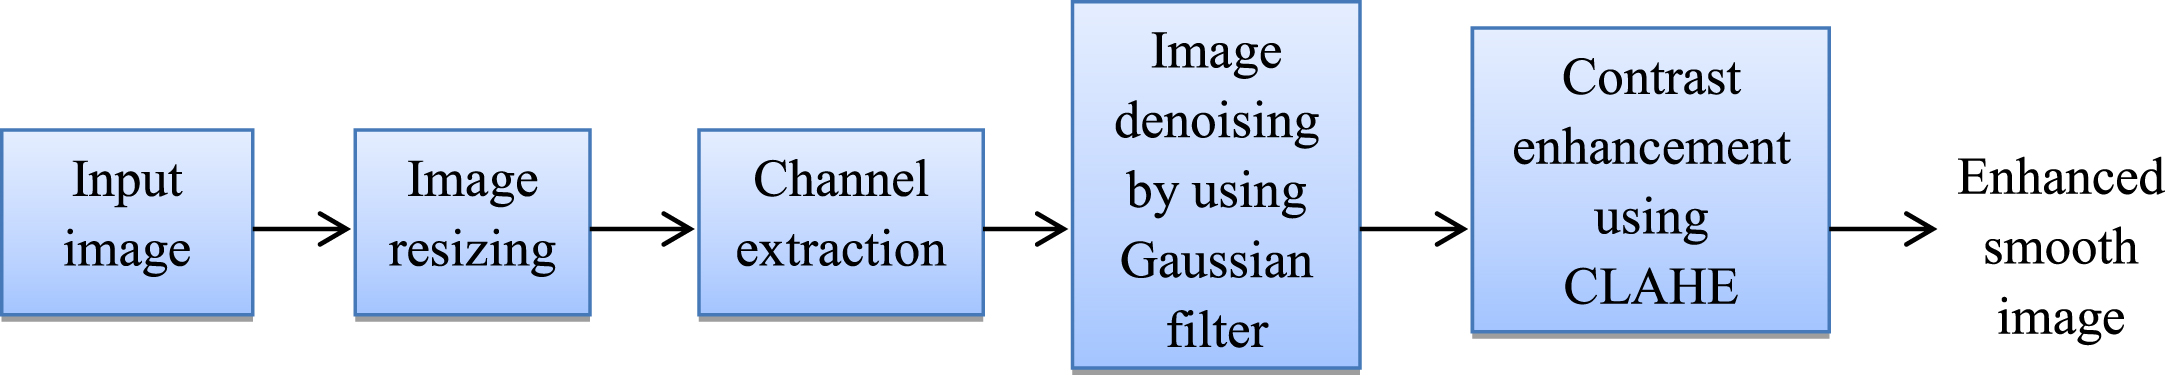
Procedures for image pre-processing.
The Messidor dataset [31] is a collection of healthy and sick people’s retinal fundus images. There are 1200 color numerical eye fundus images from three ophthalmologic departments included in this collection. 1440 x 960 pixels, 2240 x 1488 pixels, or 2304 x 1536 pixels are the image sizes. A clinician (trained pathologist) rated the presence of diabetic retinopathy in each image on a scale of 0 to 4 using the following measure: If the value is 0, there is no DR. There are four stages of diabetic retinopathy: mild NPDR, moderate NPDR, severe NPDR, and proliferative DR.
All of the input images are resized to 512x512 pixels at first. Larger images necessitate more calculation operations per layer and more memory. The input images must be scaled to make the training model operate faster in learning the features and achieve higher performance.
The resized image is also converted to a monochrome component image. It’s possible, that the color fundus image won’t provide you with exact results. As a result, the image is pre-processed before being turned into a monochrome component image. Color fundus images are converted into mono colors of various tints via grey scaling and channeling. Grayscale visuals can only be expressed in black and white. The pixel in a digital image has three primary colors: red, blue, and green. An image made up of simply one of these primary colors is called a channel. One of the RGB components is extracted and converted into a single red, green, or blue channel in the channel of an image. Each color component’s traditional brightness ranges from 0-255. The isolated red and blue channels were found to be either too brilliant or too dark in their respective circumstances when the RBG image channels were removed separately. The green channel, on the other hand, shows the most exact image. The green channel photos provide a considerably clearer view than grey scaling. However, when the green channel was isolated one at a time, a more favorable image resulted. This channel also showed the ROI, or fundus exudates, better than grayscale or any other color representation. As a result, the image’s green band is extracted because it shows the red lesions the best.
The images provided in a data set or captured are unprocessed and noisy. It becomes nearly impossible to capture images that are fully free of background noise. The visual quality of an image can be greatly reduced by random noise in the image, resulting in low contrast. The gaussian blur filter was utilized in the suggested system, and its Gaussian function equation is shown below.
Where, G(x) -Gaussian function in one dimension
x - Distance from the mean
σ - Standard deviation
Each pixel’s value is reset to a new value based on the weighted average of the neighboring pixel’s value in a Gaussian blur. Edge detection frequently employs Gaussian blur, also known as the 2D Gaussian function. A normalized function, also known as a normalized gaussian curve dimension, is frequently used to represent the Gaussian filter.
The enhancement of an image is an important technique as it highlights the important details of an image and eliminates certain tertiary information to improve the classification quality of the image. Histogram equalization is a technique for improving overall contrast. This procedure involves adjusting the intensity of the image’s global distribution. The probability function of the pixel of level i is represented as follows,
Where ni denotes the number of occurrences
A modified version of adaptive histogram equalization is adaptive histogram equalization with contrast limits. This method calculates the transformation function after applying the enhancement function to all adjacent pixels. Due to its contrast limitation, this differs from AHE. In contrast enhancement, a picture’s contrast is emphasized and altered. The difference between the maximum and minimum intensity of pixels in an image is known as a contrast. Contrast enhancement is used to improve eyesight clarity and differentiate between multiple features in the backdrop. Modified contrast limited adaptive histogram equalization performs the same function as AHE, but with one additional parameter: the optimal clipping level of the histogram. The clip limit has been set to 2 and the grid size to 8x8 in this suggested diabetic retinopathy detection model. The optimal clipping level and the enhancement parameter in the local contrast enhancement approach are used for achieving the optimal contrast enhancement of fundus images.
Figure 4 depicts the overall pipeline of our proposed feature-fused U-Net-based lesion segmentation algorithm. The purpose of U-net was to design a tool for biomedical image segmentation. It has two networks: one for encoders and one for decoders. The encoder network is a pre-trained network that has a downsampling pooling layer added at various stages. Upsampling and concatenation are used in the decoder network, followed by standard convolution procedures. To forecast pixel-wise classification, the encoder’s discriminative feature is projected onto pixel space. Our model incorporates some advancements in the original U-Net architecture for diabetic retinopathy lesion segmentation as an extension of U-Net. The maximum pooling layer of the original U-Net model is replaced with a convolutional layer with a kernel size of 33 and a stride of 2 at the encoder step.
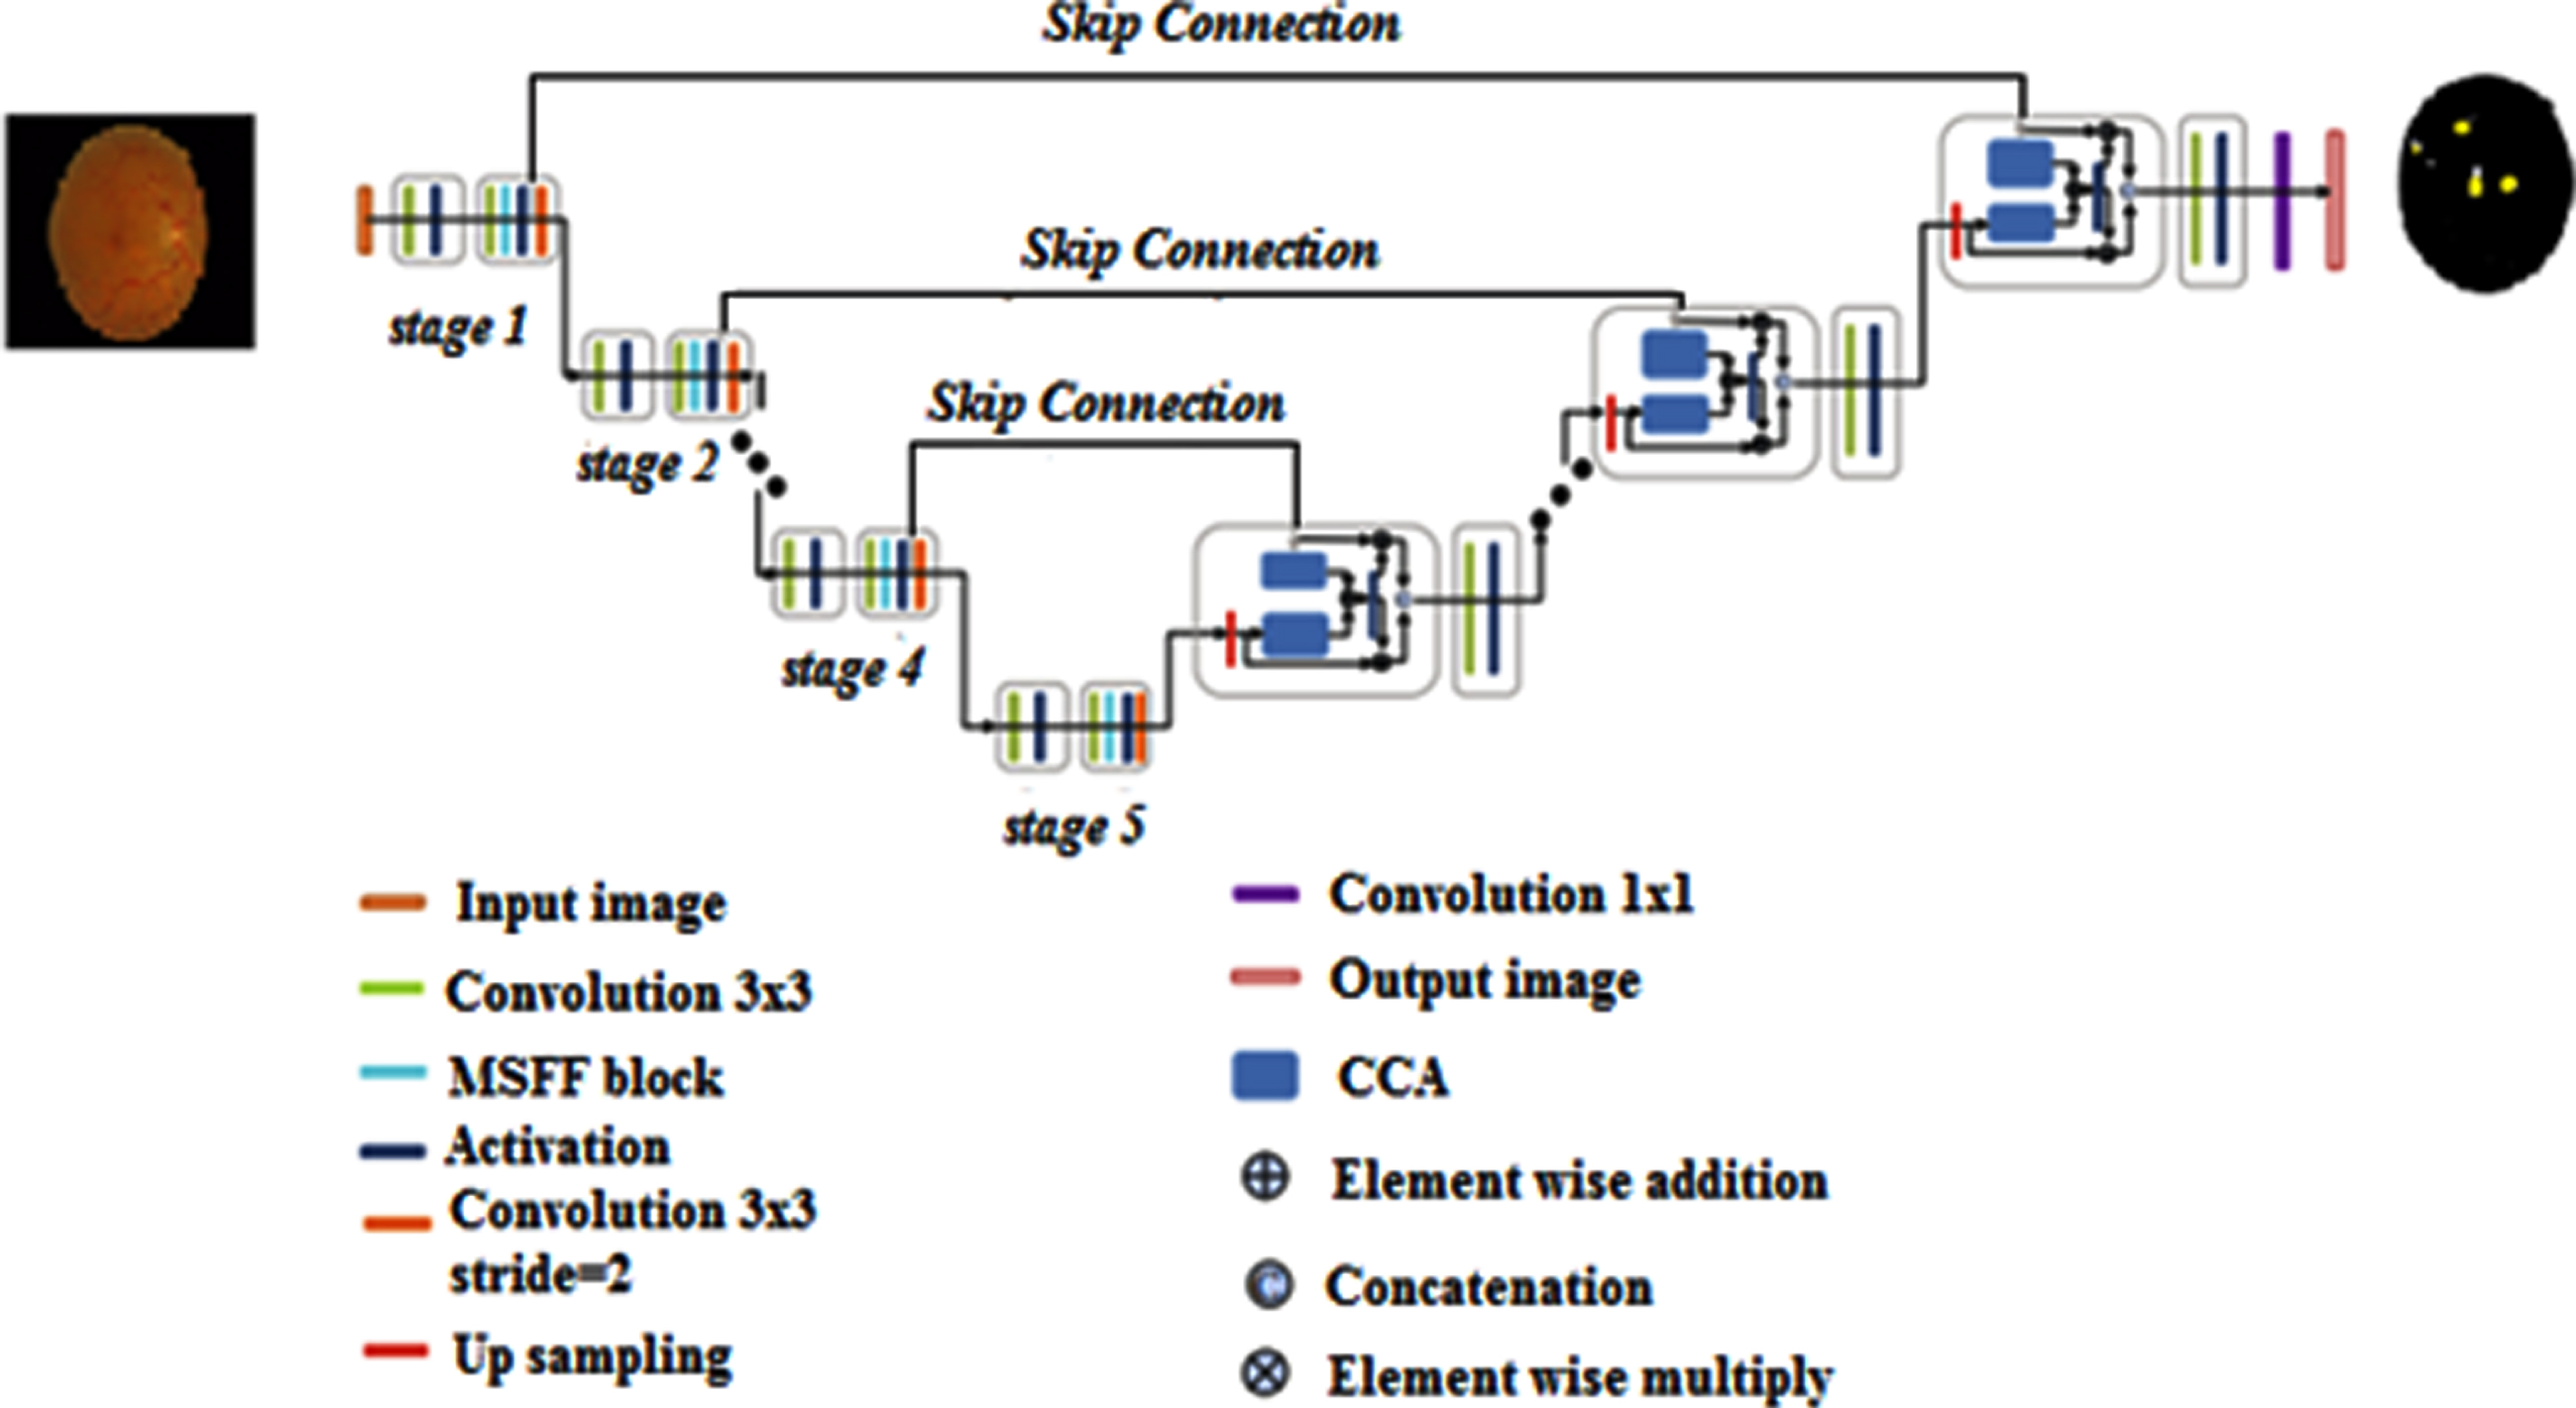
The overall architecture of the proposed feature fusion U-Net-based lesion segmentation model.
The reason behind this method can be separated into two parts. (a) In diabetic retina images, downsampling utilizing the convolution layer may preserve as much structural information as feasible when compared to the pooling layer. (b) It stimulates the blending of data from many channels, which is important for segmenting diabetic retinopathy lesions. We create a new multiscale feature-fused block (MSFF) based on the Inception block and a channel splitting technique to capture the properties of diabetic retinopathy images at several scales. Because dilated convolution can improve the receptive field if the feature map resolution is kept constant, it starts with a 33 dilated convolution followed by the RReLu layer to perceive more information. We then presented a variety of splitting procedures to efficiently create multiscale features. MSFF separates the previous features into two portions, each with 33 percent and 55 percent convolution layers. The first component is preserved, while the second is used in the following phase. To decrease the number of channels and parameters, all of the distilled features are concatenated and put into an 11 convolution after the splitting procedures. Only 1/3 of the channels are kept in each splitting phase in our solution. The decoder’s contextual channel attention (CCA) module encourages concatenation between the skip connection and the lower-resolution decoder. The CCA concatenation technique is defined as follows,
Where, UP –Upsampling
LD –Lower-resolution decoder
SK –Skip Connection
GAPool –Global average pooling
Conv1_BN –1x1 convolution with batch normalization
Conv1 –1x1 convolution
RReLu represents the activation function.
CCA carries both LR and SK’s channel-wise attentions and then multiplies itself by LR and SK, respectively, as contextual channel attention. These two qualities are then integrated to replace the appearance of U-original Net’s concatenation approach. As a result, LR and SK may be able to fully integrate context information while also sharing channel attention, resulting in a more informative representation with improved segmentation accuracy. In addition, RReLu nonlinear activation layers have been used to replace all of the activation layers. RReLu outperforms other activation functions because it can generate a random value from a uniform distribution, avoiding overfitting during training.
A spatial fuzzy C-means clustering is proposed for blood vessel segmentation in retinal images. Because it exhibits superior contrast between vessels and backdrop, the green channel is used widely in the segmentation of fundus color images. Other channels are independently analyzed and put to a fuzzy clustering algorithm in the proposed method, and the results of the clusters from all the channels are picked using a maximizing methodology and fused to generate a final retinal vasculature. FCM is a clustering approach that uses fuzzy membership to allow a pixel to belong to two or more clusters. The membership function determines how likely a pixel is to belong to a specific cluster. The cost function is dramatically decreased when pixels adjacent to the cluster’s centroid are assigned higher membership values and pixels further distant from the centroid are assigned lower membership values. To specify the likelihood, the Fuzzy-c Means technique determines the distance between the pixel and each unique cluster center. To detect convergence, the changes in the membership function or cluster center at two sequential iteration steps are compared. The proposed SFCM clustering algorithm’s purpose is to lower the Fuzzy cost function defined by
Where, V –Cluster center
Uij –Membership function
The membership functions are confined to being positive and satisfying the expression
The membership function uses simply the distance between the pixel and the cluster’s center to assess the likelihood that a pixel belongs to a certain cluster. The following equations are used to update the membership functions and cluster centers.
The equation of the membership function shows the objective function not carrying any spatial information among the neighborhood. Pixels in the neighborhood are highly correlated which is important for an image. As a result, these pixels have similar feature values and are more likely to stay in the same cluster. As a result, the spatial relationship between neighboring pixels is a crucial feature that might aid in the clustering process. This, however, is not used in a standard FCM method. Spatial functionality described in the proposed SFCM algorithm is expressed in the following equation making use of the spatial data
Where the pixel xj is placed by the center of a square window NB(xj). The spatial function signifies the likelihood of the pixel is in the ith cluster as identical to the membership function. This spatial function is incorporated into the membership function described by the equation
The parameters p and q handle both the spatial and membership functions. With p = 1and q = 0 these behave as normal FCM. Clustering is carried out for each iteration as a two-phase process. The membership function is determined in the spectral domain in the same way that it is in ordinary FCM in the first phase. The membership information for each pixel is transformed to the spatial domain in the second phase, and the spatial function is extracted from the spatial domain. The FCM iterations continue and stop at a threshold when the largest difference between two cluster centers over two consecutive iterations reaches a minimum using the newly computed membership and the spatial function. When this condition is met, a defuzzification algorithm assigns each pixel to the cluster with the highest membership. Various methods for demulsifying the partition matrix are available amongst them the maximum membership technique is significantly important. The maximum membership method assigns object k to class C with the highest membership expressed in the equation
The maximum membership method is applied to all the three clusters obtained from the three channels. Finally the crisp image obtained from the three channels is fused using the maximum fusion scheme. Maximum Fusion Scheme is a well-known fact that pixels with high intensity are achieved in places near the focus and hence this method is a straightforward approach to getting an output. The intensity of each pixel P (i, j) from each channel is taken from the clustered output, and a comparison is made among the intensities. From the three clusters obtained from each channel the one with maximum intensity is taken and fused and thus the final segmented image is obtained. The spatial fuzzy c means algorithm yields regions more homogeneous than those of other methods. It removes noisy spot. It is less sensitive to noise than other techniques.
The proposed method in this research tries to determine whether or not patients have diabetic retinopathy and, if so, what stage of the disease they have. Diabetic retinopathy is a condition that causes vision loss in the majority of diabetics. As a result, it is critical to accurately categorize individuals in a short amount of time. Capsule networks with self-Attentionrouting are trained to classify diabetic retinopathy using fundus images as input to produce extremely accurate results.
The convolution neural network has a strong ability to recognize feature maps in images automatically. CNN is used to perform a wide range of image-related tasks, regardless of whether the job is classification or detection. The convolution layer of CNN is responsible for recognizing features in the image’s pixels. Features such as borders and color are perceived by deeper layers. CNN’s structure includes several flaws. When CNN uses pooling layers, some information about the images is lost. Another issue with CNN is that training necessitates a large volume of data. The CNN output is unaffected by minor modifications to the input image. Capsule networks were created to sidestep CNN’s difficulties. Capsule networks may extract geographic data as well as other important characteristics without compromising any information. Neurons that specialize in working with vectors make up capsules. The proposed modified version capsule network containing an extra convolution layer can be seen to be more robust than the basic capsule network model. The overfitting problem also encountered in capsule network. So that, we trained our proposed modified capsule network model for DR classification using Adam optimizer and dropout to avoid over-fitting. The converted data is then fed into the ModCapsNet(modified capsule network) whose architecture is shown in Fig. 5. In Mod-CapsNet, there are convolutional layers, max-pooling layers, primary capsule, digit capsules, three FC Layers, and, finally, a sigmoid function. A capsule’s neurons are programmed to work independently to detect a range of object features like position, size, and color. These properties are employed in capsules to analyze the aspects of an image, as well as its deformations and viewing conditions. By detecting the pieces first, this feature has the advantage of recognizing the full item. The features collected from the convolution layer are fed into a capsule. The features provided as input are treated differently depending on the type of capsule. The result of the capsule is a set of vector values called instantiation parameters, which define the likelihood of a feature being displayed. Matrix multiplication, the scalar weighting of input vector values, Self-Attention routing, and the squashing function are the most important features of a capsule network. Squashing is a function for converting data to a vector while maintaining the direction of the vector. In a modified capsule network (Mod-CapsNet), the squash function is removed and a max-pooling layer with a convolutional layer is introduced. In other words, instead of using the squash function for suitable resizing of the data, max-pooling is used. Figure 5 depicts the proposed modified capsule network architecture for diagnosing and classifying diabetic retinopathy using fundus images as input.
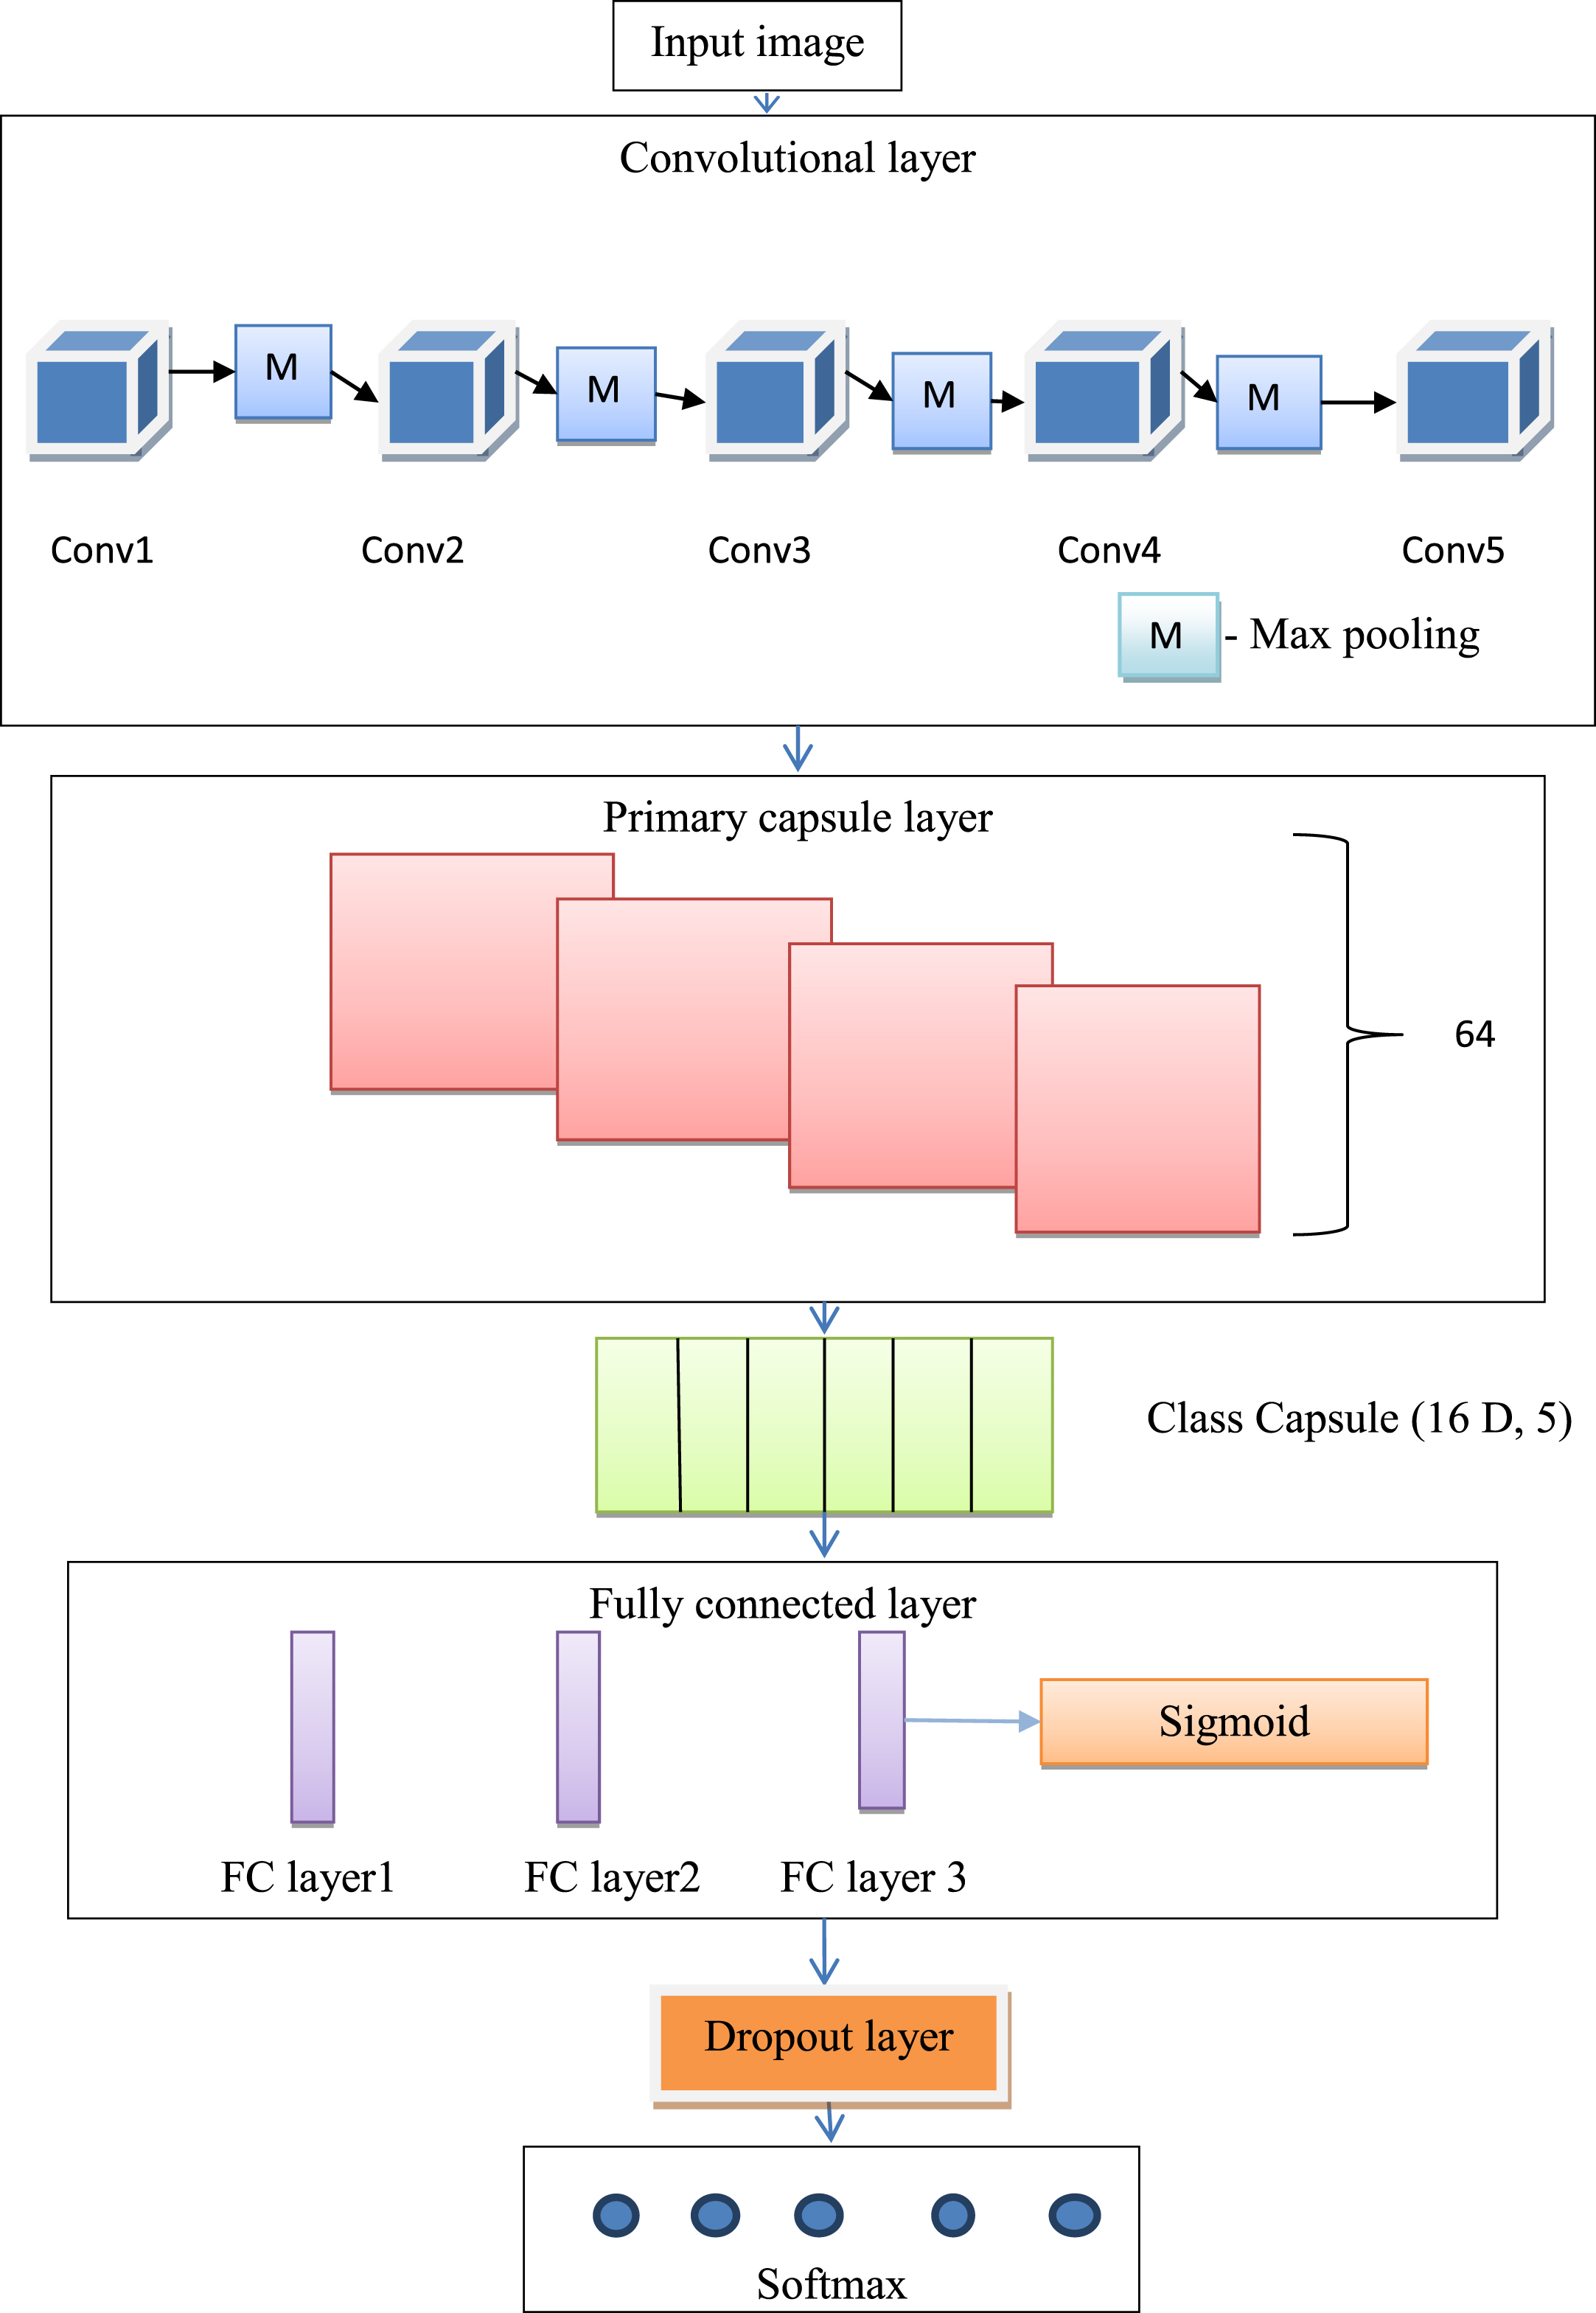
Proposed modified Capsule network architecture.
The fundus images were utilized as the input image for more precise results, with the preprocessing technique mentioned in “Preprocessing” employed to enhance contrast and reduce noise in the images.
The convolution layer is Capsule Network’s first layer, and each neuron is linked to a receptive field, which is a piece of the input region. There are three convolutions in each convolution layer. The features from the fundus images are extracted using the convolution layer. Convolution is an algebraic method that provides the value-wise location-based multiplication rules and also extends the function across new space. Every convolution layer generates a set of feature maps, which are generated by the convolution layer’s kernel filter. It is commonly used in signal processing and is linked to the Fourier and Laplace transforms. Convolution is a mathematical technique that involves combining two functions to produce a third function which is a convoluted version of one of the input functions.
The integral of the value-wise product of the two input functions are interpreted as the integral of the produced function by one of the input functions. A 512 x 512 pixel preprocessed input image is fed into the convolution layer. The only four internal layers of type convolution in the convolution layer are Conv1, Conv2, Conv3, Conv4, and Conv5. These convolution layers are not connected but are concatenated. The output after concatenation is fed to the Max-Pool layer. The channel size for all the convolutional layers is 3X3, and a stride of 1 is used to convolve the features in each of the five layers. Each max pool layer has a pool size of 2X2. The stride for all max pool layers is 2 in this architecture. The output from the fifth three convolutional layers’ is fed to the primary capsule that has no squash function.
After the convolution layer follows the primary capsule layer. The output from the fifth three convolutional layers’ is fed to the primary capsule that has no squash function. The number of primary capsules used is 64, strides 2, and valid padding. A convolution layer receives the input from the primary capsule layer. Consider a convolution layer that outputs an array of feature maps, such as 36 feature maps. For each position in the image, the feature maps are reshaped using a reshaping function, for example, into four vectors with nine dimensions each (36 = 4 x 9). Without changing the location information, this function assures that the vector’s length is between 1 and 0. The convolution layer feeds this layer a feature map with dimensions of [480 x 480, 256]. The input feature map is convolution using a 5 x 5 filter and a stride of 2. Convolution detects key features, and primary capsules are responsible for producing alternative combinations of those features. The layer is made up of 64 “primary capsules” that have the same characteristics as the convolutional layer.
The output of the primary capsule is taken as input by the DigitCaps which is 5 in number and has 16 channels. The class capsule layer receives the output from the primary capsule layer. The output capsules are connected to the Class Caps layer by the Self-Attention routing algorithm, and the capsules are grouped into a parent capsule in the Class Caps layer. In this proposed modified capsule network architecture, the convolution neural network’s max-pooling layer is replaced by a class capsule layer. The proposed classifier network uses Self-Attentionrouting-by-agreement instead of dynamic routing. In this proposed model, three different types of capsules with dimensions of 4, 8, and 16 are employed for each class label. Between the primary capsule layer and the class capsule layer, the Self-Attention routing protocol is used. Four-dimensional capsules make up the first sub-layer, which receives input from the main capsule layer. The second sub-layer will be an 8D capsule, using a 4D capsule’s output as the input. The output obtained from the 8D capsules is then used as an input to the 16 D capsules. The result obtained from the 16D capsule determines the output of the class capsule layer. In order to route active capsules to the whole they belong, we make use of our self-attention routing algorithm.
Capsule networks transport information from one layer to the next using routing. It is a kind of voting system that collects votes from capsules in a lower capsule layer and then determines if these votes, which are consolidated into capsules in the higher capsule layer, are in agreement. To accomplish this, sets of lower-level capsules can vote for higher-level capsules by coming to an agreement in high-dimensional space using conventional routing technologies (such dynamic and EM routing, for example). This approach has primarily been utilized on small-scale data because it is computationally intensive and frequently relies on an iterative procedure. We suggest using self-attention in place of this routing mechanism because it can provide a similar mechanism for determining agreement between high-dimensional vectors. Practically, to prevent entities that are not existing from being employed in the routing process, we first multiply capsule vectors by their corresponding activations.We then learn a set of functions to extract the respective key, query, and value representations from capsules
When it comes to capsule routing, the value can be viewed as a vote or prediction for the characteristics of the higher level capsule, whilst the query and key provide the routing coefficients that govern how much information a lower level capsule delivers to a certain higher level capsule.Each training sample is compared to each of the output classes to determine the loss. The sum of the losses in each class capsule is the overall loss. The loss equation is given by:
The class capsule layer necessitates a higher number of parameter training cycles. The trainable parameter is determined by multiplying the number of vectors received from the Primary capsule layer by the number of vectors required as output.
After class caps, all the information is fed into the FC Layers. The first and second FC Layers each have 4096 neurons, whereas the third FC Layer contains just five neurons. There is a ReLU activation function in both FC Layers. The correct identification of the category of the scenes is then accomplished using the sigmoid function. In order to prevent overfitting in classification networks, use dropout layer in front of ouput SoftMax layer.
The output layer is the SoftMax layer, which is utilized to classify each class. The softmax layer’s output labels and nodes are identical. As a result, the softmax layer in the proposed technique is considered to have five nodes. The softmax is used in its entirety, which means that the probability is calculated for each possible class. The capsule network also encounders overfitting problem. The Adam optimizer and dropout are used to avoid over-fitting problem.
The following performance evaluation measures are used for the quantitative evaluation of the proposed approach.
Structural Similarity Index Measure (SSIM), Mean Square Error (MSE), and Peak Signal to Noise Ratio(PSNR) are the performance metrics employed in the pre-processing. PSNR tries to demonstrate the quality of the final image once the approach has been applied. A higher PSNR value indicates that the reconstructed image will be of higher quality. To obtain a PSNR value, a mean square error (MSE) is first determined. The MSE is the difference between the improved and original image’s cumulative squared error.
The PSNR of a denoised image
Where x –ground truth image
L-Dynamic range of allowable pixel intensities (L = 255)
The structural similarity between an original and an improved image is measured using the SSIM index. The best identical photos with a high contrast rate have a higher SSIM rating. The SSIM is a multiplicative model with brightness, contrast, and correlation loss built in. Furthermore, the SSIM index is derived using
Where,
The information received from the ground truth image is applied to each pixel of the image in the segmentation issue. Standard pixel-level measurements like accuracy, sensitivity, and specificity are incorrect because the foreground, which is the healthy part of the retina, generally outnumbers the background, which is the actual lesion. As a result, a segmentation algorithm’s pixel-wise accuracy would be near perfect all of the time, even if it didn’t always recognize the important lesions, simply because the background is mostly matched with itself. As a result, measures like IoU and the Dice coefficient are the most relevant for evaluating a segmentation model’s performance.
The Intersection-over-Union (IoU) measure is often used in segmentation problems. The area of overlap between the anticipated segmentation region and the ground truth region, divided by the union between the predicted segmentation region and the ground truth region, is defined as the IoU metric.
Its value ranges from 0 to 1, with 1 being a perfect match and 0 representing a complete mismatch. After that, the evaluation metric is constructed by averaging each class’s IoUs.
The suggested segmentation algorithm’s DICE co-efficient is derived by multiplying the total number of pixels in both areas by the twofold overlap area between P and G. The dice similarity coefficient is a reproducibility validation metric as well as a spatial overlap index.
Its value is also the same as the F1score metric’s value. The DICE coefficient, like the IoU, is a number that ranges from 0 to 1.
The number of test records properly and wrongly predicted by the classification model determines the efficiency of the classifier network. A confusion matrix is a table that shows how many records were correctly calculated and how many were mistakenly calculated. The number of successfully and erroneously identified samples is indicated by the values in the confusion matrices. The confusion matrix contains four categories of values: True Positive (TP), True Negative (TN), False Positive (FP), and False Negative (FN).
True Positive, True Negative, False Positive, and False Negative values are evaluated separately for each class category in a multiclass classification system. The confusion matrix can be used to measure accuracy, precision, and recall as well as the F1 score. The performance of our proposed modified Capsule Network system was evaluated using the following evaluation measures in this paper.
Precision is a metric that counts the number of correct positive predictions. Precision P is defined as follows for the general two-class classification problem:
For the five-class classification system, the precision value P is defined as:
Where, β –Number of classes
Our proposed work classifies the five different categories of diabetic retinopathy, here the value of β is chosen to be 5.
The recall is the number of correct positive predictions out of all possible positive predictions. Recall R is defined as follows for the two-class classification problem:
For the five-class classification system, the recall value R is defined as:
The F1-scores are defined as the harmonic mean of precision and recall. The following formula is used to calculate the F1-Score:
The classification accuracy is one of the factors to consider when evaluating the proposed classifier. The percentage of accurate predictions made by the suggested model is represented by this metric. The accuracy (A) is defined as follows:
Where True Positive is represented as the number of records for which the model correctly predicts the positive class as positive
False Positive represents the number of records for which the model incorrectly recognizes the negative class as positive
True Negative represents the number of records for which the model correctly recognizes the negative class as negative
False Negative means the number of times the model predicts the positive class as negative
In MATLAB 2018a, the proposed technique was developed using MATLAB on a Windows PC with a CPU speed of 2.6 GHz and 4 GB of RAM. The images in the sample are from the database. To acquire a better grasp of the method’s performance, it’s necessary to use an example database from the literature and execute the relevant assessment settings. A benchmark MESSIDOR dataset was utilized to test the presented model’s ability to detect DR. There were roughly 1200 color fundus images in this data set, all of which were properly annotated. Normal retina, mild nonproliferative diabetic retinopathy, moderate stage of nonproliferative diabetic retinopathy, severe non-proliferative diabetic retinopathy, and proliferative diabetic retinopathy are some of the classifications of diabetic retinopathy images. The presence of micro aneurysms in the pictures was rated, and they were assigned a hemorrhage. The healthy retina can be shown in the photograph without any symptoms. Stage 1 is represented by the image with microaneurysms, whereas stage 2 is represented by the image with few microaneurysms and hemorrhages. Stage 3 is indicated by pictures that show venous beading as well as intraretinal microvascular abnormalities. Images with several microaneurysms and vitreous/pre-retinal hemorrhages are classified as stage 4.
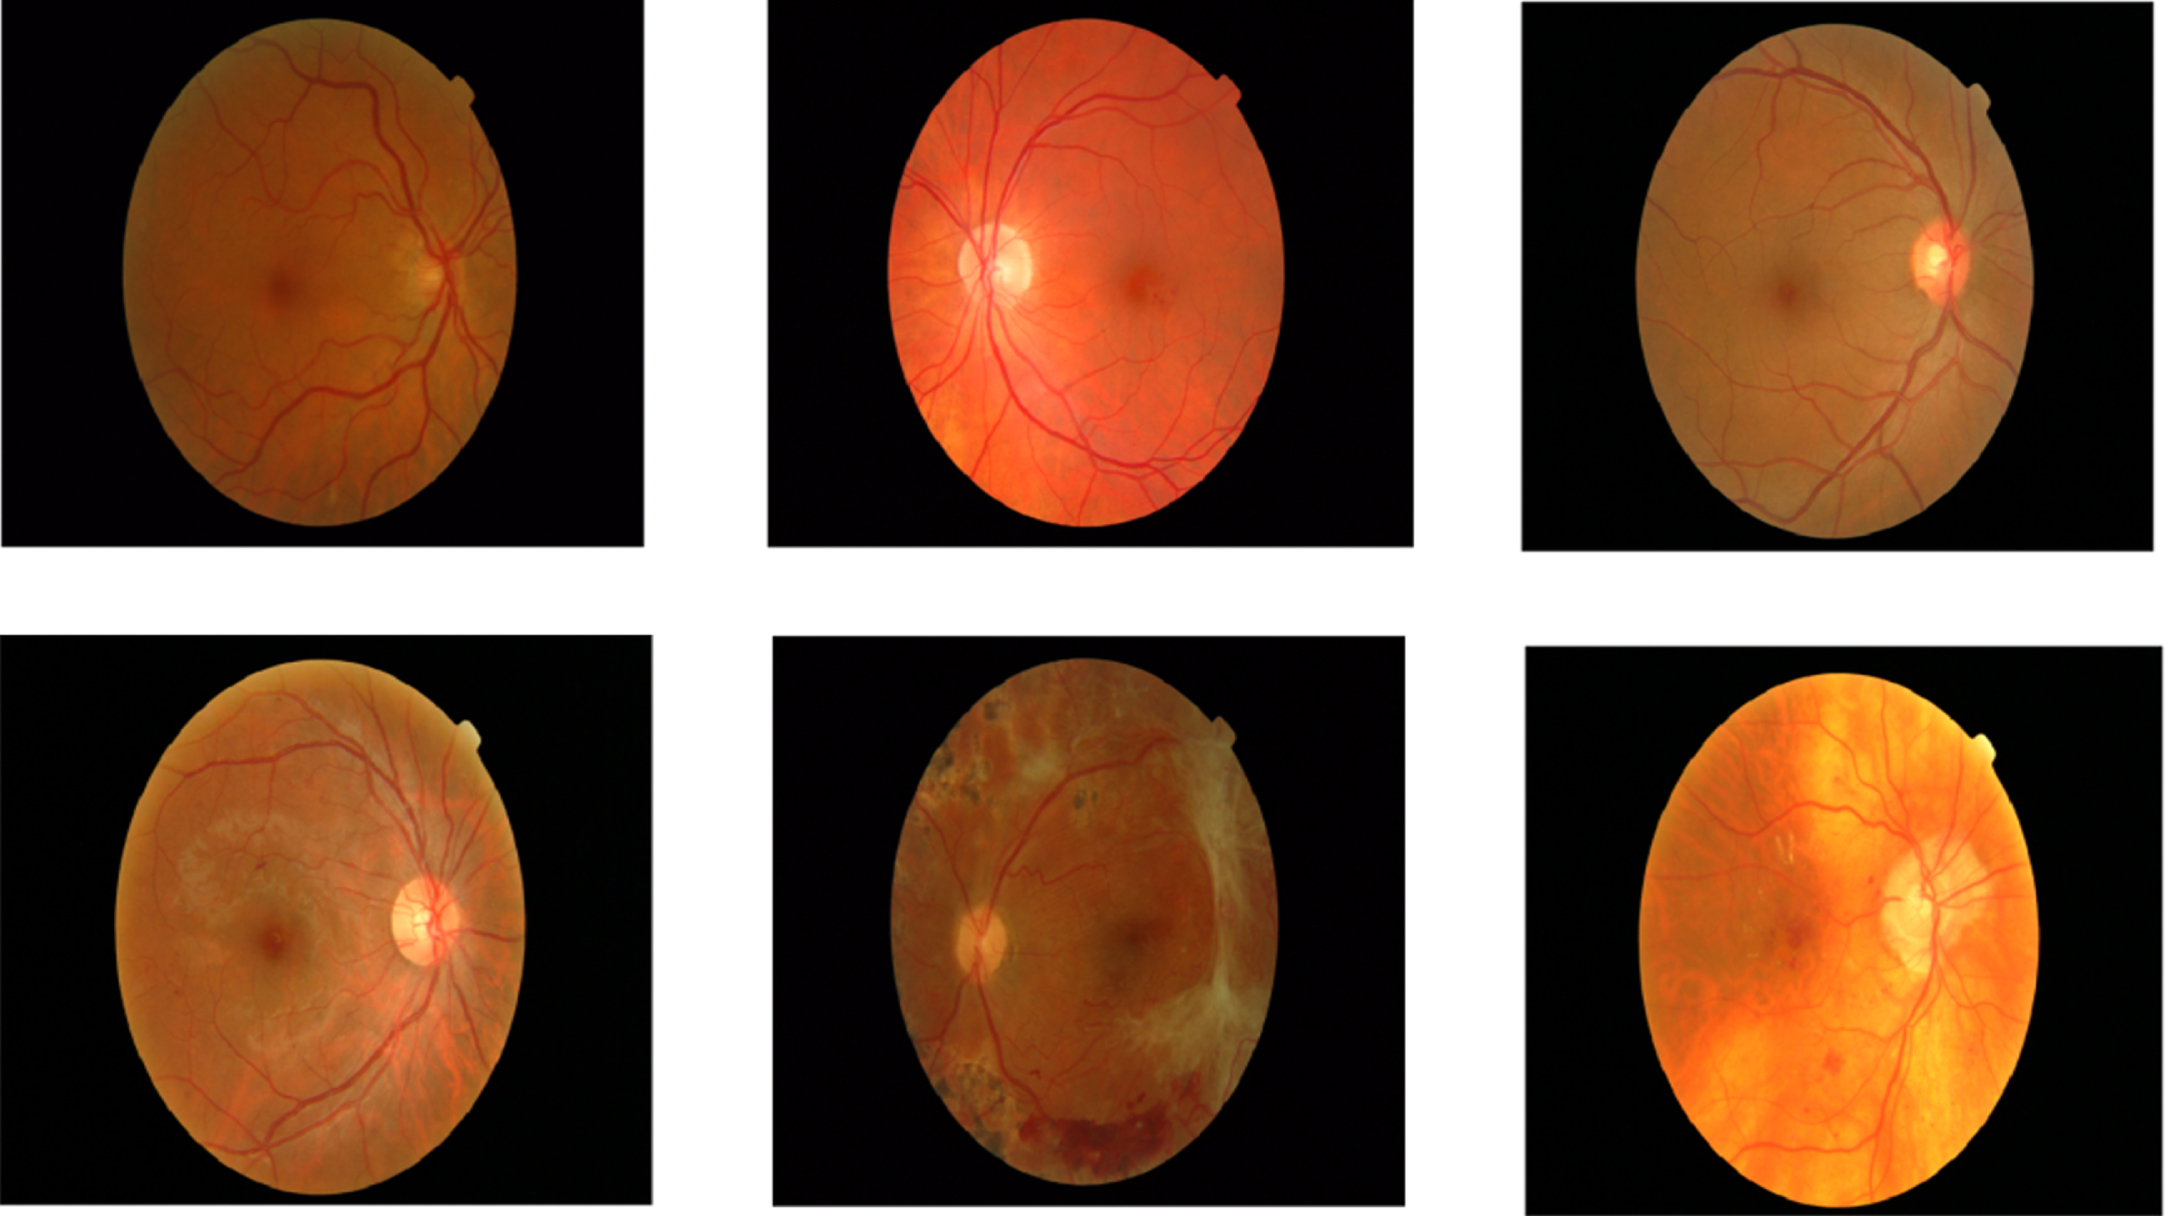
The fundus images were initially resized to 512 X 512-pixel sizes to enable a computationally efficient approach. Pre-processing was also done to ensure the best classification accuracy and overall performance. The generated results are frequently compared using established criteria such as peak signal-to-noise ratio, structural similarity index measure, and mean square error in such image processing investigations. For a long time, these assessment factors have been used to compare different approaches to picture data. Figure 6 shows some examples of diabetic retinopathy images as input. The fundus images were initially downsized to 512 x 512-pixel sizes to enable a computationally efficient approach. The resized images are shown in Fig. 7.

Sample diabetic retinopathy images.
Resized images.
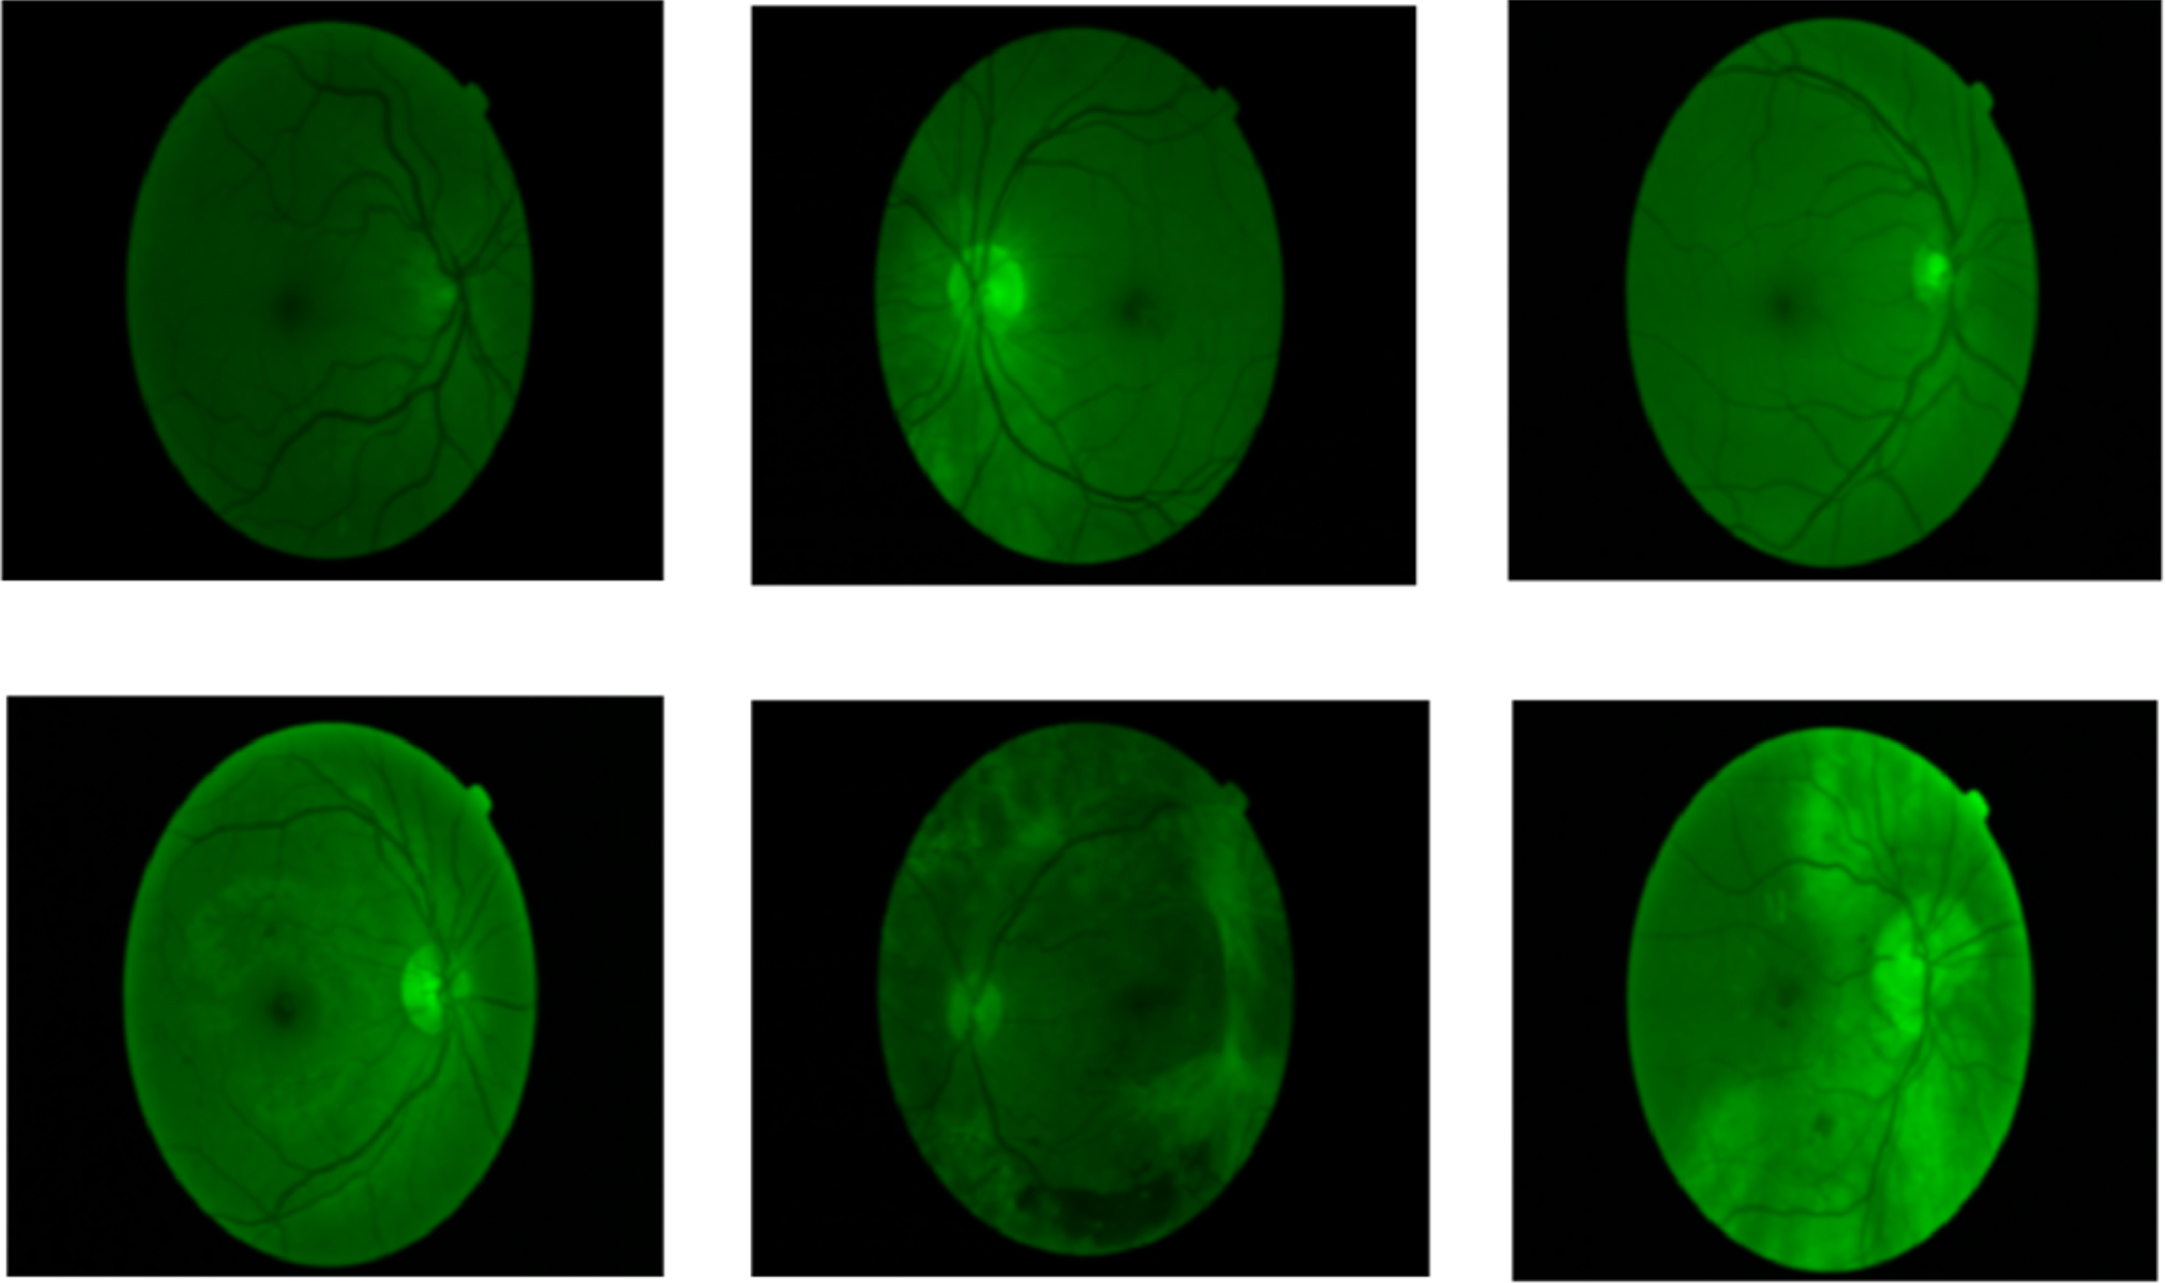
After that, the RGB color channels are extracted. The resized image is also converted to a monochrome component image. One of the RGB components is extracted and converted into a single red, green, or blue channel in the channel of an image. Each color component’s traditional brightness ranges from 0–255. The isolated red and blue channels were found to be either too brilliant or too dark in their respective circumstances when the RBG image channels were removed separately. The green channel, on the other hand, shows the most exact image. The green channel images provide a considerably clearer view than grey scaling. This channel also showed the ROI, or fundus exudates, better than grayscale or any other color representation. As a result, the image’s green band is extracted because it shows the red lesions the best. Figure 8 shows the image of the extracted green channel.

Green channel extracted images.
The noise-removed images are shown in Fig. 9. The image’s noise is removed using the Gaussian filter. A low pass filter called a Gaussian filter is used to minimize image noise and blur. To get the final noise-reduced image, an odd-sized symmetric kernel is passed through each pixel of the region of interest in the image.
Noise-removed images.
The noise-removed image is enhanced using the proposed modified contrast limited adaptive histogram equalization. The contrast of a picture is emphasized and adjusted in contrast enhancement. Contrast enhancement is used to improve eyesight clarity and differentiate between multiple features in the backdrop. The modified CLAHE performs with one additional parameter such as the clipping level of the histogram. The contrast-enhanced image is represented in Fig. 10. Table 2 represents the performance evaluation of the retinal image with Gaussian noise.

Contrast-enhanced images.
Performance evaluation of retinal image with Gaussian noise
A max fusion of the SFCM cluster model is proposed for blood vessel segmentation in retinal images. A blood vessel segmentation technique was also carried out to ensure optimal classification accuracy and overall performance. In a green channel retinal image, the contrast between arteries and backdrop is stronger.FCM is a clustering approach that uses fuzzy membership to allow a pixel to belong to two or more clusters. The membership function determines how likely a pixel is to belong to a specific cluster. The pixels closer to the cluster’s centroid are allocated as higher membership values and pixels further away from the centroid are assigned lower membership values, and the cost function is drastically reduced. In the fuzzy c-means algorithm, the probability is calculated by determining the distance between the pixels and the unique cluster center. Figure 11 shows blood vessel segmented images.

Blood vessel extracted images.
To segment, the lesions in the fundus image, a feature fusion-based U-Net architecture is proposed. A convolutional neural network that was built for biological image segmentation is the recommended feature of fusion-based U-Net architecture. The architecture of the network was altered and expanded to allow it to function with fewer training photos and generate more precise segmentation results. On a contemporary GPU, segmenting an image of 512×512 pixels takes less than a second. A novel multiscale feature-fused block is also included in the U-Net architecture; it permits the fusing of data from various channels, which is important for the diabetic retinopathy lesion segmentation task. Figure 12 illustrates the ground truth image and Fig. 13 shows the lesion segmented diabetic retinopathy images.

Ground truth image.

Segmented output.
According to IoU and Dice coefficients, the proposed segmentation algorithm successfully segmented out the vessel and lesion area of the diabetic retinopathy images, as shown in Table 3. Table 4 shows the comparison of spatial fuzzy c means clustering with other existing algorithms like FCM, K means clustering etc. It proves that the proposed spatial FCM clustering provides high accuracy than the other algorithms.
Comparison of segmentation accuracy
Performance comparison of vessel segmentation algotithms
In this study, in order to prevent over-fitting, we trained our model for DR classification using a modified capsule network along with Adam optimizer and dropout. The early stop strategy is used to monitor the model’s training progress and to halt the process when the model consistently generates constant values for a significant number of epochs. A learning rate of 0.0001 is used for best performance. In this study, we have investigated how several hyper-parameters, such as dropout, pooling method, learning rate (LR), and optimizer, may be tuned to regulate the model performance (Adam). Table 5 is a list of the parameters. Additionally, we assessed our suggested model using assessment measures for accuracy, sensitivity, specificity, F1 measure, and AUC.
Parameters of modified capsule network
760 photos are utilized for network training, 90 images for validation, and 350 images are used to assess the trained network’s performance using the Messidor dataset. As seen in Fig. 13, the major diagonal elements reflect instances that have been successfully classified. In a multi-class classification problem, the number of rows and columns in the confusion matrix equals the number of different classes in the dataset. The confusion matrix for each class is used to produce the TP, TN, FP, and FN observations. Based on the observations, various performance indicators such as accuracy, precision, recall, and F1 score are evaluated. In class 1, a total of 96 images were correctly recognized as true positives. Only four images were incorrectly categorized. As a result, the model’s accuracy for class 1 will be 98 percent. For each of the five classes, Table 6 lists the accuracy, precision, recall, and F1- score. Precision and recall measurements are used to determine the F1 score. The performance of modified Caps is assessed using a 10-fold cross-validation with 50 epochs. The training accuracy and loss for onefold of the first application are shown in Fig. 14. A comparison of performance in each of the five classes is shown in Fig. 18.

Training and validation curves.

Confusion matrix.
Performance measures evaluated from the observations of the confusion matrix
Figure 16 displays the validation and training accuracy of the capsule network and the modified capsule network. Thus, our proposed model performs better than the original capsule network with a higher margin. The ROC-AUC curve shows that our proposed model achieves an AUC of 99.0% which is higher than the single capsule network with an AUC of 95.8% as shown in Fig. 17.

Training accuracy and validation accuracy performance of two models –capsule network and the Modified capsule network.

ROC curve.
Table 7 denotes typical training time of proposed modified capsule network. To train the mod-caps network model for 50 epochs using 100% of available training data. Training time for the Modified Capsule Network is better than the original exisiting capsule network.
Training time of modified capsule network compared with capsule network

Performance comparison of each class 1–5.
The evaluated performance measures of the proposed modified Capsule Network are compared with the other existing algorithms.
A comparison of the proposed work with the existing architecture is shown in Table 8. The proposed system uses a modified Capsule network that produces a better result, with 98.57 % accuracy.
Performance comparison of various existing algorithms with the proposed algorithm
Diabetic retinopathy is one of the most critical complications in a diabetic patient; it destroyed the blood vessels in the retina resulting in vision impairment. In some rare cases, diabetic retinopathy causes total blindness. If identified early enough, diabetic retinopathy can be avoided. The proposed system comprises three steps; they are image preprocessing, image segmentation, and classification. In preprocessing, Gaussian filter and modified contrast limited adaptive histogram equalization is performed for enhancing the input image. The lesion region of diabetic retinopathy fundus image is segmented by using Feature Fusion-based U-Net architecture. A blood vessel of a retinal image is extracted by using the spatial fuzzy c means clustering (SFCM) algorithm. Deep learning is useful in the domain of medical image analysis. CNN stands for “convolutional neural network,” which is a well-known image processing network. Capsule networks are designed to get around CNN’s pooling layer difficulty. A modified capsule network is proposed for the classification of diabetic retinopathy using fundus images. The features are extracted using the convolution layer and primary capsule layer, while the class capsule layer calculates the probabilities of a specific class. In all five classes, the modified Capsule Network correctly finds the problem. Only the Messidor dataset is used to train the proposed modified capsule network, which identifies diabetic retinopathy in five stages. The proposed modified capsule network model got 98.57% classification accuracy.
The proposed capsule network was to be trained for all probable retinal disorders as a future extension of this research. As a result, the cabinet can detect retinal issues in patients early, allowing for better diagnosis and preventing vision loss.