
Abstract
Premature mortality from cardiovascular disease can be reduced with early detection of heart failure by analysing the patients’ risk factors and assuring accurate diagnosis. This work proposes a clinical decision support system for the diagnosis of congenital heart failure by utilizing a data pre-processing approach for dealing missing values and a filter-wrapper based method for selecting the most relevant features. Missing values are imputed using a missForest method in four out of eight heart disease datasets collected from the Machine Learning Repository maintained by University of California, Irvine. The Fast Correlation Based Filter is used as the filter approach, while the union of the Atom Search Optimization Algorithm and the Henry Gas Solubility Optimization represent the wrapper-based algorithms, with the fitness function as the combination of accuracy, G-mean, and Matthew’s correlation coefficient measured by the Support Vector Machine. A total of four boosted classifiers namely, XGBoost, AdaBoost, CatBoost, and LightGBM are trained using the selected features. The proposed work achieves an accuracy of 89%, 84%, 83%, 80% for Heart Failure Clinical Records, 81%, 80%, 83%, 82% for Single Proton Emission Computed Tomography, 90%, 82%, 93%, 80% for Single Proton Emission Computed Tomography F, 80%, 80%, 81%, 80% for Statlog Heart Disease, 80%, 85%, 83%, 86% for Cleveland Heart Disease, 82%, 85%, 85%, 82% for Hungarian Heart Disease, 80%, 81%, 79%, 82% for VA Long Beach, 97%, 89%, 98%, 97%, for Switzerland Heart Disease for four classifiers respectively. The suggested technique outperformed the other classifiers when evaluated against Random Forest, Classification and Regression Trees, Support Vector Machine, and K-Nearest Neighbor.
Keywords
Introduction
The cardiovascular disease (CVD) refers to a wide range of conditions affecting the heart that are among the leading causes of death in the world. The most important factors that put a human at risk for cardiovascular disease include smoking, having high blood pressure, high cholesterol, high triglycerides, drinking too much alcohol, having an unhealthy diet, being overweight, and not being physically active [1]. Because the rate of cardiovascular disease (CVD) is on the rise in the majority of nations at an alarming rate, it is more crucial than ever to detect CVD at an early stage and make an accurate diagnosis [2]. CVD can lead to a number of different cardiovascular conditions, including coronary heart disease, cardiomyopathy, heart failure, and stroke [3]. The number of persons dying from cardiovascular diseases in the western world is reducing as better pharmacological diagnosis and better approaches to prevent CVD are being established [4].
The machine learning approach analyses clinical records that can be found in open sources or directly in the hospital repository if the right permissions are given [5]. The Clinical decision support systems (CDSS), evaluates the medical records of a patient and provide doctors with a second opinion based on an analysis of electronic health record (EHR) data that has been collected in the past [6]. Clinicians in the actual world using this CDSS might be able to accept the suggestions offered by the CDSS, which might lead to an accurate diagnosis [7].
Classification, Association Rule Mining, and Clustering are the three most essential subtasks in data mining. A two-stage supervised learning approach; classification relies on labeling examples to create a training set. To categorize an unseen instance, first a model is constructed using the training dataset followed by testing phase. Association Rule Mining is a method of unsupervised learning and identifies clusters of regularly occurring data and employs them to construct robust rules. Clustering is a method for unsupervised learning in which groups of data are categorized according to their resemblance to other groups and to themselves, with the goal of increasing similarity within each group while decreasing similarity across groups [8].
In order to improve the performance of classifiers, it is necessary to do data preprocessing, which involves removing any missing, noisy, or outlier values from the dataset. Missing or inaccurate numbers are common in clinical health records due to human error, inaccurate instrument readings, and data duplication. Predictions for the missing values are calculated by either machine learning or statistical approaches during the missing value imputation process [9]. In a dataset with missing values that are completely at random (MCAR), there is no relationship between the missing values and the data and the likelihood of missing values is the same for all values. Missing Completely at Random (MCAR) is a type of missingness in a dataset in which the probability of missingness percentage is the same for all the data and there is no correlation between the missingness and the data. Missing at Random (MAR) is the other type of missingness. In MAR, the percentage of missing data happens at random, but there is a strong link between the missing data and the original data. It is called “missingness, not at random” when the overall missingness is more related to the variables in the dataset and the missingness is not random (MNAR).
When irrelevant features that have nothing to do with the class label are present, they create bias in the prediction and affect the classification’s performance. Feature selection is used to analyze which features of the original dataset are the most important [10]. The most relevant features are selected by using the filter, wrapper, embedded, or hybrid approaches. Methods like the chi-square test, the Analysis of variance (ANOVA) test, and the Linear discriminant analysis (LDA), are used in the filter approach [11] to rank features. The wrapper method figures out how important each feature in the dataset is by looking at how well the classifier works and using methods called Recursive Feature Elimination (RFE), Backward Elimination, and Forward Selection [12, 13]. The learning algorithm is used in the embedded feature selection method to combine the best parts of the filter and wrapper methods. Both Ridge regression and Lasso regression are used in these methods to choose features at the same time. In the hybrid method, the features are first ranked by a filter method. Then, a wrapper method figures out how much each feature adds to the classification method. In one step, Pearson’s Correlation, Chi-Square, ANOVA, Fisher’s score, Gini index, an Information Gain, or a Feature Importance Score are used to rank the features. A wrapper approach [14] is then used to evaluate the top set of features.
Zhiyong Hu et al. [15] proposed the missing value imputation method of Gaussian Process Latent Variable Model (GPLVM) for the efficient prediction of heart failure disease using Constrained Support Vector Machine (cSVM) along with a Logistic Regression (LR) with Least Absolute Shrinkage and Selection Operator (LASSO) regularization for selecting the most relevant features. Fahad B. Mostaf et al. have come up with an imputation framework that uses Multiple Imputation by Chained Equations to predict liver diseases using binary classifiers like Artificial Neural Network (ANN), Random Forest (RF), and Support Vector Machine (SVM) [16]. Liying Fang et al. have come up with a way to pull out features from multi-dimensional clinical time series data using the Kozachenko–Leonenko (K–L) information entropy estimation method. This method is based on mutual information [17]. Elham Nasarian et al. came up with a way to pick the most important features based on a hybrid method that combines the best parts of the Fisher score algorithm (FSA), the F score algorithm (FA), and the extra trees classifier algorithm (ETCA). This method is used to predict coronary artery disease [18]. Mohammed Al-Sarem et al. came up with a method for predicting Parkinson’s disease based on XGBoost, CatBoost, and random forest. This method is called “ensemble feature selection.” [19]. A. N. M. Bazlur Rashid et al. [20] suggested using the cooperative co-evolution method with a penalty-based objective function as the fitness value for classifying medical datasets. These studies made it possible to look into more methods for missing value imputation and different optimization algorithms for choosing the most important features to improve the performance of the classifier.
In this work, the missing values in four of the eight datasets are addressed by the data pre-processing subsystem using a missForest method. The filter approach used is the Fast Correlation-Based Filter (FCBF), and the features are chosen by combining the Atom Search Optimization Algorithm (ASO) and the Henry Gas Solubility Optimization (HGSO). As the fitness function, the Support Vector Machine (SVM) measures accuracy, G-mean, and Matthew’s correlation coefficient (MCC). The chosen features are used to train the four boosted classifiers: XGBoost, AdaBoost, CatBoost, and LightGBM Classifier.
Here’s how the rest of the paper is put together: Section 2 presents the list of abbreviations used in alphabetical order. In Section 3, an overview of the related work is given. Section 4 outlines the materials and methods. In Section 5, the framework for the subsystem for selecting features is explained. The Classification Subsystem is explained in Section 6. In Section 7, the Results and Discussions are presented. Section 8 presents the Conclusion and Future Scope.
List of abbreviations
Table 1 shows an outline of the list of abbreviations that are used in the rest of the manuscript. The list is in alphabetical order.
Abbreviations used
Abbreviations used
The majority of the studies that are included below focused on classification frameworks for clinical datasets. These works utilized bio-inspired wrapper-based algorithms for data pre-processing and feature selection.
Nancy et al. [21] proposed a missing value imputation approach for unevenly spaced clinical time series data utilizing an IDW and PSO. The known data points have been chosen based on the TR and a PSO is used to select the influence factor which assigns weights for the known data. Based on the attribute dependencies the nearest significant set has been generated for each missing value. The IDW utilizes the influence factor and neighborhood set for missing data. Training and testing sets were generated using ten-fold cross-validation and two independent evaluation runs. The proposed work has been experimented with clinical time-series data of hepatitis and thrombosis patients from Chiba hospital which achieved a classification accuracy of 83.57% and 80.15% with missingness percent ranging from 10% and 15%. The proposed approach in combination with the decision tree results in an accuracy of 81.14% and 77.91% for the missing rate of 10% and 15% and 78.89% and 76.19% for the missing rate of 10% and 15% using SVM.
Kindie et al. [22] proposed a classification framework for clinical datasets based on a hybrid approach that combines the properties of Fuzzy sets and FELM. In this study, missing values are imputed using the KNN algorithm, and outliers are removed from the datasets during the pre-processing phase. The dataset’s properties are mapped to the Fuzzy set, and the ELM is used to conduct classification. Experiments has been performed on clinical datasets collected from the MLR maintained by UCI and achieved an accuracy of 93.55% for CHD with two class labels and 73.77% with five class labels. 94.44% for the SHD dataset and 92.54% for the PID dataset.
Ching-Hsue Cheng [23] proposed an imputation framework utilizing a purity-based K-NN algorithm, which enhances the performance of missing value imputation. In this work, imputation has been performed by normalizing all features to the same scale and evaluating their purity. The dataset has been used then partitioned into instances with and without missing values. The Euclidean distance metric has been used to determine the nearest neighbors, and the purity was determined by aggregating the votes cast by the neighbors. Positive purity has been used to replace missing values and has been indicated as being extremely similar to its neighbors, whilst negative purity has been considered as extremely dissimilar to its neighbors. Experiments has been performed on nine datasets, eight from the MLR maintained by UCI and one from the TEJ financial distress dataset, and achieved an accuracy of 94.37% for the banknote dataset, 81.31 for the blood dataset, 98.17% for the climate dataset, 79.75% for the Haberman dataset, 85.42% for the Pima dataset, 89.01% for the Vertebral 2 C dataset, and 86.67% for the Vertebral 3 C dataset.
Arianna Dagliati et al. [24] proposed an imputation framework for the detection of Diabetes Complications utilizing two techniques, namely imputation using the mean and median approach and imputation using the RF approach. The imputation technique involves a dataset with no missing values, after which the percentage of missingness in the original dataset is estimated by randomly removing features. Then, artificial missingness has been generated by removing the same estimated percentage of missingness from the original dataset in order to evaluate the imputing capability. The mean, median, and missForest algorithms are used to address the missing values in the data set. The missForest method was utilized for random forest imputation, in which 100 trees were created with 100 iterations, and the RMSE and RMSEN were used to evaluate the effectiveness of the missForest imputation. The experiments has been performed on clinical datasets, the Type 2 Diabetes Mellitus dataset collected from the IRCCS, a research hospital, ICSM, Hospitals of Pavia, Italy, and the SVM classifier achieved an accuracy of 83.8%.
Malek Alzaqebah et al. [25] proposed a wrapper-based approach for selecting the most relevant features utilizing an MFO and the accuracy of an SVM classifier as the fitness function. The objective of the MFO algorithm is to find the intelligent flight path that has been deemed a straight line by maintaining the Moon as the light source. In this wrapper-based feature selection, three neighbourhood approaches, NBChange, NBMove, and NBSwap, has been outlined to prevent moths from being trapped in the local optimum. The datasets used in this study were collected from the MLR maintained by UCI, and achieved an accuracy of 78.63% for the German dataset, 88.42% for the Heart dataset, 89.64% for the Ionosphere dataset, 89.71% for the Parkinson’s dataset, 86.38% for the Spectf dataset, 88.09% for the Sonar dataset, 98.96% for the WDBC dataset, and 98.35% for the WBC dataset using the SVM classifier.
Mehrdad Rostami et al. [26] proposed a wrapper-based approach for selecting the most relevant features utilizing the PSO with the MOPSO and Node Centrality technique for medical datasets. The features present in the medical datasets, initially represented as a weighted graph, and the feature popularity has been evaluated using the node centrality approach. This yields the starting population for the PSO algorithm, and the MOPSO has been used to choose the most relevant features. The computation of node centrality has been performed to avoid early convergence by producing features with high centrality that will be treated as initial solutions rather than being randomly assigned. The datasets collected from the Bioinformatics Research Group, achieved an accuracy of 85.10 percent for the Colon dataset and 88.89 percent for the Leukaemia dataset. Using the remaining datasets from Universidad Pablo de Olavide, the SVM classifier attained an accuracy of 82.10% for the SRBCT dataset, 81.67% for the Prostate Tumor dataset, and 88.19% for the Lung Cancer dataset.
Golnaz Sahebi et al. [27] proposed a wrapper-based method for identifying the most relevant features using an IGA and the K-NN classifier. The multi-population scheme property has been achieved by performing parallel processing of the modified GA algorithm for the initial population. The precision of the K-NN classifier was used to evaluate the quality of each solution. A new genetic operator has been proposed named inverse which implements the weighting method by updating the weights of each feature present in the dataset. In addition to removing the improved solutions from the original population, the replacement operator has also been used to remove the improved solutions from the initial population. The technique has been iterated until the optimal population solution was obtained. The experiments has been performed on five clinical datasets collected from the MLR maintained by UCI and achieved an accuracy of 95.83% for Lung, 97.62% for Dermatology, 99.02% for Arrhythmia, 98.51% for WDBC, and 94.2% for Hepatitis.
Huseyin Polat et al. [28] proposed the selection of the most relevant features for the diagnosis of chronic kidney disease by combining the filter and wrapper approaches. In the filter approach of feature selection, a correlation-based approach to feature selection has been utilized, while a greedy step-wise feature selector and a wrapper-based subset evaluator has been employed. The greedy search-based feature selection selects features based on forward feature selection and eliminates irrelevant features using backward feature selection. In the process of creating a new subset of features, the newly performing features has been added after the most relevant subset of features identified by evaluating each subset of features. The correlation-based feature selector selects the most relevant feature by ranking all the features in the dataset according to their correlation. The Chronic Kidney Disease dataset collected from the MLR maintained by UCI achieved an accuracy of 98.5%.
Sushama Nagpal et al. [29] proposed a wrapper-based method for selecting the most relevant features using GSA with the accuracy of K-NN as a fitness function. The GSA has been formulated by the property of Newtonian Mechanics in which particle interactions monitored based on the notion that the force of gravity drives all particles to flow towards heavier particles. The entire value of the interaction force has been determined based on the particle directions and, therefore, by updating their positions. The accuracy of the K-NN classifier has been employed as the fitness function and tested on three clinical datasets collected from the MLR maintained by UCI, with an accuracy of 82.96% for the heart disease dataset, 95.7% for the breast cancer dataset, and 96.7% for the dermatology dataset.
V. R. Elgin Christo et al. [30] proposed a wrapper-based approach for selecting the most relevant features using three nature-inspired algorithms, namely DE, LOA, and GSO, with the fitness function being the accuracy of the AdaBoostSVM classifier. Selected relevant features has been used to train a neural network utilizing gradient descendant backpropagation. The bioinspired algorithms utilized in this experiment select a relevant subset of features, and a correlation-based ensemble feature selection has been performed to find the best subset of features for performance evaluation. A gradient-based backpropagation neural network has been used to classify the resultant subset of features. The experiment has been performed on clinical datasets collected from the MLR maintained by UCI and achieved an accuracy of 95.51% for Hepatitis dataset, 98.40% for WDBC.
Sreejith S et al. [31] proposed a classification framework utilizing an ANN optimized with a GA and an AFO for the diagnosis of clinical datasets. The ANN’s topology has been optimized using the GA algorithm, whereas the parameters optimized using the AFO algorithm. The optimization of the topology has been improved with a dropout approach, and the optimization of the parameters is accomplished with a weight regularization method. The dataset is normalized using a min-max scaling method, and the feature selection has been performed using an embedded method that employs a random forest classifier to evaluate the feature importance. Using the GA, the total number of hidden layers and the hidden layer neurons has been optimized, while the AFO approach has been used to optimize the weights and bias. The proposed work has been tested on three clinical datasets from the MLR maintained by UCI, and achieved an accuracy of 86.82% for the HCV dataset, 84.91% for the VC dataset, 95.65% for the SHD dataset, and 93.79% for the ESDRP dataset.
Anisha Isaac et al. [32] proposed a wrapper-based approach for selecting the most relevant features utilizing MFO, FFO, ABCO, and ACO with the fitness function evaluated by the SVM classifier for the diagnosis of pulmonary emphysema. The lung CT slice has been segmented using the Spatial Intuitive Fuzzy C Means Algorithm, and the segmented images has been used to extract the region of interest, followed by a feature selection subsystem utilizing four bio-inspired algorithms, and a reduced feature subset has been obtained using the SVM classifier. Using a trained ELM, the overall performance of the model has been evaluated. The data has been collected at a hospital in Chennai, Tamil Nadu, India. Overall, the dataset achieved an accuracy of 89.02% for MFO, 86.64% for FFO, 84.86% for ABCO, and 78.64% for ACO, based on the proposed aaproach.
Leema N. et al. [33] proposed an evaluation parameter setting for the training of feed-forward artificial neural networks. Using the parameters namely, weights, training epochs, learning rate, momentum, neurons per hidden layer, activation function, and biases, the backpropagation technique has been applied to clinical datasets. Twelve distinct Backpropagation methods has been evaluated based on the effect of varying network parameter values. This work’s pre-processing subsystem handles noisy, irregular, and missing values by either removing the instances or imputing the missing values using the class’s most frequent feature values. The neural network classifier has been trained using a multi-layer feed-forward neural network with one hidden layer, where each input layer corresponds to a significant feature in the dataset. The input, hidden, and output nodes of the neural network has been initialized, and the output of each hidden node has been calculated. Using backpropagation techniques, the error estimate for the network has been reviewed by changing the weight and bias values. The experimentation has been conducted on three clinical benchmark datasets: WBC, PID, and Hepatitis, as well as a dataset taken from the MLR maintained by UCI.
Anisha Isaac et al. [34] proposed a wrapper-based method for determining the most relevant features utilizing an IABCO with the accuracy of an SVM classifier for the diagnosis of Cavitary TB and Military TB. The Active contour region-based model has been utilized for segmentation, and the ROI. The improved ABCO technique employs a search algorithm with two evaluation functions, namely Mutual information and the Rough Dependency measure, to select the most relevant features, for training the RBFNN classifier. The experimentation has been conducted on the Tuberculosis dataset and the LIDC-IDRI dataset, that achieved an accuracy of 88.34% and 92.63% respectively.
Sreejith et al. [35] proposed a wrapper-based approach for selecting the most relevant features using the chaotic evolutionary algorithm CMVO and a SMOTE approach for resolving the class imbalance problem. The model’s overall performance has been improved by the SMOTE technique enhanced with the Orchid algorithm. As the fitness function, the combination of the arithmetic mean of MCC and the F-Score(F1) has been employed and evaluated using an RF classifier. The RF classifier consists of 100 decision trees, and the information gain ratio considers the split criteria. The datasets used in this research has been collected from the MLR maintained by UCI and achieved an accuracy of 82.46% for ILPD, 86.88% for TSD, and 89.0% for PID.
Sreejith et al. [36] proposed an embedded approach of feature selection employing ERT based on different enhanced SOA for modelling a classification framework for clinical datasets. The weight and bias of a feed-forward neural network has been tuned using the strawberry optimization algorithm and the backpropagation algorithm. Two-phase training has been used to overcome the issue of local optimums in neural networks. The issue of local optimums in neural networks has been resolved by combining the two-phase training approach with the stochastic duplicate–elimination strategy. The ensemble approach employed by the ERT provides a series of randomly generated decision trees that reduces the correlation between the data points, hence reducing the total variance of the classifier. An SOA and a Gradient Descent Backpropagation algorithm GDBA optimize DISON. The datasets used in this research include the Vertebral Column, PID, CHD, and SHD collected from the MLR maintained by UCI, and achieved an accuracy of 87.17%, 90.92%, 93.67%, and 94.57%, respectively.
Anisha Isaac et al. [37] proposed a wrapper-based approach for selecting the most relevant features via competitive coevolution by utilizing the SMO algorithm and PFA with the accuracy of the SVM classifier as the fitness function. Employing the SFCM clustering approach, the process of segmenting lung tissues has been achieved. Validated pixel-based segmentation has been utilized to retrieve the ROI. The ROI’s most relevant features, namely shape, texture, and run-length, has been extracted. Using a Competitive Coevolution Model, the most relevant features has been selected. The wrapper-based approach utilizing both algorithms compete to select the most relevant features, employed to train the linear SVM classifier. The datasets used in this research include a real-time emphysema dataset and a CTED dataset, which achieved an accuracy of 81.95% and 93.74%, respectively.
Priti Bansal et al. [38] proposed a wrapper-based feature selection approach for selecting the most relevant features for the diagnosis of osteosarcoma using a binary arithmetic optimization algorithm (BAO). Using a BAO-based feature selection method, the model has been further improved. In this wrapper approach, the classification accuracy of the RBF-SVM classifier is employed as the fitness function. Histological images of osteosarcoma labeled with Hematoxylin and Eosin are included in the publicly accessible dataset used for experiments. The suggested approach has been compared to deep learning models in which feature extraction performed using the EfficientNet-B0 and Xception deep learning models. The model’s performance has been evaluated using an SVM classifier, which yielded an accuracy of 99.54%.
Jeffrey O. Agushaka et al. [39] proposed the Dwarf Mongoose Optimization Algorithm (DMO), a metaheuristic algorithm for solving a diverse range of discrete and multidimensional problems by mimicking the foraging behaviour of mongooses. This algorithm has been considered as a population-based algorithm divided into three distinct groups: the alpha group, the babysitter group, and the scout group. The alpha group search for food, which determines the search path and distance covered. The babysitters chosen from the general population of mongooses; they remain with the babies until the alpha group returns from foraging. As the mongoose never returns to a previously visited sleeping mound, the scout group will undoubtedly engage in exploration as they look for the next one. After the random initialization of the population, the fitness is evaluated. The suggested method has been used to solve 31 benchmark problems and outperforms existing techniques.
Mohammad H. Nadimi-Shahraki et al. [40] proposed a wrapper-based feature selection approach for COVID-19 diagnosis employing a binary Aquila optimizer (AO). This research proposed two variations of the AO algorithm for selecting features: the S-shaped binary Aquila optimizer (S-BAO) and the V-shaped binary Aquila optimizer (V-BAO). The AO algorithm considers each solution as a position vector with real-valued parameters. In S-BAO, a transfer function in the shape of a S is utilized to move solutions around the search space. In V-BAO, a V-shaped transfer function has been used to determine the likelihood of position changes. In both implementations of the AO algorithm, the classification accuracy of K-NN has been employed as the fitness function. The selected features used to train the K-NN classifier that evaluate the model’s performance. A real-time dataset comprising of 864 instances and 15 features, and achieved an accuracy of 96.80% for S-BAO and 96.15% for V-BAO, respectively.
Zenab Elgamal et al. [41] proposed wrapper-based feature selection methods utilizing an IRSA for classifying clinical datasets with the accuracy of the K-NN classifier as a fitness function. Utilizing chaotic maps and a Simulated Annealing (SA) approach, the classification performance of the basic RSA is improved. Initialization of solutions achieved using chaotic maps makes the IRSA converge faster and hence results in diversified solutions. The standard RSA algorithm has been improved by using an SA algorithm which prevents the local optima problem and improves the exploitation of the search space. The proposed approach has been experimented on 20 datasets collected from the MLR maintained by UCI out of which 19 are clinical datasets. The proposed approach performs well when compared with other state-of-the-art optimization algorithms.
Olaide N. Oyelade et al. [42] proposed a bio-inspired population-based optimization algorithm termed the Ebola optimization algorithm (EOA) for handling different complex problems. Individuals’ scalar and vector quantities has been classified as susceptible, infected, recovered, deceased, and vaccinated. Using the fitness value of all susceptible individuals, generate an index case that has been considered as the global and current best. The susceptible individual’s position has been updated so that the shortest displacement optimizes exploration and exploitation, while the infection rate rises with longer displacement. The newly infected people has been created and evaluated as a distinct pool of potential remedies. In order to tackle both discrete and continuous issues, the global best value has been returned as the final solution.
The related research focused primarily on the imputation framework in addition to the feature selection techniques employing a wrapper-based method for selecting the most relevant features and a classification framework. Based on inferences from related work, a CDSS with the benefits of a novel imputation framework utilizing missForest and feature selection using a filter-wrapper technique has been presented in this study. From related works, the following conclusions may be drawn to improve the proposed work: the performance of the classifier improves with the selection of the most relevant features and the treatment of the dataset’s missing values. The Evolutionary algorithms can effectively be used for selecting the most relevant features must be formulated for feature selection for the datasets used in this work.
The outline of our contribution is highlighted below: Using a filter-wrapper method, a CDSS for diagnosing Congenital Heart Failure is proposed. In this work, four of the eight datasets used for experimentation contain missing values, which are imputed by a missForest algorithm. The most relevant features are selected using an FCBF filter approach and the union operation between two wrapper-based approaches for selecting the most relevant features, ASO and HGSO. The selected features are utilized to train the four boosted classifiers namely, AdaBoost, CatBoost, LightGBM, and XGBoost—that evaluate the model’s overall performance.
Materials and methods
The overall system framework includes three subsystems namely, Data Pre-processing, Feature Selection, and Classification. The outline of the system framework is presented in Fig. 1.

System framework.
The presence of missing and irrelevant values affects the overall performance of the classifier. The data pre-processing subsystem handles the dataset’s missing values, hence enhancing performance. Four of the eight datasets on cardiovascular disease include missing values and these datasets were collected from MLR maintained by UCI. Table 2 presents an overview of the experimental datasets.
The datasets used for experimentation
The datasets used for experimentation
In the HFCD, the Death event class label has been replaced by Critical and Not-Critical, with 1 indicating critical and 0 indicating not critical. Each dataset’s missing values are imputed using a missForest algorithm employing an RF approach. In section 4.2, an overview of missing value imputation for datasets using missForest is presented.
The percentage of missing data in a dataset directly affects the inferences that may be drawn statistically and visually. In order to get the percentage of missing data for each attribute, divide the number of missing data points for that attribute by the total number of instances in this dataset multiplied by 100 as presented in Equation (1).
The missForest imputation approach is a non-parametric method that uses a Random Forest (RF) for filling the missing values in a dataset [44]. The initial step in the missForest is to impute the missing values using the Mean operation and then the model RF is fit to the observed data in the dataset for predicting the missing values and this iterative process repeats until the stopping criteria are met [45]. The missing values present in the clinical dataset are imputed with the mean operation and for each observed value present the RF model is fit for predicting the missing values and iterations continue until some stopping criteria are met or after a certain number of iterations has elapsed. The parameters for the missForest algorithm are outlined in Table 3:
Parameters used for missForest algorithm for imputation
Parameters used for missForest algorithm for imputation
The outline for the missForest algorithm is presented in section 4.3.1.
Feature selection subsystem
The most important features for the classifier model are selected by the feature selection subsystem. Combining a Filter-Wrapper based approach with a FCBF as the filter approach and the union of two wrapper-based algorithms, namely ASO and HGSO, with accuracy, G-mean, and MCC measured by the SVM as the fitness function is used to select features. The overall performance of the classifier is improved by selecting the feature subset using two criteria: the highest accuracy and the minimum feature size.
The wrapper algorithm uses the fitness function to determine which solution is the most relevant, and this feature subset is the optimal solution. For this research, the SVM was used as the fitness function to evaluate several wrapper-based feature selection methods with respect to their accuracy, G-mean, and MCC.
Feature selection using filter-based approach
Filter-based feature selection operates by assigning each feature in the dataset a score based on how relevant it is to the problem at hand, and then ranking those features in order of their score. Features with low relevance scores are discarded when a statistical measure is applied to the pair of input features and the class label to determine their correlation.
Fast correlation based filter approach (FCBF)
A multivariate algorithm with phases, FCBF filters data based on feature correlation relative to a metric called Symmetric Uncertainty (SU), which is basically an improved version of the Information Gain (IG) whose values fall within the interval [0, 1]. Using the FCBF approach, in which the correlation between any features and the class label is sorted in order, the Symmetric Uncertainty may be estimated to minimize the bias influence of features and, in turn, quantify the effectiveness of each feature in the dataset [46]. FCBF’s primary strategy is split in two parts: the first is the relevance analysis, and the second is the redundancy analysis. Correlation analysis is then used to determine how important each remaining feature is after the irrelevant ones have been filtered out. The parameters for the FCBF algorithm is outlined in Table 4.
Parameters used for FCBF algorithm
Parameters used for FCBF algorithm
In the redundancy analysis, the Symmetric Uncertainty correlation between the individual features is calculated based on a Markov Blanket Concept in which for two relevant features Fi and Fj, based on the condition of SUj,i≥SUi,c the elimination of one feature is done. The subset of relevant features is represented as Fs and each of the features is highly correlated with the Class label Cs with respect to SU≥ts. The equation for the evaluation of Symmetric Uncertainty is presented in Equation (2).
The Information Gain (IG) for each feature with respect to the class label is presented in Equation (3).
The uncertainty of a particular variable is calculated using Entropy as the evaluation parameter which is calculated as per the equation presented in Equation (4) & Equation (5).
Given two features F i and F j (i ≠ j) so that SUj,i ≥ SUi,c then F j forms an approximate Markov blanket for F i iff SU(F i , F j ) ≥ SU(X i , Y). The relevance score for each feature is calculated using Equation (6).
The steps in the Fast Correlation Based Filter (FCBF) are presented in Section 5.3.1.
Feature selection subsystem using wrapper-based approach
The union of two wrapper-based algorithms namely ASO, and HGSO with the combination of accuracy, G-mean, and MCC measured by the SVM classifier as the fitness function is used for selecting the most relevant features. The section 5.3.1 presents the outline of ASO algorithm in detail.
Atom search optimization algorithm (ASO)
The ASO algorithm mimics the core assumptions of atomic and molecular dynamics, modelling their fundamental properties such the force between atoms, the geometric force between them, and the potential function between them. The population of solutions in this method is referred to as atoms, and each atom has two crucial properties: its position and its velocity [47]. The inter-atomic distance varies within a certain range because of the atoms’ repulsion feature. As an example, to utilize ASO for feature selection, two constraints are represented adequately: the representation of the atom particles and the definition of the fitness function. A “1” signifies that the corresponding feature has been chosen, whereas a “0” indicates that it has not. Table 5 presents the ASO’s parameter settings.
Parameters for ASO for feature selection
Parameters for ASO for feature selection
Like all the other metaheuristic algorithm the ASO also randomly initialize the population of atoms. The atoms are considered as the solutions which consist of two main vectors namely position and velocity. The acceleration of the atom inside a particle is presented in Equation (7):
The attraction force of atoms is always in a positive direction and the repulsion property always tends in a negative direction which results in the atoms converging in a specific position. Equation (8) is modified based on the depth function which adjusts the attraction and the repulsion properties of the atoms presented in Equation (10):
The drift function enhances the algorithm to traverse from exploration to the exploitation phase which is presented in Equation (14).
The number of best atoms based on the fitness function is grouped and this enhances the process of exploration and exploitation. The higher number of K makes the atoms do the process of exploration and the lower value for K does the exploitation process which in turn results in the best solution or the best feature subset.
The Support Vector Machine (SVM) classifier evaluates each feature based on the combination of the fitness function by taking the square root of accuracy, G-mean, and MCC of the SVM as the fitness function.
Steps for Feature Selection using ASO Algorithm
The ASO algorithm mimics and mathematically models the atomic motion model in nature, which deals with the interaction force between the atoms and constraint forces between them. The distance between two atoms is calculated using the Euclidean Distance metric in the original algorithm whereas in this work the Mahalanobis distance metric is used to calculate the distance between two atoms. The Mahalanobis distance metric has the advantage of evaluating the mean and variance of each attribute in the dataset and it avoids the problems of scaling and correlation in the Euclidean distance. The usage of Mahalanobis distance finds the distance between two data points in the multivariate space and is presented in Equation (20):
The Outline of Feature Selection Using the ASO algorithm is presented in Fig. 2:
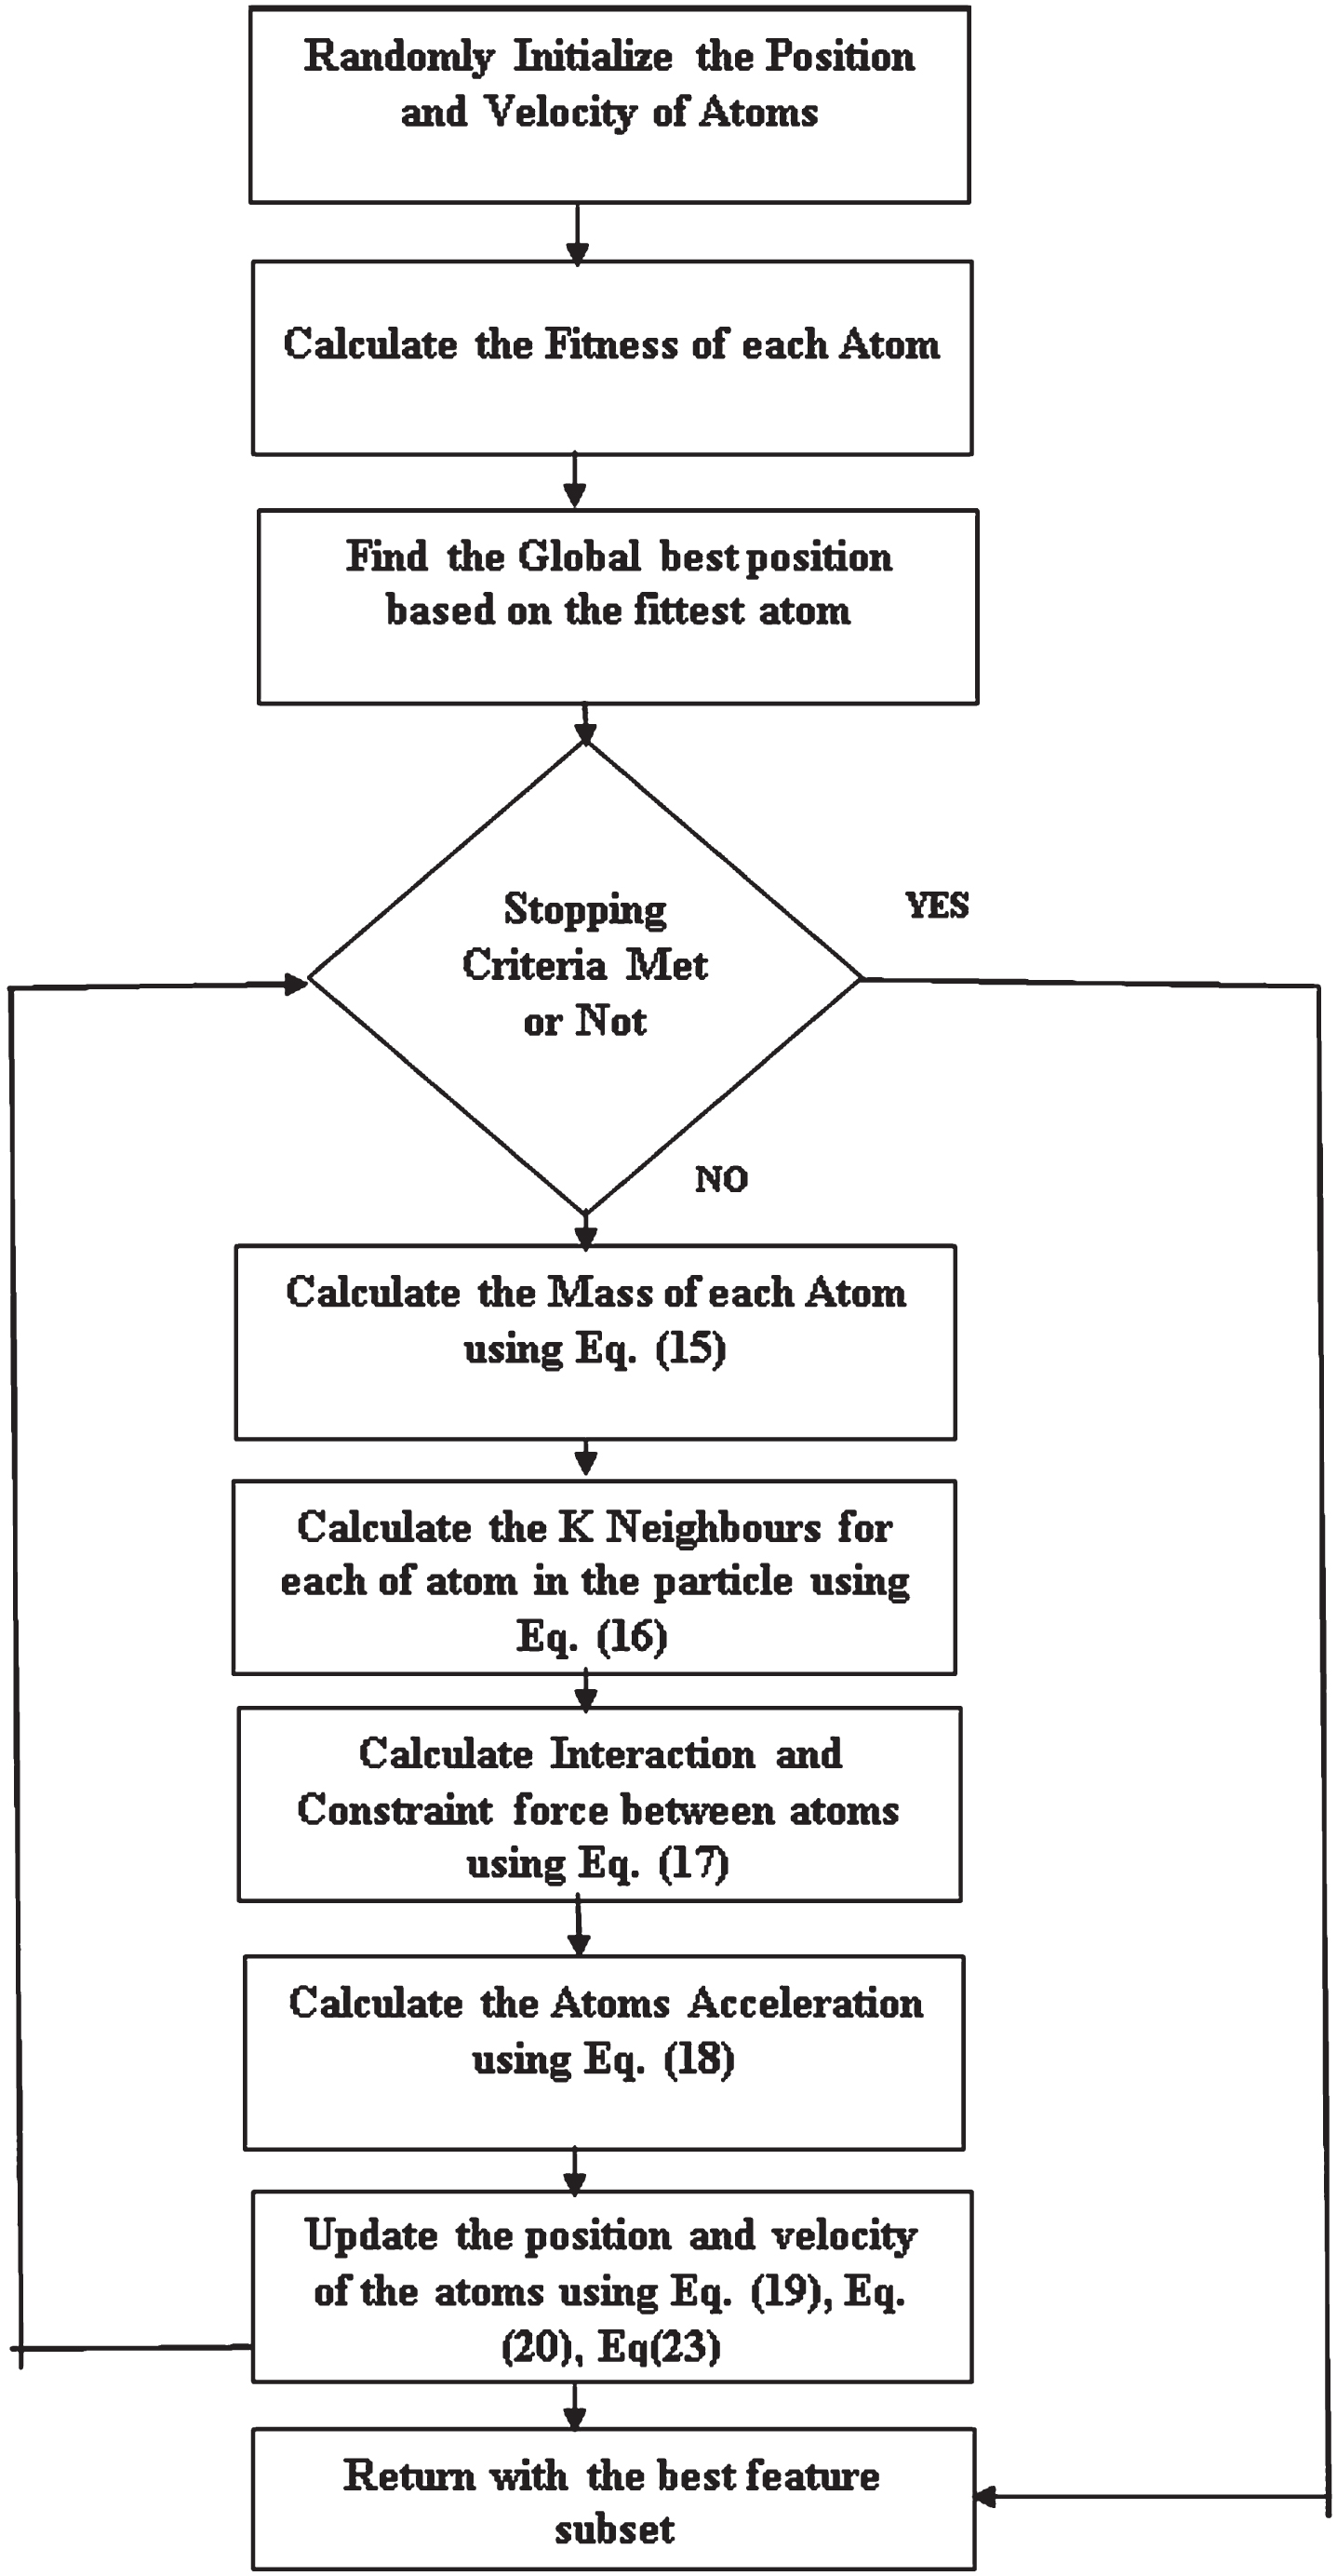
The Outline of Feature Selection Using ASO algorithm.
Henry’s Law states that “at a fixed temperature, the amount of a given gas that dissolves in a given kind and volume of liquid is directly proportional to the partial pressure of that gas in equilibrium with that liquid,” and this is the basis for HGSO, a physics-based population algorithm. HGSO maintains a collection of potential solutions as gas particles that can be combined with a liquid [48]. In the phase of exploration and exploitation, the properties of these particles are modified to locate the best possible solutions in the search space. Table 6 presents the HGSO’s feature-selection settings.
Parameters for HGSO for feature selection
Parameters for HGSO for feature selection
According to this law, the solubility of a gas (Sg) is directly proportional to the partial pressure of the gas (Pg) which is calculated in Equation (21):
The exploration methodology seeks new solutions across the search space to avoid becoming stuck on local optima and is presented in Equation (27).
As with other metaheuristic algorithms, the HGSO algorithm begins by an initial set of candidate solutions, then modifies existing solutions, and evaluates overall fitness before selecting the most efficient solution. The Outline of Feature Selection using the HGSO algorithm is presented in Fig. 3:

Outline of Feature Selection Using the HGSO Algorithm.
Steps for Feature Selection using HGSO
A union operation between the wrapper-based bio-inspired algorithms known as ASO and HGSO is used to select the features that are the most relevant to the problem at hand. The selected features are used to train four boosted classifiers namely, AdaBoost, XGBoost, CatBoost, and LightGBM. The dataset is divided into two sets: the training set, which is used to train the classifier, and the testing set, which is used to evaluate the performance of the classifier.
The performance of the classifier is influenced by a wide range of factors, including imputation of missing values, the detection and removal of outlier values, feature engineering to select the most relevant features for the classifier while avoiding the irrelevant features present in the dataset, tuning the hyperparameters, applying a variety of classification models, using an ensemble approach, and many more.
Based on these factors, the datasets in this work contain missing values, and rather than removing these missing values, the missForest imputation method is presented to impute the missing values present in the dataset. The presence of irrelevant features in the dataset is dealt with by a Filter-Wrapper based feature selection approach utilizing an FCBF as the filter approach and the union of two algorithms namely ASO, and HGSO with the fitness function as the combination of accuracy, G-mean, and MCC measured by the SVM classifier.
The proposed approach is evaluated using four boosted classifiers, XGBoost, AdaBoost, CatBoost, and LightGBM, and achieves superior classification performance compared to other classifiers.
AdaBoost classifier
The iterative ensemble approach combines multiple weak performing classifiers, thereby improving the classifiers’ overall accuracy. By merging the weak classifiers, AdaBoost creates a robust classifier with a higher accuracy performance score. The AdaBoost classifier generates the weights of the classifier and trains the data samples with each iteration, ensuring accurate predictions for unseen data samples [49].
The two properties of AdaBoost make it more reliable when compared with the other classifiers, as it should be trained on various weighted training data, and for each iteration, the training error is minimized. All the observations in the dataset are given equal weights and a model is built on the subset of the data sample. This model is used for the classification of the dataset and the errors are calculated by comparing with the classifications made and the actual sample data. The training weights are updated giving more weight to incorrectly predicted instances, and less weight to correctly predicted instances. In the AdaBoost classifier, the overfitting condition is handled by a parameter n_estimators and finds a point where the model begins to overfit. This point is passed and the algorithm is executed again. The entire process is iterated until there is no change found in the error function or with the number of estimators reached. The outline of the AdaBoost classifier is presented in section 6.1.1. Table 7 outlines the parameters used for AdaBoost classifier in this research.
Parameters for AdaBoost classifier
Parameters for AdaBoost classifier
XGBoost is a gradient boosting method that creates the models in the form of a classifier which uses an ensemble approach in which the newer models are created based on the previous model errors. The newer models are created that compute the error in the previous model and then leftover is added to make the final prediction [49]. Based on the similarity score the decision trees are created in the XGBoost classifier. The similarity score is calculated using Equation (30).
Where Hessian is equal to the number of residuals; Gradient2 is the squared sum of residuals; λ is a regularization hyperparameter.
The features in the dataset are the conditional node or internal node in tree algorithms, and the splitting of trees into branches or edges is predicated on the root node. A node is considered a leaf node if there are no more edges and the best solution is found by splitting the node. Additionally, XGBoost applies decision-tree algorithms to a given dataset and classifies the data based on their results. XGBoost is predicated on gradient-boosted trees with supervised learning as the primary approach. In section 6.2.1, an overview of the XGBoost classifier is presented. Table 8 outlines the parameters used for XGBoost classifier in this research.
Parameters for XGBoost classifier
Where
CatBoost is a machine learning technique that incorporates the implementation of ordered boosting and a novel approach for dealing with categorical information. It is a Gradient Boosting-based decision tree that handles categorical and ordered features. The permutation operation is the primary highlight of the CatBoost classifier, which ranks the created model’s features using a LFC [51]. Loss Function Change computes the change in prediction when a feature’s related value changes. During model training, a series of DT are sequentially generated to yield trees with decreasing loss. In other words, each DT learns from the preceding tree and influences the subsequent tree to improve model performance, hence constructing a robust learner.
After running several boosting stages, the Ordered Boosting mechanism of the CatBoost algorithm helps to develop a prediction model. This method generates a prediction shift in the created model, which leads to a unique type of target leakage issue. By employing the ordered boosting framework, the CatBoost algorithm overcomes the mentioned challenges. Moreover, in contrast to typical learning classifiers, the CatBoost method solves the overfitting problem by employing several permutations of the training dataset. This is the principal cause for employing its intelligence in the present research work. Before constructing new trees, the CatBoost classifier verifies the number of iterations, and the classifier is deemed overfitted if the number of iterations exceeds the value set in the training parameters. The outline of the CatBoost classifier is presented in section 6.3.1. Table 9 outlines the parameters used for CatBoost classifier in this research.
Parameters for CatBoost classifier
Parameters for CatBoost classifier
A gradient boosting framework that uses the concept of decision tree algorithms introduced by Microsoft is LightGBM. The LightGBM classifier is based on DT and less complex with the property that the decision tree used grows in a leaf-wise manner and optimization is performed for the losses which generate branches. The leaf-wise growth strategy is adopted by the decision trees in this LightGBM classifier as it optimizes the loss generated by the branches. The histogram algorithm is used in this LightGBM which discretizes the features present in the data into K small bins as these bins are used to construct the histogram with width k. The histogram will collect the statistics required which are the gradients and number of samples in each bin. The main aim of the LightGBM classifier is to find the leaf node with a larger split gain by using a leaf-wise traversal [51].
In the LightGBM classifier, the controlling parameter used is early_stopping_rounds which controls whether the model is overfitting or not. The outline of the LightGBM classifier is presented in section 6.4. 1. Table 10 outlines the parameters used for XGBoost classifier in this research.
Parameters for LightGBM classifier
Parameters for LightGBM classifier
This section discusses the results of integrating a Filter-Wrapper technique with the FCBF, the union operation for two bio-inspired algorithms utilized for the feature, and the reduced feature subset used to train four boosted classifiers. The overall performance of datasets with feature selection is compared with the performance of four boosted classifiers: RF, CART, SVM and K-NN. The fitness function used for two wrapper-based bioinspired algorithms namely ASO, and HGSO with the combination of accuracy, G-mean, and MCC measured by the SVM and is presented in Equation (40), Equation (41), Equation (42), and Equation (43).
Four clinical datasets out of the eight datasets employed for experimentation have missing values, and the missingness % for the four clinical datasets is depicted in Fig. 4.
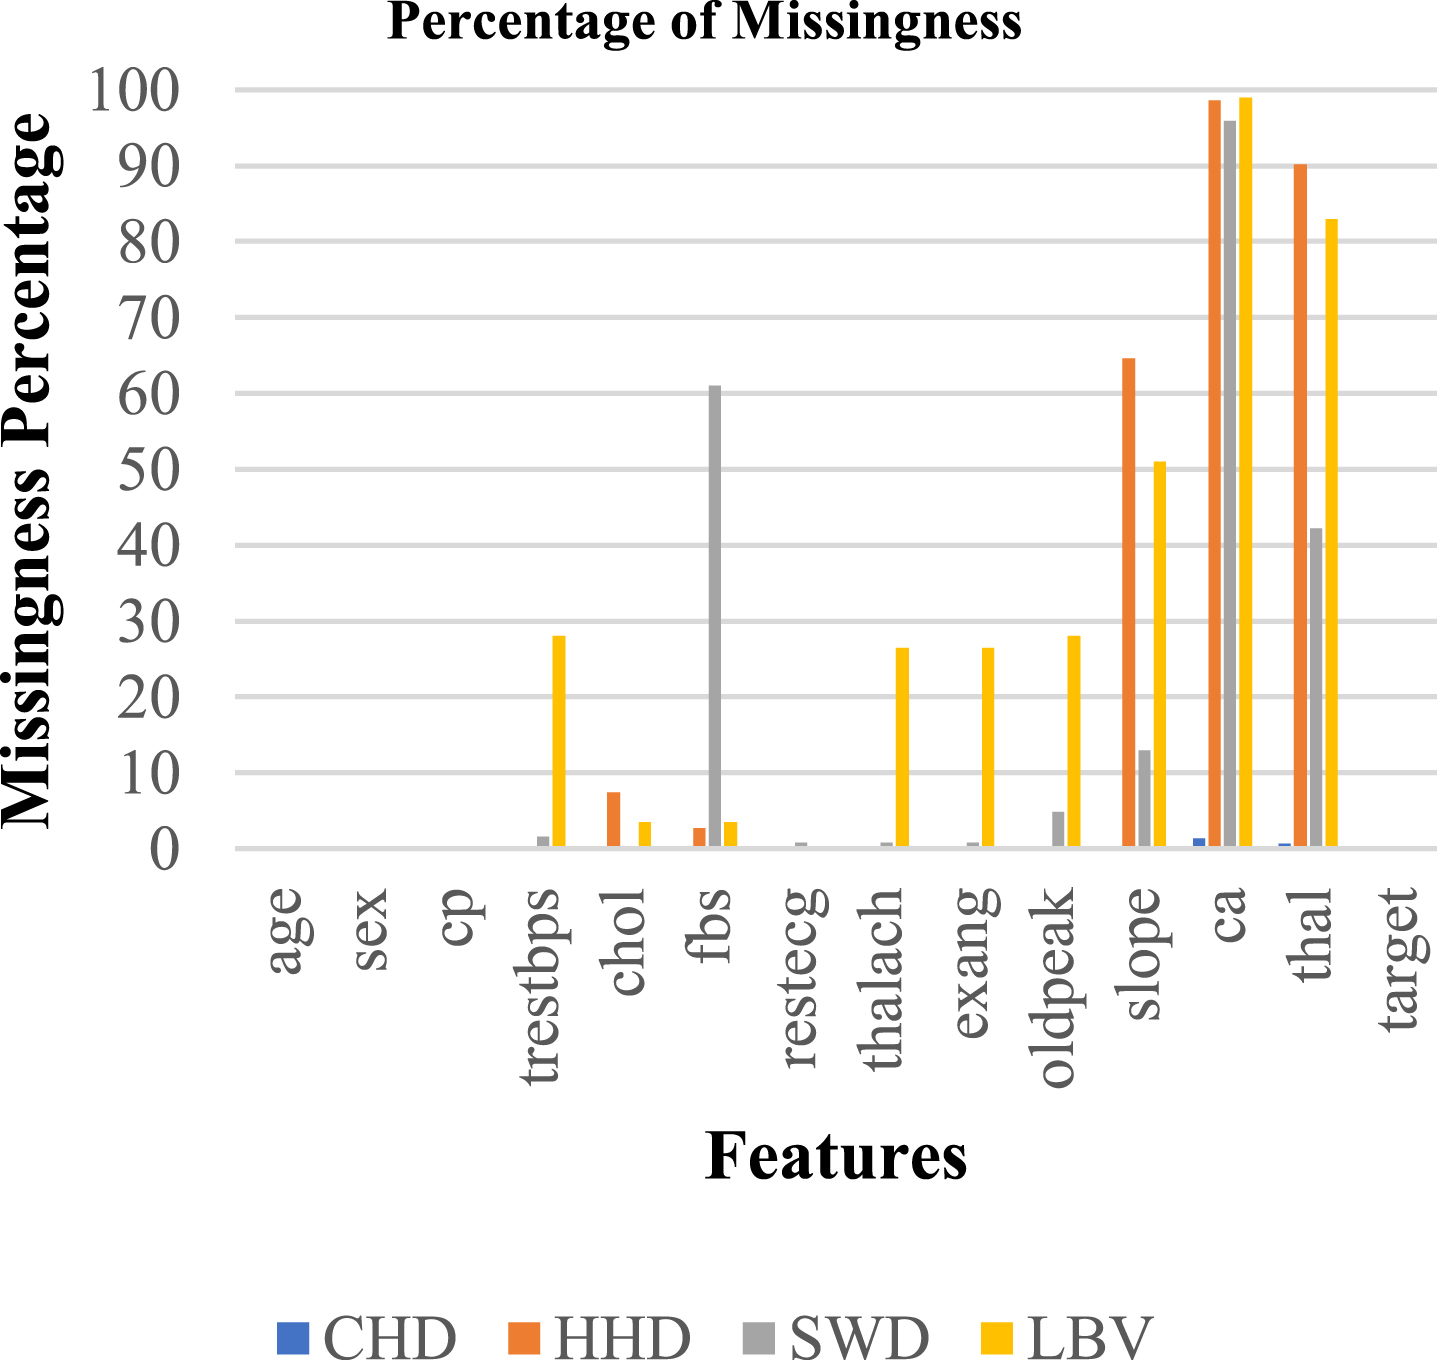
Percentage of missingness in clinical dataset.
The Cleveland dataset on heart disease has 303 cases with 14 features and 6 missing values. The Hungarian Heart Disease dataset consists of 294 cases with 14 features, with a total of 779 missing values. The Switzerland Heart Disease dataset consists of 123 cases with 14 features and a total of 274 missing values. The Long Beach Va dataset consists of 200 instances with 14 features and 698 missing values in total. Figure 4 outlines the percentage of missingness present in each dataset use din this research.
Tables 11 12 give the performance metric of the two wrapper-based algorithms with the fitness function of the combination accuracy, G-mean, and MCC measured by the SVM classifier.
Evaluation using fitness function measured by SVM classifier (ASO)
Evaluation using fitness function measured by SVM classifier (ASO)
Evaluation using fitness function measured by SVM classifier (HGSO)
The evaluation metrics employed include accuracy, sensitivity, specificity, precision, and recall, and the fitness of the ASO method as measured by the SVM classifier is generated. The graphical representation of the performance evaluation using the fitness function is presented in Fig. 5.
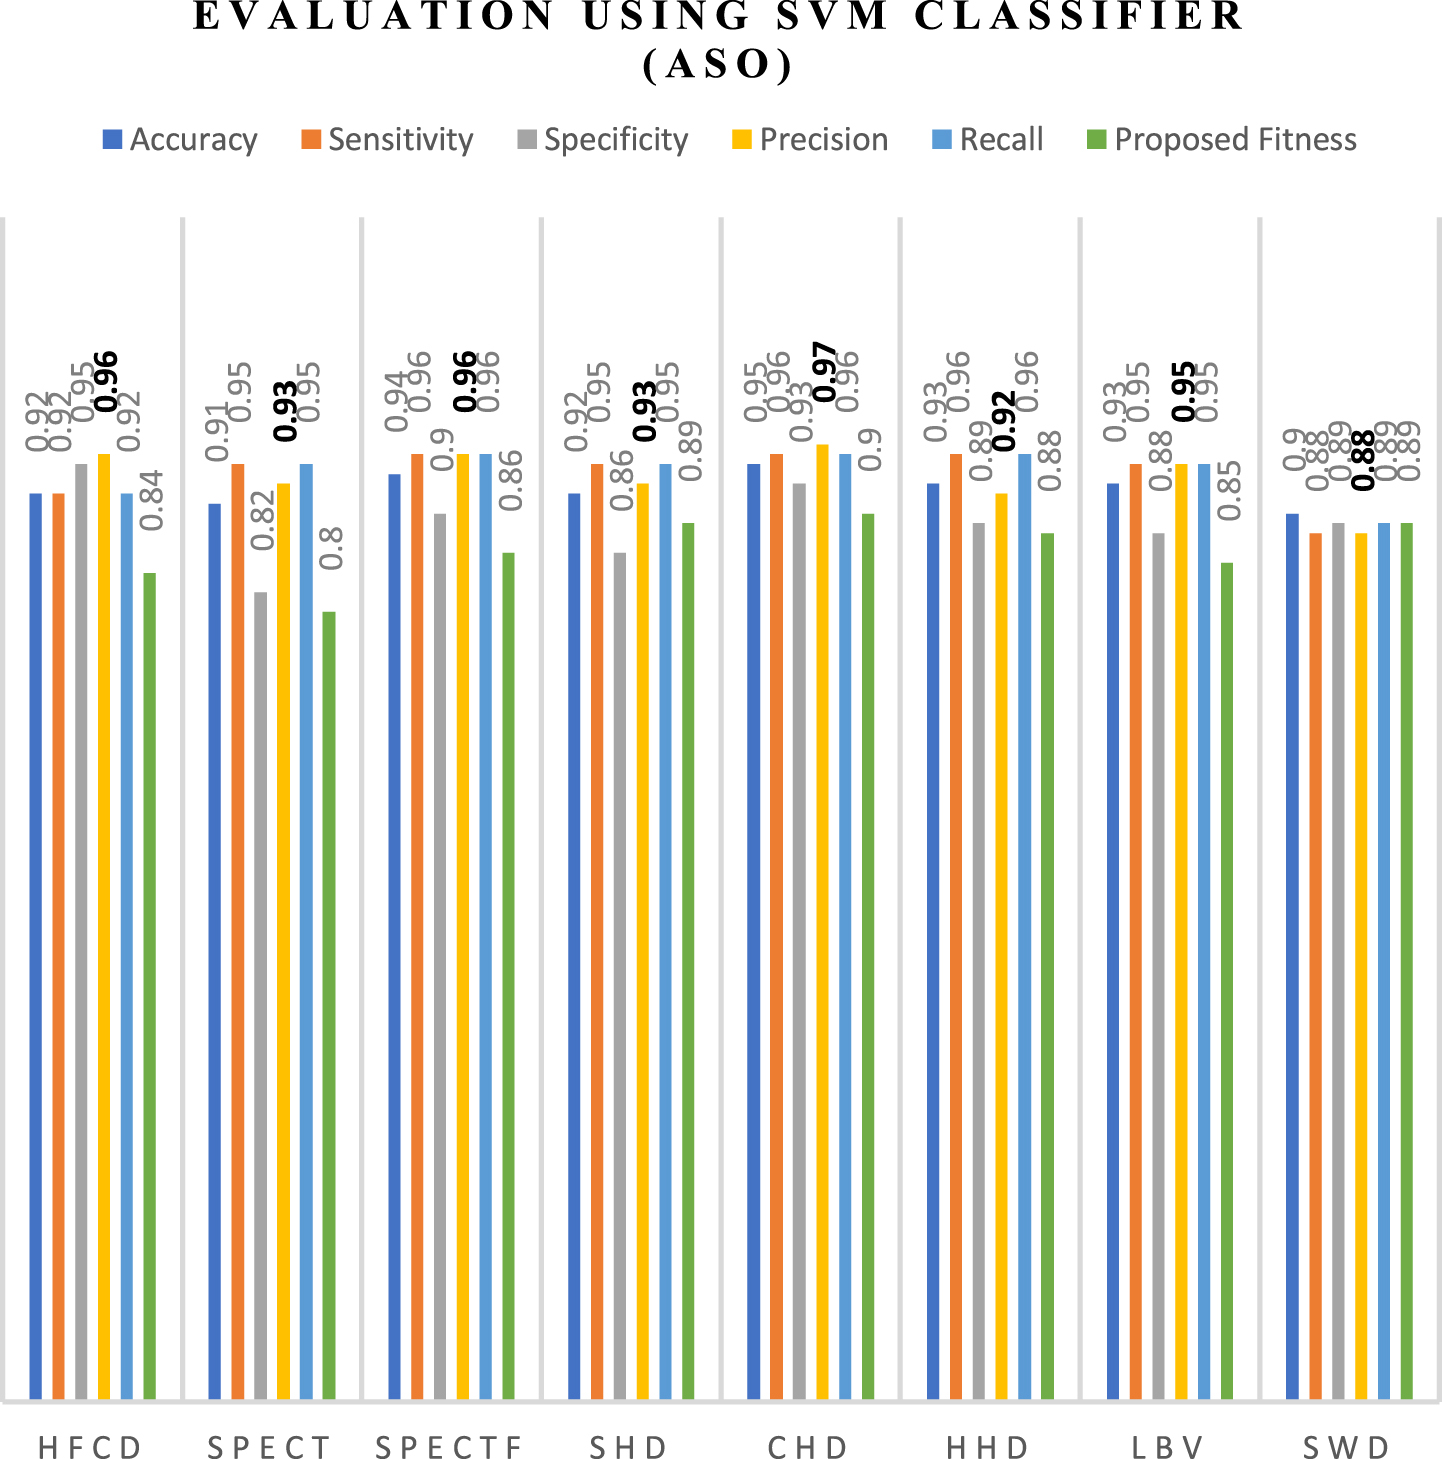
Evaluation Using Fitness Function Measured by SVM Classifier (ASO).
From the graph in Fig. 5, it can be inferred that the heart disease dataset performs well in terms of accuracy, sensitivity, specificity, precision, recall, and proposed fitness with respect to the ASO algorithm and the fitness function.
The performance metrics employed include accuracy, sensitivity, specificity, precision, and recall, and the SVM classifier’s fitness is determined for the HGSO. The graphical representation of the performance evaluation using the fitness function is presented in Fig. 6.

Evaluation Using Fitness Function Measured by SVM Classifier (HGSO).
From the graph in Fig. 6, it can be inferred that the heart disease dataset performs well with respect to the HGSO algorithm and the fitness function in terms of accuracy, sensitivity, specificity, precision, recall, and the proposed fitness.
The union operation is performed between both wrapper approaches, and the most relevant features are chosen. XGBoost, Adaboost, Catboost, and LightGBM are trained using the selected features. Following is a summary of the overall performance of feature selection with four classifiers:
The overall performance evaluation using the XGBoost classifier based on accuracy, sensitivity, F1-score, precision, and recall is presented in Table 13. The Graphical plot for Table 13 is shown in Fig. 7. From the graphical plot it is inferred that with respect to the XGBoost classifier along with the proposed feature selection approach the datasets used for experimentation perform well in terms of accuracy, precision, recall, and F1-Score.
Performance evaluation using XGBoost classifier
Performance evaluation using XGBoost classifier

Performance Evaluation using XGBoost Classifier.
The overall performance evaluation using the AdaBoost classifier based on accuracy, sensitivity, F1-score, precision, and recall is presented in Table 14. The Graphical plot for Table 14 is shown in Fig. 8. From the graphical plot it is inferred that with respect to the XGBoost classifier along with the proposed feature selection approach the datasets used for experimentation perform well in terms of accuracy, precision, recall, and F1-Score.
Performance evaluation using AdaBoost classifier
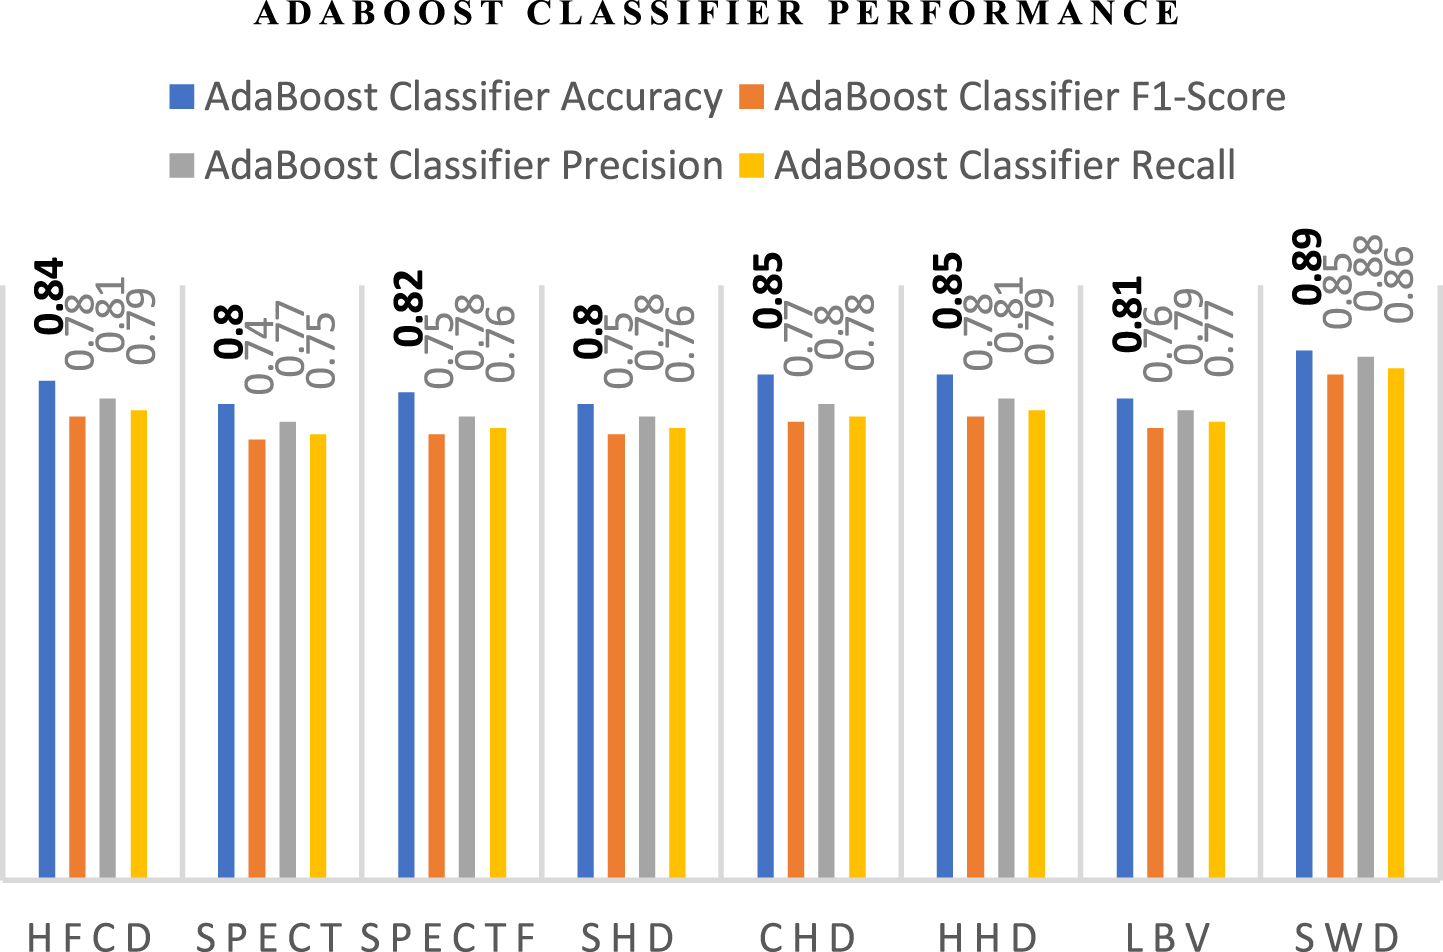
Performance Evaluation using AdaBoost Classifier.
The overall performance evaluation using the CatBoost classifier based on accuracy, sensitivity, F1-score, precision, and recall is presented in Table 15. The Graphical plot for Table 15 is shown in Fig. 9. From the graphical plot in Fig. 9 it is inferred that with respect to the AdaBoost classifier along with the proposed feature selection approach the datasets used for experimentation perform well in terms of accuracy, precision, recall, and F1-Score.
Performance evaluation using CatBoost classifier
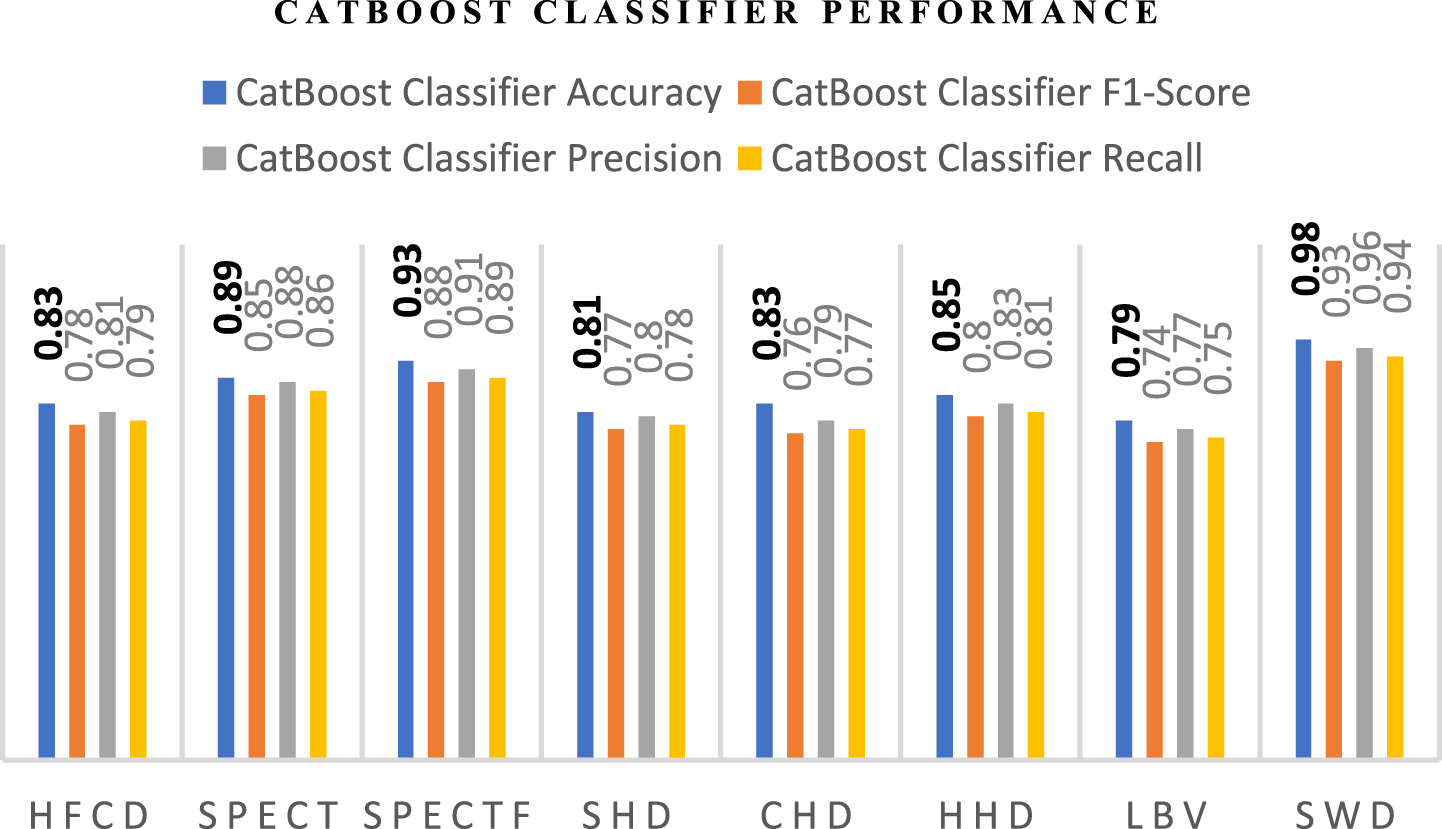
Performance Evaluation using CatBoost Classifier.
The overall performance evaluation using the LightGBM classifier based on accuracy, sensitivity, F1-score, precision, and recall is presented in Table 16. The Graphical plot for Table 16 is shown in Fig. 10. From the graphical plot in Fig. 10 it is inferred that with respect to the LightGBM classifier along with the proposed feature selection approach the datasets used for experimentation perform well in terms of accuracy, precision, recall, and F1-Score.
Performance Evaluation using LightGBM Classifier

Performance Evaluation using LightGBM Classifier.
The confusion matrix is the metric used to evaluate the performance of classification algorithms. Figures 11–14 presents the confusion matrix for the best-performing classifier in this research. Presented here are the four boosted classifiers that performed better in terms of accuracy when applied to the SWD dataset.

Confusion Matrix for XGBoost Classifier.
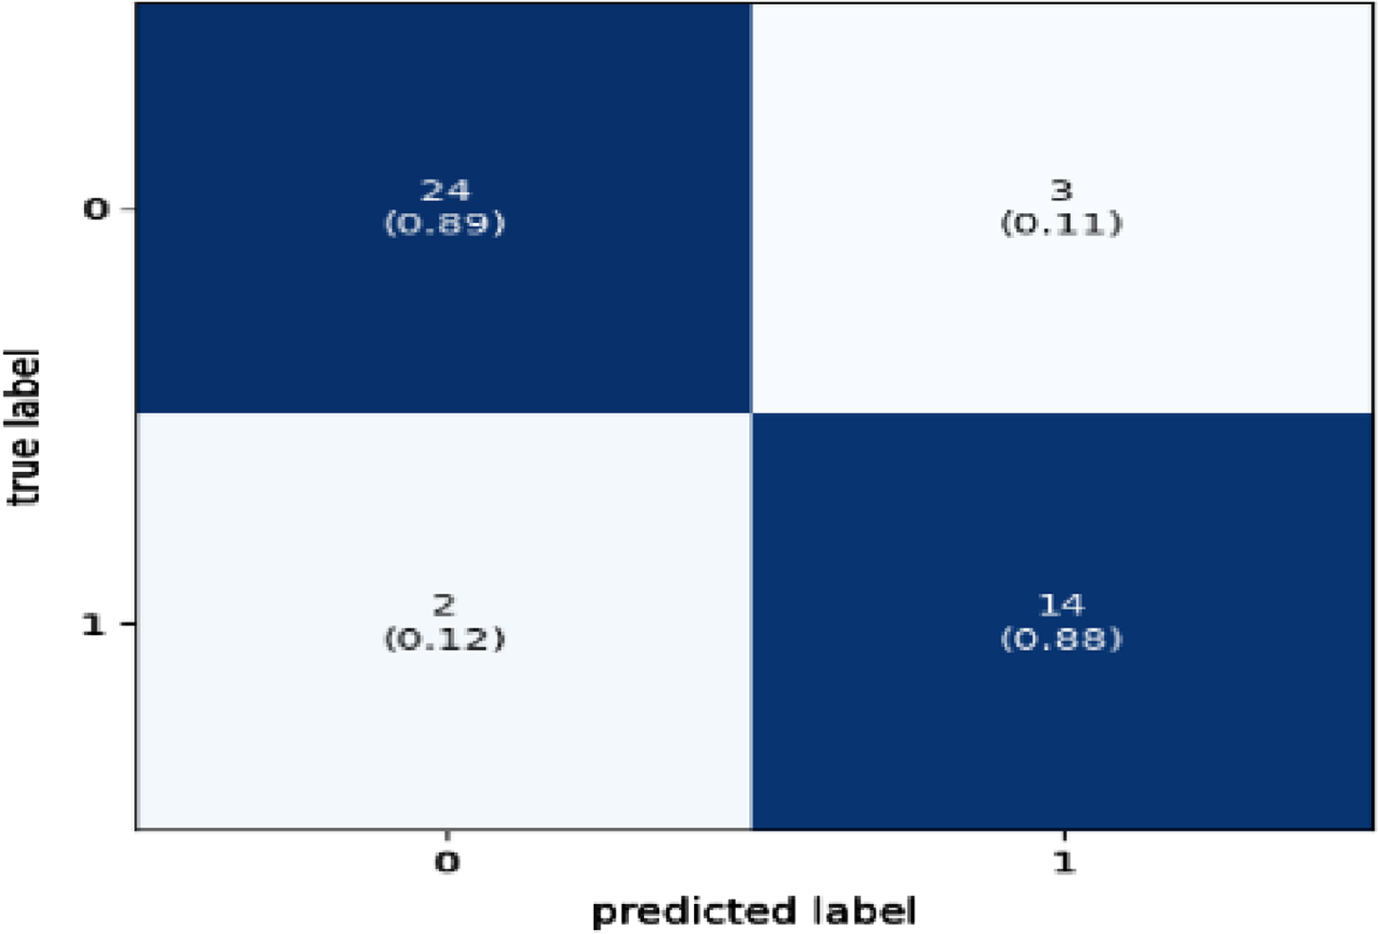
Confusion Matrix for AdaBoost Classifier.
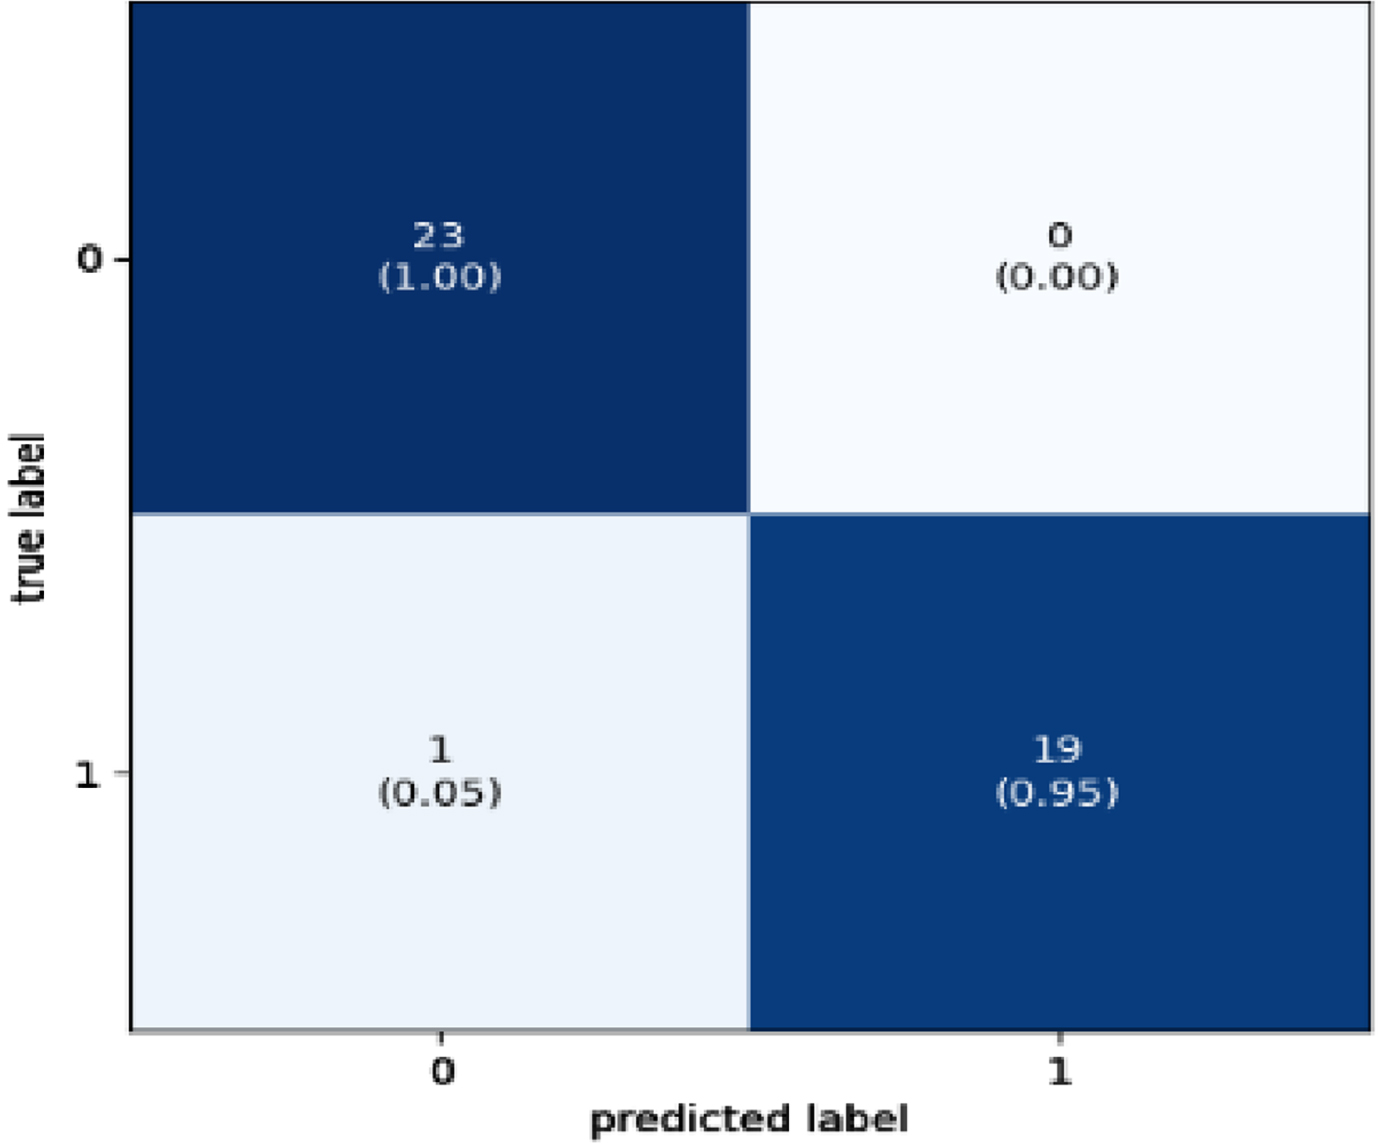
Confusion Matrix for XGBoost Classifier.
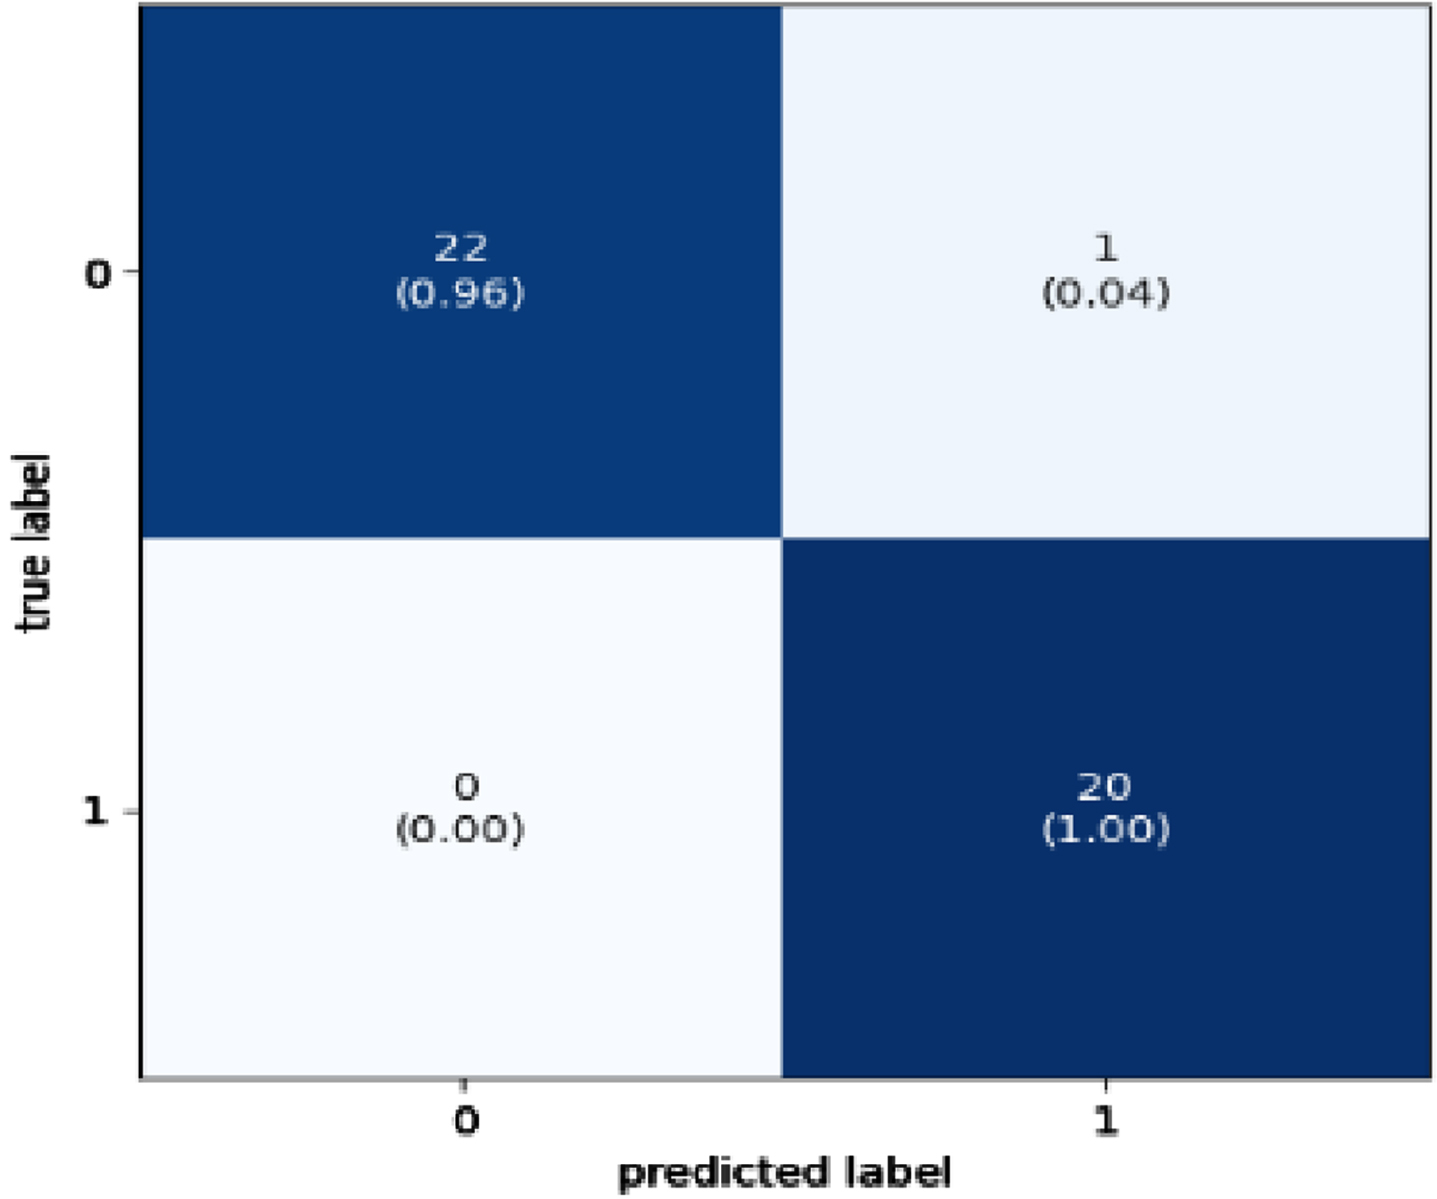
Confusion Matrix for XGBoost Classifier.
The misclassification rate measures the proportion of inaccurate predictions generated by the model. The misclassification rate for each dataset utilizing four boosted classifiers is displayed in Table 14 and calculated using Equation (51):
The relation between misclassification rate and accuracy is presented as Accuracy = 1- misclassification rate. The misclassification rate is presented in Table 17 for four boosted classifiers:
Misclassification rate for the classifiers
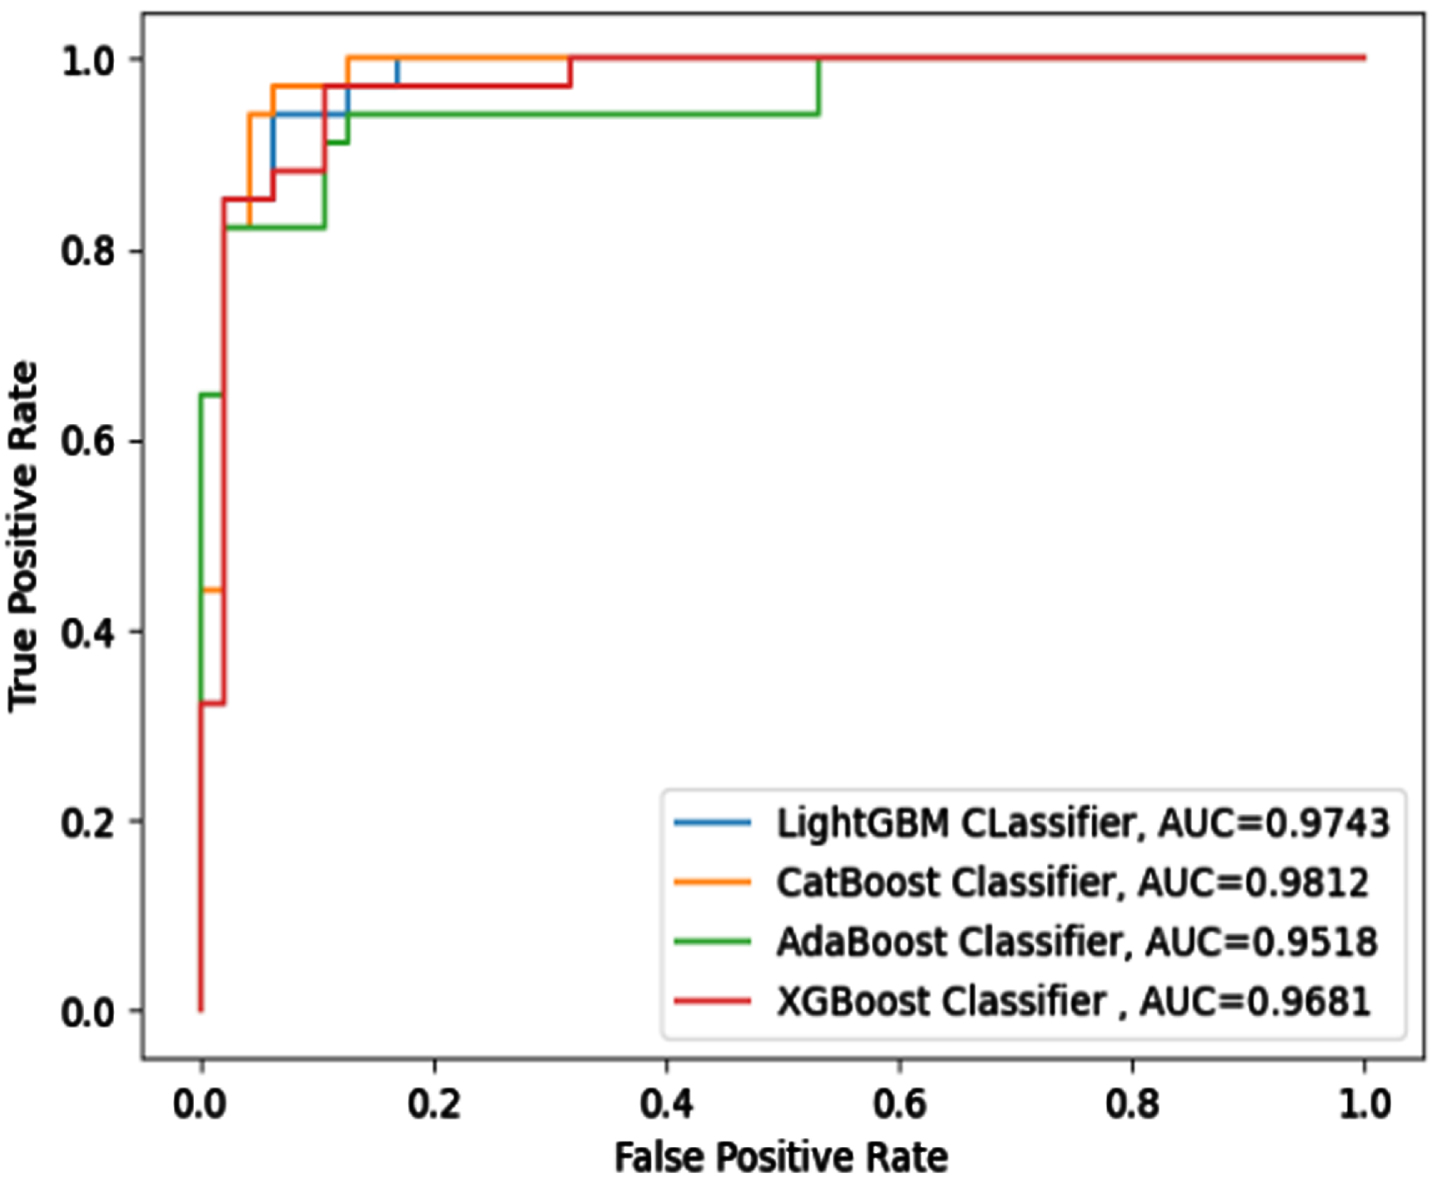
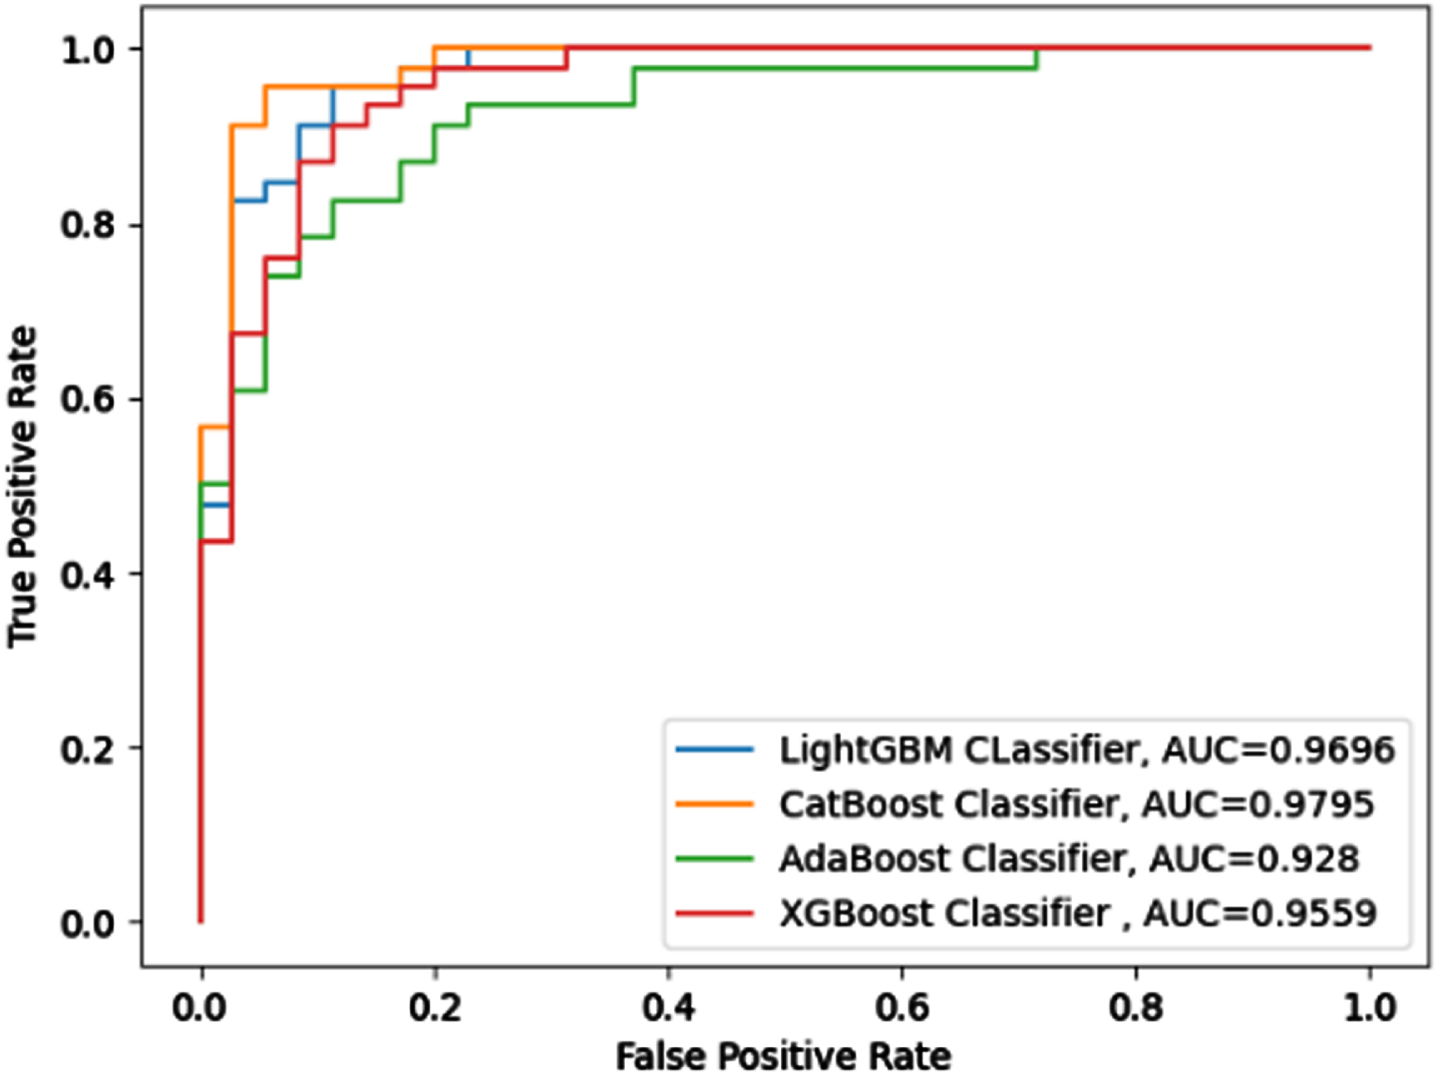
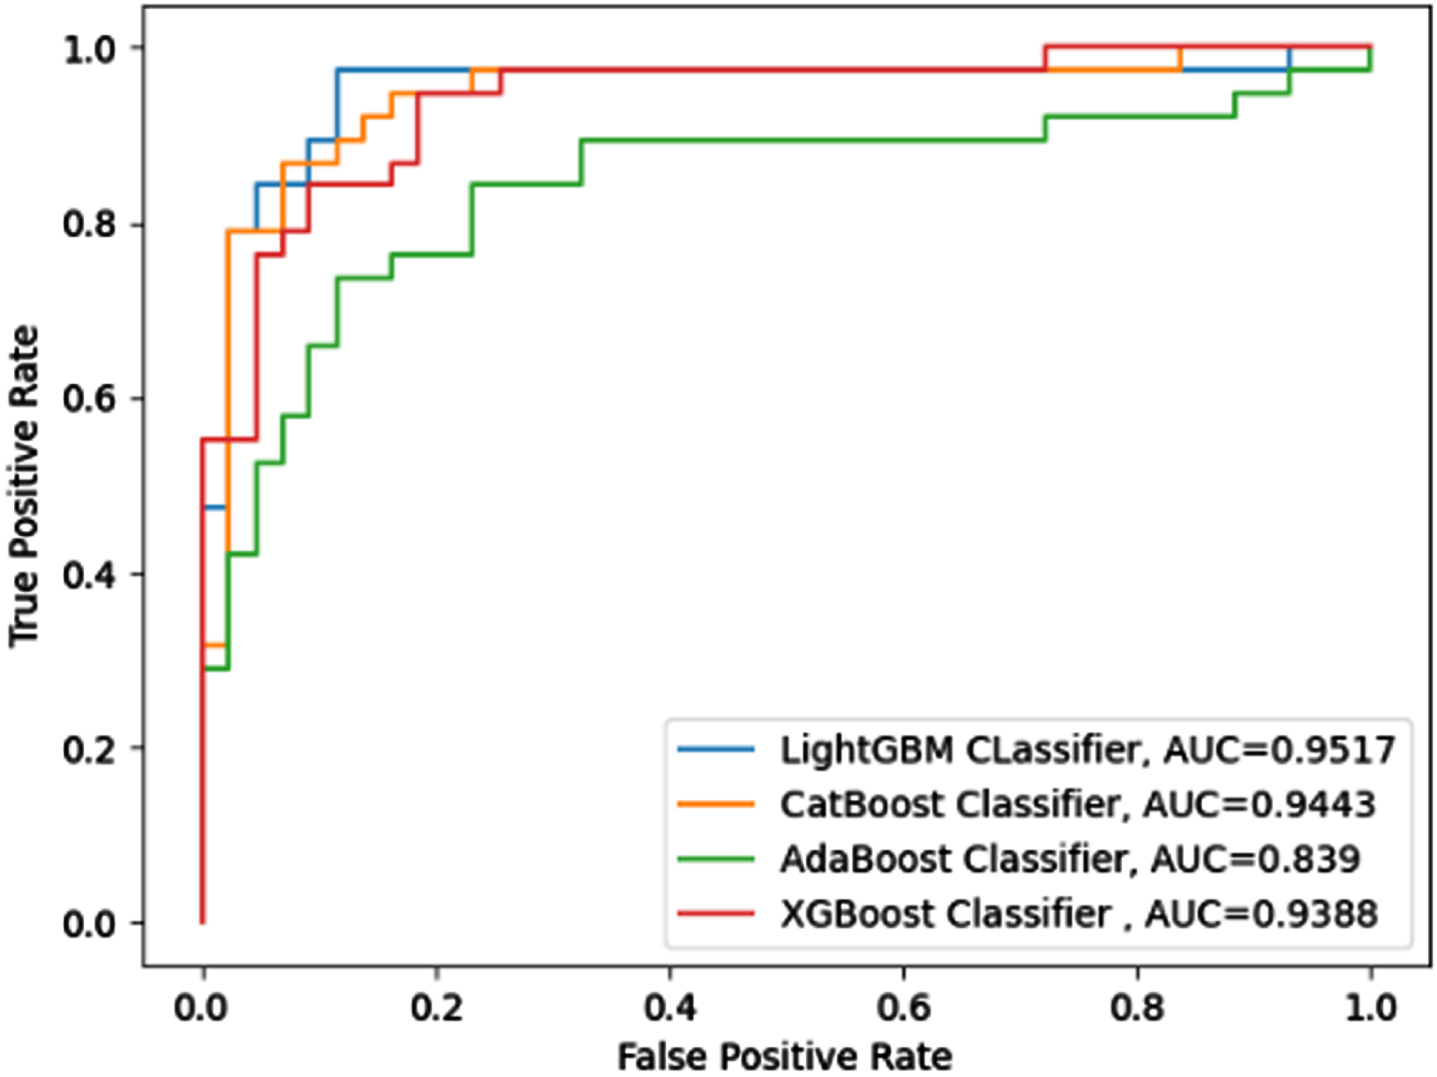
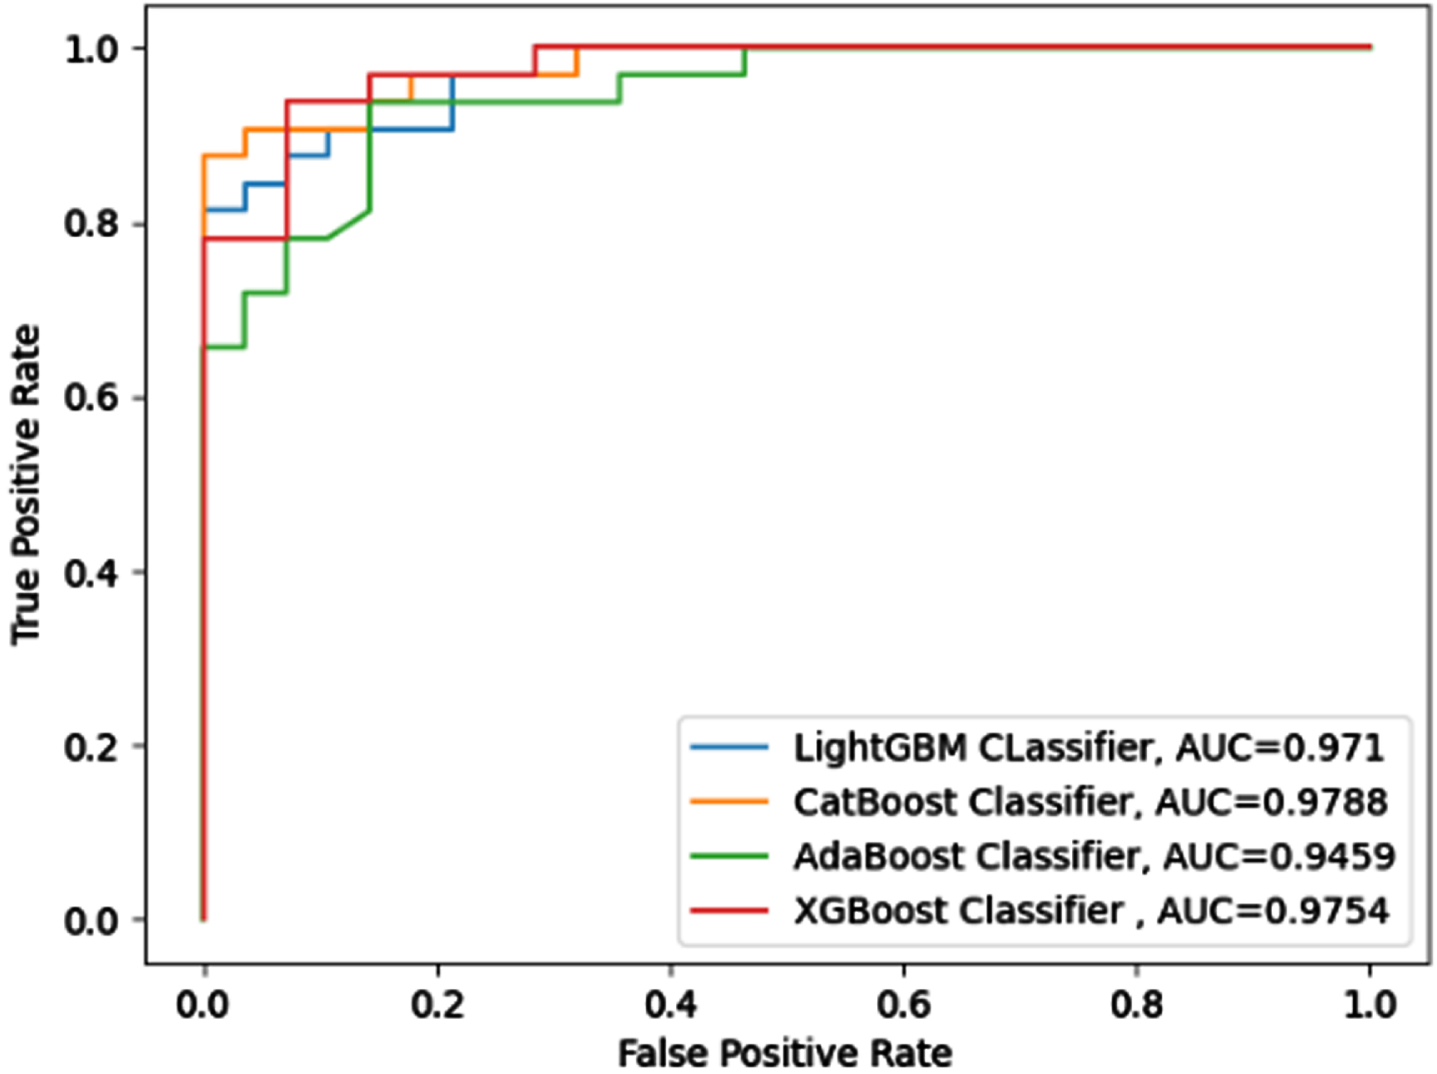
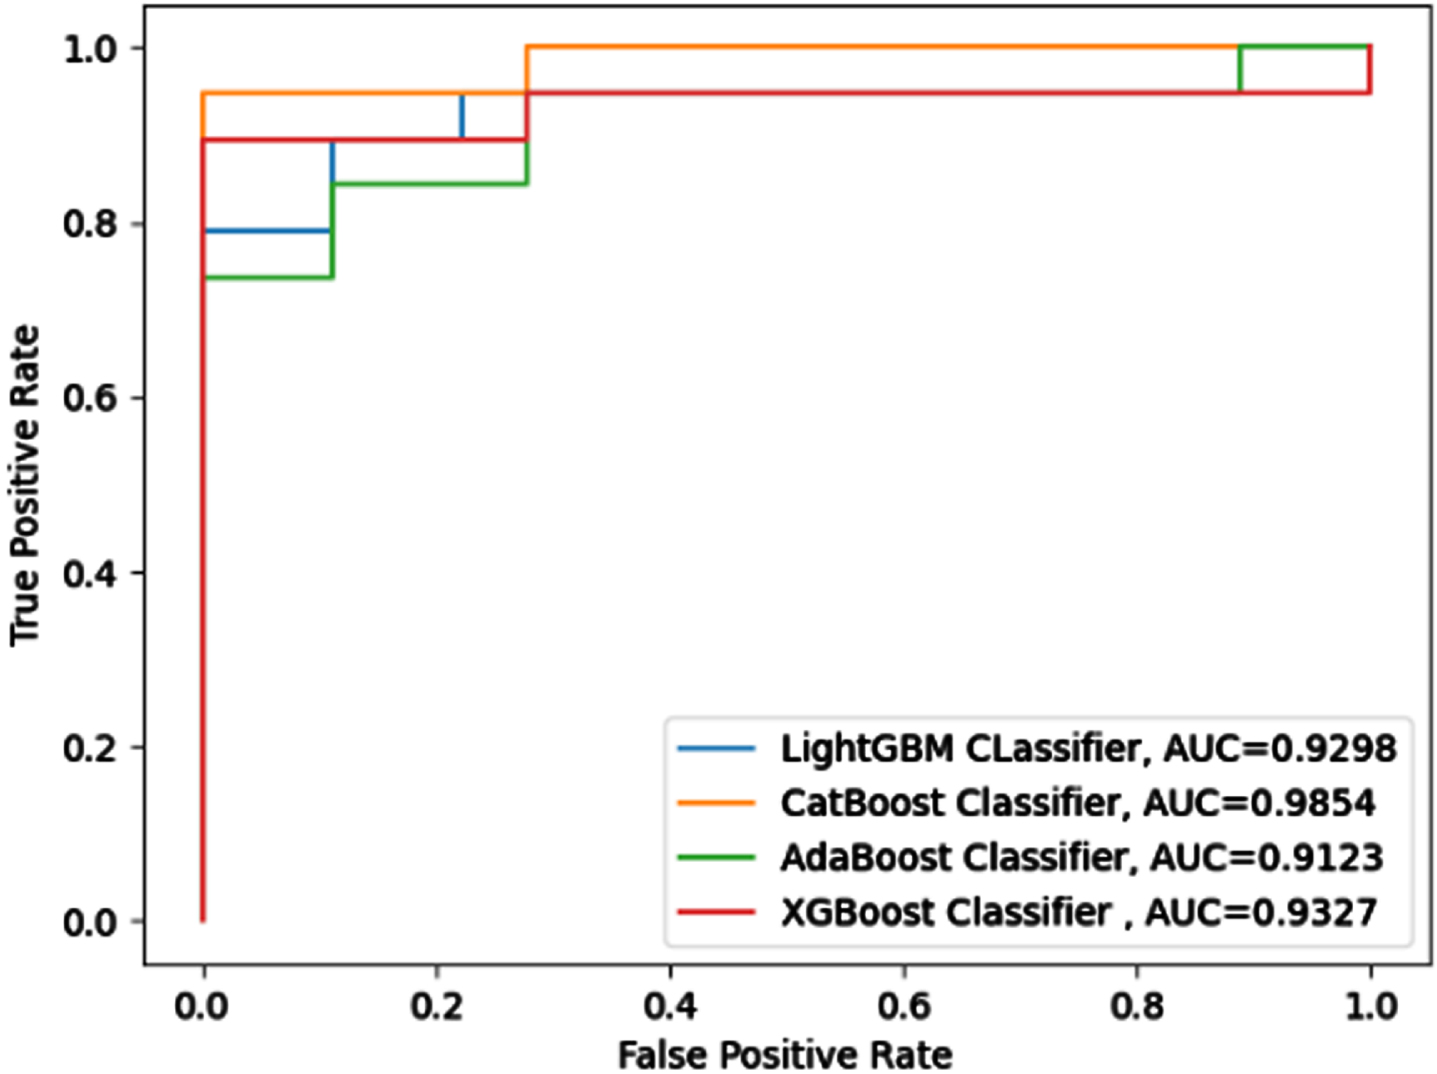
The ROC-AUC curve, which illustrates the probability curve in terms of true positive rate and false positive rate, may be used to analyze binary classification problems. The area under the curve evaluates the classifier’s ability to differentiate between two classes for various user-specified thresholds. Figures 15–22 outlines the ROC-AUC curve for eight datasets classified by four boosted classifiers.

ROC-AUC for HFCD Dataset.
ROC-AUC for SPECT Dataset.
ROC-AUC for SPECTF Dataset.
ROC-AUC for SHD Dataset.

ROC-AUC for CHD Dataset.

ROC-AUC for HHD Dataset.
ROC-AUC for LBV Dataset.
ROC-AUC for SWD Dataset.
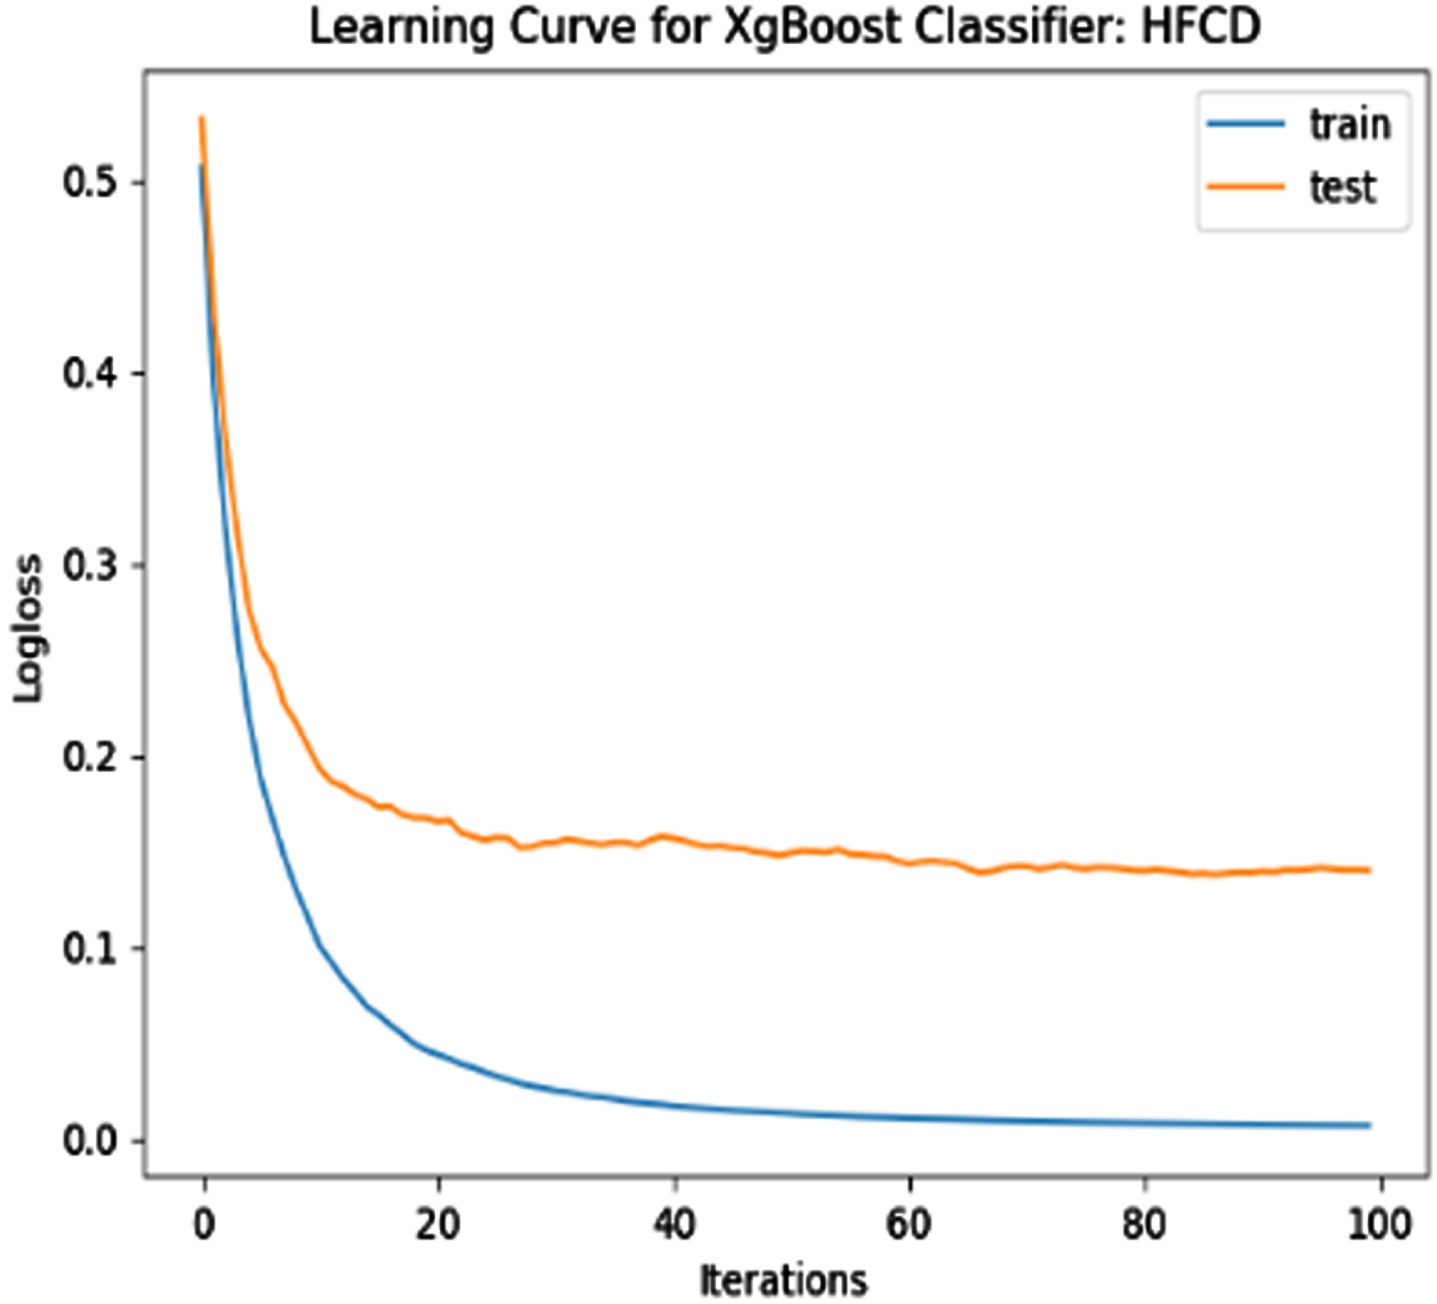
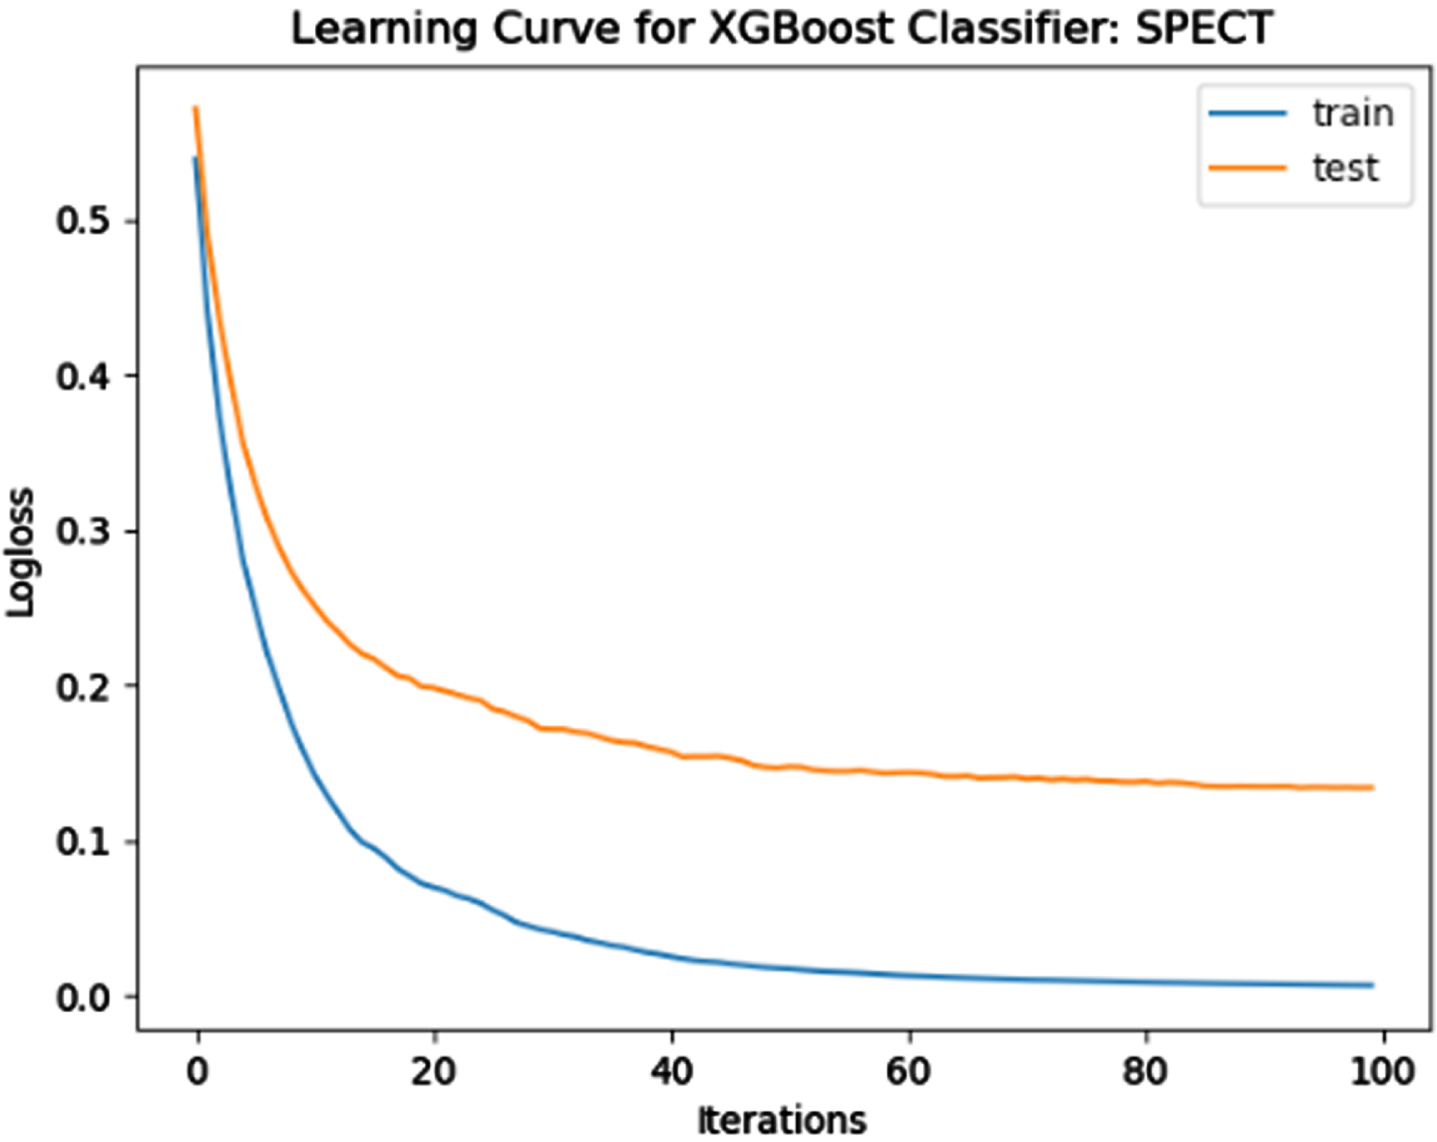
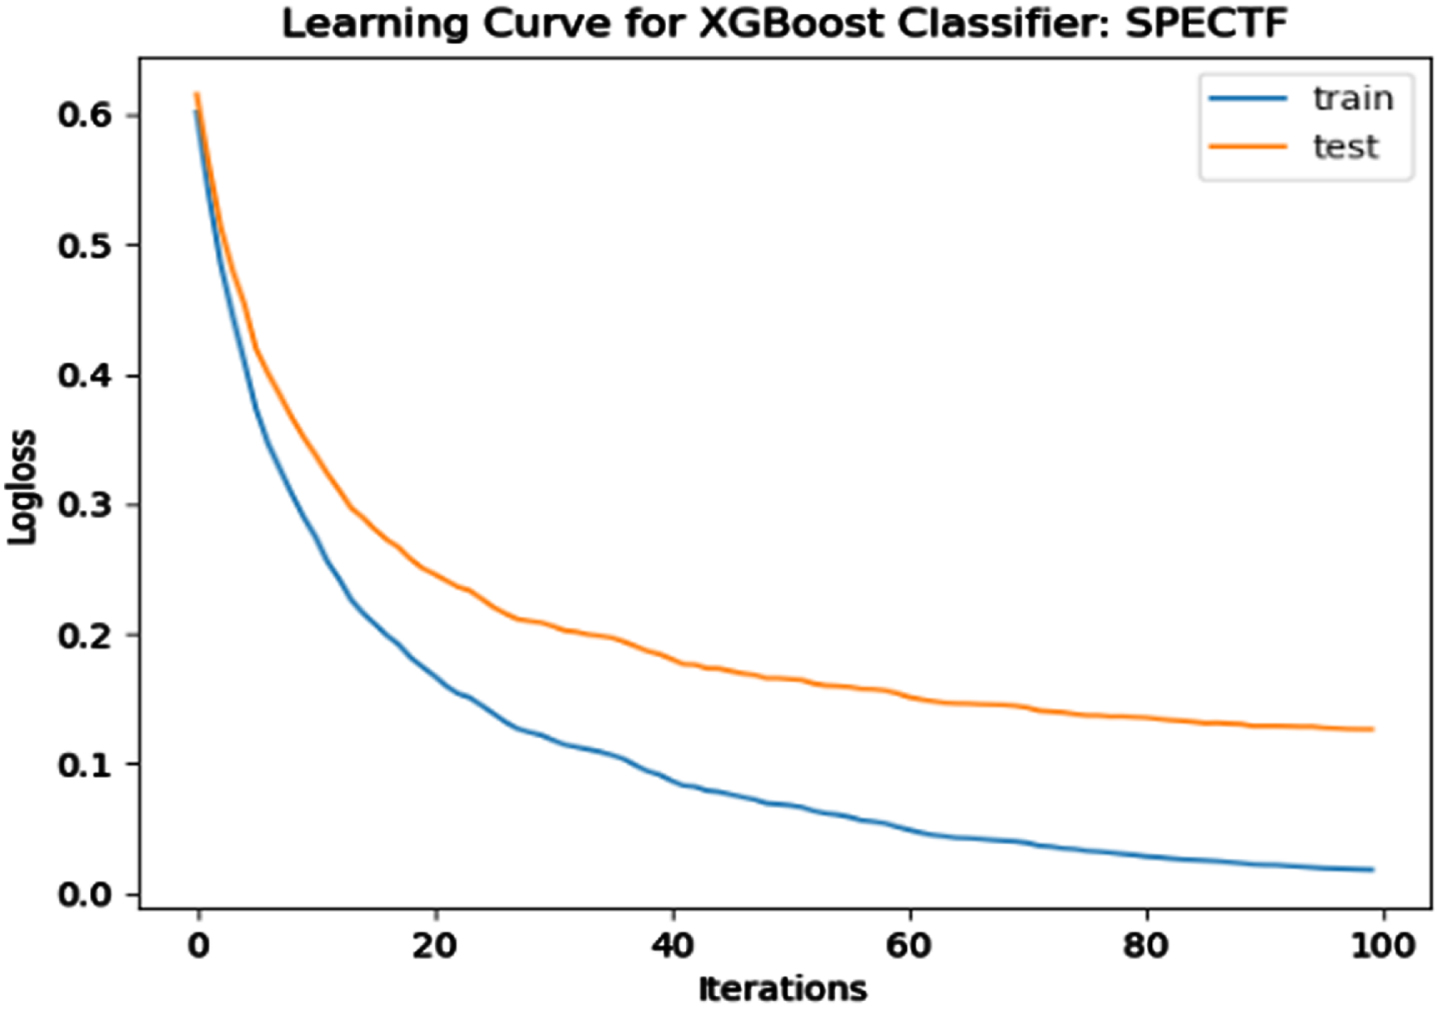
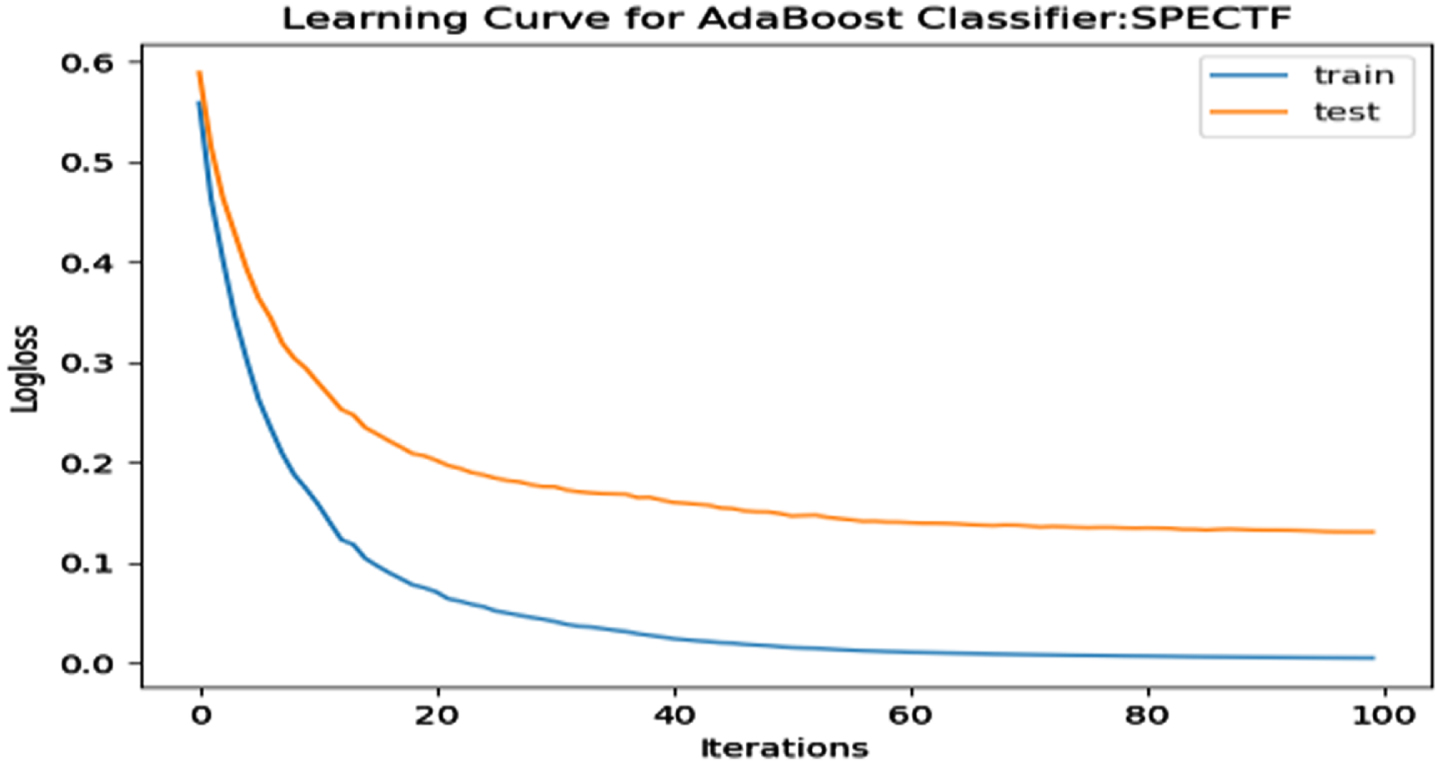
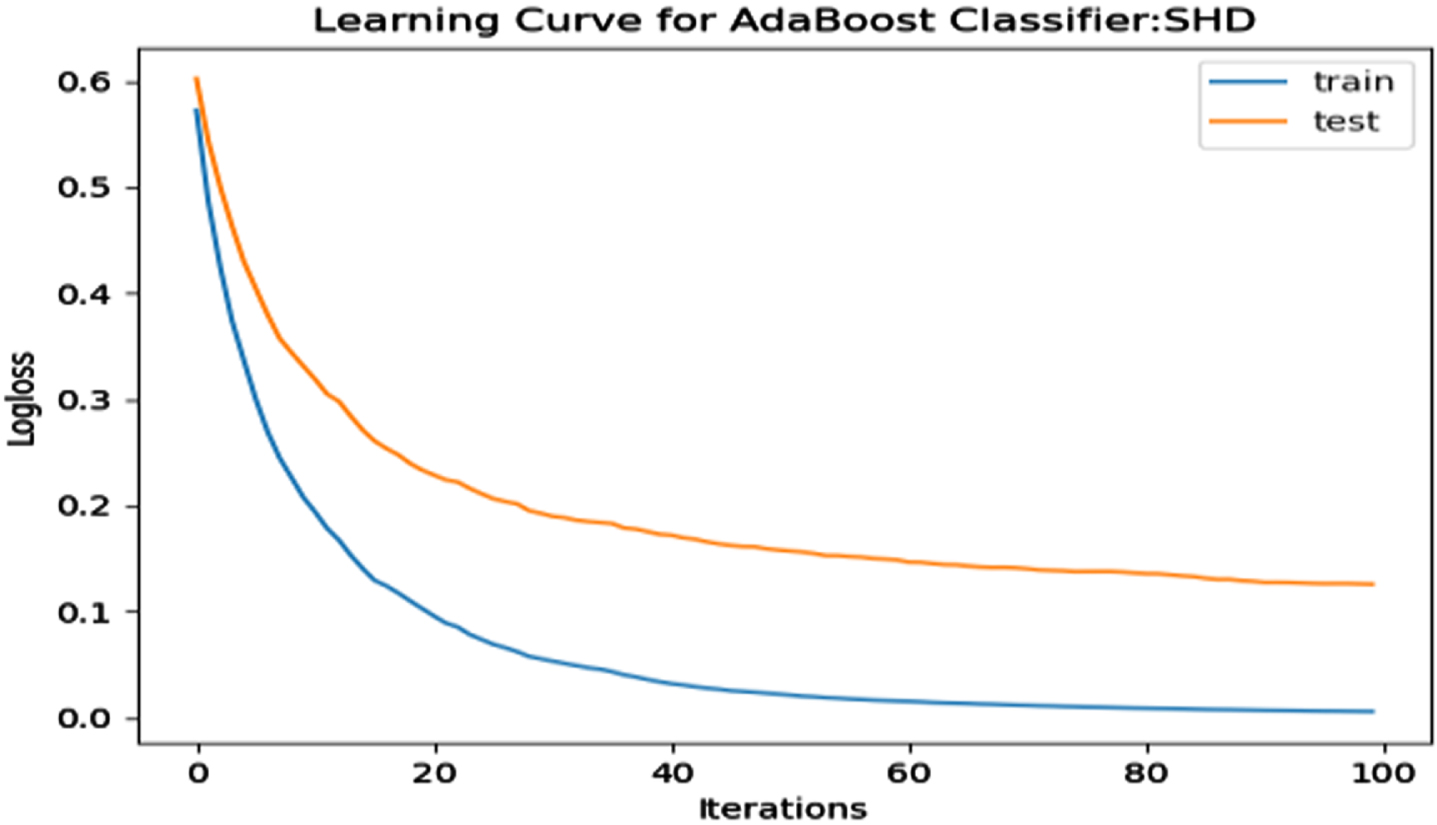
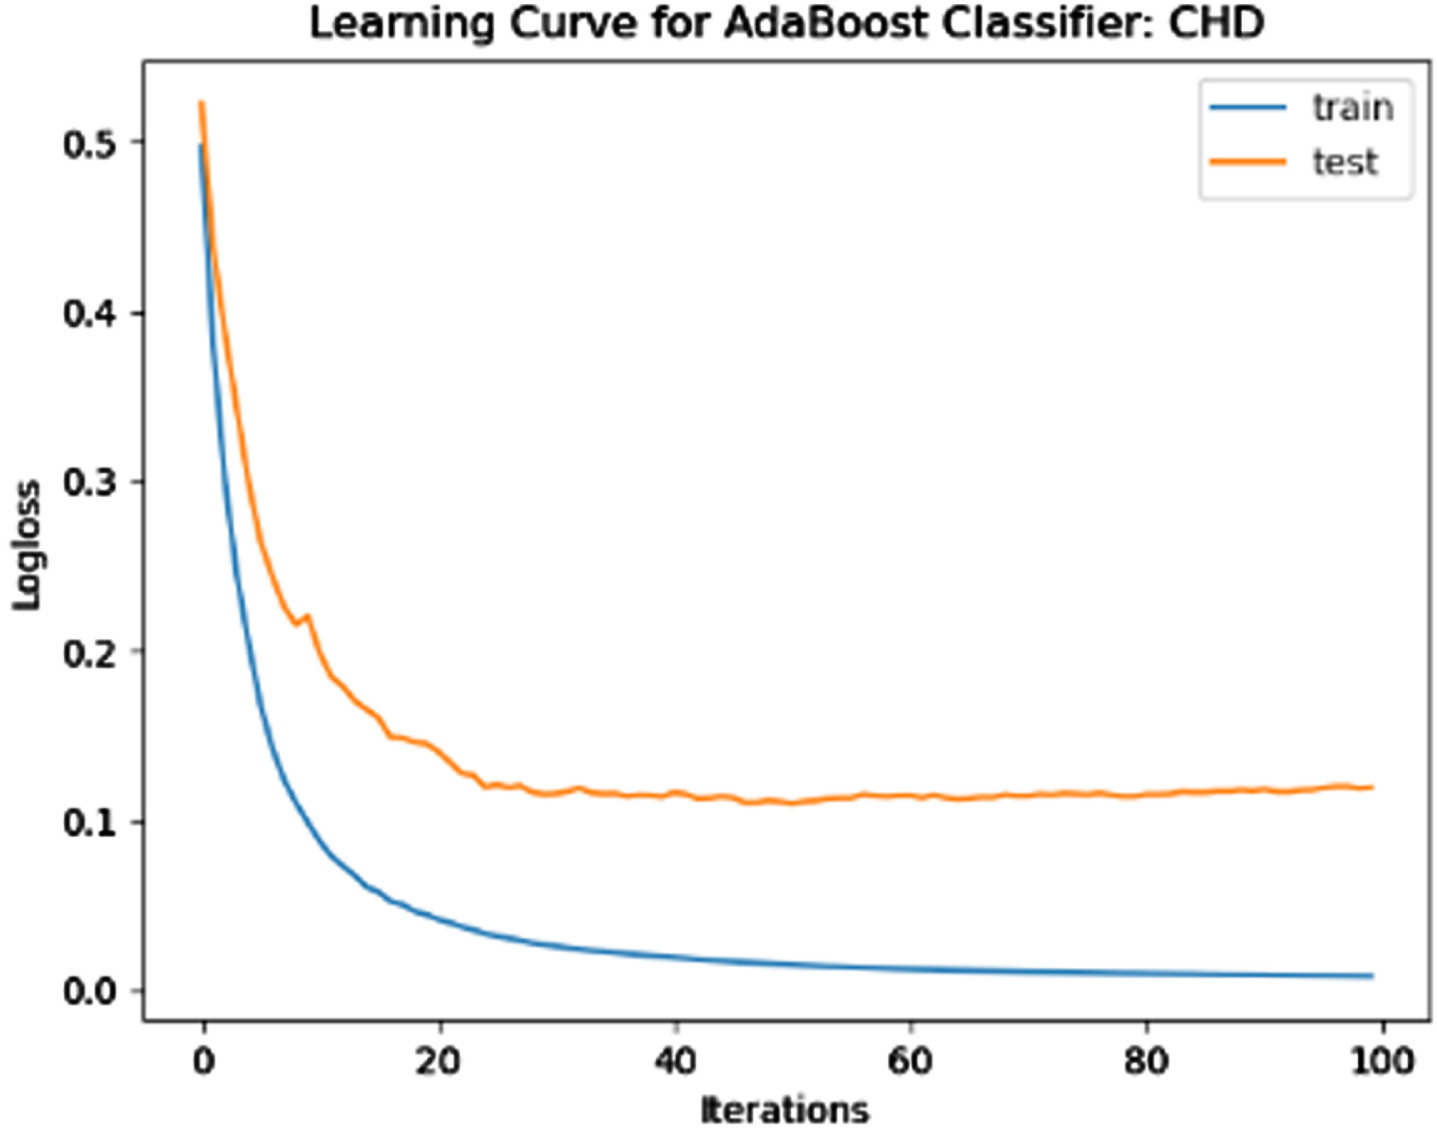
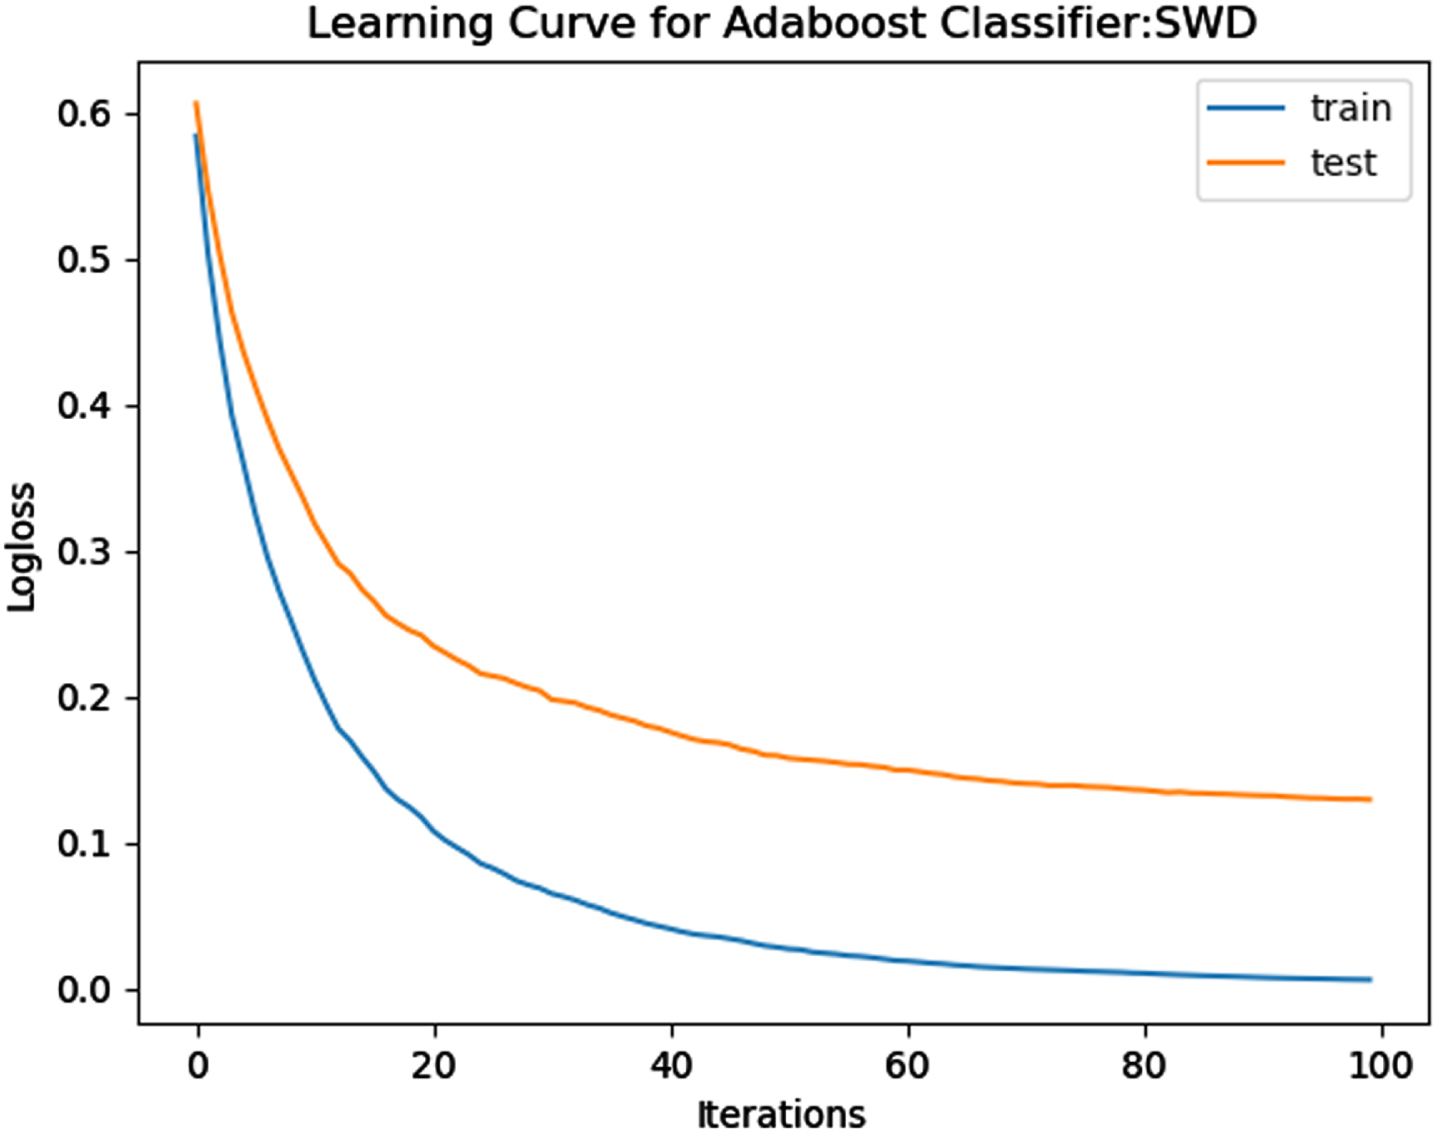
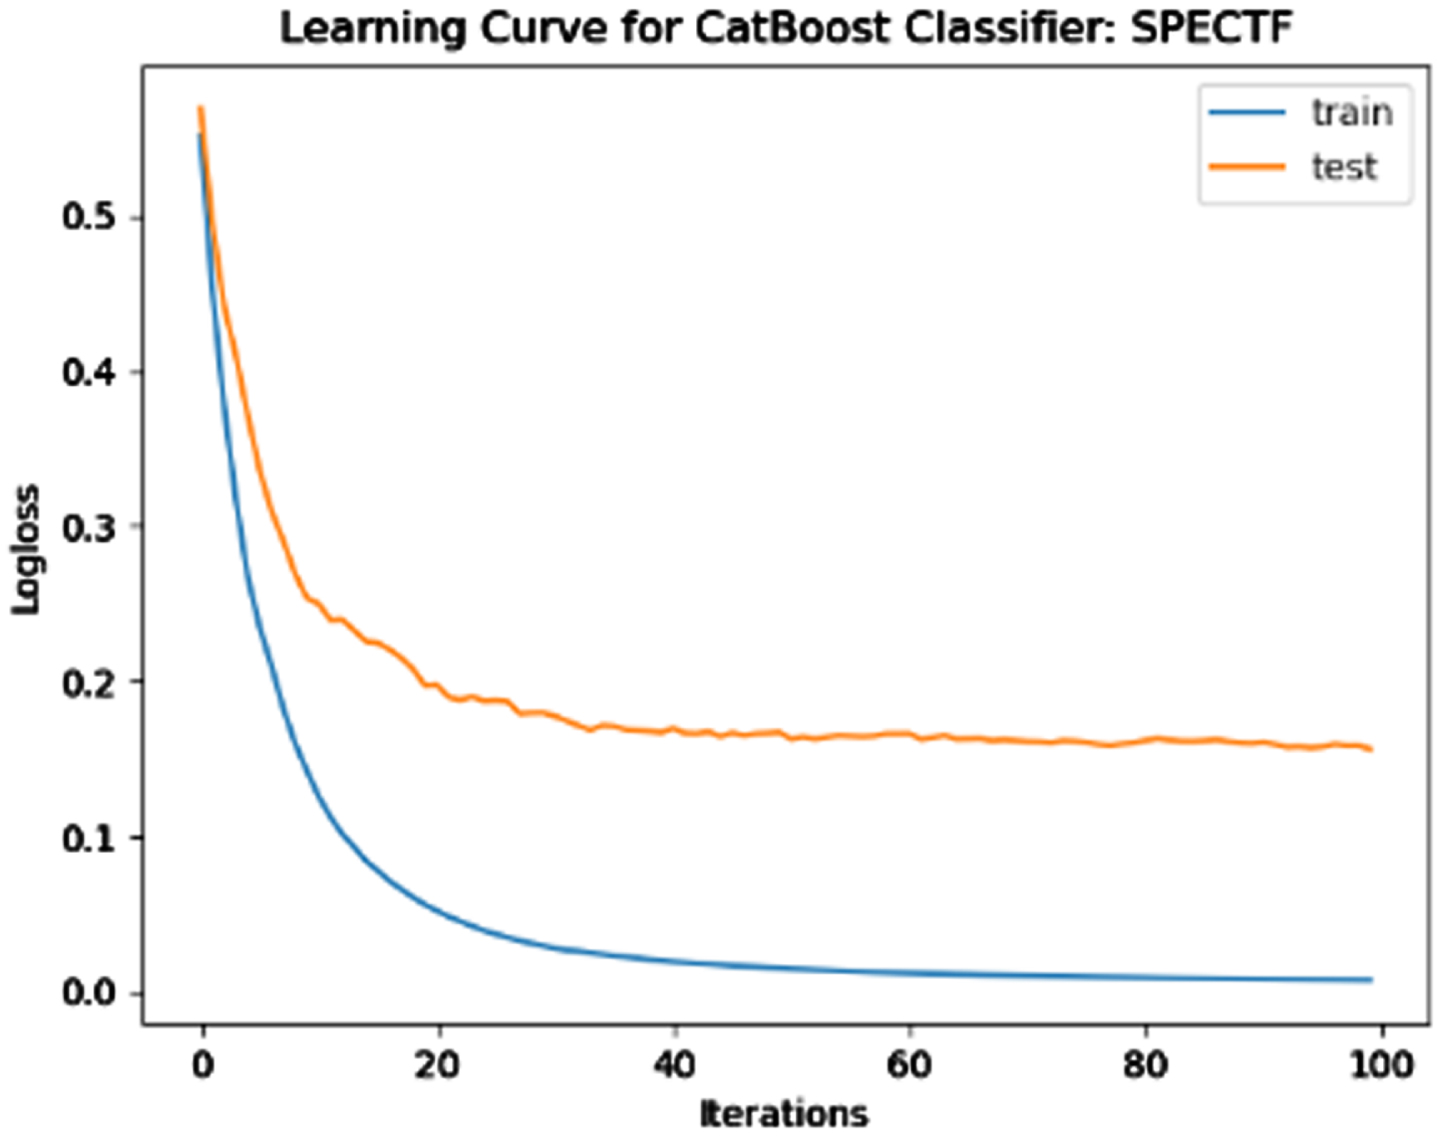
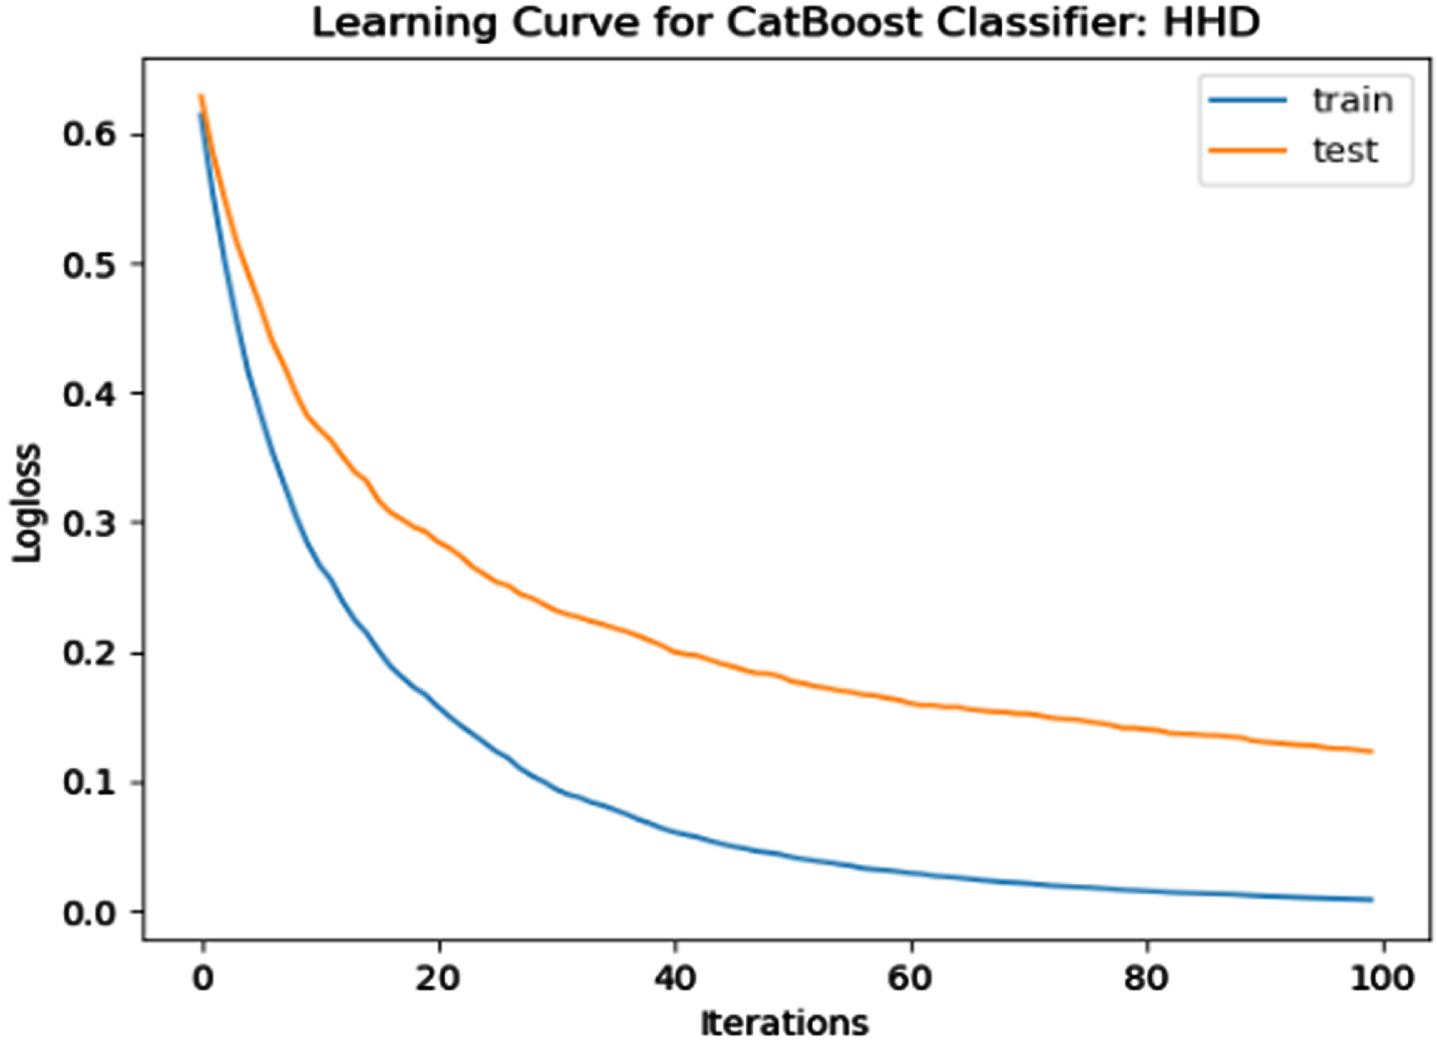
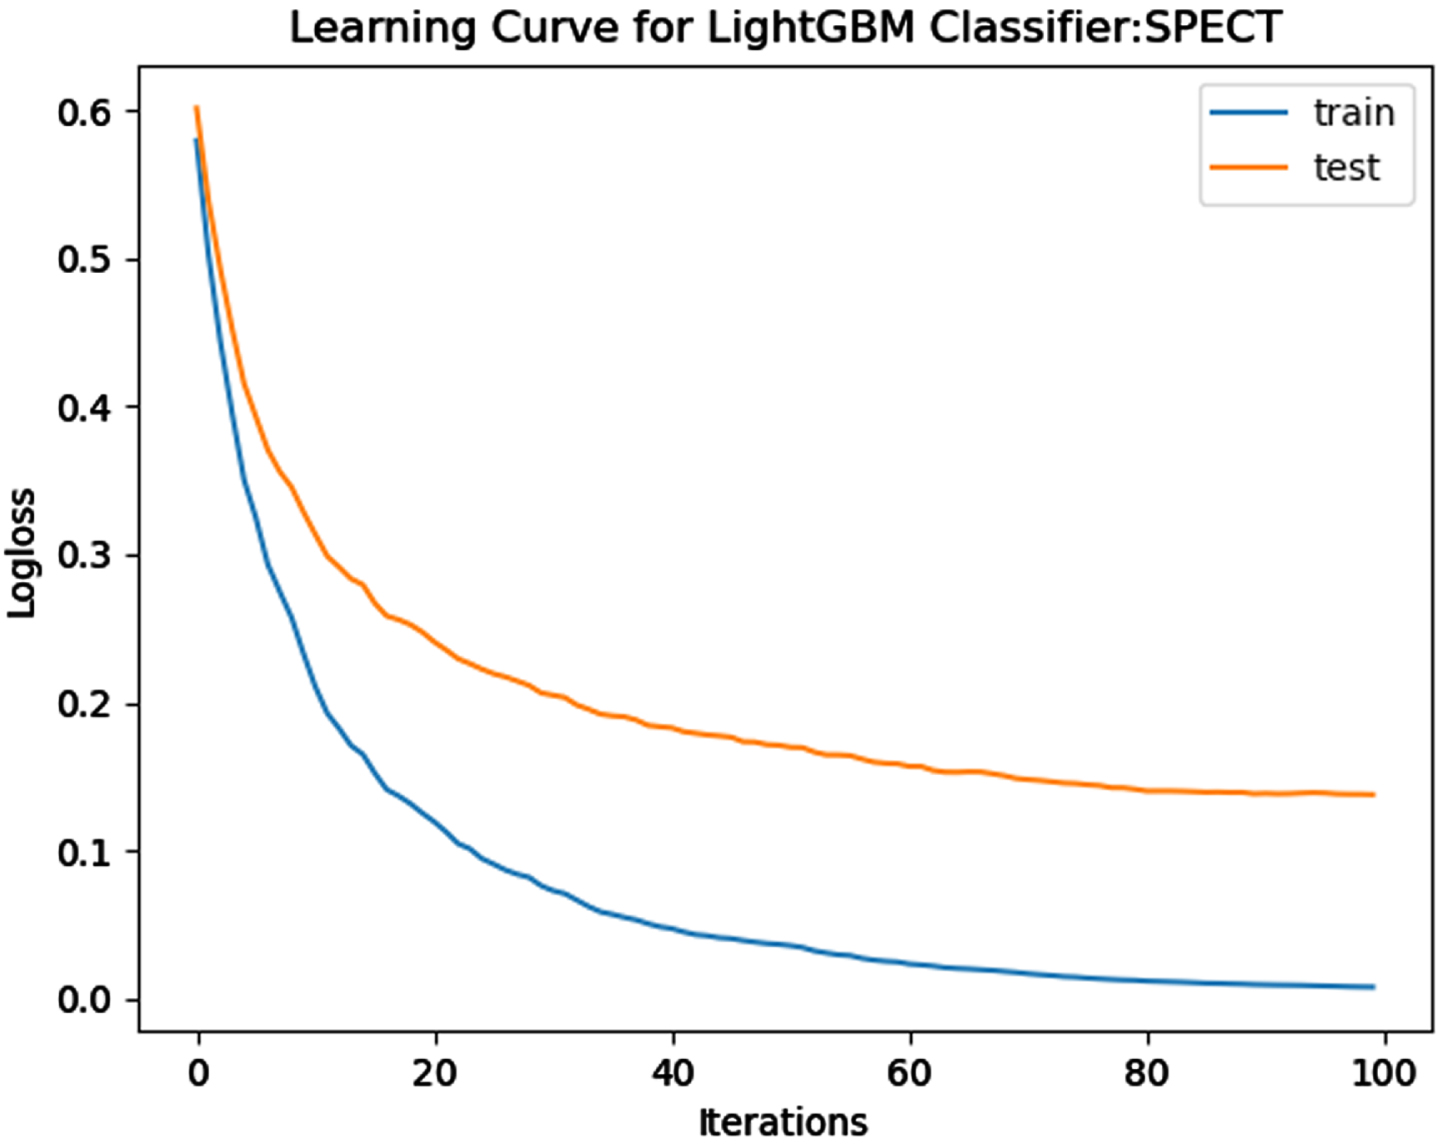
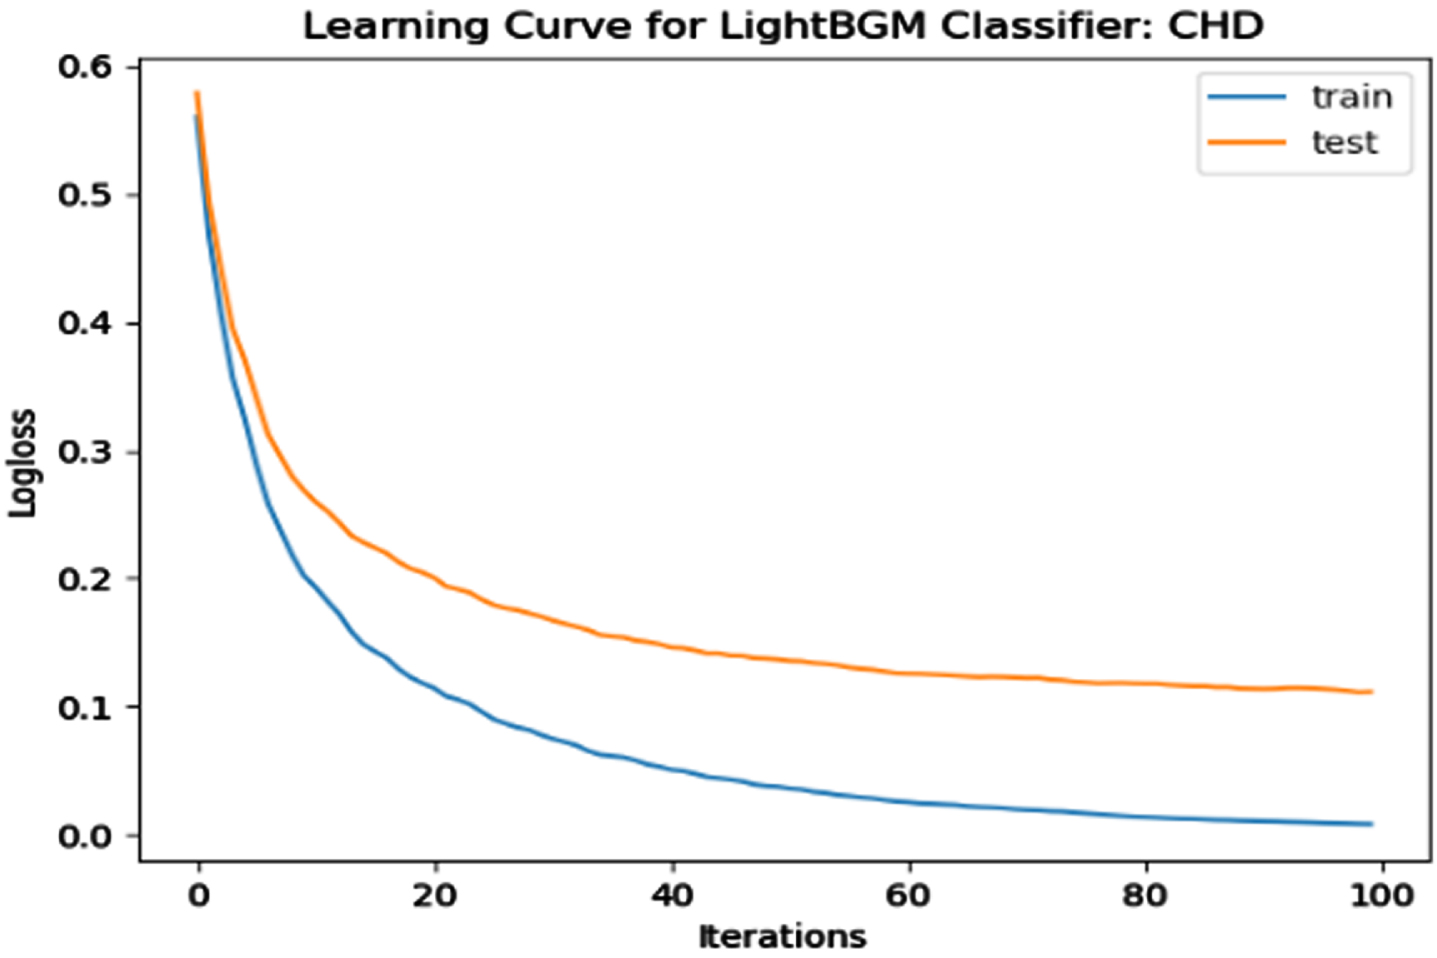
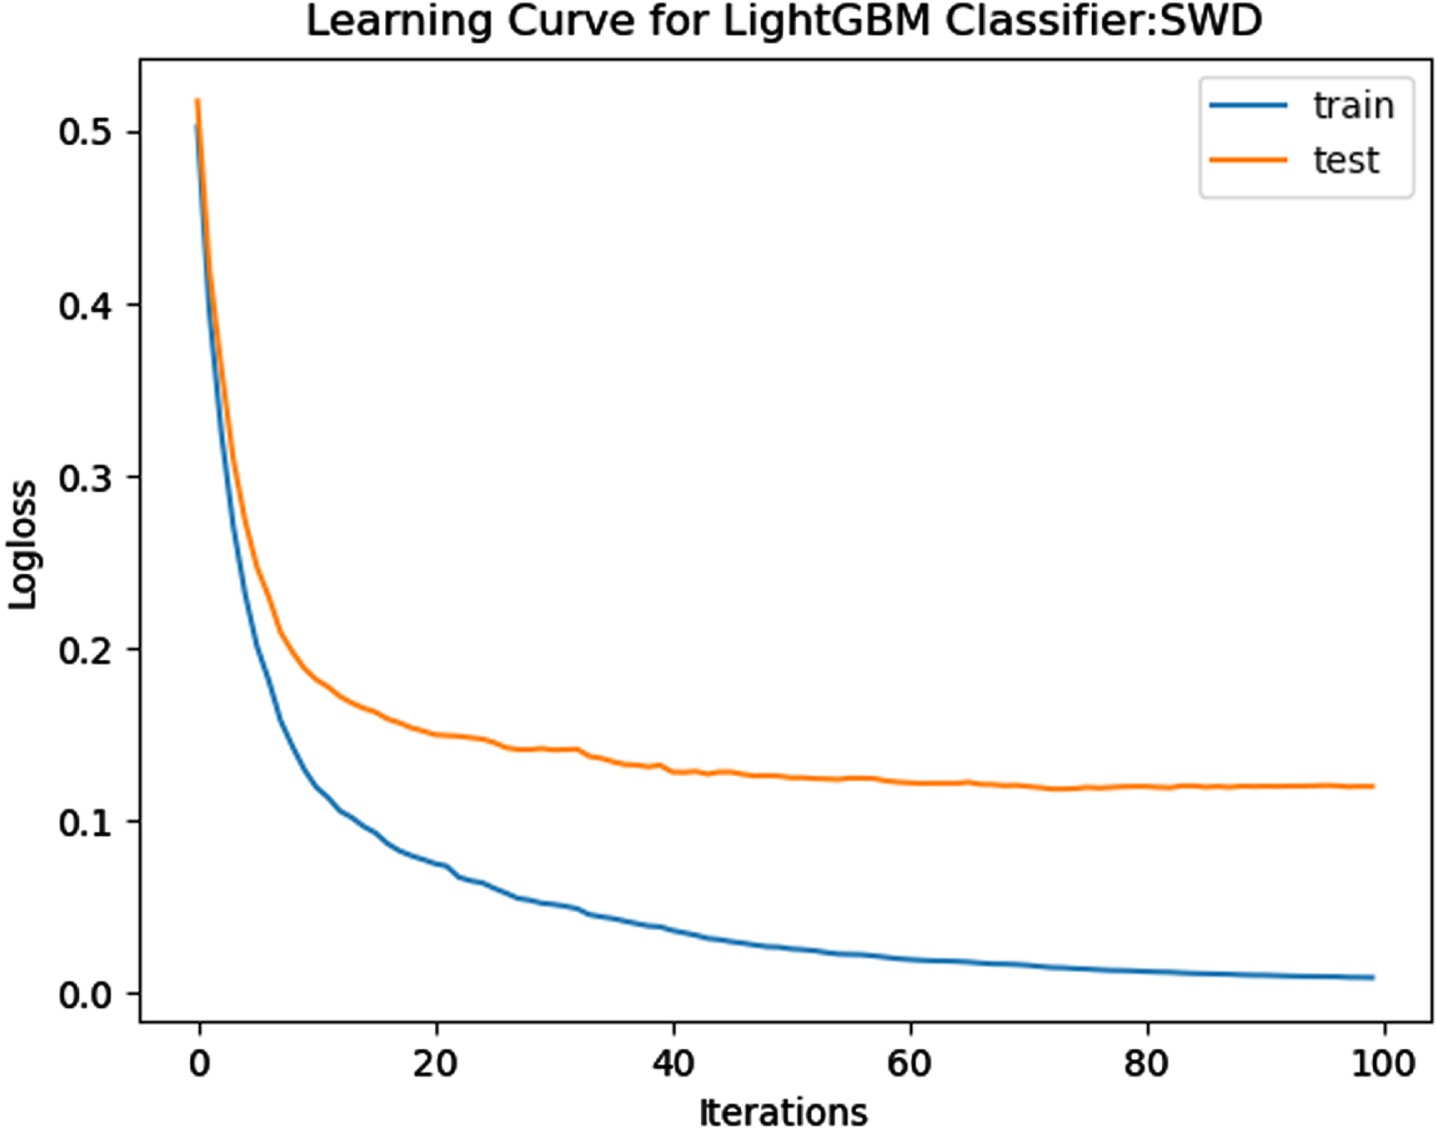
The performance of the model is evaluated using a learning curve that incrementally learns from a training dataset. After each update during training, the model may be evaluated on the training dataset and validation dataset, and plots of the measured performance can be generated to exhibit learning curves. Using the learning curves of model performance on the train and validation datasets, it is possible to figure out if a model is underfit, overfit, or well-fit. The loss function curves for the eight datasets evaluated with four classifiers are evaluated. Figures 23–30 outlines the loss function curves for XGBoost classifier. Figures 31–38 outlines the loss function curves for AdaBoost classifier. Figures 39–46 outlines the loss function curve for CatBoost classifier. Figures 47–54 outlines the loss function curve for LightGBM classifier.
Loss Function Curve for HFCD Dataset.
Loss Function Curve for SPECT Dataset.
Loss Function Curve for SPECTF Dataset.
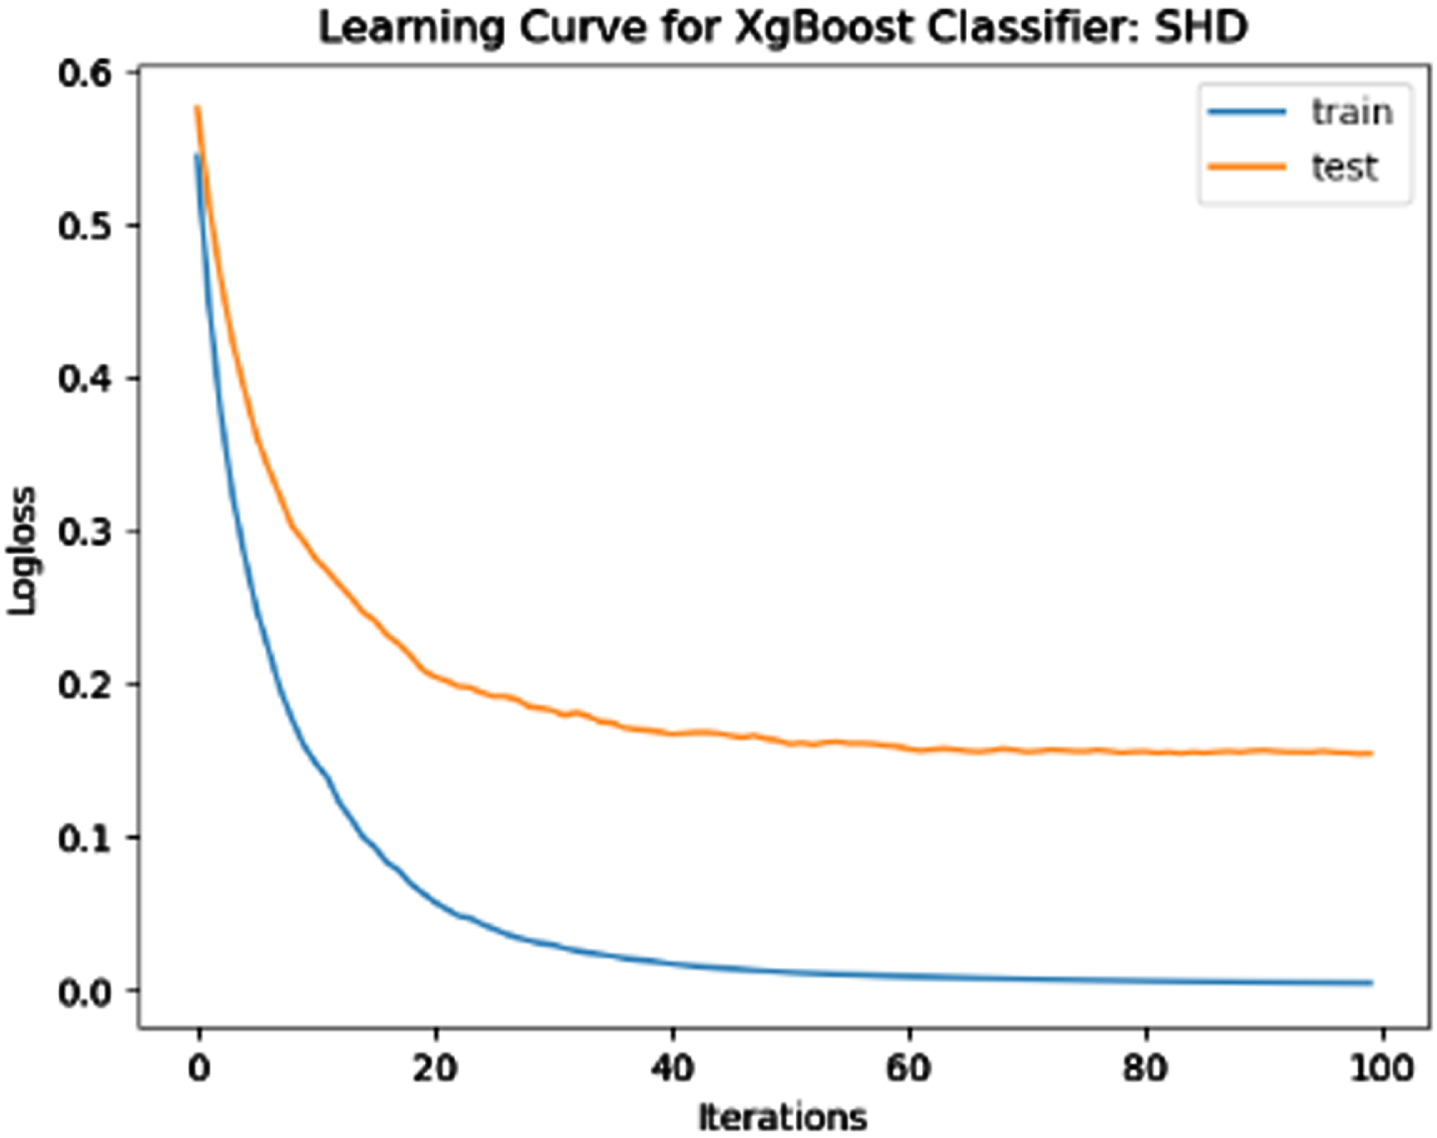
Loss Function Curve for SHD Dataset.
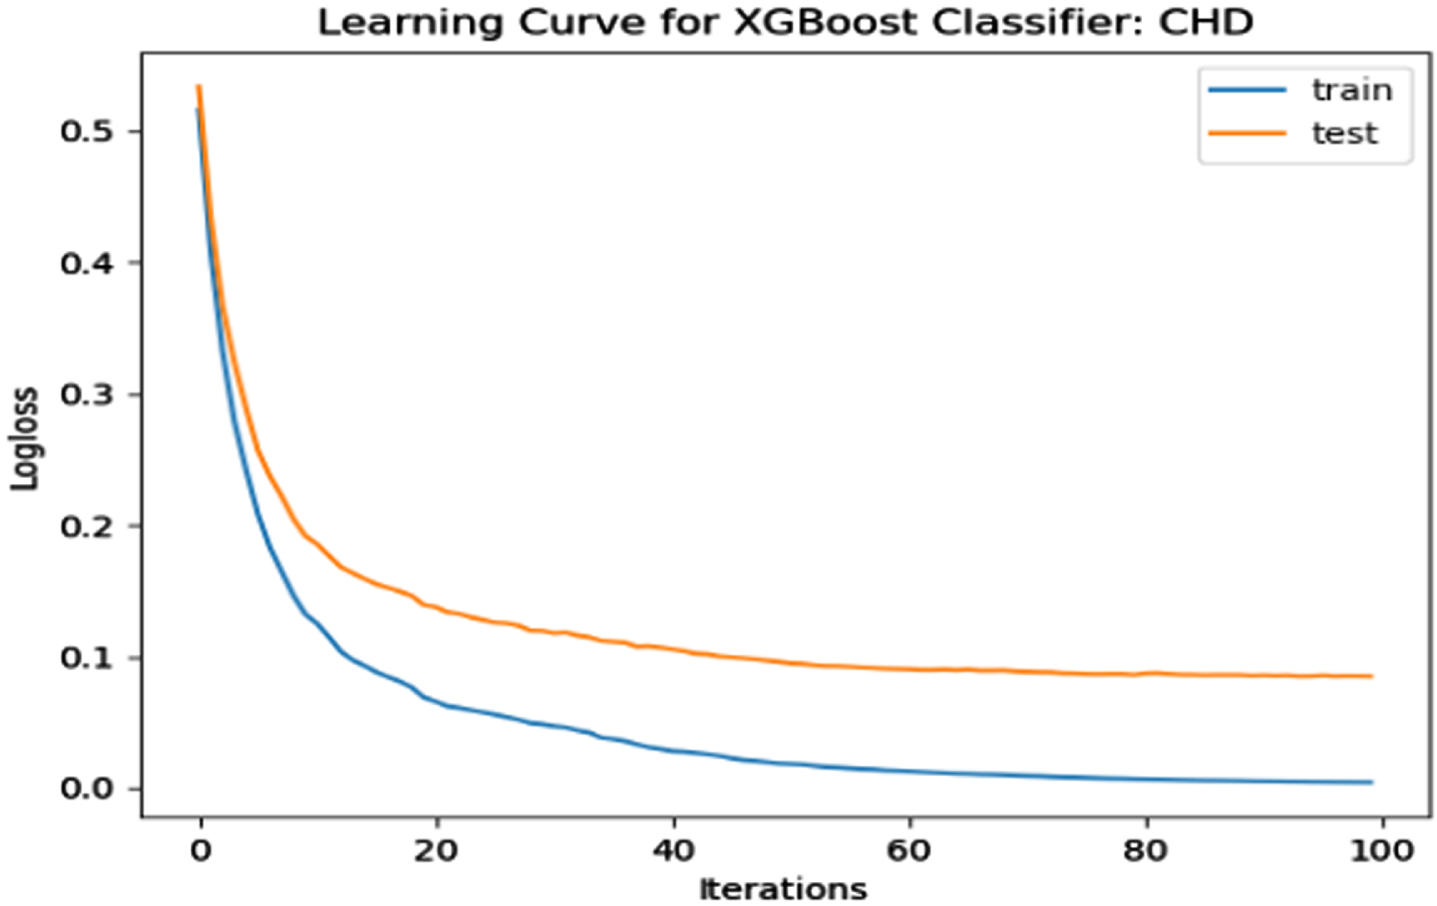
Loss Function Curve for CHD Dataset.
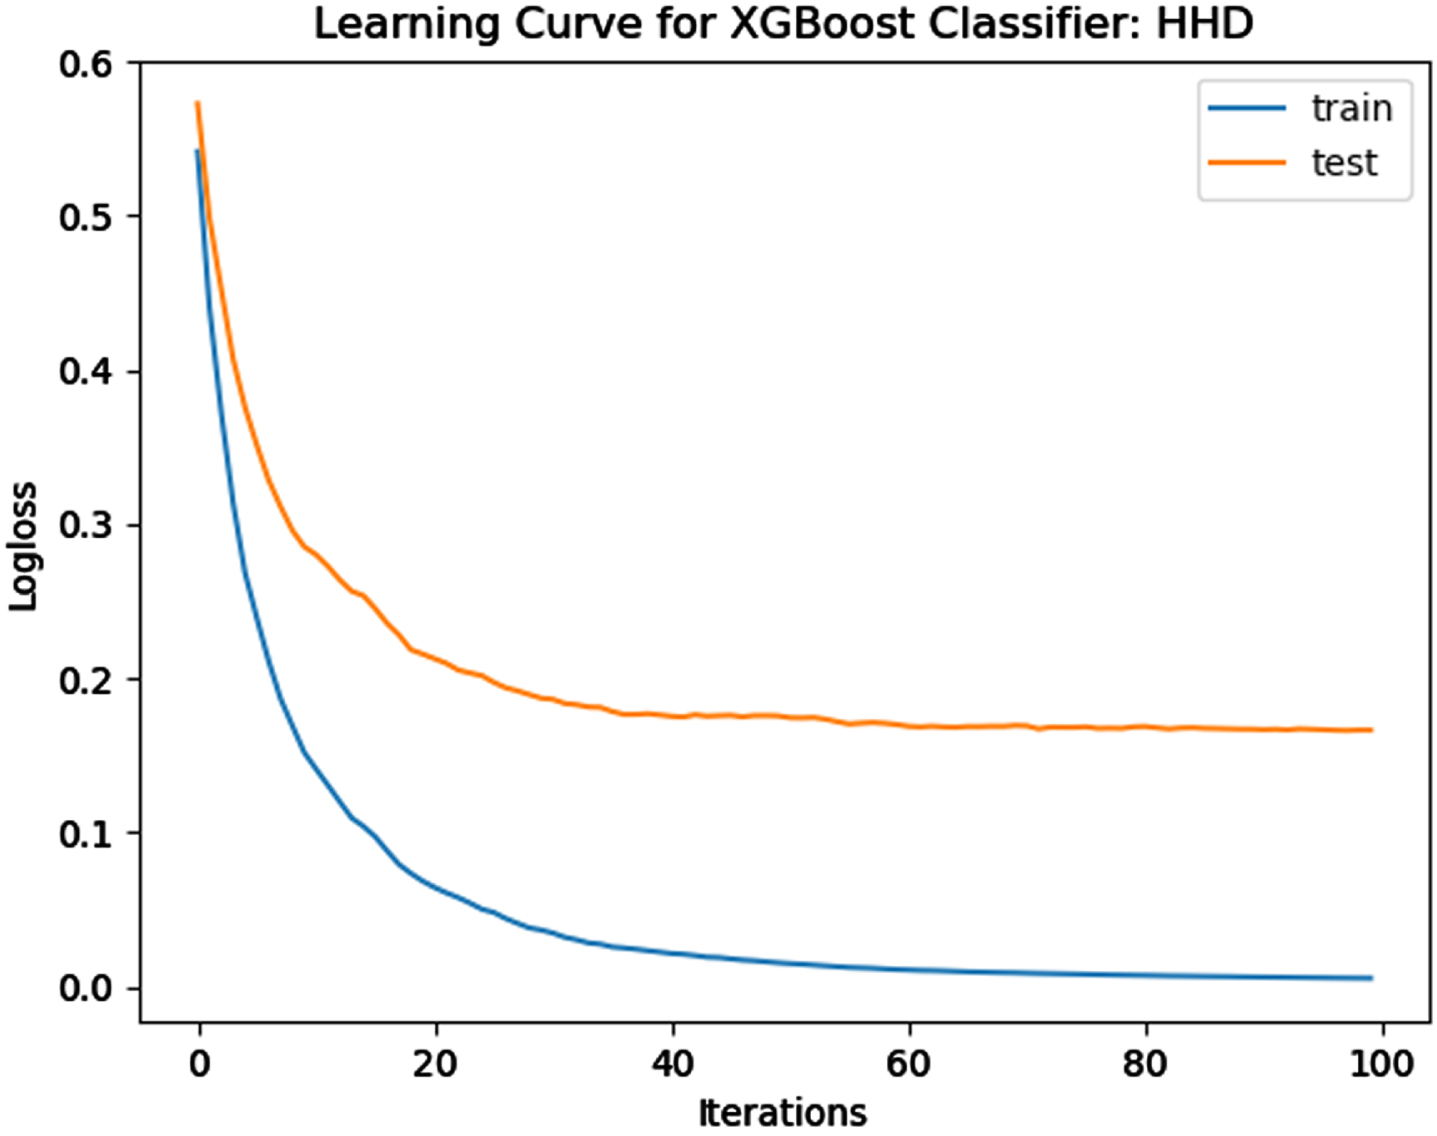
Loss Function Curve for HHD Dataset.

Loss Function Curve for LBV Dataset.

Loss Function Curve for SWD Dataset.

Loss Function Curve for HFCD Dataset.
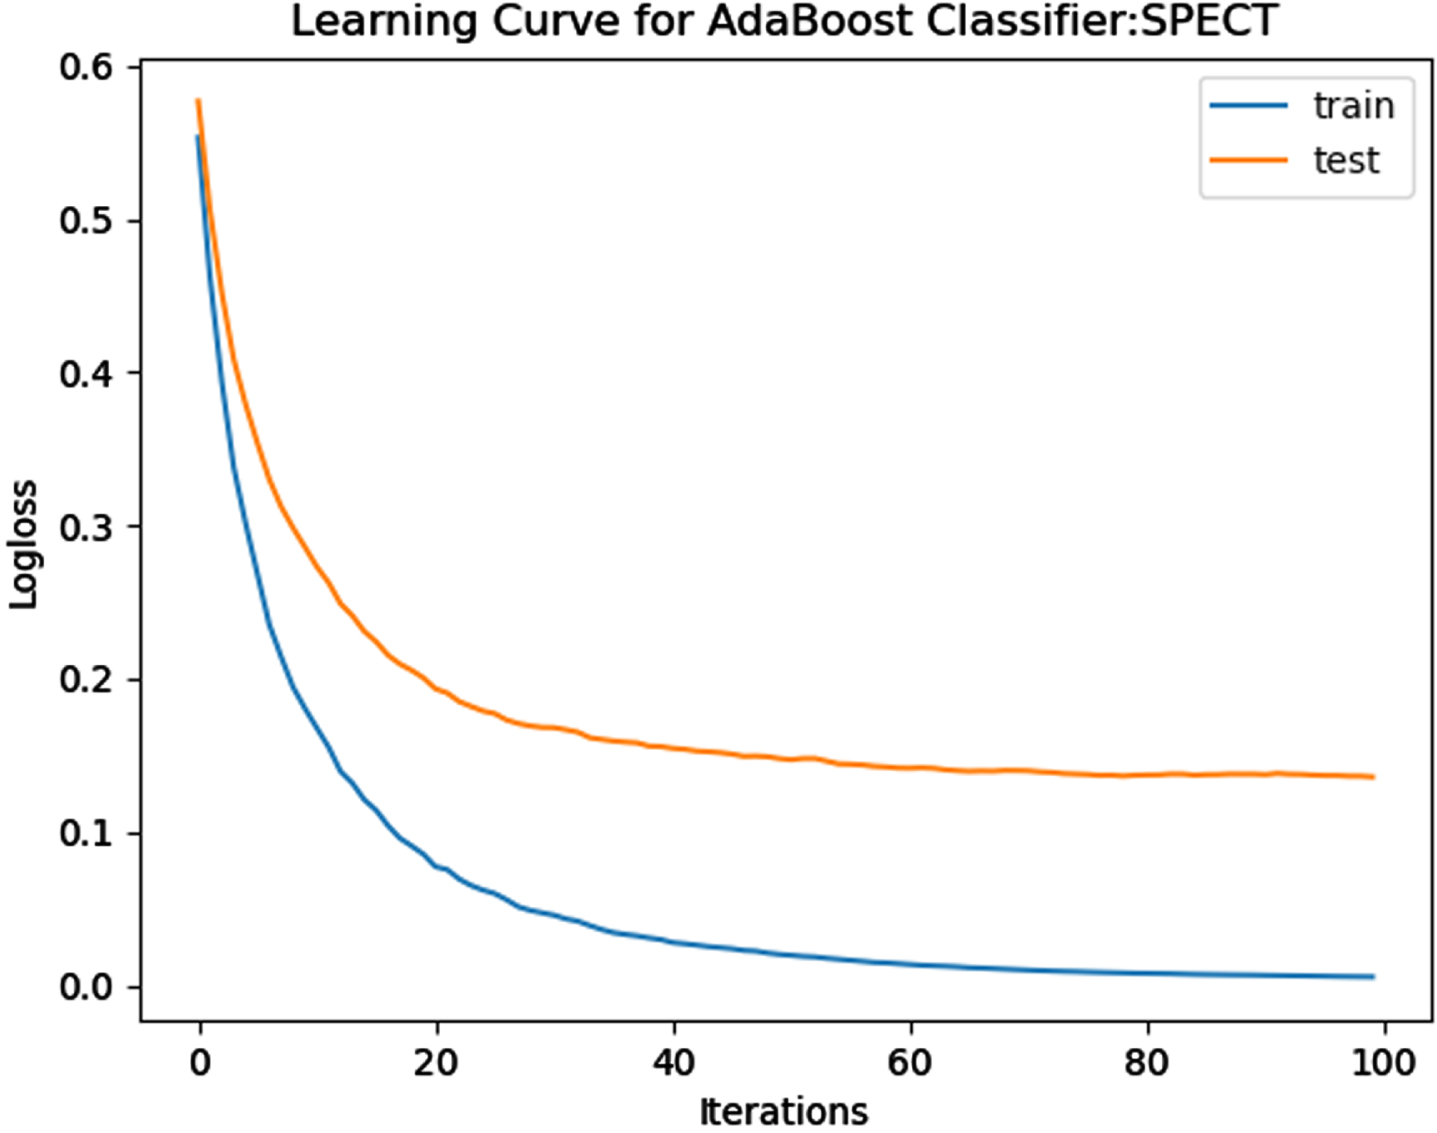
Loss Function Curve for SPECT Dataset.
Loss Function Curve for SPECTF Dataset.
Loss Function Curve for SHD Dataset.
Loss Function Curve for CHD Dataset.

Loss Function Curve for HHD Dataset.

Loss Function Curve for LBV Dataset.
Loss Function Curve for SWD Dataset.

Loss Function Curve for HFCD Dataset.

Loss Function Curve for SPECT Dataset.
Loss Function Curve for SPECTF Dataset.

Loss Function Curve for SHD Dataset.

Loss Function Curve for CHD Dataset.
Loss Function Curve for HHD Dataset.

Loss Function Curve for LBV Dataset.

Loss Function Curve for SWD Dataset.

Loss Function Curve for HFCD Dataset.
Loss Function Curve for SPECT Dataset.

Loss Function Curve for SPECTF Dataset.

Loss Function Curve for SHD Dataset.
Loss Function Curve for CHD Dataset.

Loss Function Curve for HHD Dataset.

Loss Function Curve for LBV Dataset.
Loss Function Curve for SWD Dataset.
Loss function curves for AdaBoost classifier
Loss function curves for CatBoost classifier
Loss function curves for LightGBM classifier
In a learning curve for an underfit model, the training loss remains constant regardless of the amount of training and continues until the completion of training process. In an overfit curve, the training loss decreases with training, but the test loss first decreases and subsequently increases. There is a gap between the train and validation loss learning curves. The loss of the model from the Figs. 23 54 will always be lower on the training dataset than on the validation dataset and there exists a gap between the train and validation loss learning curves.
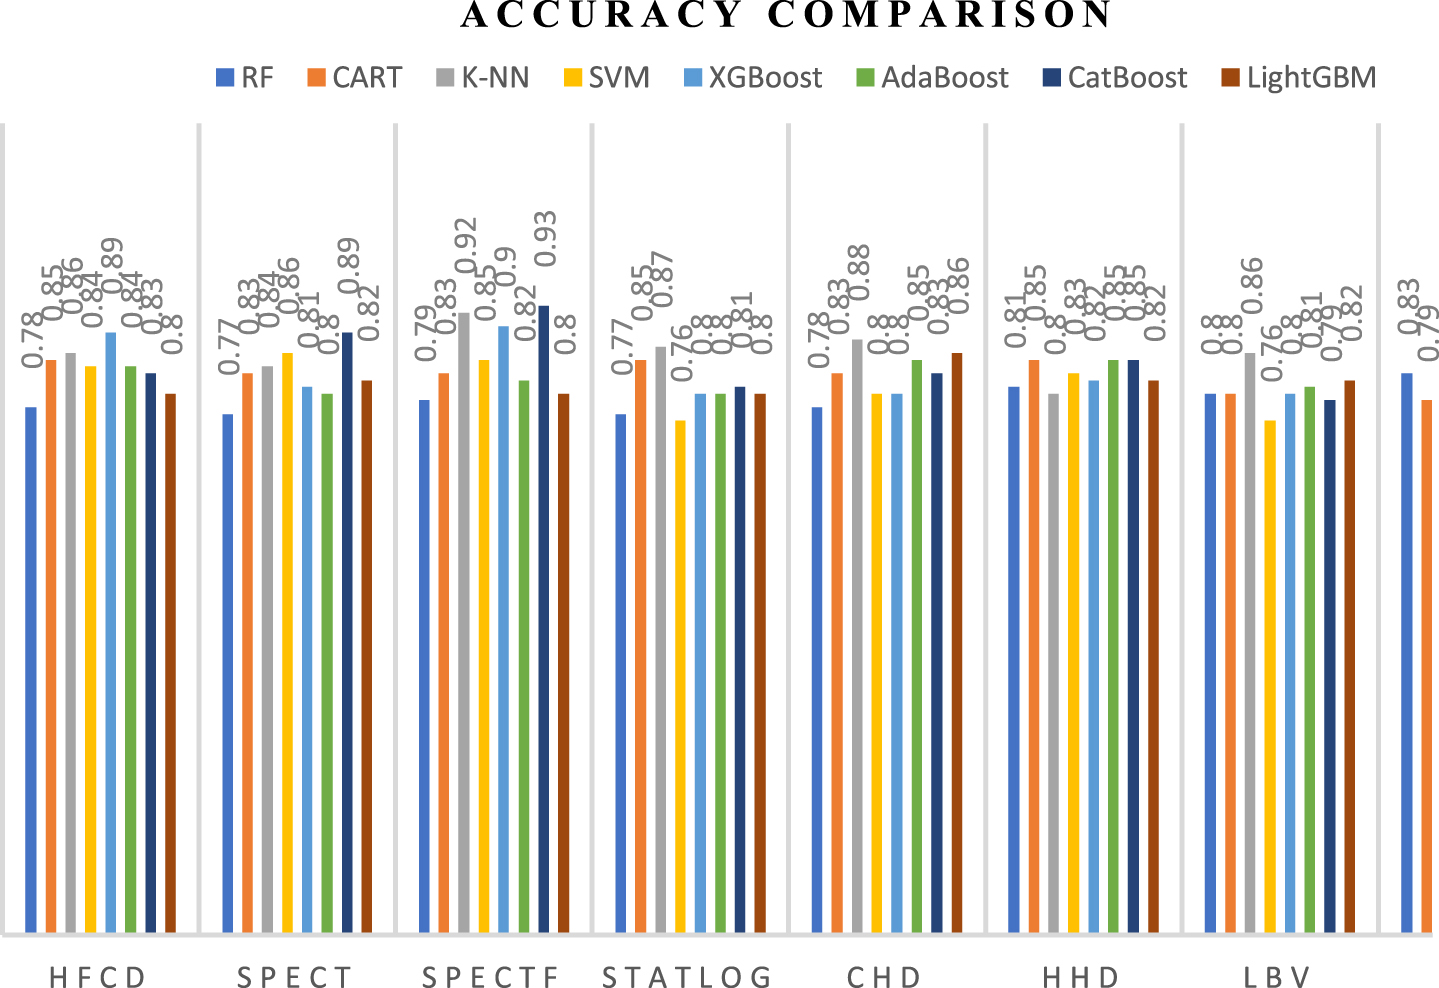
Overall accuracy comparison
Table 18 compares the overall accuracy performance of classifiers together with the proposed method of missing value imputation and feature selection (19). Comparing Random Forest Classifier (RF), Classification and Regression Trees (CART), K-Nearest Neighbour Classifier (K-NN), and Support Vector Machine (SVM) using the performance metrics accuracy, precision, recall, and F1 score. The graphical plot for the accuracy compared with the classifiers is presented in Fig. 54.
Accuracy comparison proposed approach with RF, CART, K-NN, SVM
Accuracy comparison proposed approach with RF, CART, K-NN, SVM
Based on the Accuracy achieved in Fig. 55 using the proposed missing value imputation method and feature selection method, it can be inferred that the boosted classifiers have a greater accuracy than the RF, CART, K-NN, and SVM.
Accuracy Comparison With RF, CART, K-NN, SVM.
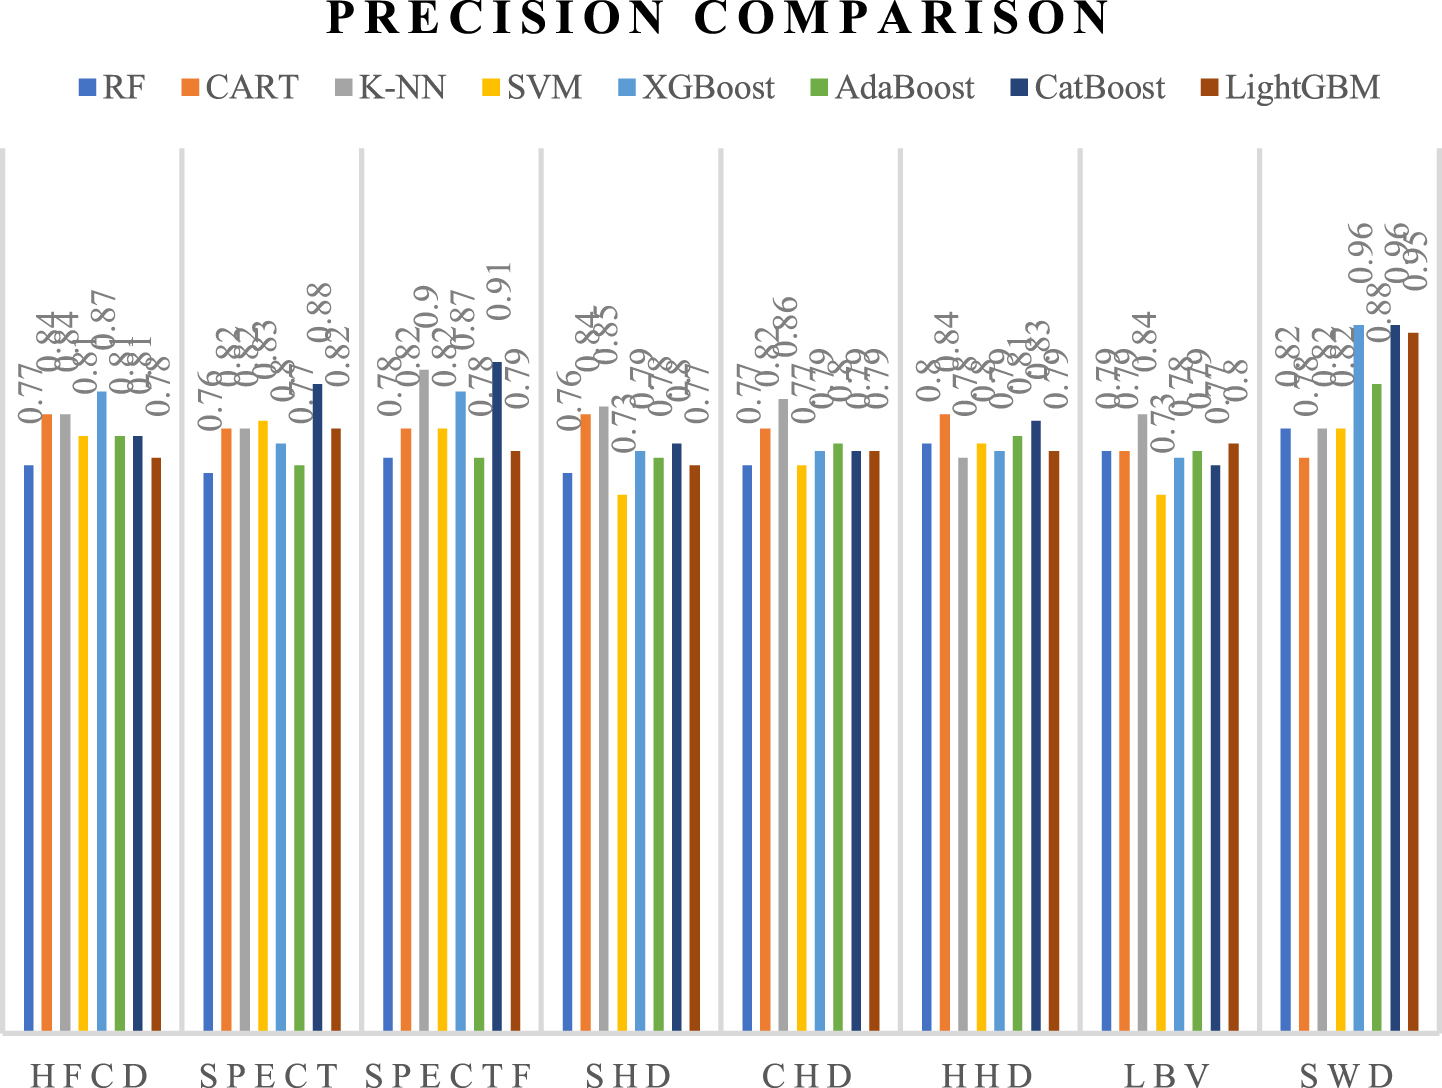
The comparison of overall Precision among classifiers and the proposed technique of missing value imputation and feature selection is shown in Table 19. Evaluating Random Forest Classifier (RF), Classification and Regression Trees (CART), K-Nearest Neighbour Classifier (K-NN), and Support Vector Machine (SVM) using the performance metrics accuracy, precision, recall, and F1 score.
Precision Comparison Proposed Approach with RF, CART, K-NN, SVM
From the Precision obtained in Fig. 56 with the proposed missing value imputation approach and feature selection approach, it is inferred that the boosted classifiers are having higher Precision when compared with the RF, CART, K-NN, and SVM.
Precision Comparison With RF, CART, K-NN, SVM.
The overall Recall comparison is done with the classifiers along with the proposed approach of missing value imputation and feature selection and is presented in Table 20. The classifiers used for comparison are Random Forest Classifier (RF), Classification and Regression Trees (CART), K-Nearest Neighbour Classifier (K-NN), and Support Vector Machine (SVM) with the performance metrics accuracy, precision, recall, and F1 score. The graphical plot for the Recall compared with the classifiers is presented in Fig. 56.
Recall comparison proposed approach with RF, CART, K-NN, SVM
From the Recall obtained in Fig. 57 with the proposed missing value imputation approach and feature selection approach, it is inferred that the boosted classifiers are having higher Recall when compared with the RF, CART, K-NN, and SVM.

Recall Comparison With RF, CART, K-NN, SVM.
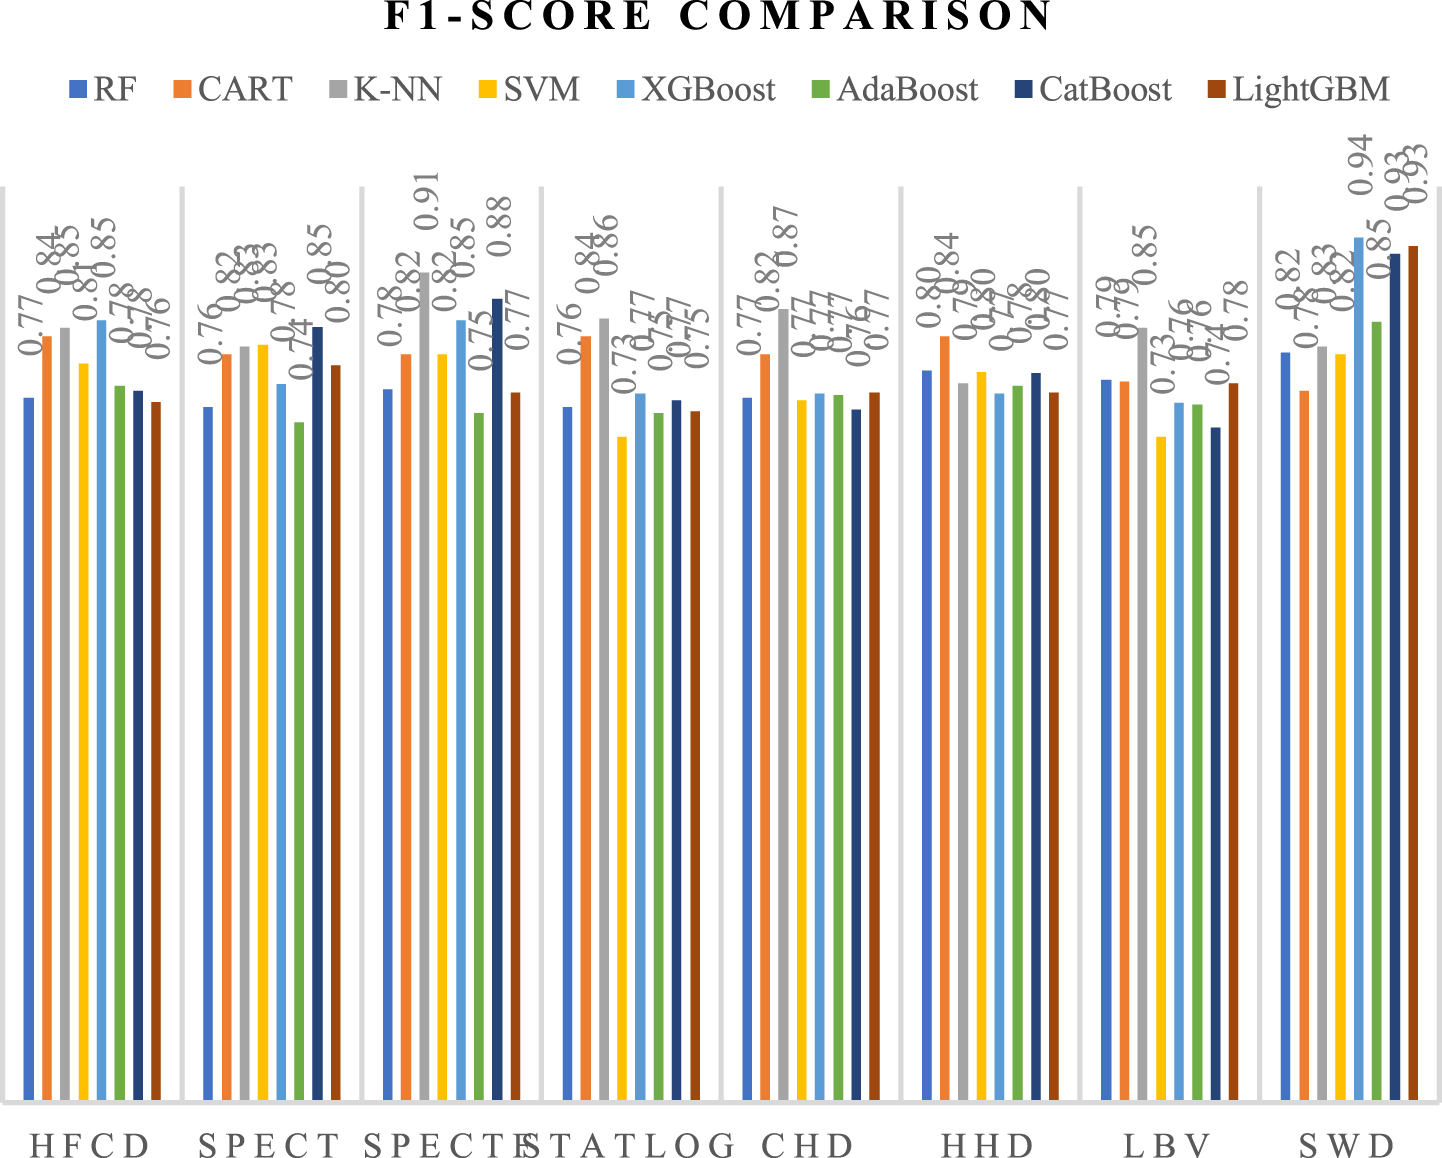
The overall F1-Score comparison is done with the classifiers along with the proposed approach of missing value imputation and feature selection and is presented in Table 21. The classifiers used for comparison are Random Forest Classifier (RF), Classification and Regression Trees (CART), K-Nearest Neighbour Classifier (K-NN), and Support Vector Machine (SVM) with the performance metrics accuracy, precision, recall, and F1 score. The graphical plot for the Recall compared with the classifiers is presented in Fig. 57.
F1-score comparison proposed approach with RF, CART, K-NN, SVM
From the F1-Score obtained in Fig. 58 with the proposed missing value imputation approach and feature selection approach, it is inferred that the boosted classifiers are having higher Recall when compared with the RF, CART, K-NN, and SVM.
F1-Score Comparison with Standard Classifiers.
The proposed approach is used for binary classification problems, and multiclassification problems can be improved in the future. The missing value imputation performed in this study is a random forest-based imputation referred to as the missForest technique, where the imputation time increases as the number of observations increases. The wrapper approach employs the computationally intensive liberty of learning algorithm. The fact that feature selection is reliant on the classifier reduces training time.
No Free Lunch Theorem suggests that under a uniform distribution over induction problems (search problems or learning problems), all induction algorithms perform equally. Utilizing many methodologies, the suggested approach performed well and the search algorithms used in this research may perform poorly for one set of goal functions but effectively for another set. he results observed in the proposed work perform better with the parameter setting of the optimization algorithms used.
From the results, it is evident that the boosted classifiers performed comparably to other state-of-the-art algorithms. The performance of these boosted classifiers may be enhanced by hyperparameter tuning, which updates the parameters of each of these boosted classifiers and yields a learning model with high performance. The performance of the proposed work was compared to that of current algorithms for feature selection. When compared to other classifiers, Table 17 illustrates that the proposed approach performed well in terms of accuracy. The performance of the classifiers RF, CART, SVM, and K-NN has been compared. Among the datasets used in this proposed work, the SWD dataset performed much better for all the boosted classifiers.
In this work, a novel classification framework for the diagnosis of heart disease is proposed. In the proposed work, the data pre-processing subsystem uses a non-parametric imputation method using the missForest imputation strategy. The feature selection is performed in the first step by a filter approach in which the FCBF is used. The selected features from the filter approach are passed to two wrapper-based algorithms namely ASO, and HGSO with the fitness function as the combination of accuracy, G-mean, and MCC measured by the SVM classifier and the best features are selected by performing the union operation. The selected features are used to train four boosted classifiers, namely XGBoost, AdaBoost, CatBoost, LightGBM. The overall performance metrics considered in this work are in terms of Accuracy, Precision, Sensitivity, Recall, and F1- Score. The overall performance is evaluated and compared with the traditional classifiers namely RF, CART, K-NN, and SVM. The imputation of missing values can be done by replacing the Random Forest tree with other boosting trees namely XGBoost, and Catboost or LightGBM can be considered as a future scope. The implementation of the latest state of-the-art wrapper-based feature selection approaches can also be considered a future study. The proposed work is concentrated on binary classification and as a future scope, multi-class classification can also be considered and also the proposed approach can also be used for high-dimension datasets and time-series datasets.