
Abstract
Anomalous event recognition has a complicated definition in the complex background due to the sparse occurrence of anomalies. In this paper, we form a framework for classifying multiple anomalies present in video frames that happen in a context such as the sudden moment of people in various directions and anomalous vehicles in the pedestrian park. An attention U-net model on video frames is utilized to create a binary segmented anomalous image that classifies each anomalous object in the video. White pixels indicate the anomaly, and black pixels serve as the background image. For better segmentation, we have assigned a border to every anomalous object in a binary image. Further to distinguish each anomaly a watershed algorithm is utilized that develops multi-level gray image masks for every anomalous class. This forms a multi-class problem, where each anomalous instance is represented by a different gray color level. We use pixel values, Optical Intensity, entropy values, and Gaussian filter with sigma 5, and 7 to form a feature extraction module for training video images along with their multi-instance gray-level masks. Pixel-level localization and identification of unusual items are done using the feature vectors acquired from the feature extraction module and multi-class stack classifier model. The proposed methodology is evaluated on UCSD Ped1, Ped2 and UMN datasets that obtain pixel-level average accuracy results of 81.15%,87.26% and 82.67% respectively.
Introduction
Anomaly is cited as any deviation from usual behavior, uncommon observation, surprises, or outliers in different domain applications. Recognizing abnormal events is a difficult issue because of the differences among classes. Humans can conduct recognition based on their common sense. On the other hand, machines can identify such cases based on the characteristics learned using machine learning and deep learning. Anomaly detection is rich in various domains such as cyber-security, credit card fraud detection, and military surveillance while in medical imaging it plays a critical role as specialized doctors need to detect anomalies in routine behavior to diagnose the disease and reach a logical conclusion. Thus, every domain has different anomaly measuring scales and is defined as any data that deviates from normal behavior in that domain being categorized as anomalous. Therefore, it makes necessary to use computer vision that automates anomaly detection. This paper focuses on local unusual detection that incorporates different comprehensive anomalies such as the occurrence of various vehicles in the pedestrian park to that of a single abnormal entity such as a sudden moment of persons in various directions in an outdoor event etc. Most of the studies have used artificial neural networks for binary classification but did not provide a possible solution to differentiate the type of anomaly that uses instance segmentation. The proposed methodology aims to learn spatiotemporal features and provide a localized prediction for multiple anomalous classes in video datasets.
Importance of anomaly detection in crowd analysis
For global security concerns, there is a need for an effective surveillance system in public places like railway stations, shopping malls, hospitals, military zones, banks, public squares, etc. Due to the increase in city population collective motion of crowds is more common in public places. This increases the chances of crowd stampedes and terrorist attacks which is a huge challenge to public security management. Efforts are being made to design a system capable of learning normal and abnormal events in a context-specific manner. A system that can identify all kinds of abnormal events is not feasible due to the rarity of uncommon events. Therefore, a particular solution is needed that focuses only on a specific object or event. To solve these issues the simplest approach is to train machines on usual objects. The unsupervised approaches are well-performing if events of the normal scene remain the same all the time and anomalous events differ drastically over time while their approach generally results in high positive false alarms.
Video capturing devices are more affordable but analysis of footage is sometimes not cheap and it is commonly found that human resources suffer boredom and fatigue resulting in a decrease in reliability due to poor monitoring. For global security concerns, there is a need for an effective surveillance system in public places such as railway stations, shopping malls, hospitals, military areas, banks, public squares, etc. It is important to distinguish the type along with the direction of anomalous activity. We develop a model that differentiates the multiple unusual objects with localization of instances using multiple instances of gray-level mask images.
In Figs. 1 and 2 we have used a different color label for each anomalous instance in the video frame that helps form multi-level instance masks for training video frames.
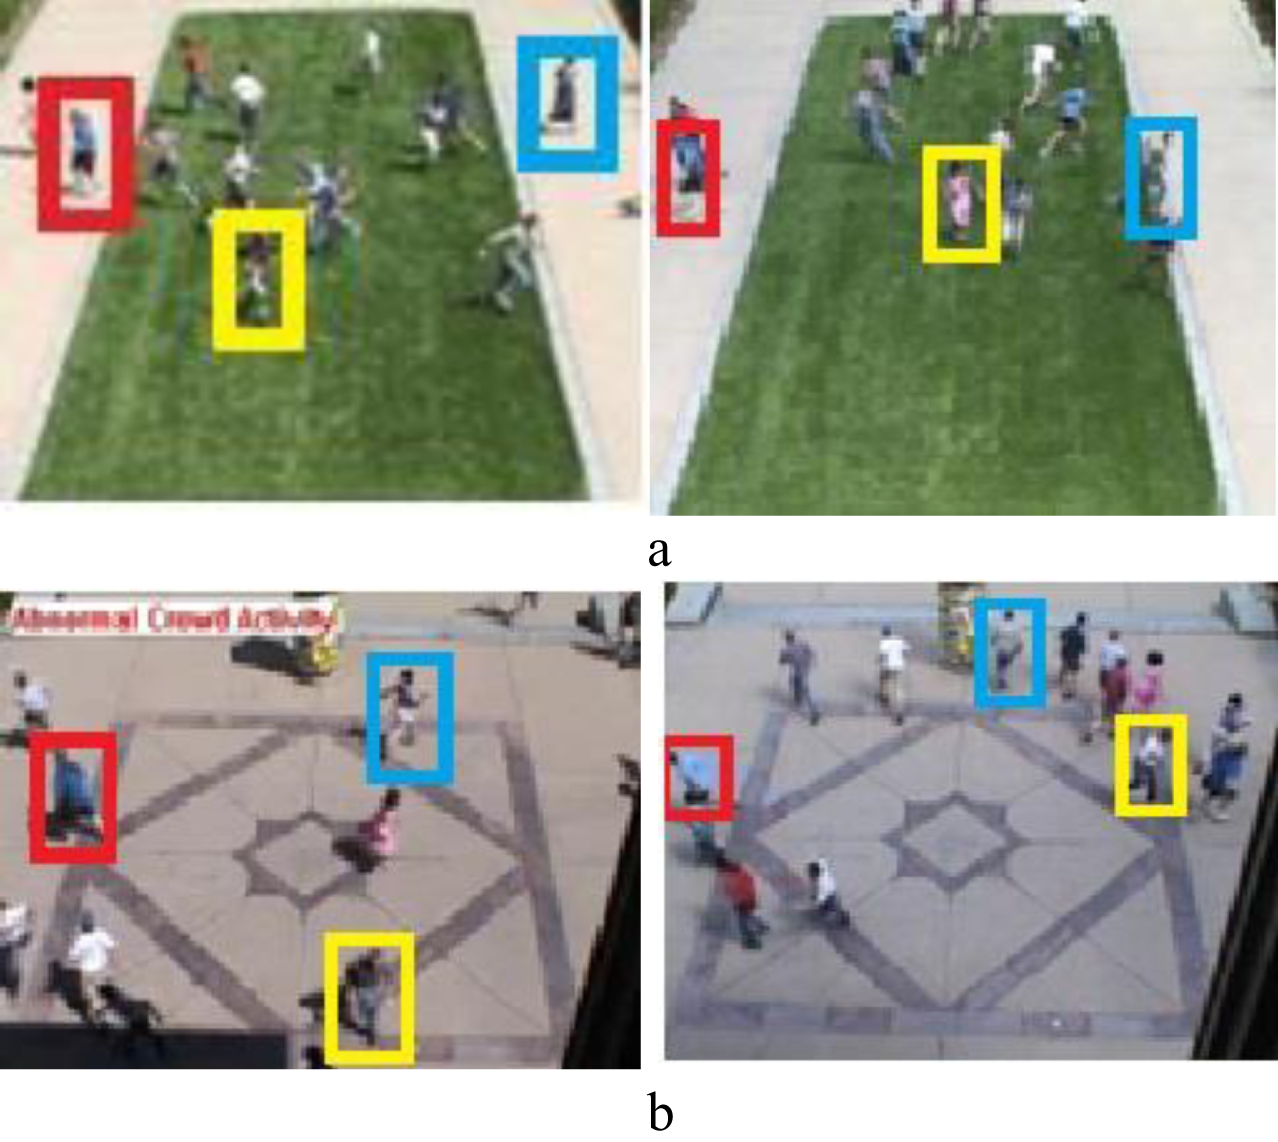
Examples of anomalous video pictures from the UMN dataset in (a) and (b), where individuals moving in separate directions are depicted by distinct colors.
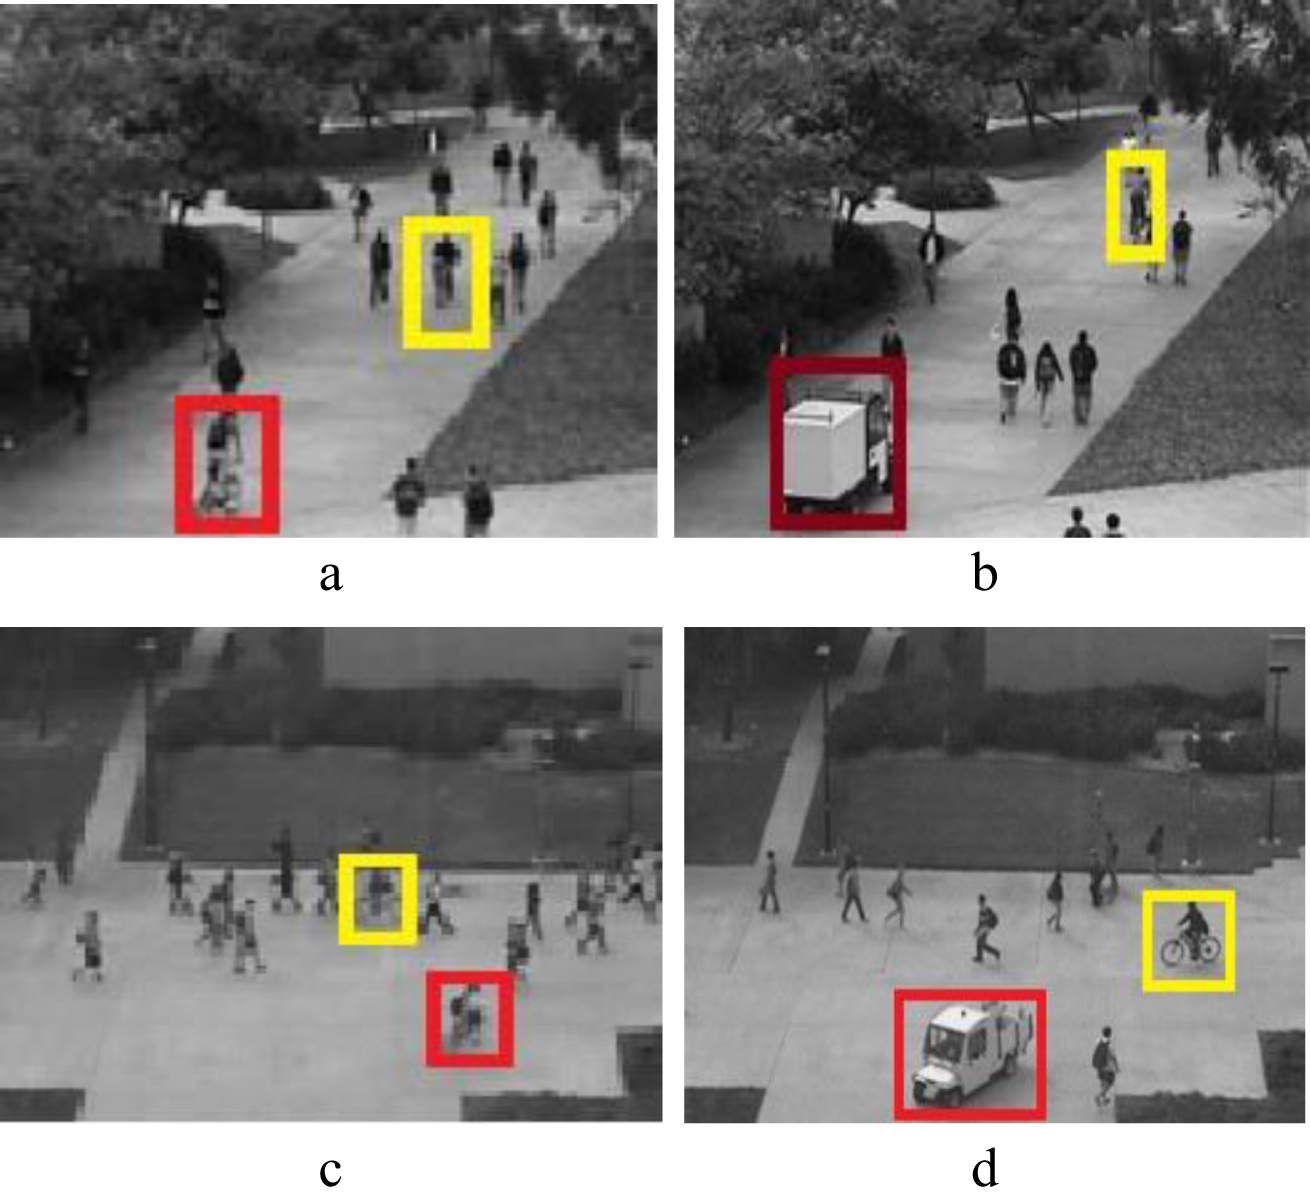
Example of abnormal video images in UCSD ped1 dataset where each abnormal object is shown by separate colors a) Two anomalous vehicles(bicycles) in the pedestrian park b) Anomalous objects: Truck and bicycle in the pedestrian park c) Anomalous event as two bicycles in UCSD ped2 dataset d) Truck and bicycle anomalous vehicles in the pedestrian park.
Classification through conventional techniques and deep learning methods requires pre-processing including labeling, feature extraction, key feature selection, learning, and classification. Any incorrect feature selection can lead to the misclassification of classes. To improve the classification of anomalous activities we proposed a methodology that combines the advantages of both deep-attention networks that use deep convolutional features and the handcrafted feature extraction method. The attention model develops binary segmented mask images which are converted to multiple instance masks with different labels using boundary function and watershed algorithm. Multi-instance masks along with handcrafted feature extraction methods help to obtain better pixel-level classification and accuracy values than that of existing methods. We can also determine the ROC value of each unique anomalous occurrence by utilizing multi-instance masks.
Deep Learning methods can automatically learn the feature sets for several tasks. The field of deep learning is having prominent research trends due to convolution neural networks and evaluation in the field of big data [1] as it finds the important traits without the need for human intervention which has various applications in the classification of plant diseases [2], object detection [3], medical image analysis [4] etc. Deep learning approaches are mainly classified as unsupervised, semi-supervised, and supervised learning. In an unsupervised method, no labels are required during the learning process, the layers in the network itself discover the relationship between the input data. Clustering is one of the most often used unsupervised learning techniques [5]. Supervised learning deals with labeled data in this technical data is generated from prior knowledge. In semi-supervised learning, the datasets are partially labeled. This technique requires a minimum amount of labeled data. It is a good method for text document classification. Convolution Neural Networks have high applications in computer vision [6] and in image recognition also, it has been determined to be effective. This led to the design of pre-trained multilayer neural networks which can extract a set of features at different levels which reduces the need for training convolution networks from scratch. In the proposed methodology we use pixel values, optical intensity, Gaussian filter, and entropy values to form a feature extraction module. Training images with their instance mask helps to determine features for the localization of outlier instances in the test video frame.
The novel contributions to this paper are as follows: This study introduces a novel framework that uses an attention U-net model that is trained only to focus on the anomalies and helps form a binary mask for the video frame. In which white pixels represent the anomaly and black pixels are the background. To form a more accurate binary segmentation we have eroded and dilated some edge pixels into objects based on border size. This forms a border region around the segmented objects. We have replaced the boundary pixel with a value of 127 which is other than 255. Further watershed algorithm assigns a different gray level color to each anomalous object with a boundary. In this way, we form an instance multi-gray level mask for anomalous objects in the video frame. Instance features are extracted using a feature extraction module. As each feature extractor parameter like pixel labels, entropy value, optical intensity, and gaussian filter values extracts different levels of semantic features. They do not provide the same classification results. Some feature provides a better result than others, it will be useful if we use all feature values to form a good feature extraction module. This forms the best fusion of feature values that improve instance segmentation results and localize multiple anomalies in video sequences. For the first time, a model has been prepared that is used to improve segmentation scores along with the classification and detection of multiple anomalous objects in video sequences. Our proposed methodology has better pixel-level classification values than that of state of art methods.
Related work
The role of video data from surveillance cameras has applications in human action recognition, loss prevention, managing employer activity, managing workflow, outdoor area security, suspicious behavior prediction in a parking place, abandoned object alerts, etc. [7]. Video management and interpretation are becoming quite capable in recent years. Anomaly detection in crowded places is difficult to handle as it involves group activity and several real-world constraints. Analysis of surveillance videos includes object recognition and classification of an identified item as normal or anomalous which uses a procedure similar to binary classification [8]. Anomaly detection approaches mainly have two categories: handcrafted feature extraction approaches and deep-learning approaches. In the handcrafted method, we first extract features as proposed in the framework(OF-ConvAE-LSTM) [9] where features; velocity and direction are obtained by dense optical flow and convolution autoencoder framework that regenerates dense optical maps to detect the normal and abnormal behavior. The author of [10] ua sed baseyian algorithm over the extracted edge point features that recreate points, and linear images are matched to show objects in the scene, and further to detect objects it used a clustering process over spatial points. The feature sets are common in computer vision and author of [11] used a histogram of gradients as a feature vector over the edges of the image thereafter binning the orientations and gradients into a histogram along with hypothesis verification as a new classification method. Author [12] used granules that are clustered to represent different size static object pixels and to depict moving object pixels, temporal granules are used. One of the important feature descriptors is Violence flow [13] which considers the comparison of spatial magnitude instead of temporal magnitude which helps in giving more information about the predecessor frame. Along with similar low magnitude. The author of [14] proposed low -level features-based motion improved weber local descriptor(MolWLD) algorithm with a sparse representation-based classifier. This algorithm has superior performance on three benchmark datasets.
In contrast to handcrafted feature-based methods, deep learning models have the ability of automatic feature learning which has enhanced human lives by providing accurate results. In recent years these models have had a critical role in the early detection of new coronaviruses(COVID-19) [15–17] which have become the most widely used technology for automatic corona identification and prediction utilizing chest X-ray images in hospitals worldwide. For video/image inputs convolution neural networks [18] are the most famous and commonly used algorithm that is similar to multi-layer perceptron(MLP) consists of a series of convolution layers that come before the pooling layers and fully connected layers. For the detection of abnormalities in crowded scenes author of [19] used the pre-trained fully connected network to transfer data into an unsupervised fully connected network that improves accuracy and speed. This model achieves AUC-EER of 90.2% and 90.4%. For learning anomalous behavior proposed method in [20] used background subtraction for extracting attention regions with bilateral filtering. These regions are fed to 3-D CNN for distinguishing normal or abnormal events that use binary classification. This methodology was tested on the UCF-crime dataset and attained an accuracy of 99.25%. For unsupervised anomaly detection paper [21] used a framework that combines edge image sequences with a convolutional autoencoder-convLSTM model and formed a binary classification hybrid model video anomaly detection which has a limitation of frame-level anomaly detection, the unusual items in those frames are not localized. To form a computationally efficient framework with reduced test and train time of RNNS author of [22] proposed a Single-Tunned Gated Recurrent Unit(GRU) for abnormality detection by discarding the heavy-weighted reset gates that overlook the past content by favoring current input that obtains an optimized single-gated cell model. This model is tested on CUHK Avenue [23], UCSD Ped1 and UCSD Ped2 [24] datasets. To form an integrated appearance and motion cues author of the paper [25] presents a Multivariate Gaussian Fully Convolution Adversarial Autoencoder (MGFC-AAE) model that extracts deep features along with an energy-based model is applied that obtains anomaly score with accurate detection and localization of abnormal objects. An ensemble approach is proposed in a paper [26] which extracts spatial features from a one-dimensional convolutional neural network followed by a stack bidirectional classifier that makes predictions for normal/anomalous events. To remove unnecessary details like dark-edge removal author of [27] proposed an anomaly detection technique using pre-processing of data augmentation technique where features were extracted using ResNet-50 model and fed to convolutional LSTM layer that produced output as binary classification of violence or non-violence label.
As most of the studies deal with abnormality detection in video sequences as binary classification problems. The author of [28] proposed the first approach that used abnormal detection as a multi-classification approach as it further classify the abnormality into its type such as Abuse, Assault, Explosion, Vandalism, Road Accident, etc. using a 3D convolution neural network framework.
In the proposed methodology we formulated a framework to localize multiple anomalies such as the sudden moment of persons in different directions, and multiple vehicles coming in the wrong direction in the pedestrian park. Applying boundaries around the segmented item and a watershed: in this scenario creates multi-instance mask images from binary segmented video frames by attention networks. Instance features are obtained through a feature extraction module which forms the base model that is ensembled with a multi-class stack classifier that classifies labels assigned to each instance. This enables us to locate the multiple anomalies in video systems.
Proposed methodology
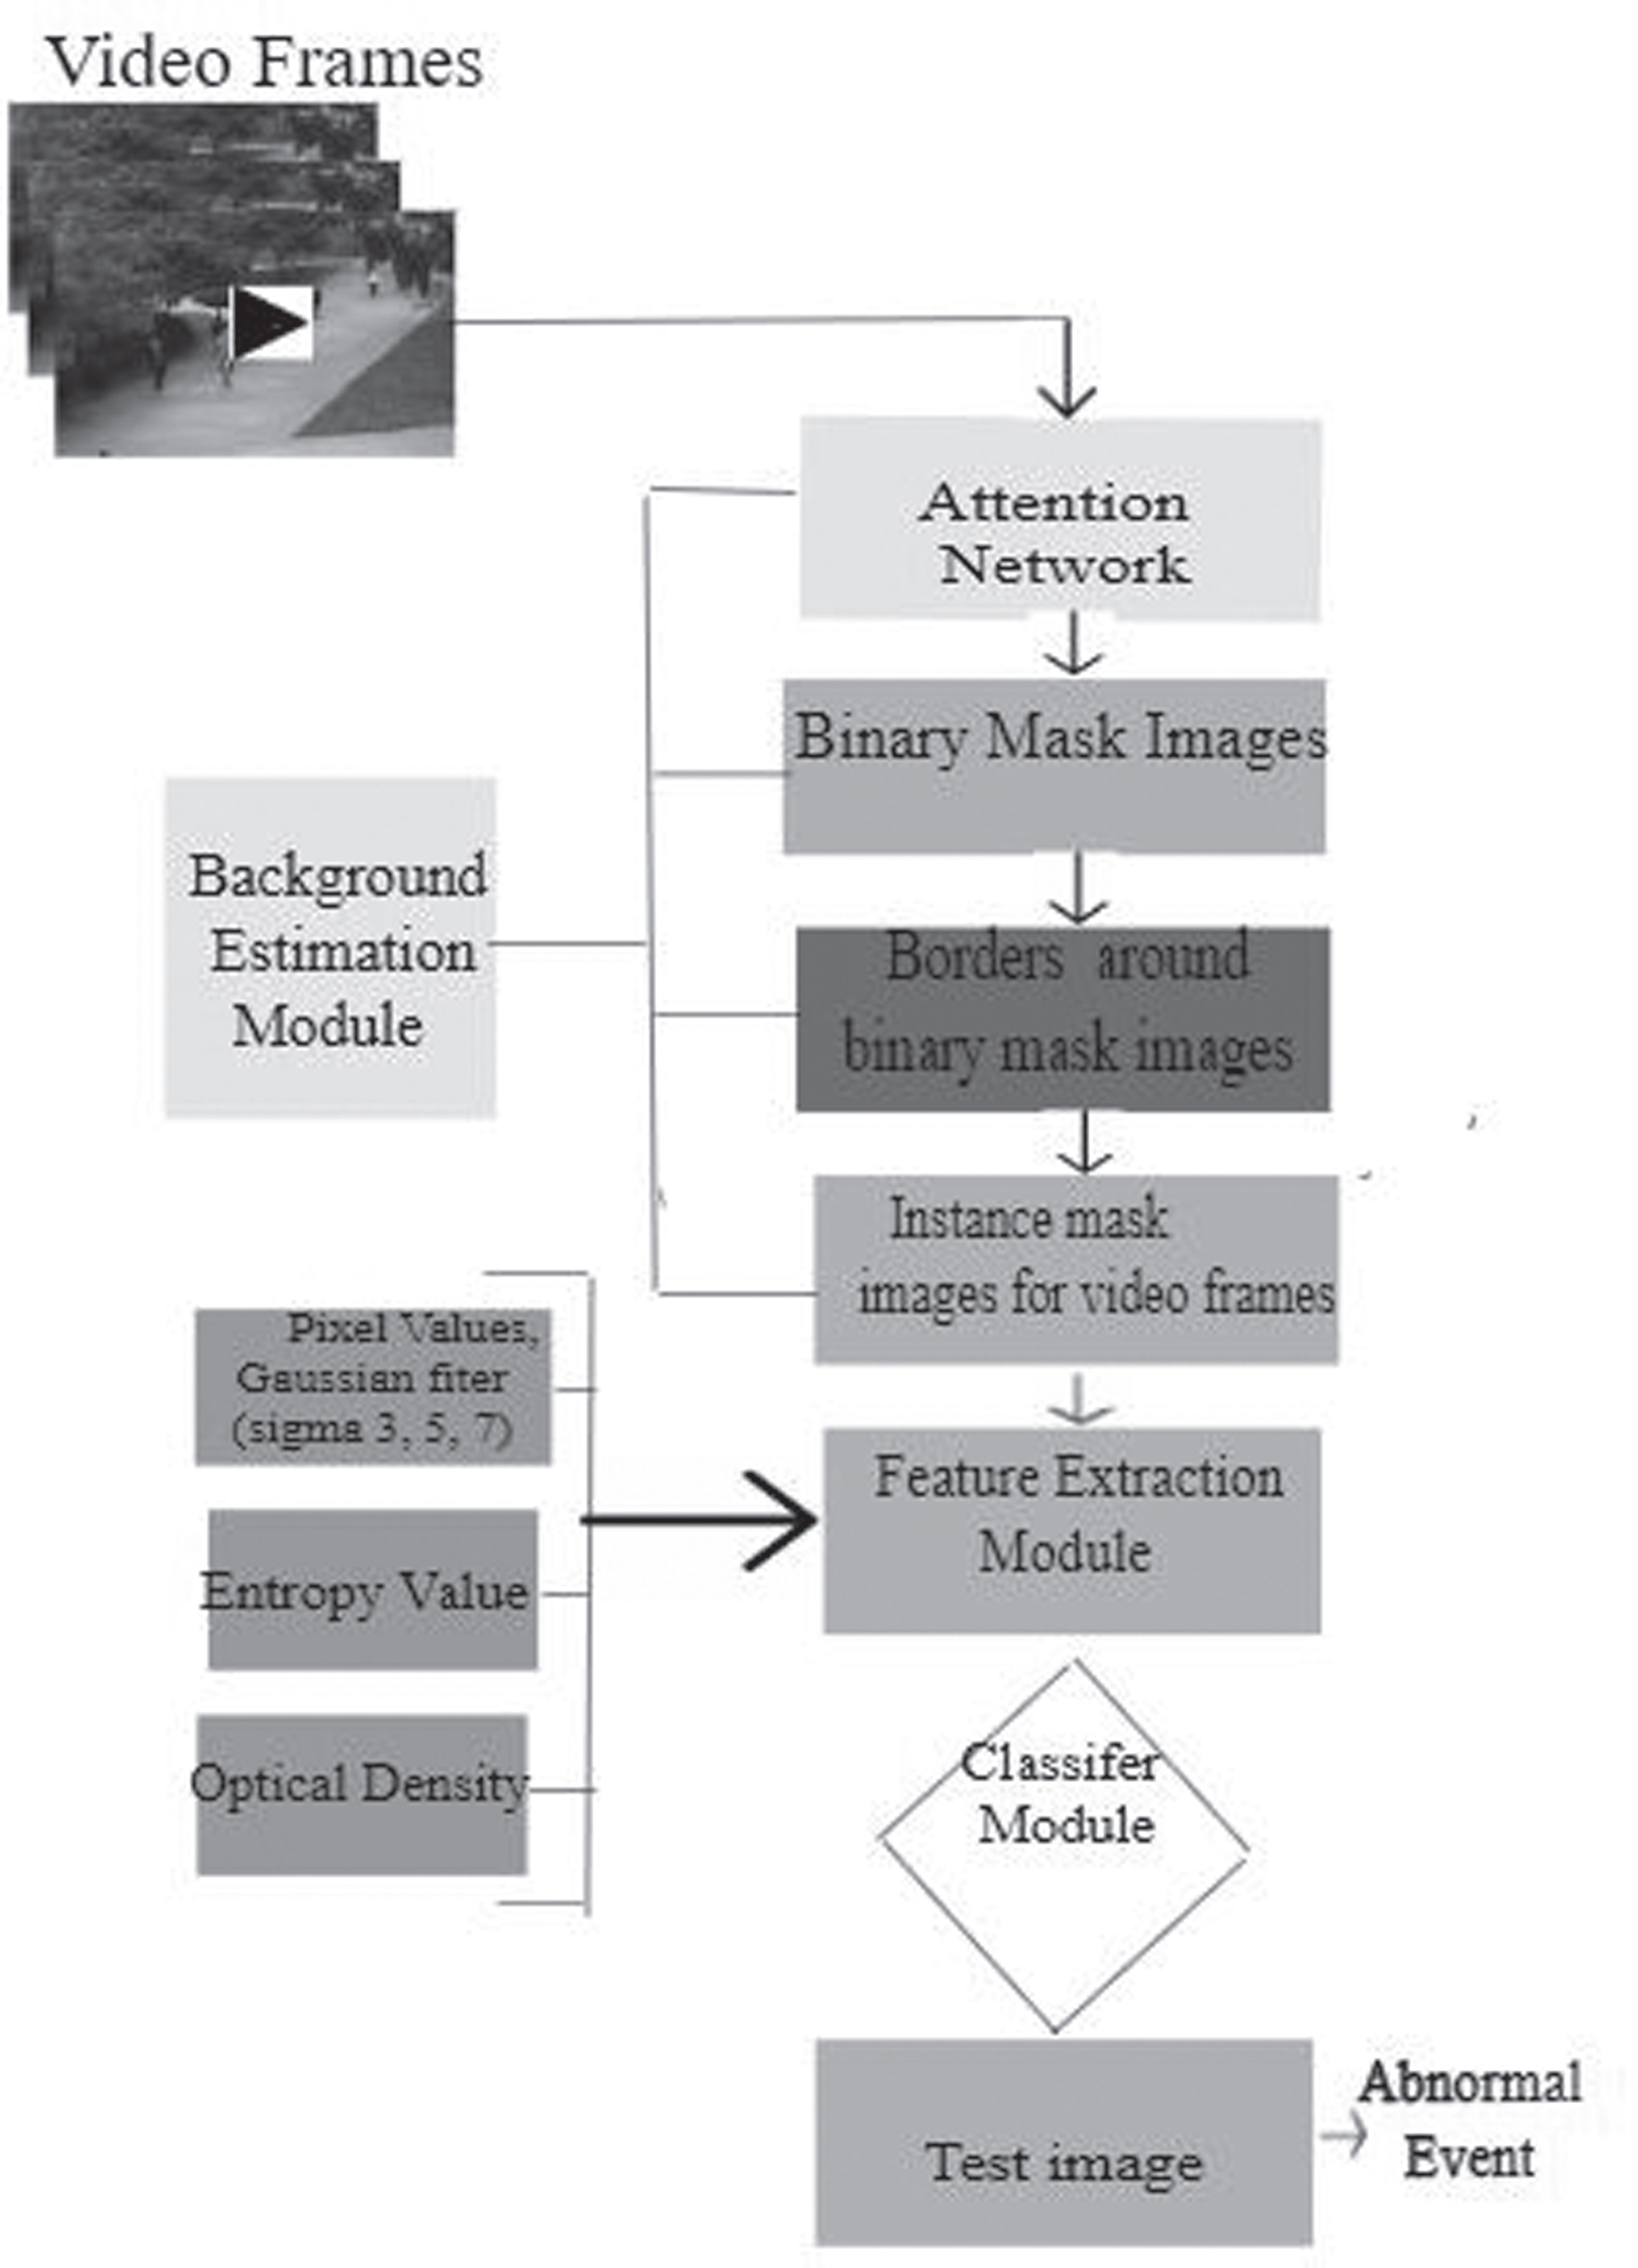
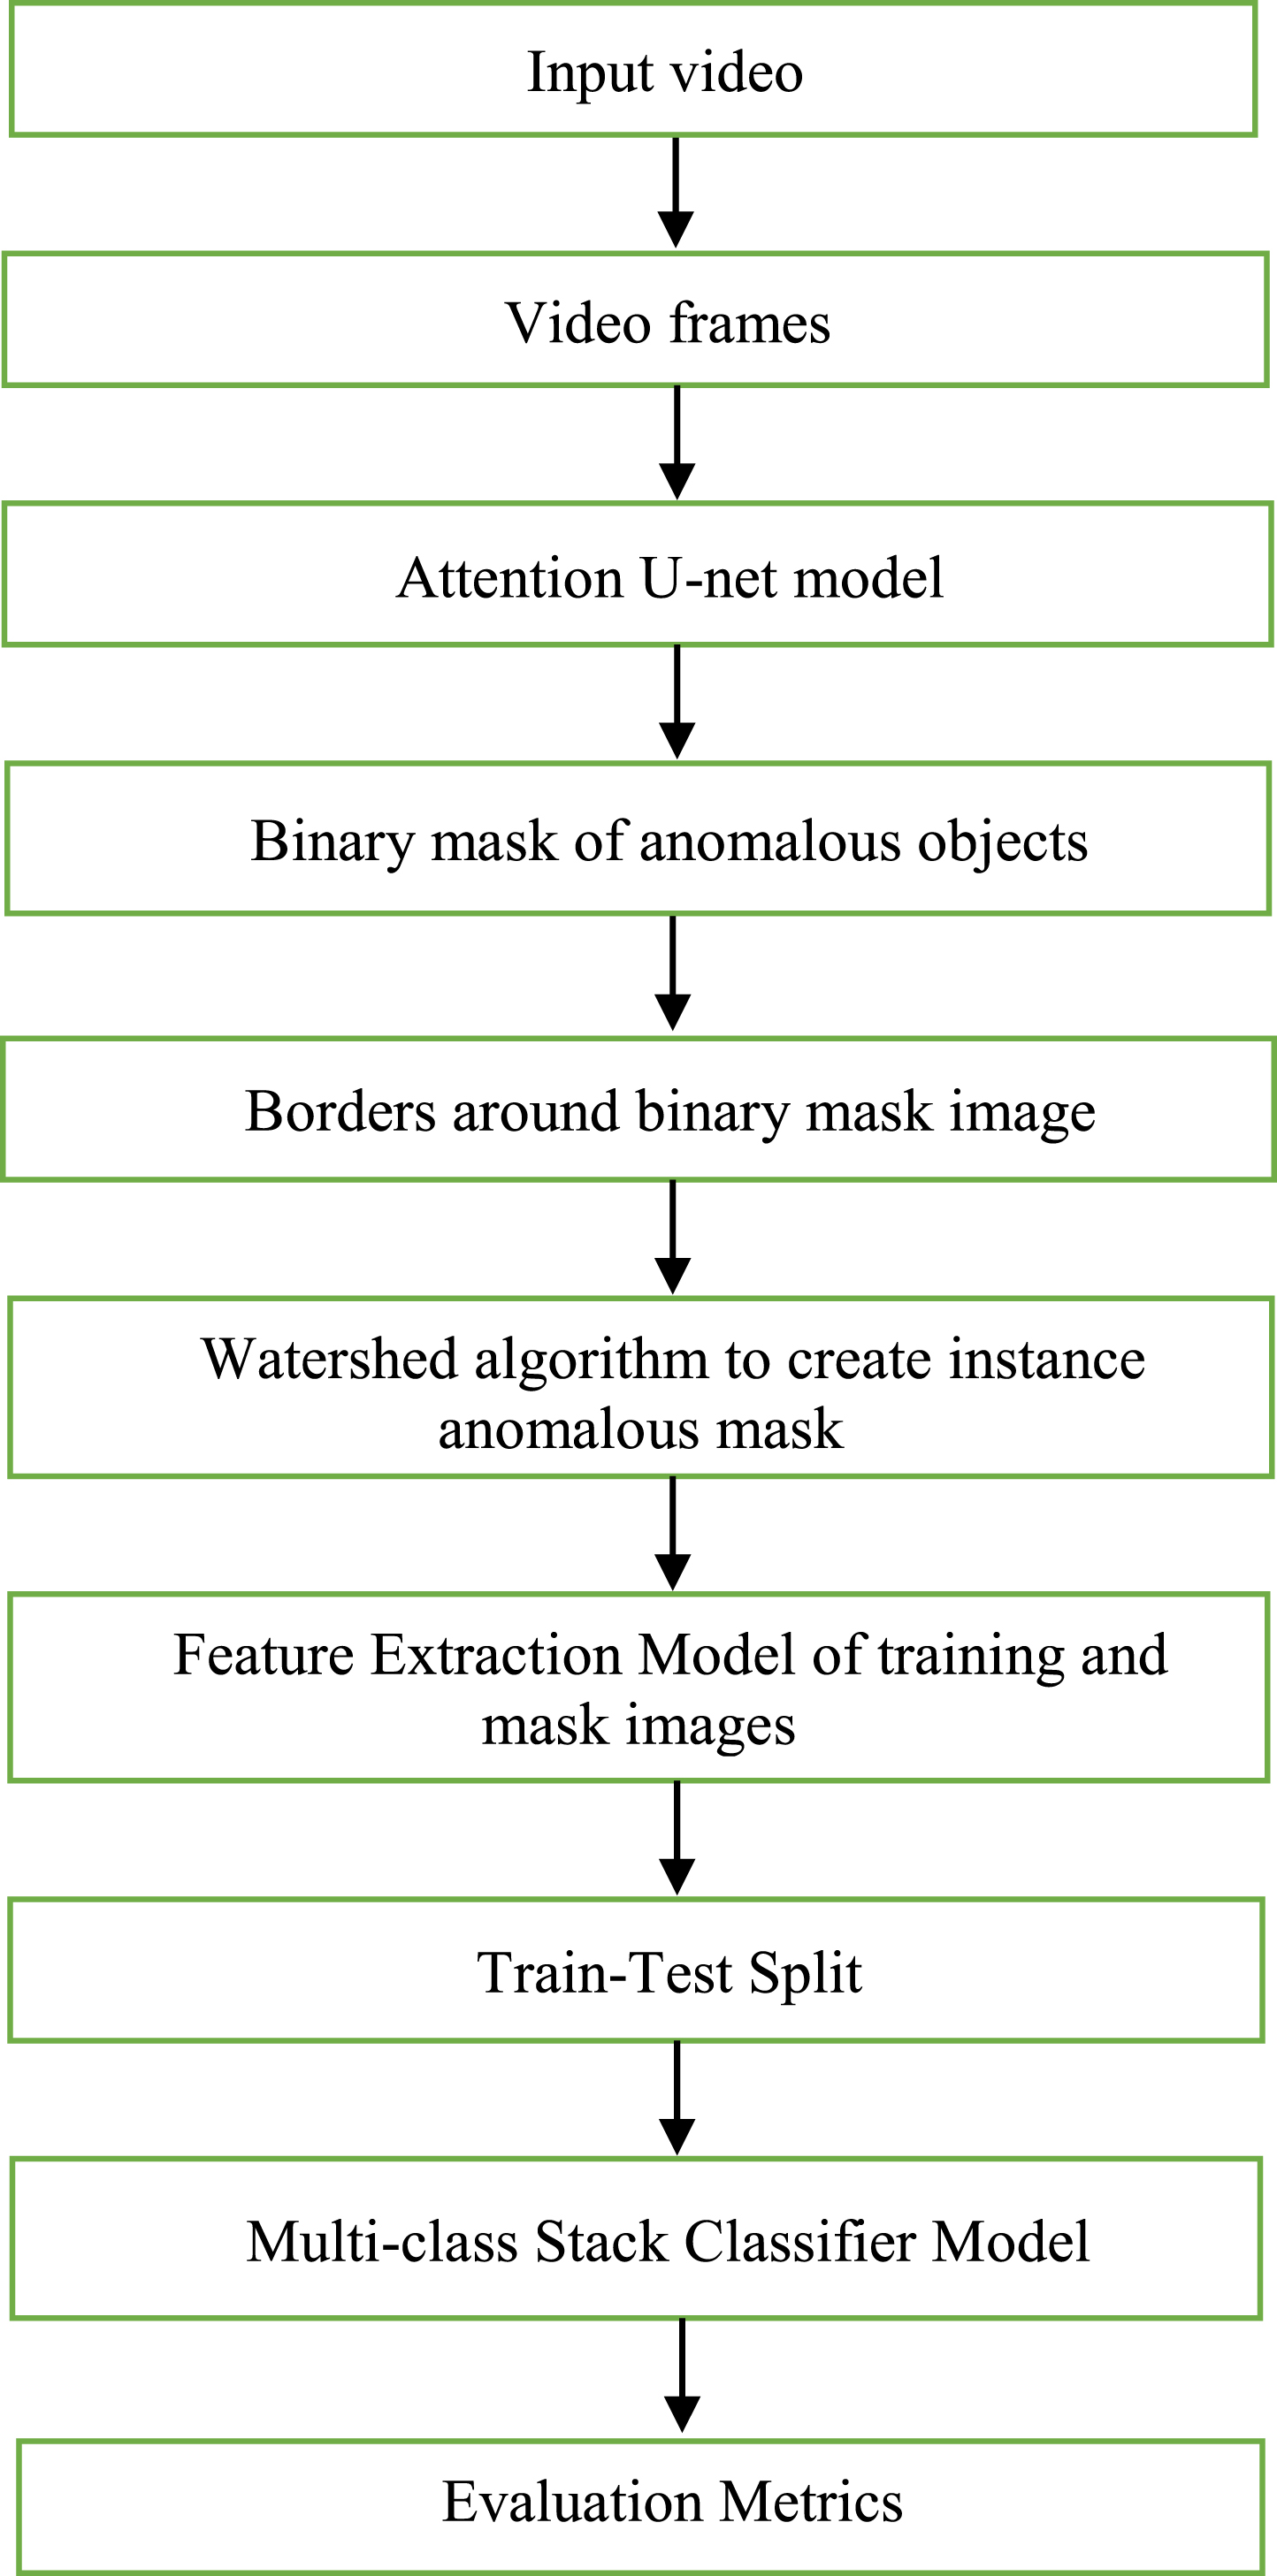
The proposed methodology is divided into three sections: (i)Pre-processing (ii) Borders around Binary mask (iii) Watershed Segmentation to obtain multiple Instance mask images(iv)Feature Extraction module (v) Segmentation and Classification.
Each step of the suggested technique is thoroughly explained in the sections that follow:
Pre-Processing
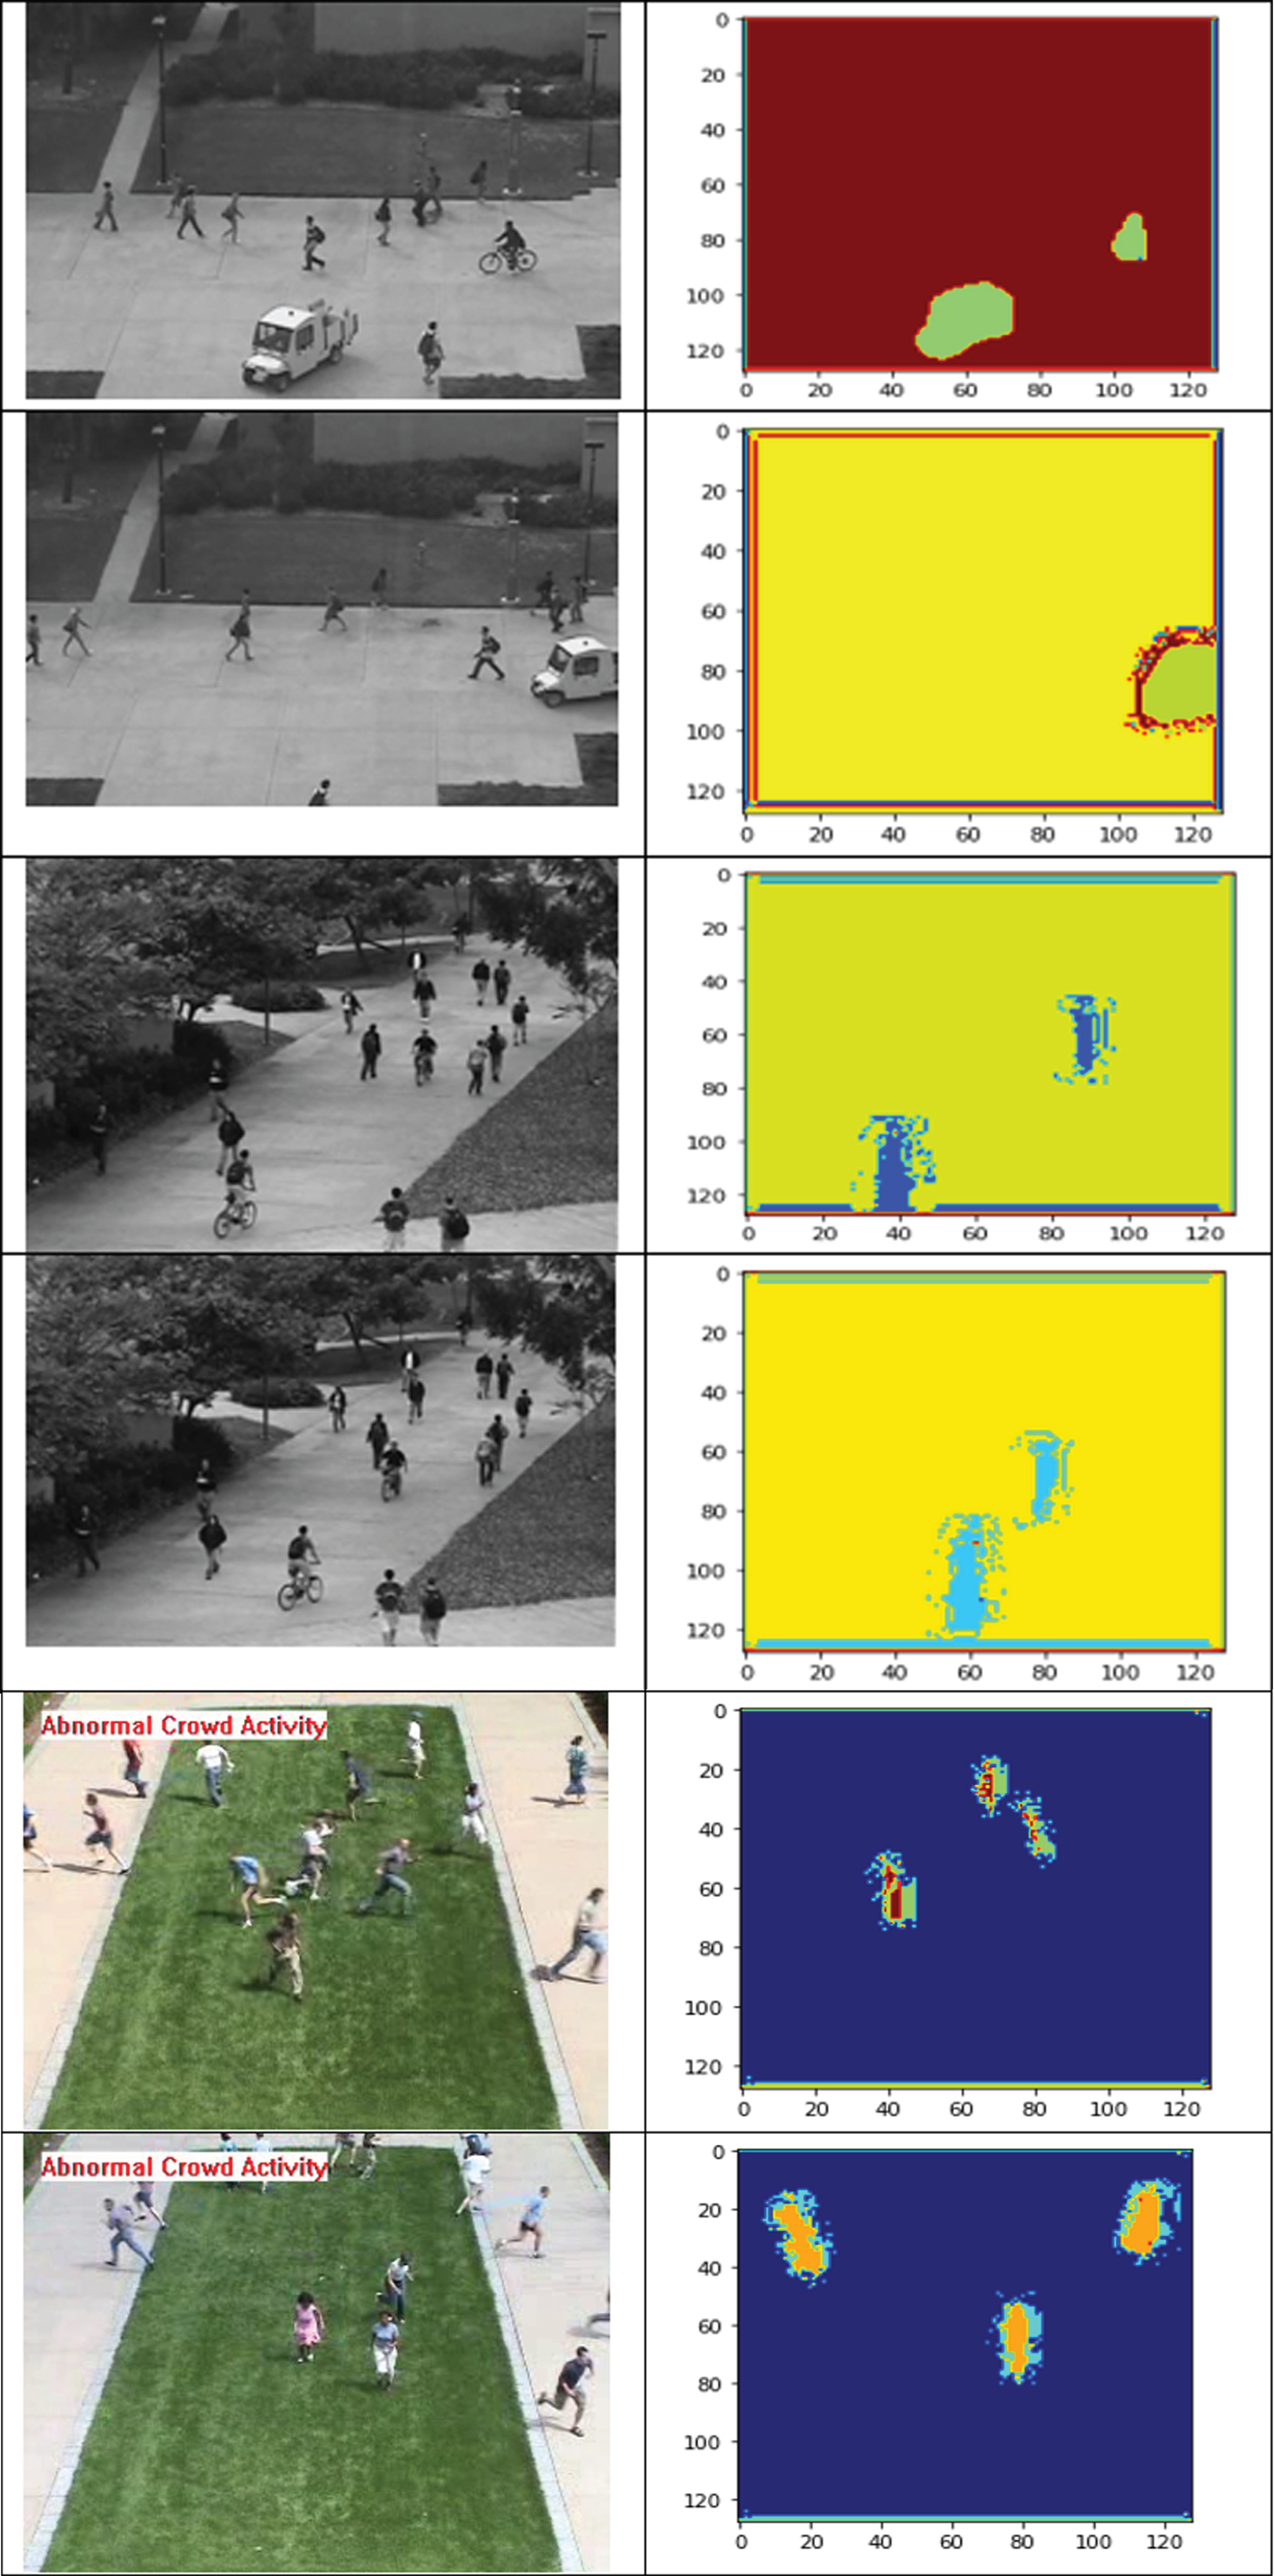
In pre-processing each video is divided into video frames and resized to 128×128 dimensions. All frames are normalized in the range of [0-1] which is helpful in model convergence We use an attention U-net model [29] that is trained to localize only on the anomalous instance and to highlight only the relevant activities during training. Figure 3(a, b) represents a binary segmented anomalous mask to the corresponding video frame where the algorithm can efficiently localize the anomalies such as four-wheelers and bicycles in a pedestrian lane.
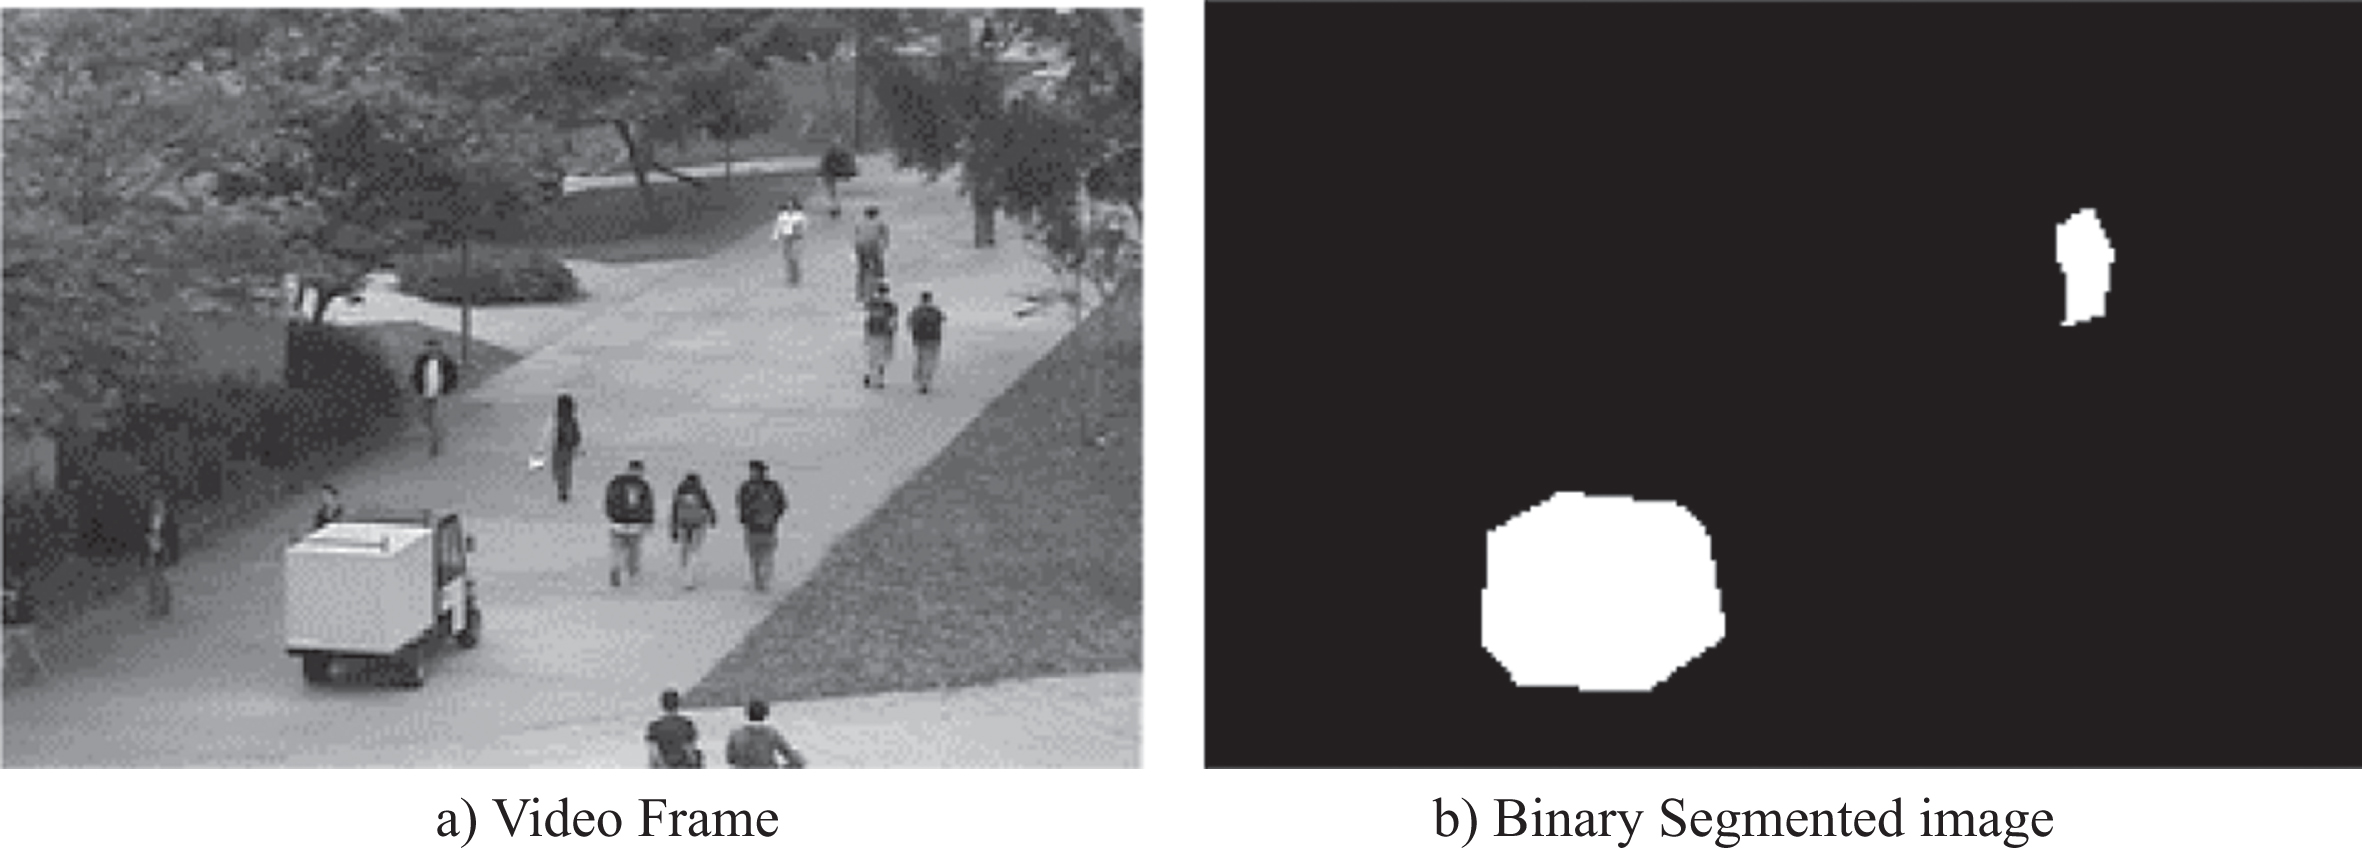
Represents binary mask of an input video frame.
Binary mask are created from video frames where the abnormal object is shown in white pixels and the background is black. We draw borders around the segmented anomalous object by eroding and dilating some edge pixels into an object and setting the border color different from 255 to 127. The resulting boundaries form closed and connected regions. After segmentation, the objects in the image are separated and labeled for further analysis. As most of the traditional methods form disconnected boundaries that result in bad segmentation results. Figure 4 (a, b) represents distinct borders around the mask images where white pixels represent an anomalous object and black pixels as the background.
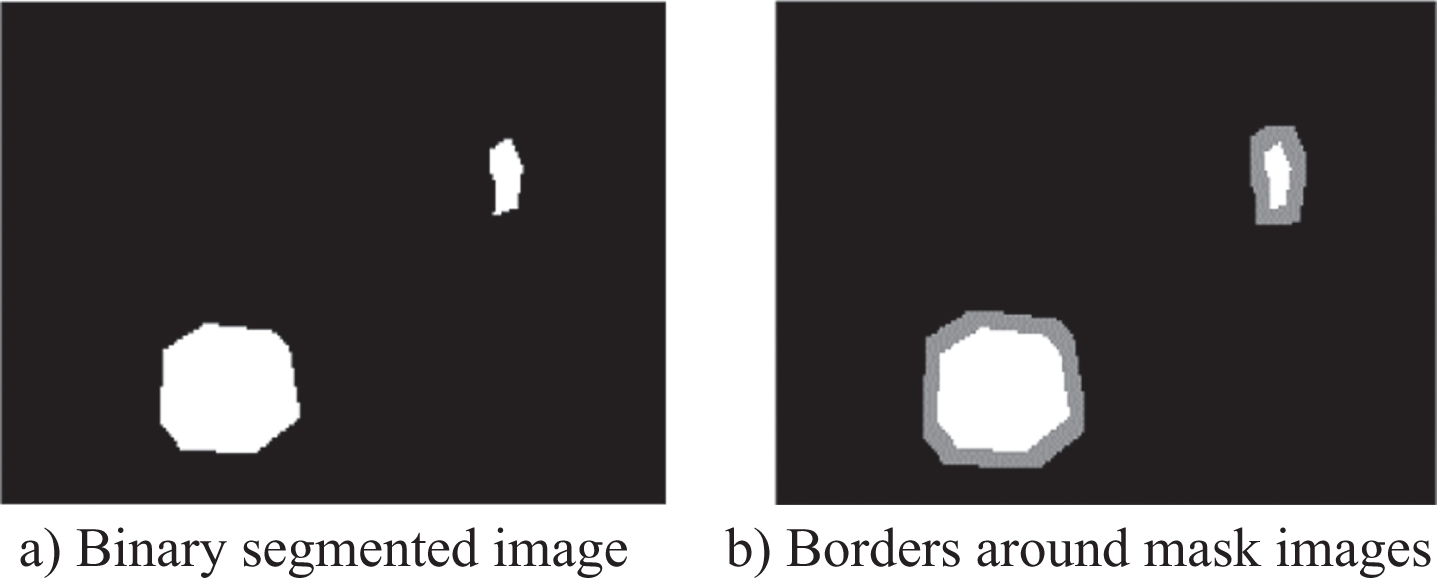
Borders around the corresponding mask images.
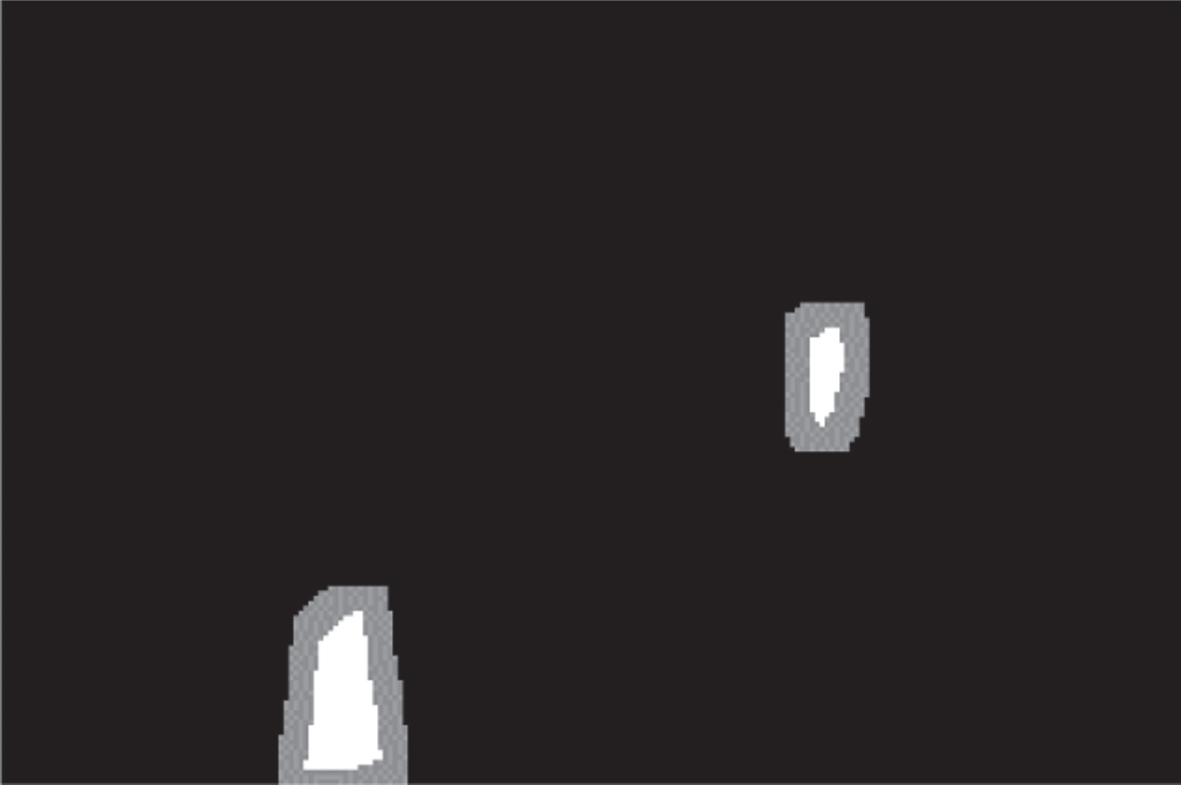
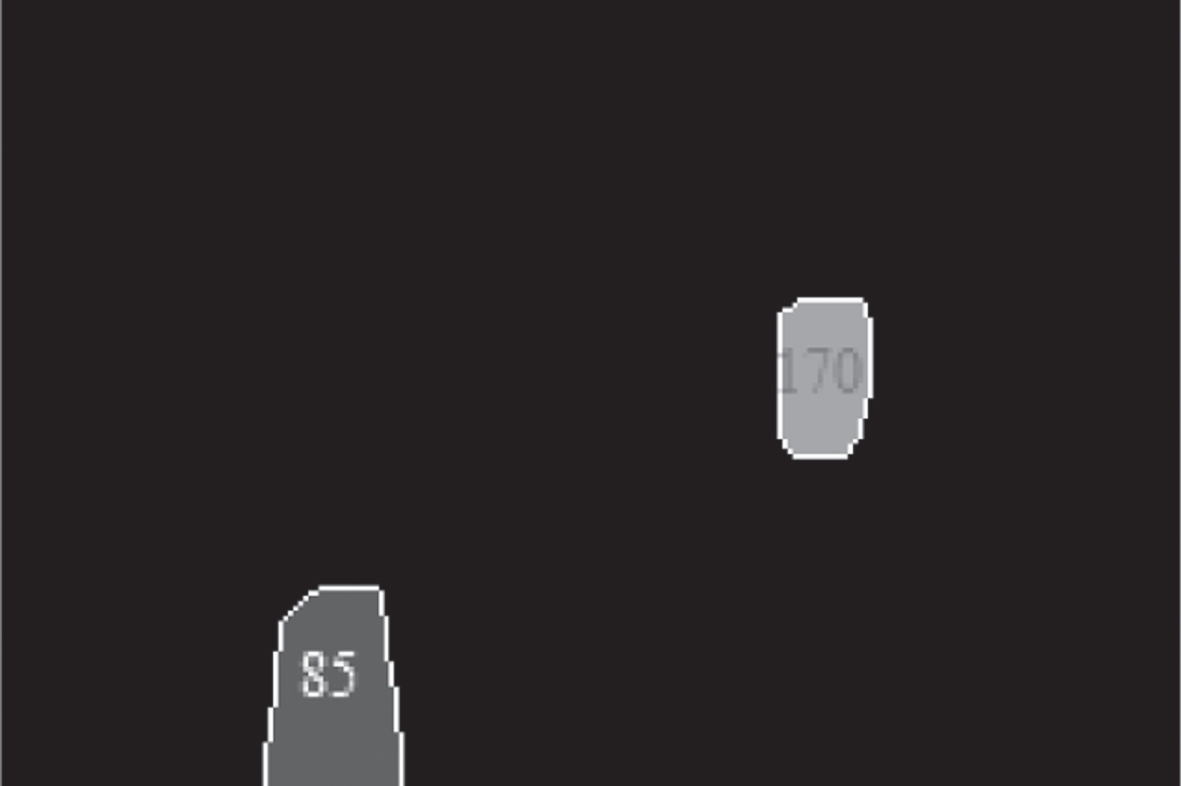
A watershed algorithm is applied with distance transform that uses pixel distance from every connected object that is black to the nearest white pixels. Border images help to form instance masks as each segmented object is treated as a separate instance and assigned a different label. This generates multi-level gray images which means mask images can take any value between 0 to 255, rather than having two distinct (i.e., Binary) values. This method is useful as masks detects anomalies separately and segment them.
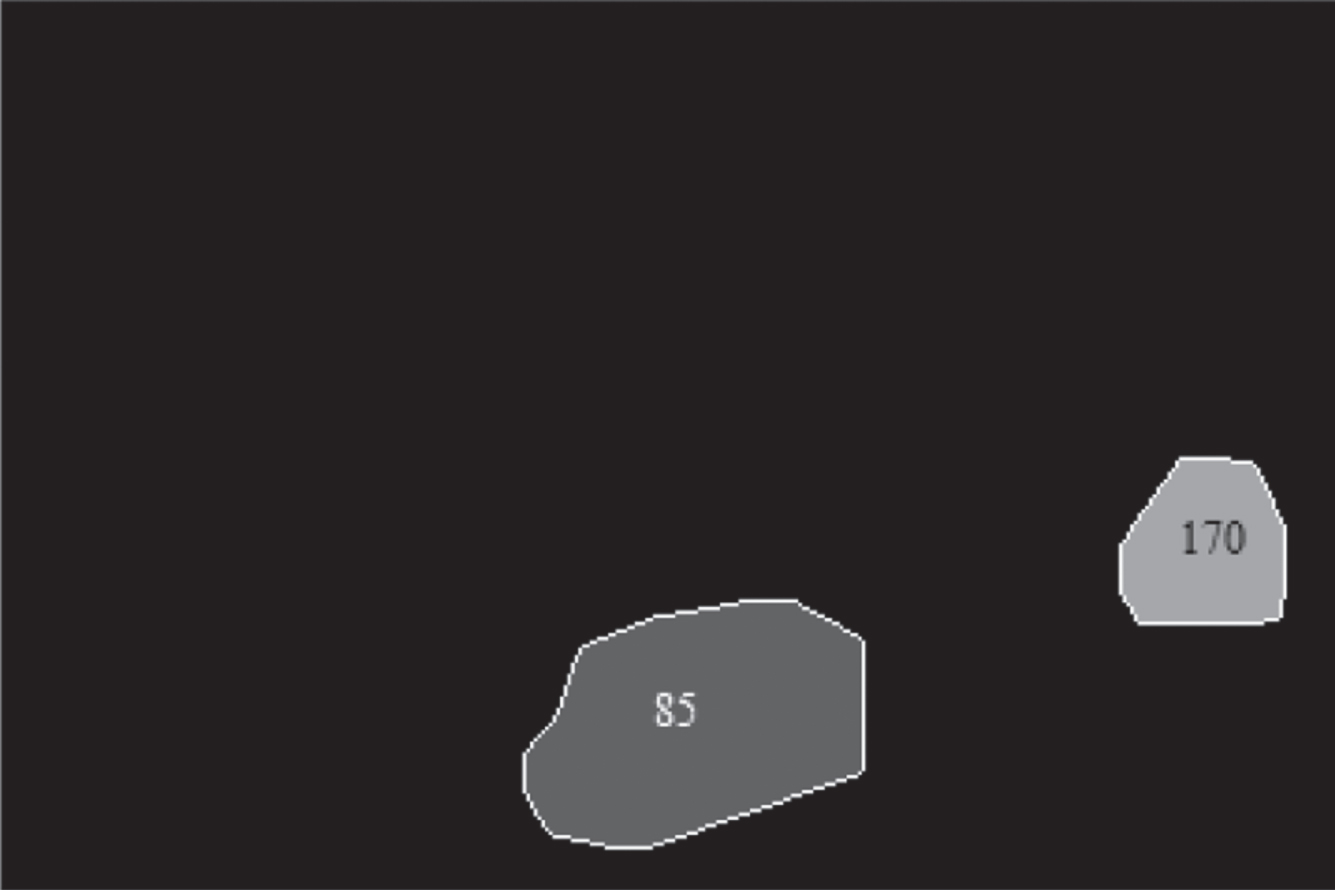
In Fig. 5(a, b) we have the two-segmented objects each labeled as 85 and 170 from watershed algorithm. These segmented objects sever as ground truth mask images for the feature extraction and classification analysis.
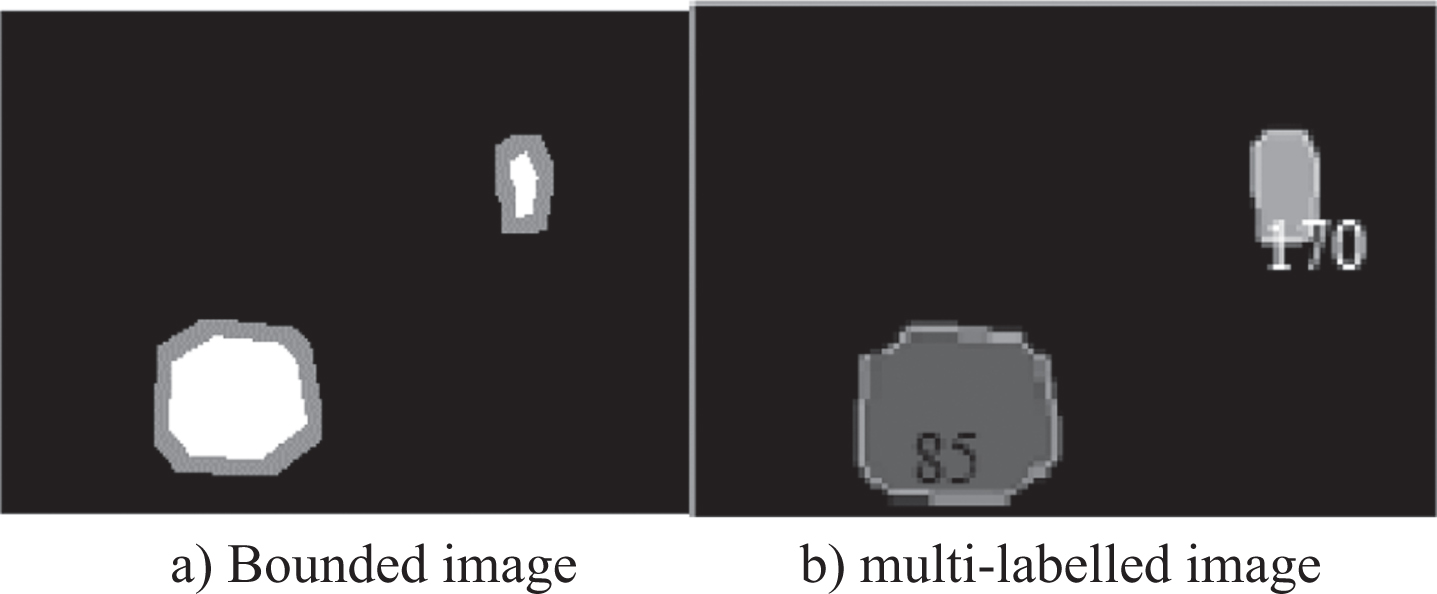
Shows a labeled multi-instance mask obtained from the bounded binary mask image.
In image processing features represents most relevant information in the form of patterns about the original image. Transformation of an input image into a set of features that defines shape of the input samples uniquely and precisely is called feature extraction. It is important to correctly choose the feature vectors as they are further used by classifiers to recognize the input samples. There are mainly four types of image features: a) Texture features: which include entropy, correlation, and energy b) Statistical features such as Pixel values, Kurtosis, mean, variance, root mean square, edges, and standard deviation. c) Geometrical features are area, perimeter, equivalent diameter, convex area, slope, and d) Color features are color moment, color histogram and average RGB and optical density.
In this work, firstly we use pixel values of an input image as features. As in computers images are stored in the form of a matrix of numbers and these numbers are pixel values. Texture features, and statistical features are primarily employed to extract descriptors of an input video frame.
Along with pixel features, Gaussian filters are added with sigma 3, 5 and 7 as input features. The two-dimensional Gaussian function is represented by Equation 1
Where G (x, y) represents the Gaussian function in horizontal and vertical directions. Sigma (σ) is the standard deviation of the distribution that controls randomness. We used two values of sigma for feature extraction.
Entropy is the measure of randomness in the texture of an image and measures uncertainty in the information source given by Equation 2
E (I) represents the entropy of the original image I. p
i
is the probability of occurrence of value i in an image. We also added entropy as a video feature descriptor to describe a more quantitative analysis of an image. To improve the performance of classification we incorporated Optical density for each pixel (i,j) in feature analysis as defined by Equation 3
Where I xy is the intensity value of the pixel and I o is the average intensity.
Ideal features represent the intrinsic contents of the image. It is a crucial step for multimedia processing. Feature vectors are necessary to achieve classification accuracy. After obtaining features of training images. The next, step is to segment the input test labels. Labeled mask images with video frame features are input to the classifier model that classify and segments different labels in video frames. We form a feature extraction model of training images with their instance mask images and saved this model using the ‘pickle’ module of Python so that this model can be further loaded when required for segmentation and classification analysis.
Segmentation is the process of partitioning an image into various segments to change its representation and present it in a more meaningful and easier way that makes the analysis easier for image processing tasks. In the proposed methodology for segmentation and classification of multiple classes, we used a multi-class stack classifier model that uses Random Forest with Knn classifier. This forms an ensemble model that uses extracted features with a multi-class hybrid classifier model.
Figure 6 indicates the generalized diagram for detecting multiple anomalous instances in video frames that mainly uses multi-gray level mask images obtained from binary mask images which are used by the feature extraction model and instances are classified using the stack classifier model.
The generalized diagram of the proposed methodology.
For a more detailed description, we have represented the flow diagram of steps followed for instance segmentation of anomalous activity detection in Fig. 7
Represents a generalized diagram of the proposed methodology.
Steps followed for instance anomaly classification is summarized in the following steps:
Dataset description
The performance of the proposed methodology is evaluated on UCSD ped1, UCSD ped2 and UMN datasets. We selected the UMN dataset because it contains instances of people moving suddenly in various directions. Multiple anomalous objects can be seen in the video frames of the UCSD Ped1 and Ped2 datasets. We perform a pixel-level analysis for the experimental findings.
UMN datasets [30] have 11 videos with a resolution of 240×320. It is comprised of three scenes: a lawn, an interior, and a plaza. Each of these videos is about crowds at certain times. The escaping action of persons is abnormal behavior. As people move in different directions so one person can be taken as a reference for anomalous activity in that direction. In this paper, we take one person in a particular direction as the instance for anomalous activity. So, we have three different labels for three distinct directions. That forms a multi-anomalous instance classification problem.
The UCSD dataset [31] consists of video clips recorded from a stationary camera. In the normal scene, the video contains only pedestrians and abnormal events commonly include bikers, skaters, small carts, wheelchairs. The dataset has two subsets: Ped1 and Ped2. The Ped1 contains clips of 158×238 pixel resolution. The second “Ped2” have a spatial location of 240×360 pixels where the pedestrians move horizontally. Each video footage has 120–200 video frames. A total number of 34 videos in Ped1 and 16 videos in Ped2 are used for normal training. There are 36 test clips for the Ped1 dataset and 12 for Ped2. In this dataset, we considered videos where multiple anomalous objects occur such as four-wheelers and two-wheeler present simultaneously in video frames. This is considered as multiple anomalous instances in the video dataset.
Data preprocessing
For the UMN database and UCSD ped1, ped2 dataset. Each frame of the video gets resized to 128*128. To improve the classification and accuracy of an algorithm we normalize both training and test samples before feature extraction to reduce the impact of larger values on the smaller values of predictor values. This is achieved by dividing all pixel values by the largest pixel value which is 255. The whole dataset uses a train-test split of 80:20 ratios.
Proposed methodology implementation details
The training and assessment of the model were carried out on a personal computer running on an Intel (R) Core (TM) i7-10700 CPU @ 2.90 GHz and 32GB of RAM. Template implementations have been written in python 3.6, and TensorFlow 1.20 using the Anaconda Spyder Open CV-python tool.
Test settings and learning strategy
We split video frames into training and test datasets in an 80:20 ratio. Test images are classified using a stack classifier of Random Forest, Knn model. Random forest with n_ estimators equal 80, Random state is 42 and Knn classifier with several neighbors as 7.
Evaluation metrics
The detection efficiency of our framework is measured quantitatively by comparing the accuracy of the test dataset. As the proposed methodology is a multi-class classification problem. We used macro-average performance metrics for the evaluation of individual classes i|j = 0, 1, 2, 3. Here 0,1,2,3 represents the individual class. The effectiveness of our proposed classification task is examined using the receiver operating curve to determine its efficacy.
ROC-curve
ROC is a trade-off plot between False Positive Rate (FPR), True Positive Rate (TPR) and the area under curve metric (AUC). TPR and FPR can be calculated using Equations 4 and 5.
Where TP is True Positive, FP is False Positive and FN is False Negative. As it is a multi-class problem, we calculated the AUC value for each class.
The global mean absolute error performance metric for multi-class can be calculated by taking the absolute error performance of an individual class. Metric in Equation 6 is used for evaluating the mean absolute error of a model concerning a test set
The
The mean square error is given as the difference of the squares between predicted test samples and true test samples as in Equation 7
Where
As mean square error is good for learning outliers in the datasets while the mean absolute error is better for ignoring the outliers. We use a new loss function that lies between mean square error and absolute error which is Huber loss given in the Equation 8
Huber loss for actual function f (x) and predicted function y depends on the value of δ. Delta is the hyperparameter that defines a range of MSE and MAE. By controlling the value of we can plot a Huber error function that lies between mean absolute error and means square error.
To validate the performance of models, we use macro average-Accuracy, mean square error, mean absolute error, Huber loss and ROC metrics as evaluation parameters.
UCSD ped1 dataset
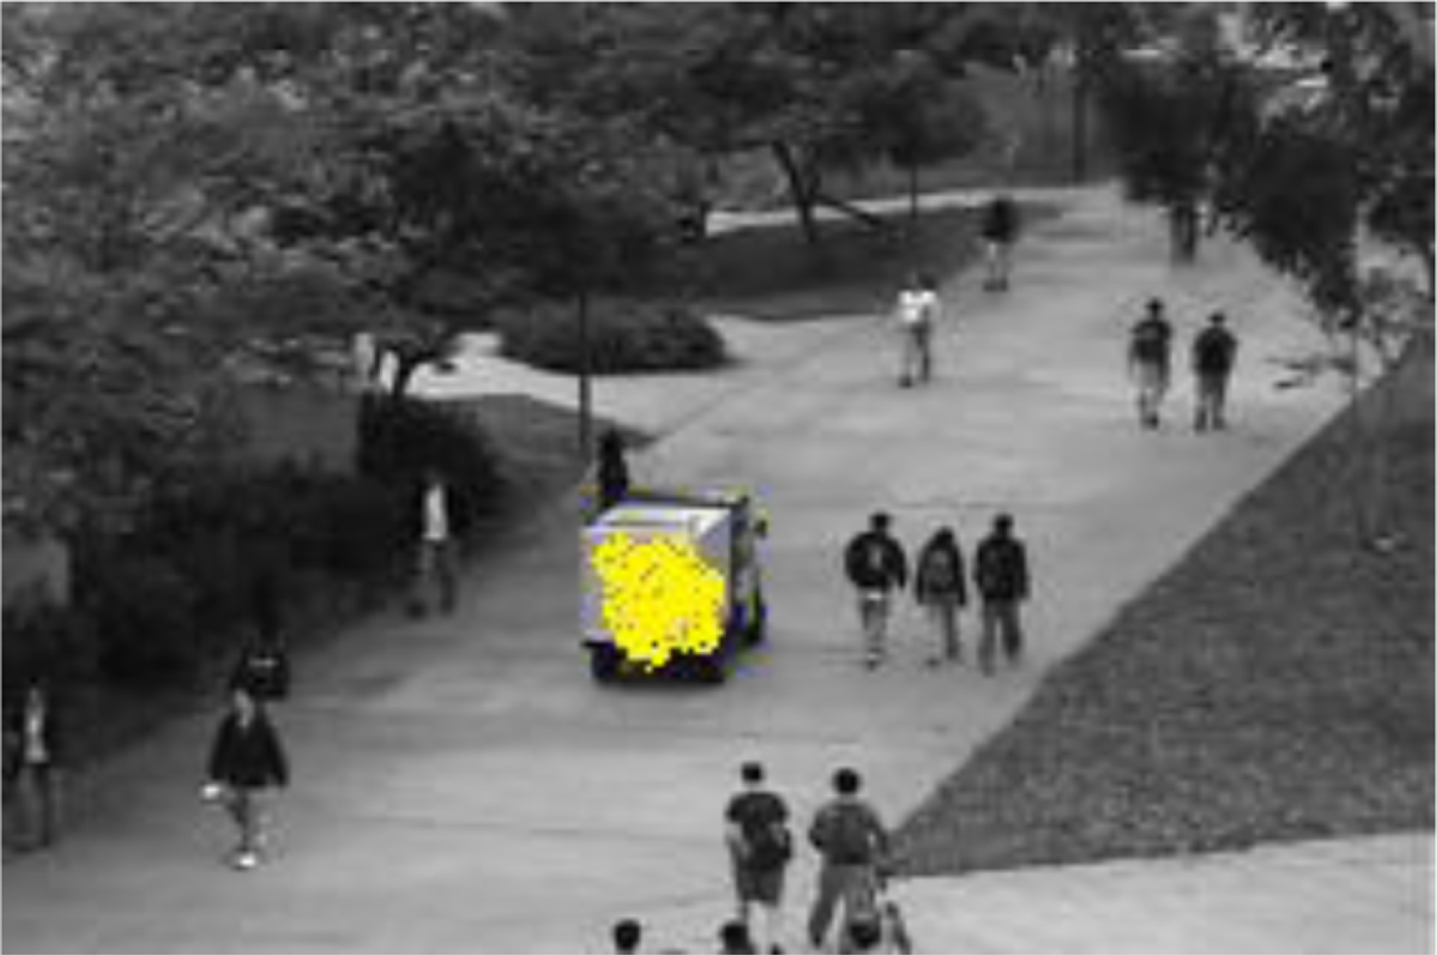
We test the performance of the proposed methodology for the multiple anomalous instances such as bicycles coming in different directions in the pedestrian park are shown by distinct color labels in Fig. 8:
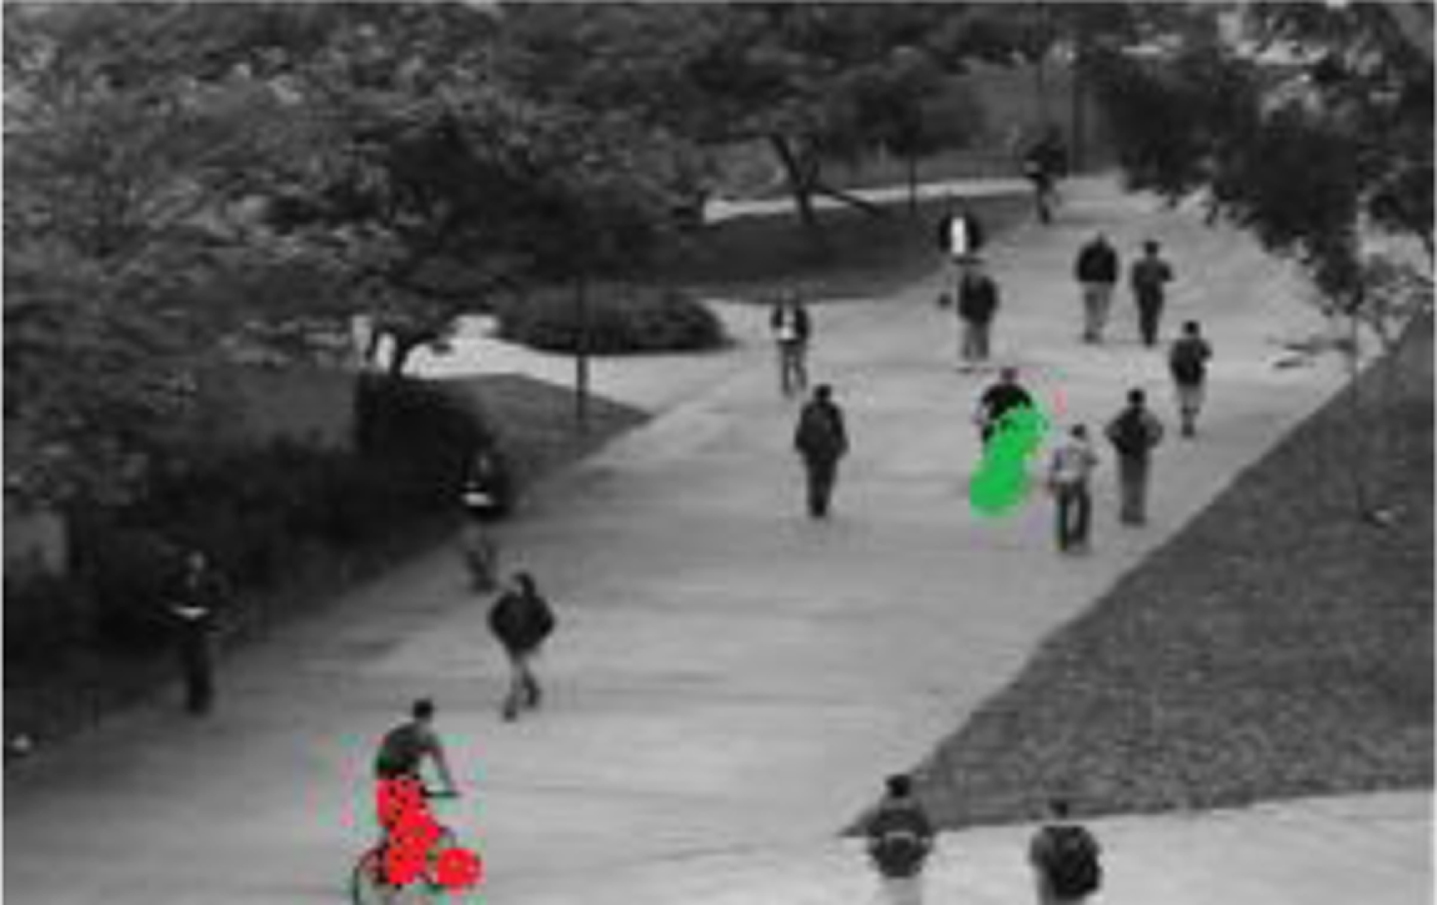
Anomalous instances(bicycles) highlighted by red and green color that indicates distinct color labels assigned to each outlier object.
We assigned different labels to distinguish anomalous object based on the direction in a video frame. This forms a multi-class problem in which we are also classifying the type of anomalies. From the attention U-net model, we obtained a binary mask where white pixels represent anomalies and black pixels as background.
On the binary mask image, the Border function draws boundaries around anomalous instances as in Fig. 9 which helps in obtaining multi-labeled mask images using the watershed algorithm.
Borders around the anomalous instances.
Figure 10 represents a labeled mask where one anomalous class has label 85, the second instance with label 170 and the third class is considered as boundaries around each anomaly that are labeled by value 255. In this way, each training frame has its own labeled mask that is used for the feature extraction module.
Labelled mask image.
A single anomalous instance in the video sequence of UCSD Ped1 is also labeled as shown in Figs. 11 and 12:
Represents one anomalous object in the UCSD Ped1 video frame.
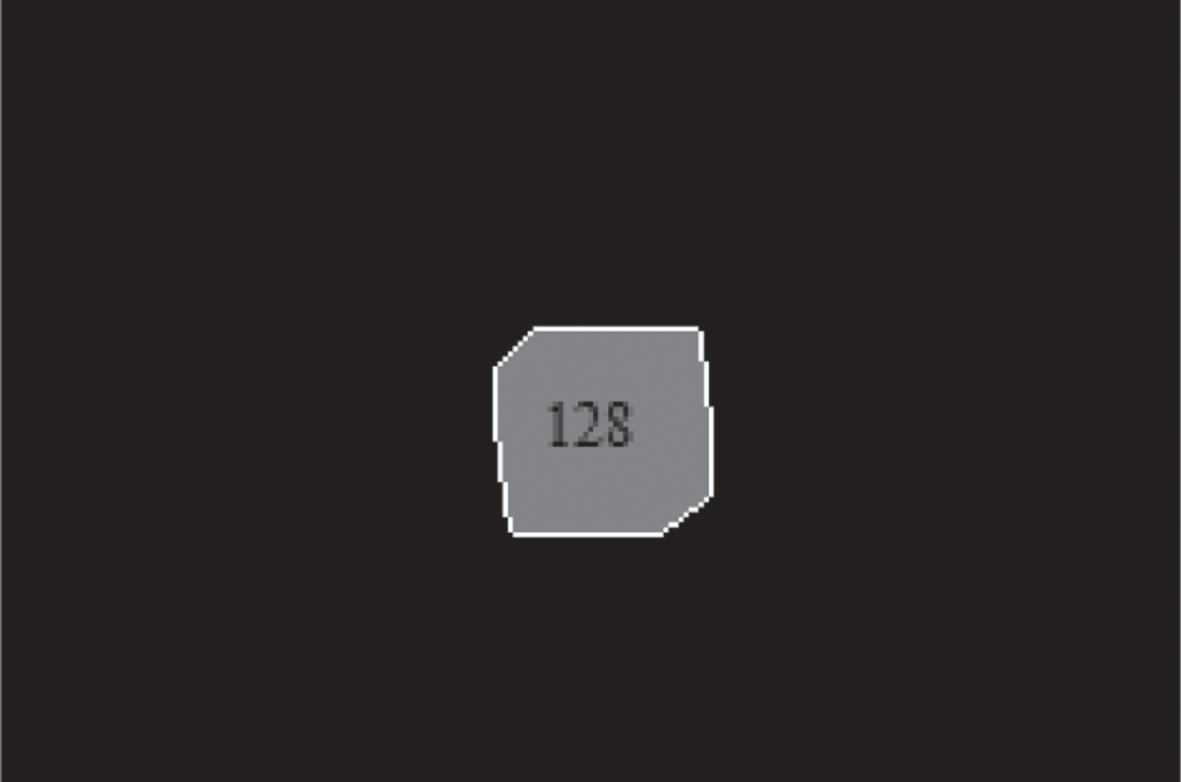
Labeled mask image for single anomalous instance.
In total there are four classes for analysis where three classes are for anomalous instances and the fourth is for boundaries in the video.
In Fig. 13 we plot a multi-class ROC curve that gives the area covered for each class where class0 represents label 85, class1 for label 128, class2 for label 170, and lastly class 3 for label 255(boundaries). From the multi-label ROC plot, we have determined the AUC value for each anomalous instance in a video sequence. The AUC is 0.86 for class 0(blue), whereas the obtained AUC for class1(green), 2(red),3(yellow) is 0.89,0.80 and 0.89 respectively.
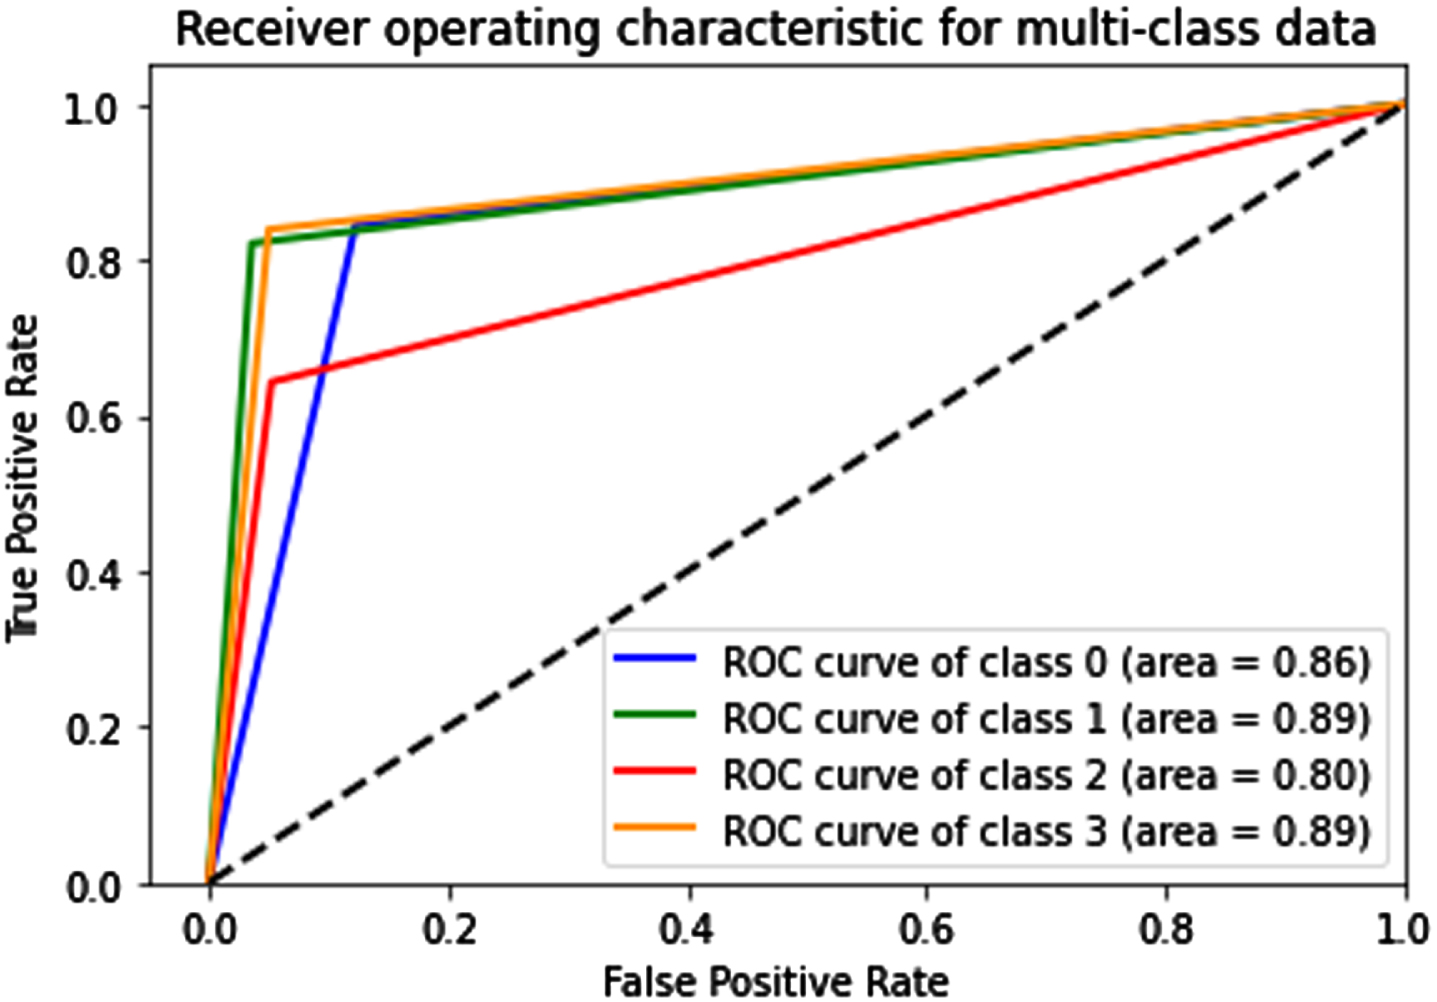
Represents ROC Curve for multi-class data for different anomalous instances in video frames in the UCSD ped1 dataset.
Our proposed methodology is also evaluated on the UCSD ped2 dataset where multiple anomalous incidences such as cars and bicycles in the video shown in Fig. 14
Represents anomalous objects in the UCSD ped2 dataset.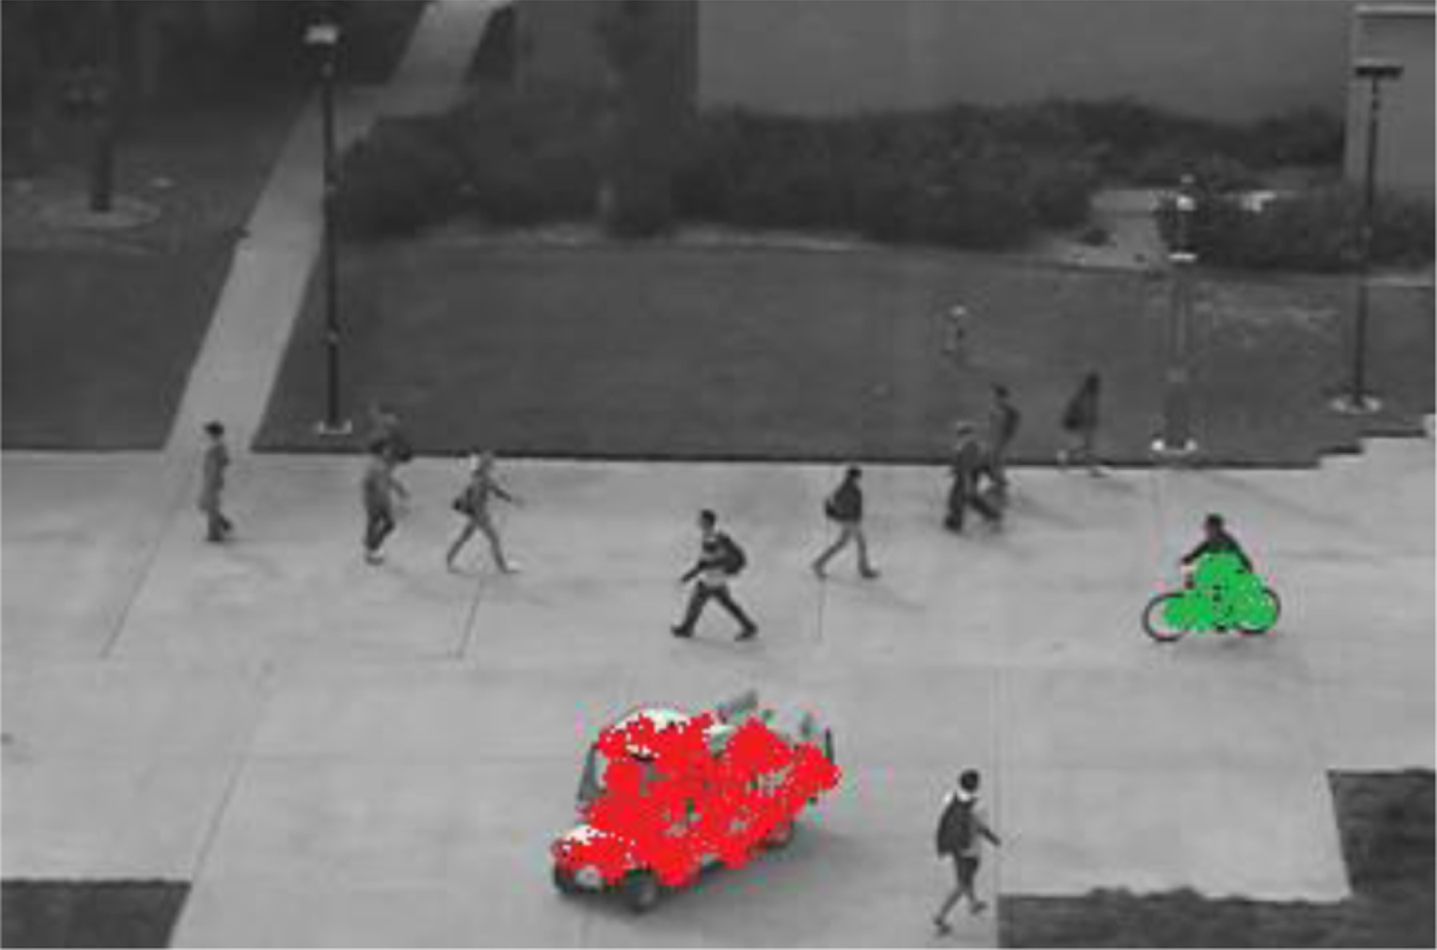
The truck and bicycle are designated as anomalous items, respectively, as shown in Fig. 15, with labels 85 and 170. In addition to this, the labels 255 and 128 are provided in video systems for boundaries of anomalies and a single anomalous object, respectively. In the video, there are a total of four anomaly classes.
Shows labeled mask images for anomalous objects.
In UCSD ped2 video frames, class 0 (blue) depicts anomalous object trucks with an AUC value of 0.91, class 1 (green) and class 2 (red) represent bicycles with corresponding AUC values of 0.95 and 0.82, class 3 (yellow) represents the borders for each anomalous case with AUC of 0.90. Figure 16 shows the Roc curve for these three anomalous classes together with the boundaries. Each anomaly in the video dataset has its Area Under Curve value calculated using this method.
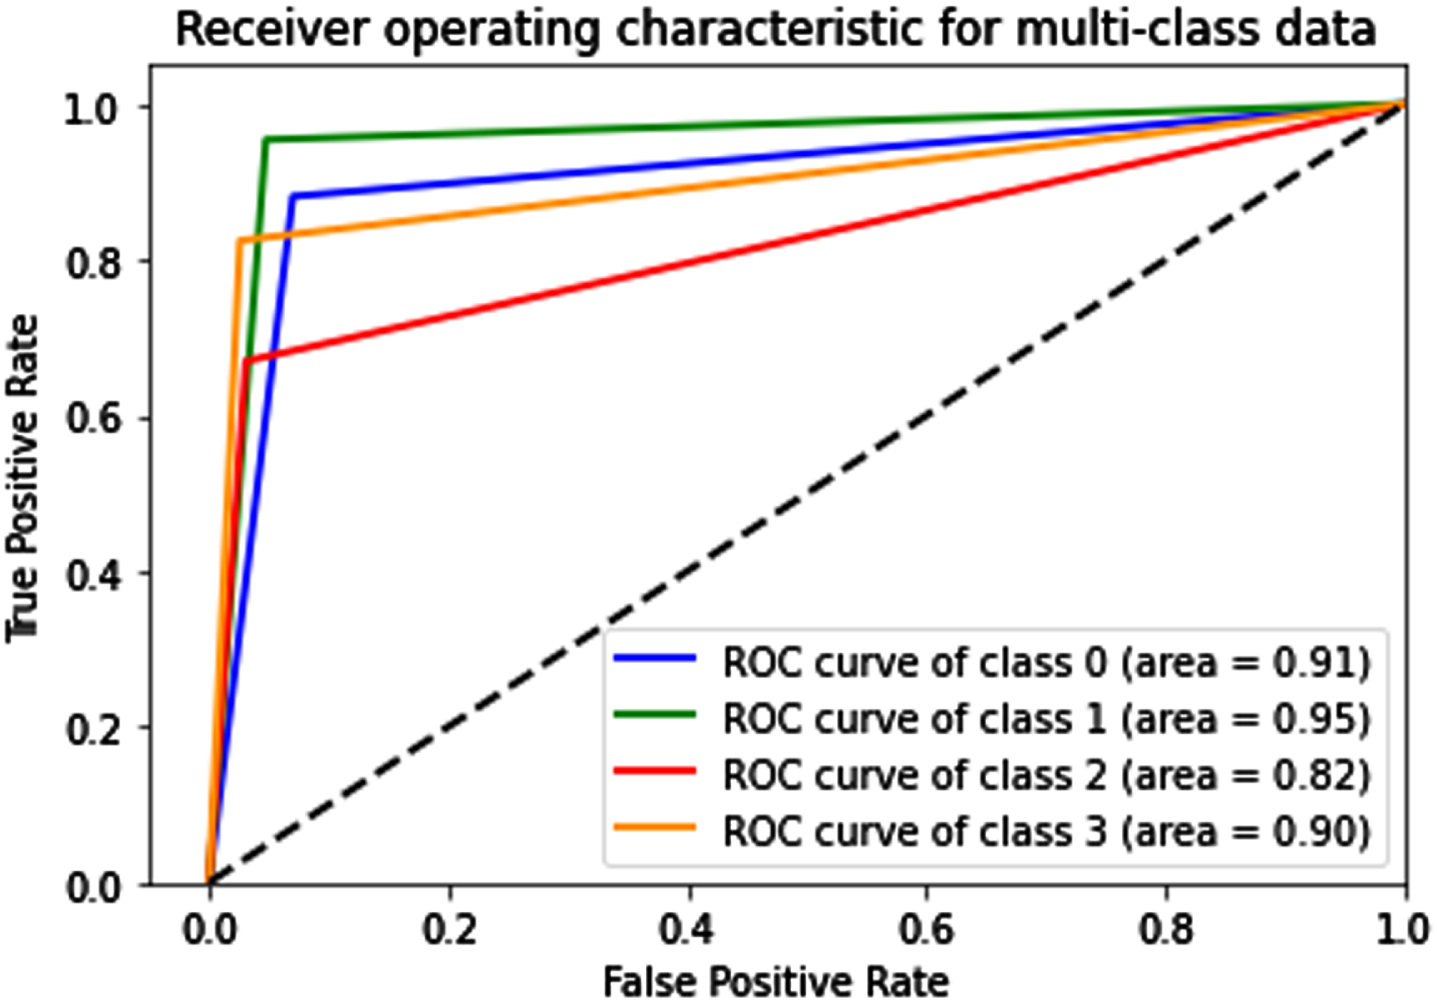
Represents Multi-class ROC curve for UCSD Pred2 dataset.
Represents a comparison of Mean square loss, mean absolute loss, and Huber Loss values for proposed multi-class stack classifier with Multi-class Adaboost classifier for UCSD Ped1, Ped2 and UMN (outdoor) datasets
We have implemented our proposed methodology on the UMN dataset consisting of 7739 frames in 3 different scenes (umn1, umn2, umn3) that has indoor and outdoor activities. Figure 17 represents the Umn1 outdoor activity video frame that has anomalous activity as a sudden moment of the person in different directions. We have considered only one instance in a particular direction as a reference for whole anomalous activity. In total, there are three anomalous instances all in three different directions.
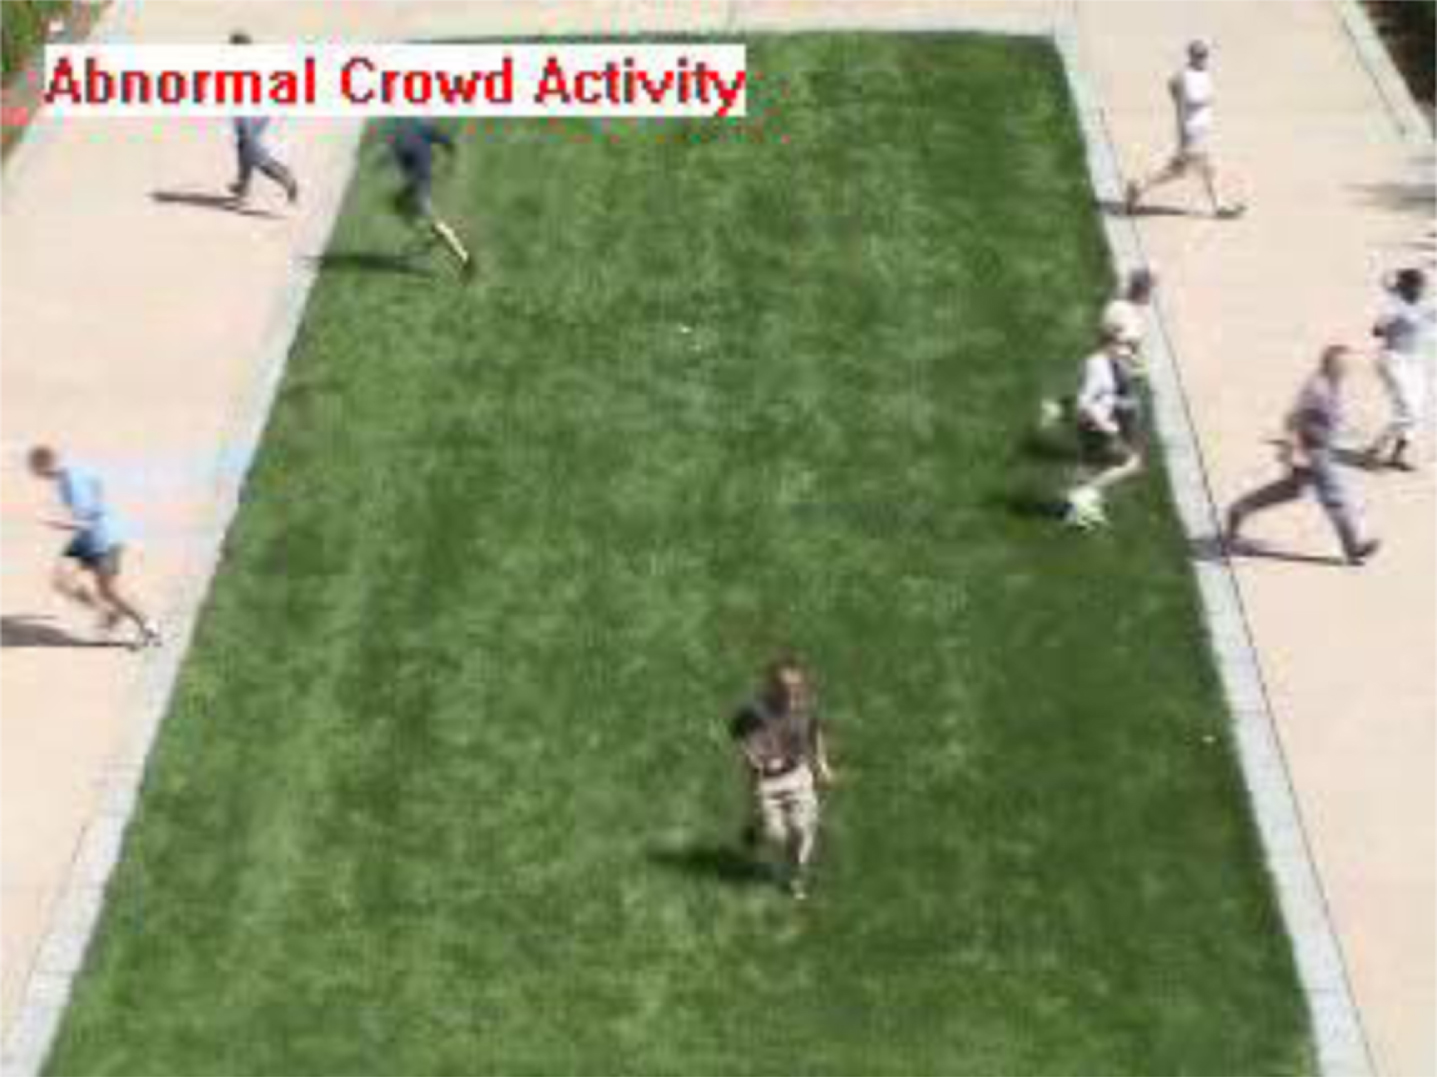
Represent anomalous video frame in UMN dataset. The anomalies are instances in each direction in a video frame.
In Fig. 18, we consider multi-level gray images obtained from the watershed algorithm as the instance mask for the training images of the UMN dataset that are useful for the test image segmentation.
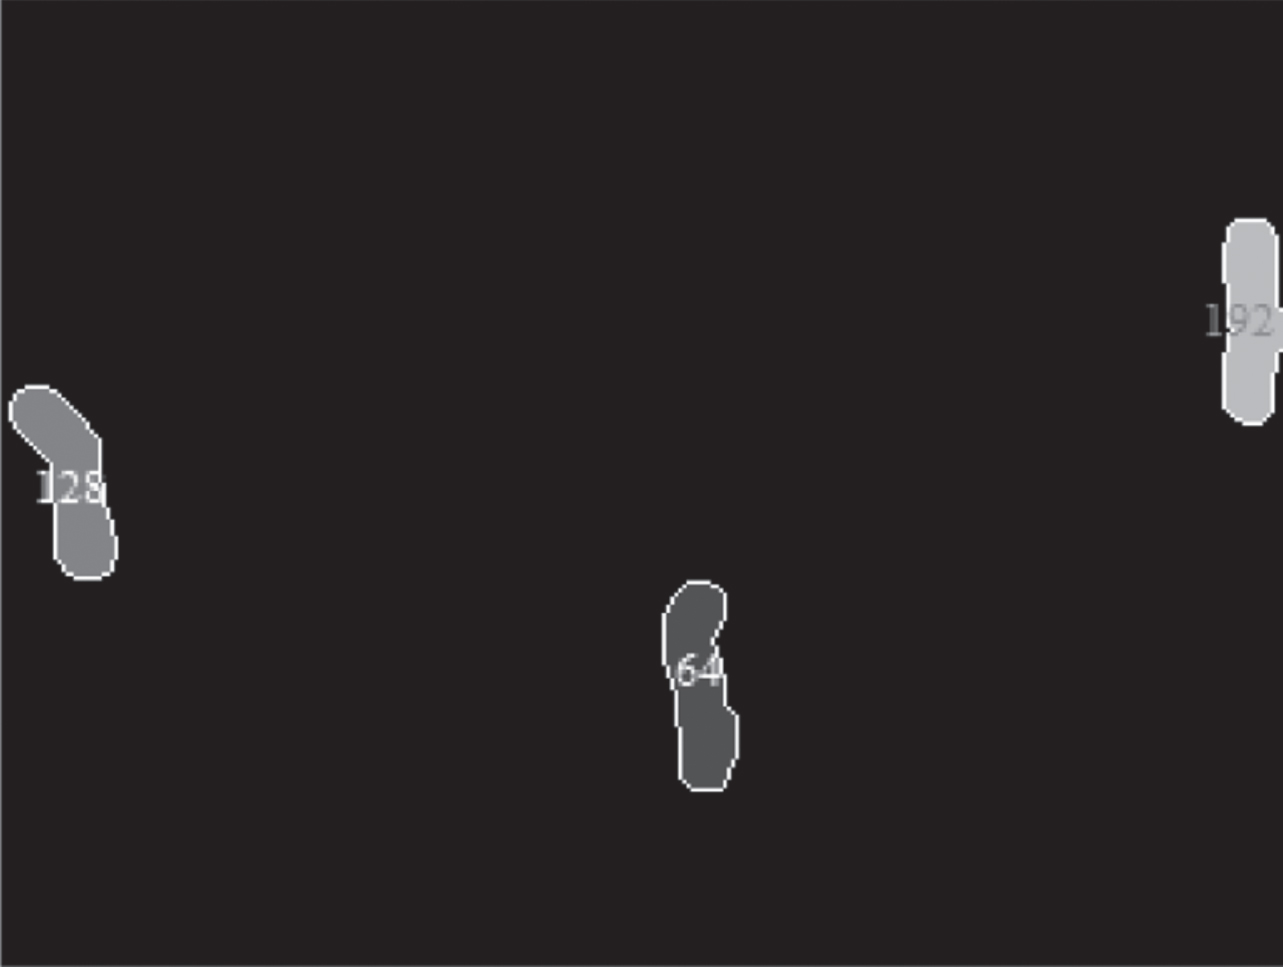
Indicates multi-level gray images taken as multilevel anomalous instance masks for the UMN dataset.
In the UMN outdoor dataset, the ROC curve for various anomaly classes is shown in Fig. 19. Class0 represents anomalies in the east with an AUC score of 0.90, Class 1 denotes anomalies in the west with an AUC score of 0.87, Class 2 signifies anomalies in the south with an AUC score of 0.83, and Class 3 defines boundaries for anomalous instances in each direction with an AUC score of 0.86.
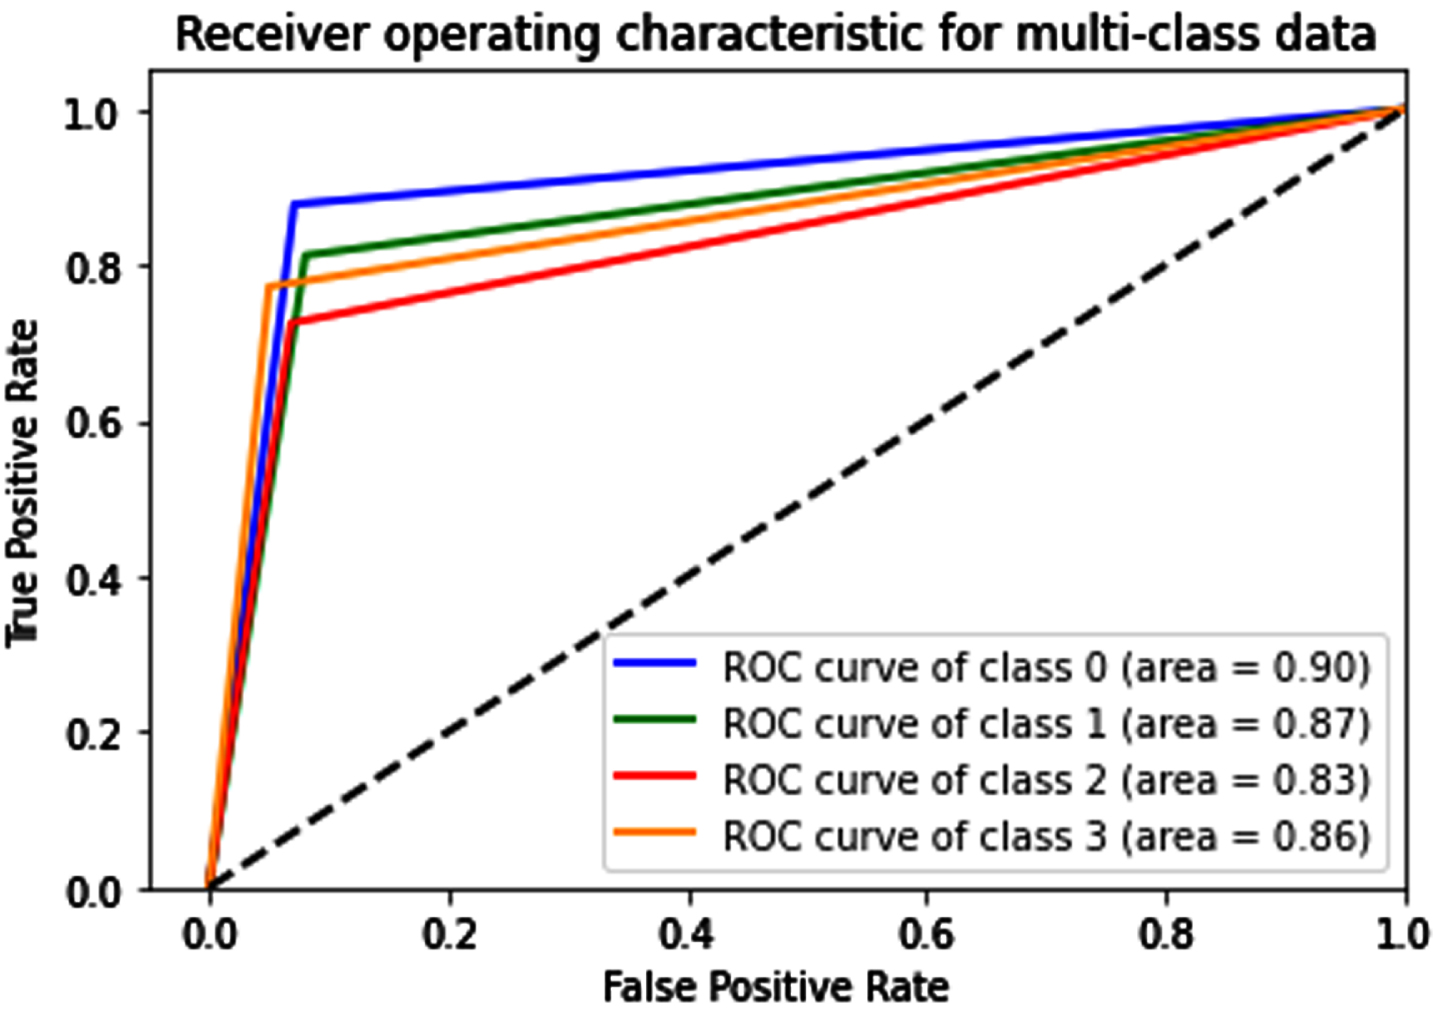
Represents multi-class Roc curve for anomalous instances in a particular direction.
For evaluation conventional loss functions that are: mean absolute error, mean square error and Huber loss are considered. These loss functions are widely used for regression algorithms where the error value represents the difference between actual label values and predicted label values. We have compared the loss functions using a multi-class stack classifier to a Multi-class Adaboost classifier for the UCSDped1, ped2 and UMN datasets.
In Table1, we calculated loss values for each Ped1, Ped2 and UMN dataset. The term δ is the hyperparameter for Huber loss. For the Ped1 dataset, the value of Huber loss is 21.468 for δ equals 0.25 that value lies between the mean square value of 19.877 and the mean absolute value of 24.44 In the Ped2 dataset, the value of Huber loss is 12.738 for δ equals 0.15 that value lies between the mean square value of 10.374 and the mean absolute value of 16.577. In the UMN dataset, the value of Huber loss is 12.895 for δ equals 0.12 that value lies between the mean square value of 9.898 and the mean absolute value of 22.784. We observed that loss values are less for the multi-class stack classifier than for the multi-class Adaboost classifier.
We saved the feature extraction model and loaded the model along with the multi-class stack classifier for the segmentation of test images. The segmentation results of test images are presented in Fig. 20, where each anomalous event is shown separately.
Shows localized anomalous instances in test video frames of UCSD ped2, ped1 and UMN datasets.
We also compared the AUC value of our proposed methodology which includes a feature extraction module with multi class-stack classifier model to the multi-class Adaboost classifier model for multi-anomalous instance classification.
Figure 21 shows a comparison of the ROC value for each anomalous class of the proposed method with the multi-class Adaboost classifier model. The ROC value of each 0,1,2,3 class is higher than that of the multi-class Adaboost classifier for UCSD Ped1.
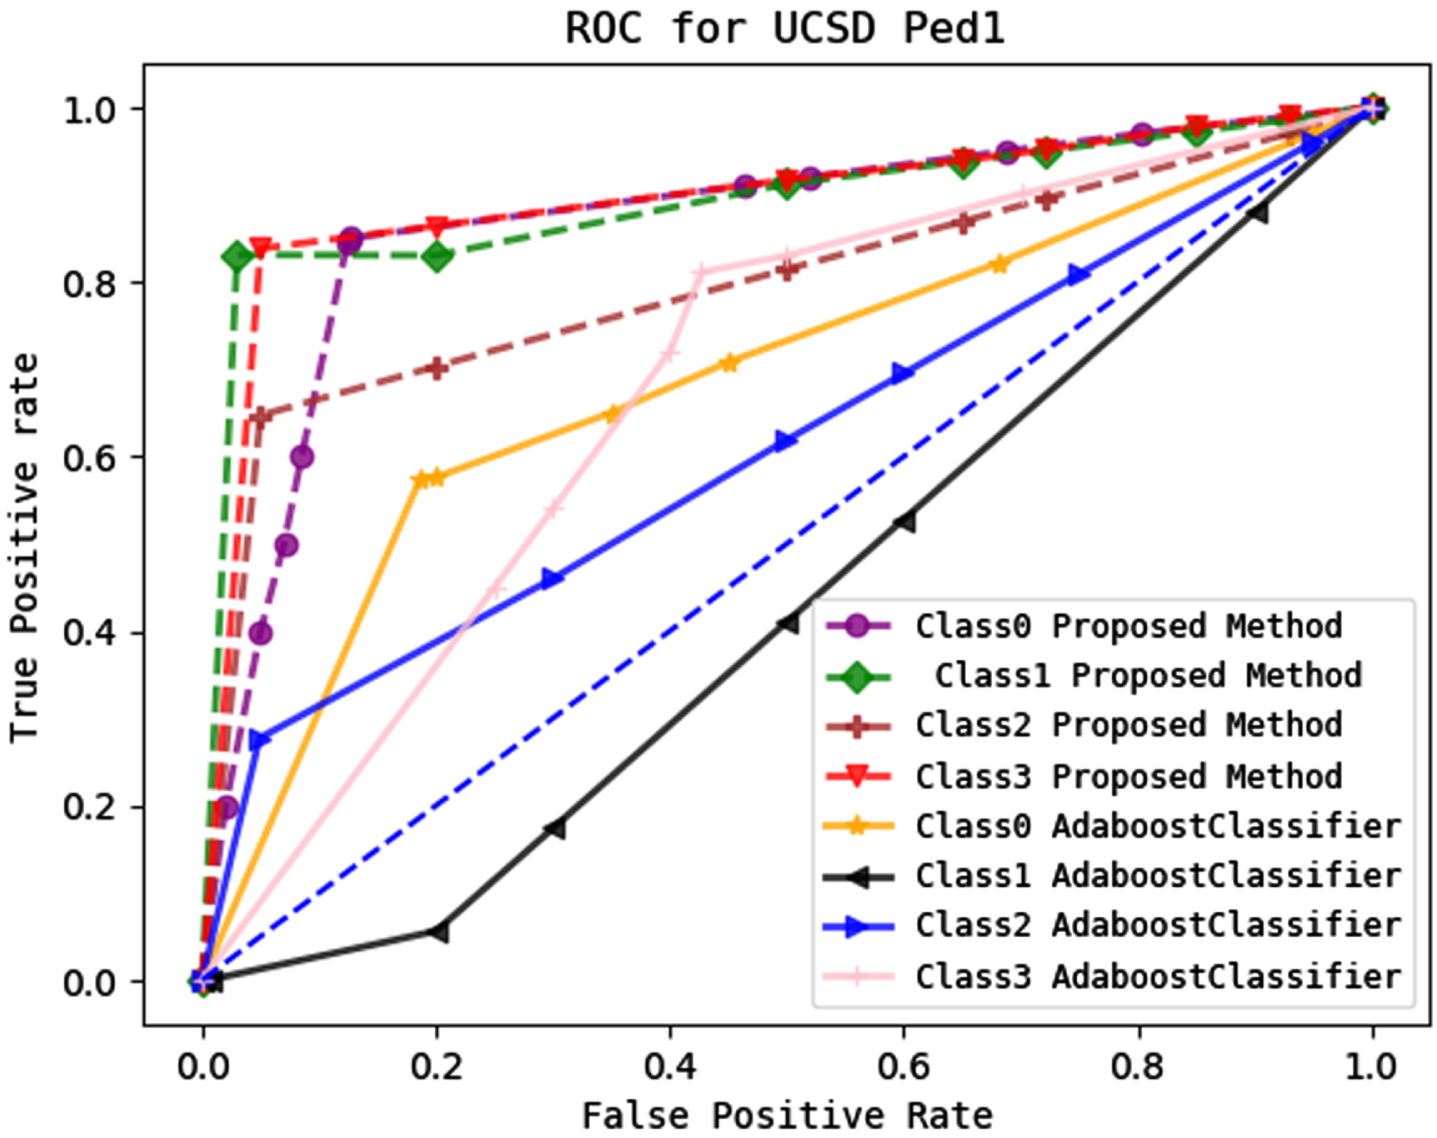
Represents a comparison of the ROC value of each class for the multi-class stack classifier model and multi-class Adaboost model in UCSD ped1dataset.
The proposed methodology is also validated on the UCSD pred2 dataset and UMN outdoor datasets as in Fig. 22.
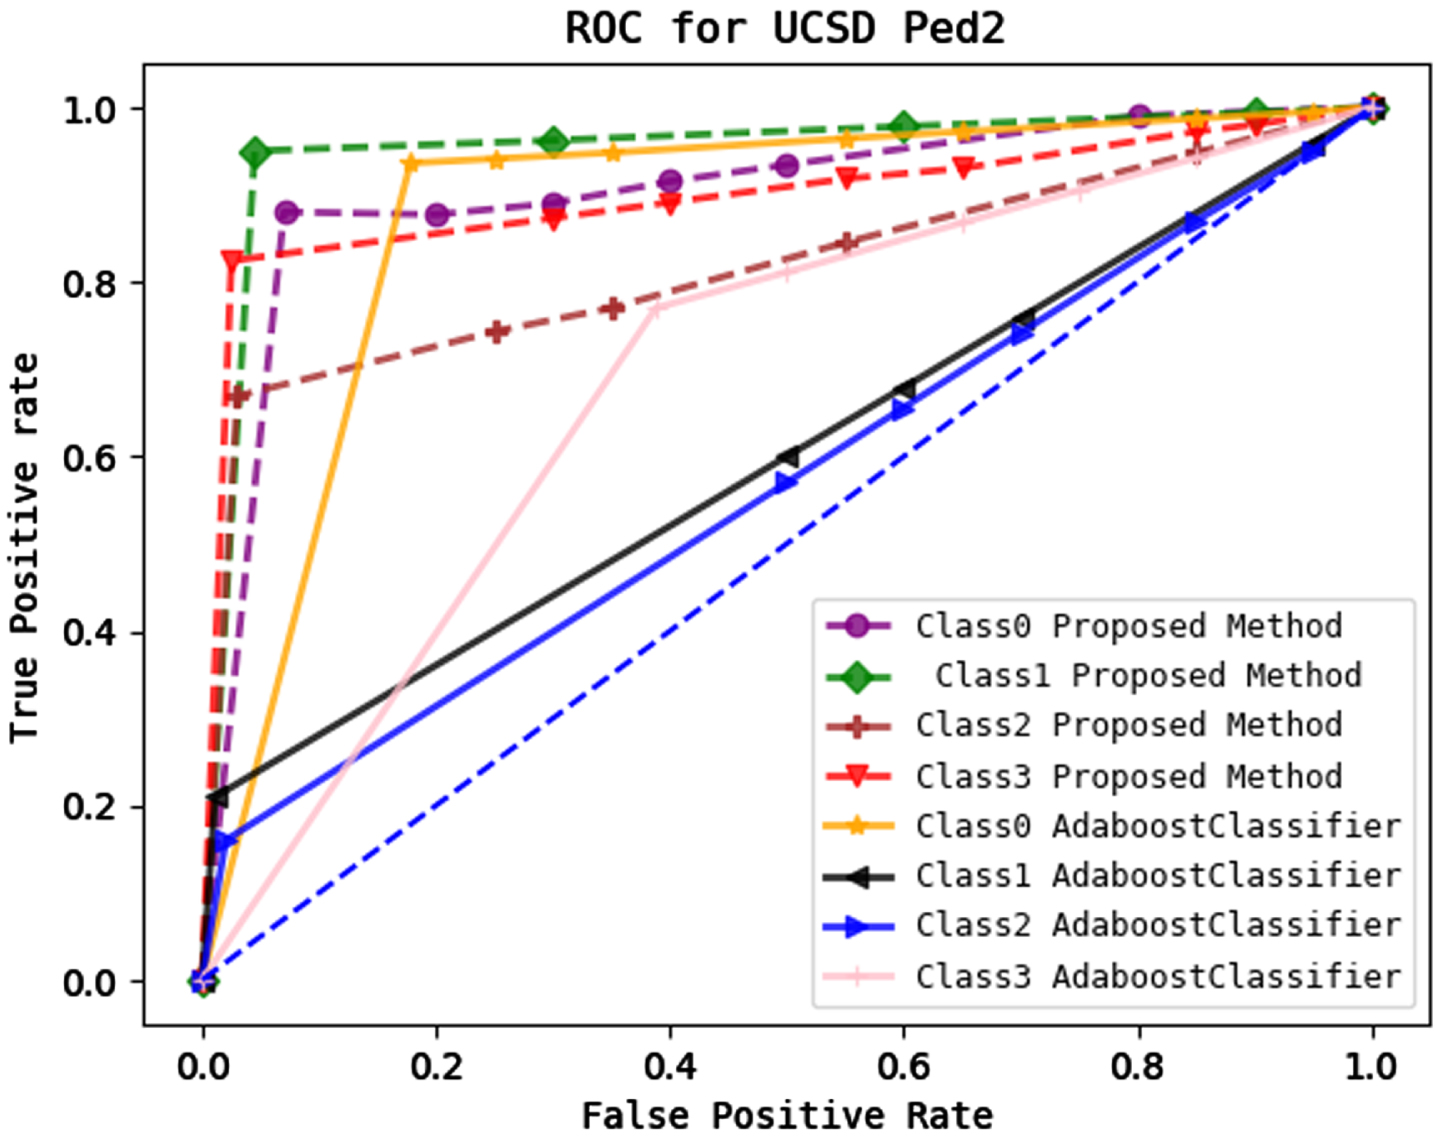
Represents a comparison of the ROC value of our proposed feature extraction module with a multi-class stack classifier with that of the multi-class Adaboost model for the UCSD ped2 dataset.
Figures 21–23 show a comparison between our suggested methodology and the multi-class machine learning Adaboost method. Our novel method’s AUC value for each class is higher than the multi-class Adaboost model’s.
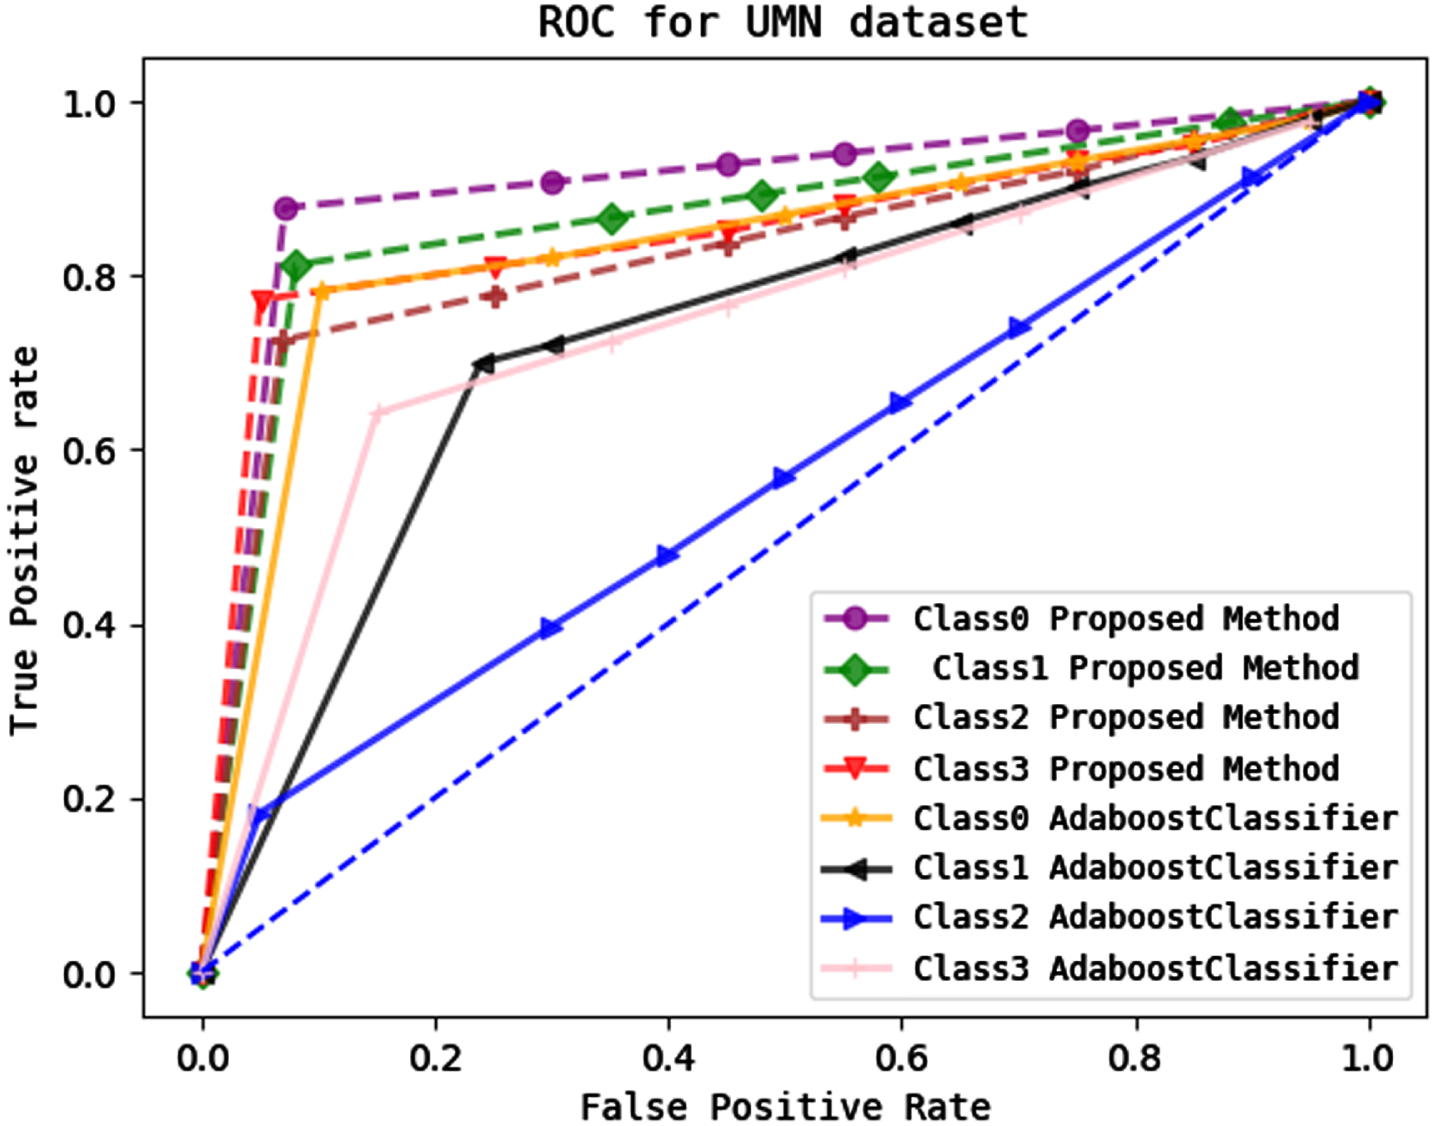
Represents a comparison of the ROC value of our proposed feature extraction module with a multi-class stack classifier with that of a multi-class Adaboost model for the UMN dataset.
In this section, the performance of our proposed method is compared with other state of art methods. In Table 2 we form a comparison of Macro-Accuracy values of our proposed methodology with state of art methods.
Comparison of average accuracy values of the proposed methodology with state of art methods
Comparison of average accuracy values of the proposed methodology with state of art methods
To evaluate the performance of our proposed methodology on the UCSD dataset, we adopt pixel-level criteria for evaluating anomaly detection accuracy. Pixel-level criteria localize the anomalies on both spatial and temporal levels
For the UCSD dataset, Tables 2 and 3 compare accuracy, recall, precision, and F1 score on pixel-level criteria. It has been found that our method outperforms all other currently used methods. Our solution outperforms methods like HOS-HOG [36] (8.07% and 8.15 percent improvements for the Ped1 and Ped2 datasets, respectively) and MPPCA [37] (0.75% and 12.25 percent improvements for the Ped1 and Ped2 datasets, respectively).
Indicates a comparison of precision, recall and f1 score of the proposed methodology with state of art methods
We evaluated the average accuracy score of the UMN1 (lawn) dataset with those of SF [33], Adam [34], and MPPCA [37] found that the suggested technique improves by 13.67%, 20.67%, and 22.67%, respectively.
In a surveillance system, it is important to detect anomalous activities accurately and quickly. We tested the average computation time of our proposed method in obtaining an anomaly score.
In Table 4 we compared the average computation time required by our proposed method to that of HOS-HOG [36]. We obtained the computation time of 0.913 s in UCSD Ped1, 0.85 s in UCSD Ped2 and 0.43 s in the UMN dataset. However, the difference in computation time for our proposed method to HOS-HOG [36] is almost comparable. For the UCSD Ped2 dataset, our methodology achieves lower computation costs than another method.
Represents the average time taken by proposed method
Represents the average time taken by proposed method
We calculated the worst case of time taken for three datasets. The running time mainly depends on the computational environment that is uniform for the three datasets in our proposed method.
The Table 5 indicates worst case of time taken using Big O(n) notation that shows time complexity for obtaining an anomaly score in linear search. It explains how long an algorithm can take to consider all data input. For the Ped2 dataset, our suggested method takes 1740 ms longer than the Two-fold method [38] that uses NVIDIA TITAN RTX GDDR6 24 GB and Intel(R) Core (TM) i9-10940X CPU. By upgrading the computational environment, the running time can be made faster.
Indicates a comparison of worst-case time taken. Big O(n) indicates time complexity
Indicates a comparison of worst-case time taken. Big O(n) indicates time complexity
In this paper, we focus on the recognition and localization of multiple anomalies in surveillance videos. As most researchers have focused on binary classification for fault detection whereas our new model covers multiple anomalous instances that can happen in real-time such as bicycles, and four-wheelers in the pedestrian park. The proposed architecture uses an attention U-net model to develop binary masks where white pixels indicate uncommon objects and black pixels as background. Further multi-gray level instance mask where each object has a different grayscale label is obtained using border function and watershed algorithm. Multi-instance masks, feature extraction model (that uses a gaussian function, entropy function, optical intensity) and multi-class stack classifier model are used for the prediction and localization of anomalous events in the test frame. Our model is evaluated on three standard datasets: UCSD Ped1, Ped2 and UMN outdoor. For evaluation and comparison, we used metrics such as AUC value, Average Accuracy, Precision, Recall, F1 score, inference time, computation complexity, Mean Absolute error, Mean Square Error, and Huber loss. AUC value results for each class obtained from the multi-class stack classifier are compared with that of the multi-class Adaboost classifier model. Along with ROC values, pixel-level macro accuracy values are also compared with state of art methods. We got better accuracy results than that of existing methodologies. One of the next-level research problems is on exploring the integration of augmentation with attention-U net and residual U-nets at different levels that help in improving the segmentation tasks.