



Abstract
Pressure injury usually develop in the bony prominence of immobile bedridden subjects. Predicting pressure injuries based on the subjects’ physiological information will reduce the burden of the caretakers in adjusting the frequency of repositioning such subjects. Visual assessment, diagnostic, and prognostic approaches only provide pressure injury information after onset. Therefore, the objective of this unique modeling technique is to predict the internal alterations that take place in human tissues before the onset of pressure injuries. In this approach the bio-mechanical and bio-thermal properties was integrated to predict the internal changes of skin, fat, and muscle layers when subjects were self-loaded continuously for one hour in the sacrum region. A change in temperature of all the layers, as well as the distribution of Von-Mises stress in these layers, was observed. The inflammation caused by the changes in the temperature and the stress was measured from the simulation model. Ultrasound measurements was also taken for the same subjects in the supine position in the sacral region, before and after one hour by applying a self-load. An identical change in the thickness of the above-mentioned layers due to thermal expansion was noticed. Hence this computational model is hypothesized to give identical thermal expansion in comparison with the ultrasound measurements. There was an agreement between the thermal expansion using the simulation technique and the ultrasound technique which was assessed through Bland-Altman analysis, with a 96% confidence interval.
Introduction
Pressure injury is developed when large or small amount of pressure is applied persistently over short or long period of time. As the human tissues are time-varying in nature, any deformation that occurs changes with time. Hence when external pressure is exerted on the skin, the associated tissue layers adapt themselves by changing its shape which is called as tissue creep [1]. This results in internal distortion that reduces the vascular supply to the soft tissue due to vascular kinking [1]. When the external pressure exceeds the capillary limit i.e. 16 to 33 mm Hg, blood vessels gets occluded in the underlying tissue and becomes anoxic [2]. Cell death occurs if this pressure persists for a long time and results in soft tissue necrosis [2]. Moisture content on the skin due to perspiration and human discharges adds to the cause. Skin elasticity also changes, especially among bedridden subjects [1, 2]. Young’s modulus depends on the elastic property of skin which is found to fluctuate around 0.635±0.19 MPa when determined through the torsion test [3]. Additionally, good amount of nutrition, positive nitrogen balance and oxygenation are required to prevent pressure injuries. However, ageing and long-term hospitalization decrease these metabolic factors thus increasing chance of getting pressure injuries [4, 5].
There are many modalities to assess pressure injuries. Thermography is a technique used to assess temperature gradient by measuring infrared energy emitted by the body. In general, inflammation is the first phase of pressure injuries related to increased skin temperature [6, 39]. When loading continues, temperature further increases, decreasing skin tolerance to ulceration [7]. However, the temperature in the pressure ulcer zone decreases on healing. Thus, by looking into the temperature difference between the pressure ulcer region and the adjacent region, progress or healing could be identified [8, 9]. Ultrasound is another technique to view deep tissue information by sending sound waves and picking the acoustics from different tissue to form an image of soft tissues. Ultrasound waves, when absorbed, form hypo-echoic regions and form hyper-echoic regions when reflected. More hyper-echoic region possibly indicates tissue damage at subcutaneous layer [10]. Recently, the research is towards assessing pressure ulcer by measuring electrical skin capacitance and sub-epidermal moisture [11]. However, all these are widely used in research and very limited in clinical practice [12]. Risk assessment tools based on visual inspection is one widely used practice in hospitals. Braden scale, Water low, Purpose T and Shape risk tool are few risk assessment tools that works on questioners for which the attendees gives answer depending on their experience and observation. Hence this method poses a great chance for human error [13, 38]. Though the imaging modalities give more information including deep tissue conditions, getting access to these facilities are difficult and also, they are expensive. Hence, doing it frequently becomes impossible, making monitoring of disease prognosis a big challenge. Moreover, when an immobile subject is lying for longer duration in supine position, there are around nine points that are vulnerable to the formation of pressure injuries which is shown in Fig. 1. Among that, the sacrum is one region where the chance of pressure injuries occurrence is relatively higher [37]. On the sacrum, despite a thick coating of soft tissue and a wide supporting surface, the blood arteries are not suitable for weight-bearing, therefore pressure ischaemia can develop quickly [1].
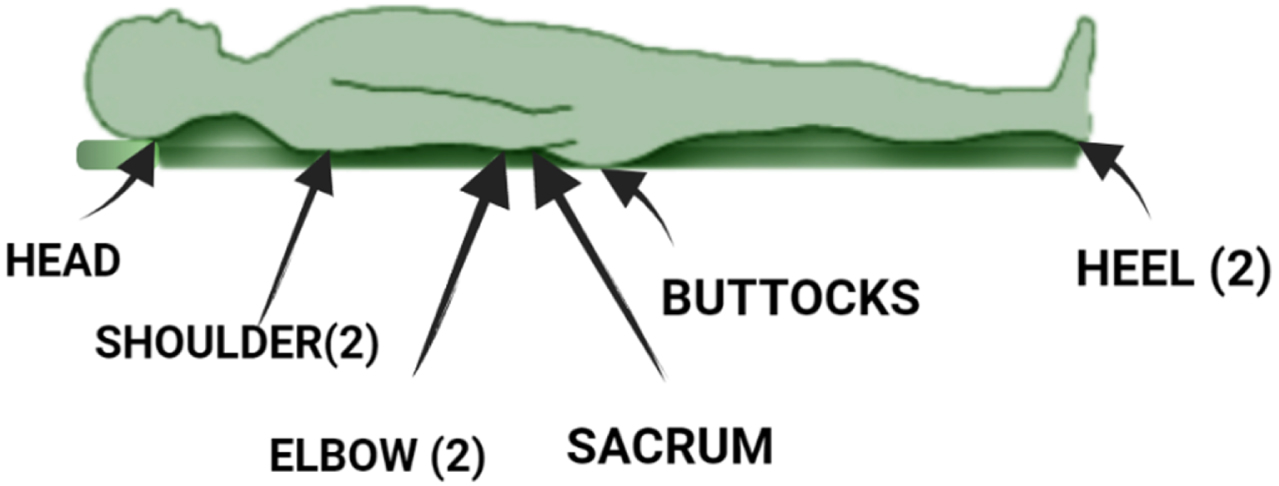
Pressure points in supine position.
Hence the objective of the study is to develop a unique multi-physics modelling technique to understand the internal changes in the sacrum region of the subjects who are subjected to self-load. The input to the study are surface temperature of the sacrum, and their self-weights. Apart from this bio-heat parameter and the bio-mechanical properties are also given as inputs. The values of the bio-mechanical parameters are mentioned in Table 2 and the bio-heat properties are mentioned in Table 3.
Input parameters for the standard model and the specific model
Experimental parameters of Bio-mechanical properties of sacrum region
Experimental parameters of the bio-heat properties of the skin and underlying regions
The physics, namely the bio-heat and the bio-mechanics are coupled, and a time-dependent study is executed using COMSOL multi-physics 5.6. The execution output is the Von-Mises stress distribution and temperature variations at the various layers (skin, fat and muscle layers), respectively and the combined effect is the thermal expansion. The displacement due the thermal expansion is measured from the model. The block diagram of the work flow is shown in Fig. 2. Based on the conceptual analysis of repositioning the bedridden subjects by Abdulkareen S et al., [42], this developed model would also help the medical professionals and the care takers to a greater extent in repositioning the bedridden subjects.
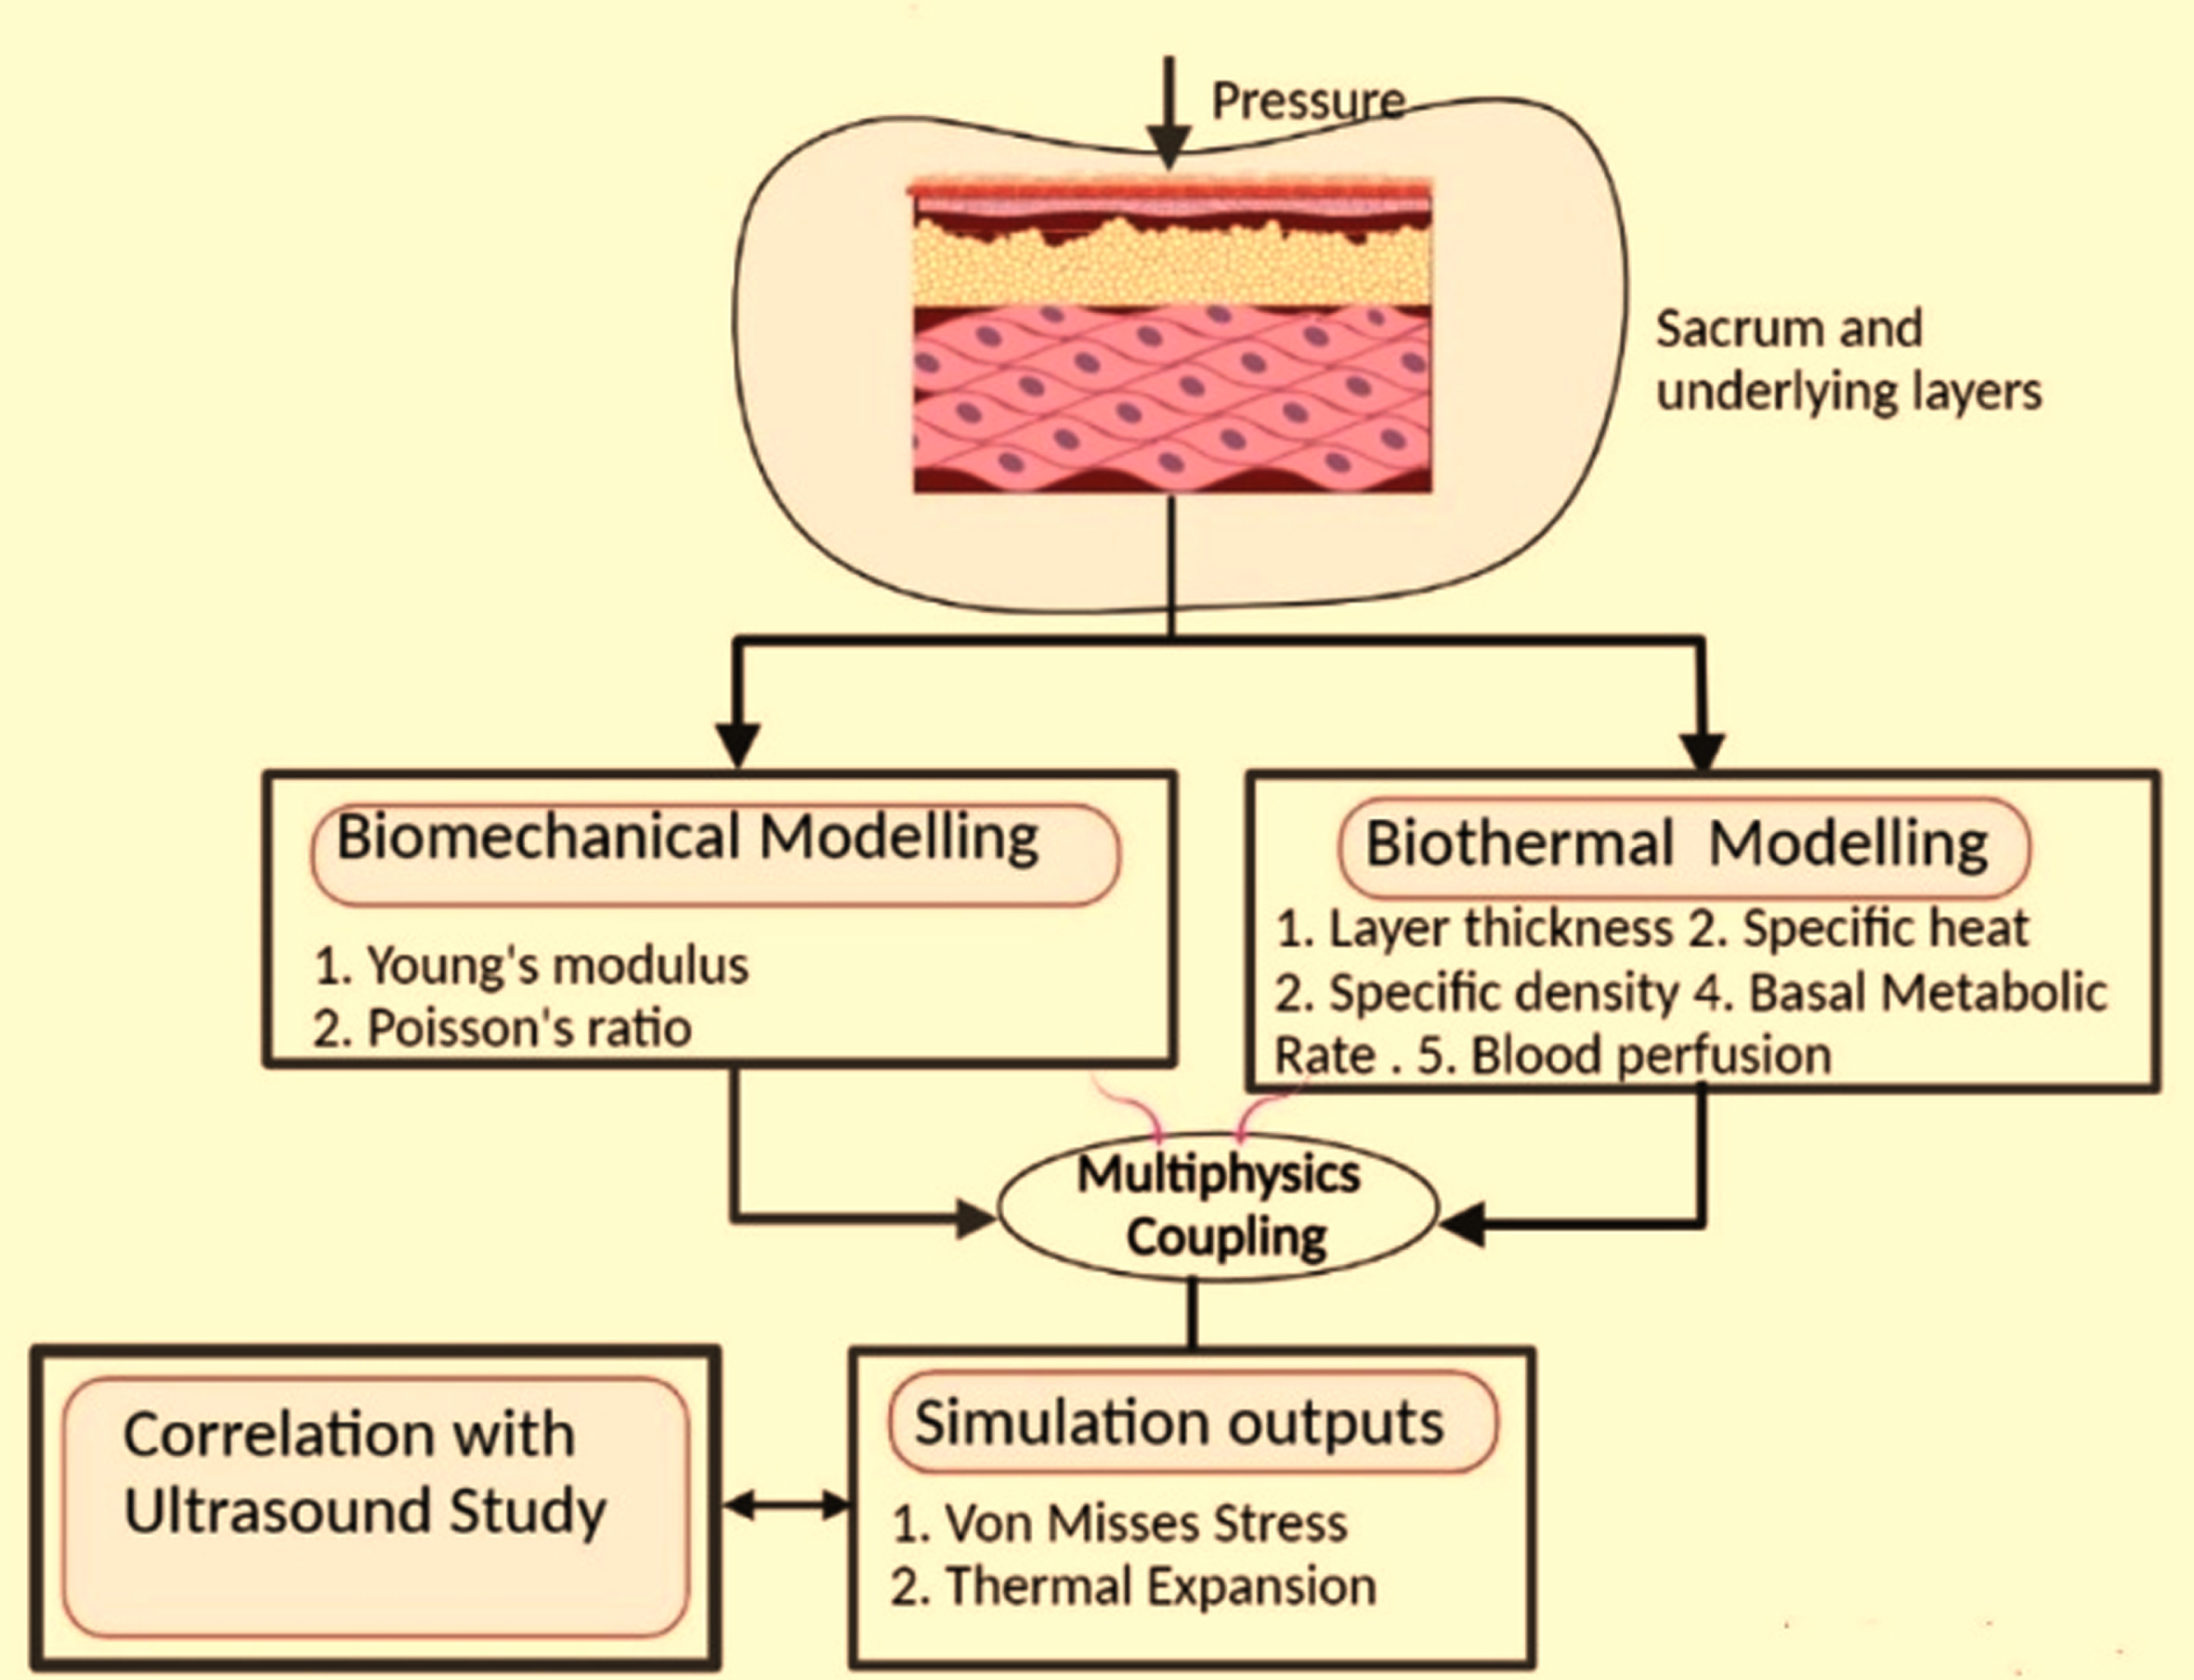
Block diagram of the work flow. The sacrum region is modeled in COMSOL multi-physics 5.6. by assigning bio-thermal and bio-mechanical properties to the tissues, the sacrum model is executed as equivalent to the self-load for a specific period, and multi-physics coupling is performed. The combined effect is thermal expansion.
When participants are self-loaded under prolonged supine position, there is a change in the bio-heat properties and the mechanical properties of the layers beneath the skin in-terms of Young’s modulus and temperature. However, the aim of the experimentation is early predictions of pressure injuries by simple and non-invasive method. In this standard model is developed by a skin temperature, Young’s modulus, and pressure due to self-loading alone are varied keeping other details as constant. In another model, termed as specific model, apart from changing the above-mentioned parameters, the thickness of the skin layers at the initial conditions are changed based on the ultrasound readings. After designing the two models, a time dependent study is performed on both. Using the corresponding changes in the values of surface temperature and Von- Mises stress of two layers, thermal expansion due to loading is computed in both the models. The displacement due to the thermal expansion is measured from the simulation output. This is compared with the ultrasound image obtained after one hour of loading. The steps for designing the model and the corresponding input and output values are discussed in the next section.
The experimental set up is as follows,
Data set
The first category participants included healthy subjects from both the male and female belonging to the age group of 20-50 (mean33.5±7.9). This category is further divided into two groups i.e., participants between the age group 20-40 are called group 1 while participants between 40-50 years are called group 2. The second category was diabetic subjects between the age group of 41-50 (mean 41.8±8.1) is called as group 3. This study was conducted after all the participants gave their consent in writing and as per the approval of ethical committee of the institution. They were also informed about the confidentiality of the data, purpose and procedure of the study.
Sample collection
On the arrival of the participants, they were allowed to relax, and the initial skin temperature and the ambient temperature were measured. The sacrum skin temperature was measured by placing the thermometer 3 cm to 5 cm away from the skins’ surface. The range of measurements was between 25 °C and 40 °C. For the above measurements, the EVM infrared thermometer was used and operated in body temperature and the surface modes. In order to validate the prediction obtained through the constructed models, Ultrasound images of the sacrum region of the participants were obtained by making the subjects to lie in prone position. The region in which the consecutive ultrasound needs to be taken was marked with the marker. Ultrasound gel was applied at the marked region to reduce acoustic impedance and reflection and to create a bond between the skin and the transducer.
After taking the ultrasound image of the sacrum at the initial state, subjects were allowed to lie supine over a smooth and flat object to apply pressure over the marked region for about 60 minutes without changing position. Then they are again turned to prone position and imaging is done at the earliest within 2-3 minutes to minimize the escape of pressure and to get the reading with utmost accuracy. For the ultrasound measurements, VINNO E10 ultrasound machine and linear probe with the probe frequency of 4-12 MHz and MINDRAY ultrasound machine with the linear probe of frequency 4-12 MHz having advanced ZONE Sonography Technology (ZST) were used.
In addition to the temperature measurements, in-order to apply the boundary load for simulation each subject’s weight and area in the area occupied in supine position is calculated. The diabetic conditions of each subject is also checked. The parameters for the specific model and the standard model are listed in the Table 1. The values of bio-mechanical parameters and the bio-heat parameters are referred from Table 2 and Table 3 respectively. The output parameters are the displacement due to the thermal expansion.
Computational study
Model construction
On application of external pressure continuously, the biological tissues’ behaviour will not be constant but varies with respect to time. The changes that are happening in the internal layers of the tissues are very difficult to monitor and measure. However, these changes are important predictors for pressure ulcer formation. Hence a simulation approach is attempted here to analyse the change in the internal parameters like temperature and Von-Mises stress on application of pressure. Construction of geometric model of sacrum region (where pressure ulcer is to be analysed) becomes the first step in the modeling. Since, the sacrum region exhibits bilaterally symmetrical property the model constructed here is 2D semi-circular shape [14] containing the layers like skin, fat, muscle and bone. The thermal and mechanical properties of these layers are chosen to be uniformly distributed across each region. We have chosen a standard model with known thickness of the skin, fat, muscle and bone from literature [15–17]. The model that we have considered is presented in the Fig. 3 which is analysed using COMSOL multiphysics-5.6 for thermal and stress distribution. The entire simulation is carried in 64 GB INTEL processor workstation. There is an association between applied geometry and the related physics settings. When there is any change in the input parameters, the model will automatically accommodate those changes in meshing and plotting.

2D-axis symmetric model of sacrum region. A curvature representing the bone as the inner layer followed by the muscle, fat and skin of human sacrum in the supine position.
The unique inputs for defining tissue layers (skin, fat, muscle and bone) are the heat capacity, density, thermal conductivity, blood perfusion, Young’s modulus and the Poisson’s ratio. The first property, heat capacity, refers to the amount of heat needed to be supplied to the layers to produce a one-unit change. Density gives the relationship between the mass and the volume, thermal conductivity is another property of each layer, which is the capacity of the layer to transfer heat. Young’s modulus is a measure of uni-axial stress over strain. When the tissues are examined at the micro level, it is evident that the stiffness is dependent on collagen fibres and the elastin of the arterial wall. The cells themselves also exhibit a characteristic stiffness due to the interactions between the surroundings and are also influenced by genetic and/ or biological factors. While properties like stiffness and Young’s Modulus are respectively related to the structure and composition of the material/ tissue. According to Guimarães et al, the Young’s Modulus is least for fat followed by muscle, skin and bone [18]. This modulus increases till a particular age and then starts decreasing [19]. This threshold of age depends on the gender as well as other factors including food and physical practices. Stiffness is affected because of the change in the skin elasticity [20]. Poisson’s ratio is a measure between transverse strain and axial strain and depends mostly on the protein matrix of the tissues. Layers like skin, fat, muscles and the bone have different protein structure depending on the amino acid composition [21, 22]. The experimental parameters of the mechanical properties namely the Young’s Modulus, Poisson’s Ratio and thickness of each layer are mentioned in the Table 2. [17, 24].
Adding physics
In order to understand the internal changes happening after the pressure ulcer formation, the two physics namely the bio-heat transfer physics and the solid mechanics physics are added and simulated.
Bio-heat transfer physics
When there is change in the blood flow, then the temperature varies in the tissue layers and heat is transferred to the adjacent layers [25, 26]. Due to this reason blood flow is considered either as a source or sink for heat transfer which can be modelled using the fundamental Penne’s equation [44]. It depends on the metabolic heat generated during the energy production and the growth of the living tissues; passage of blood through the tissues; density of the blood, which is proportional to its protein concentration, blood specific heat, blood perfusion rate, and arterial blood temperature.
The heat transfer of the sacral region is modelled using the Penne’s equation.
ρ= local tissue density (kg/m3),
c= Specific heat capacity (J/kgK),
k = Thermal conductivity (W/mK),
q = Metabolic heat generation rate (W/m2),
T = Tissue temperature (°C),
ω b = Rate of tissue blood perfusion (1/s),
ρ b = Blood density (kg/m3),
c b = Blood specific heat (J/kgK),
T b = Arterial blood temperature (°C).
In COMSOL multiphysics-5.6, after defining the geometry and the material properties, the input to the bio-heat transfer physics was given through the thermal parameters of Penne’s equation (1). These values were considered from the literature. For initial values ambient temperature was considered. By default, axial symmetry and thermal insulation are considered based on the geometry defined. The arterial blood temperature of the skin is assumed to be 32.8°C while it is 36°C for other layers [27, 28]. The ambient temperature is taken as 28°C. The experimental parameters of the bio-heat physics are tabulated in Table 3. The values of bio-heat properties are referred from Gefen et.al. [23] while the value of the thickness of the tissues are referred from [15–17].
The isotropic, solid-linear elastic module is selected in solid mechanics physics. The vertical diameter defines the axial symmetry of the system. The initial values are set for the zero displacement fields and the zero structural fields. A boundary load has to be applied in this physics. The load is calculated based on the weight and the area of the person in supine position. A boundary load has to be applied in this physics. The load is calculated based on the weight and the area of the person in supine position. To simultaneously analyse the effect of external pressure on all layers they are meshed as per the details in the Table 4. It is essential to mention that this boundary load is calculated based on each participant’s weight and area occupied in the supine position.
Mesh details of multi-physics model
Mesh details of multi-physics model
We have performed a multi-physics coupling for the sacral model by combining the bio-thermal and bio-mechanical properties with self-load of the subject applied in supine position. Elevation in temperature will result on continuous loading which in turn results in expansion of the corresponding layer thickness. It is termed as thermal expansion as represented by
L = Initial length of the layers (m)
S = the secant coefficient of thermal expansion (K-1)
T = ambient temperature (K)
T ref = reference temperature (K)
Accuracy of the developed model could be enhanced by meshing. The three contributors to the mesh are the bio-heat transfer physics, solid mechanics physics and the thermal expansion assigned from multi-physics coupling. Normal element sized mesh was chosen. The meshing details for the standard model are tabulated in the Table 4.
Model execution
Both, standard and specific models are made to run for a period of one hour by applying external pressure as equivalent to the self-weight. 30 numbers of standard models (Young’s Modulus and reference temperature and pressure due to self-loading alone are varied) and 30 numbers of specific models (taking thickness of layers from ultrasound images and retaining other properties as in standard model). Average temperature and stress in fat and muscle layers are computed for every five minutes up to a period of one hour and plotted in Figs.4–6 (Groupings are explained in the section ‘Experimental study’).

Variation of temperature (normalized value in y-axis) with time in standard model (a) one sample from group 1 (b) one sample from group 2 (c) one sample from group 3.
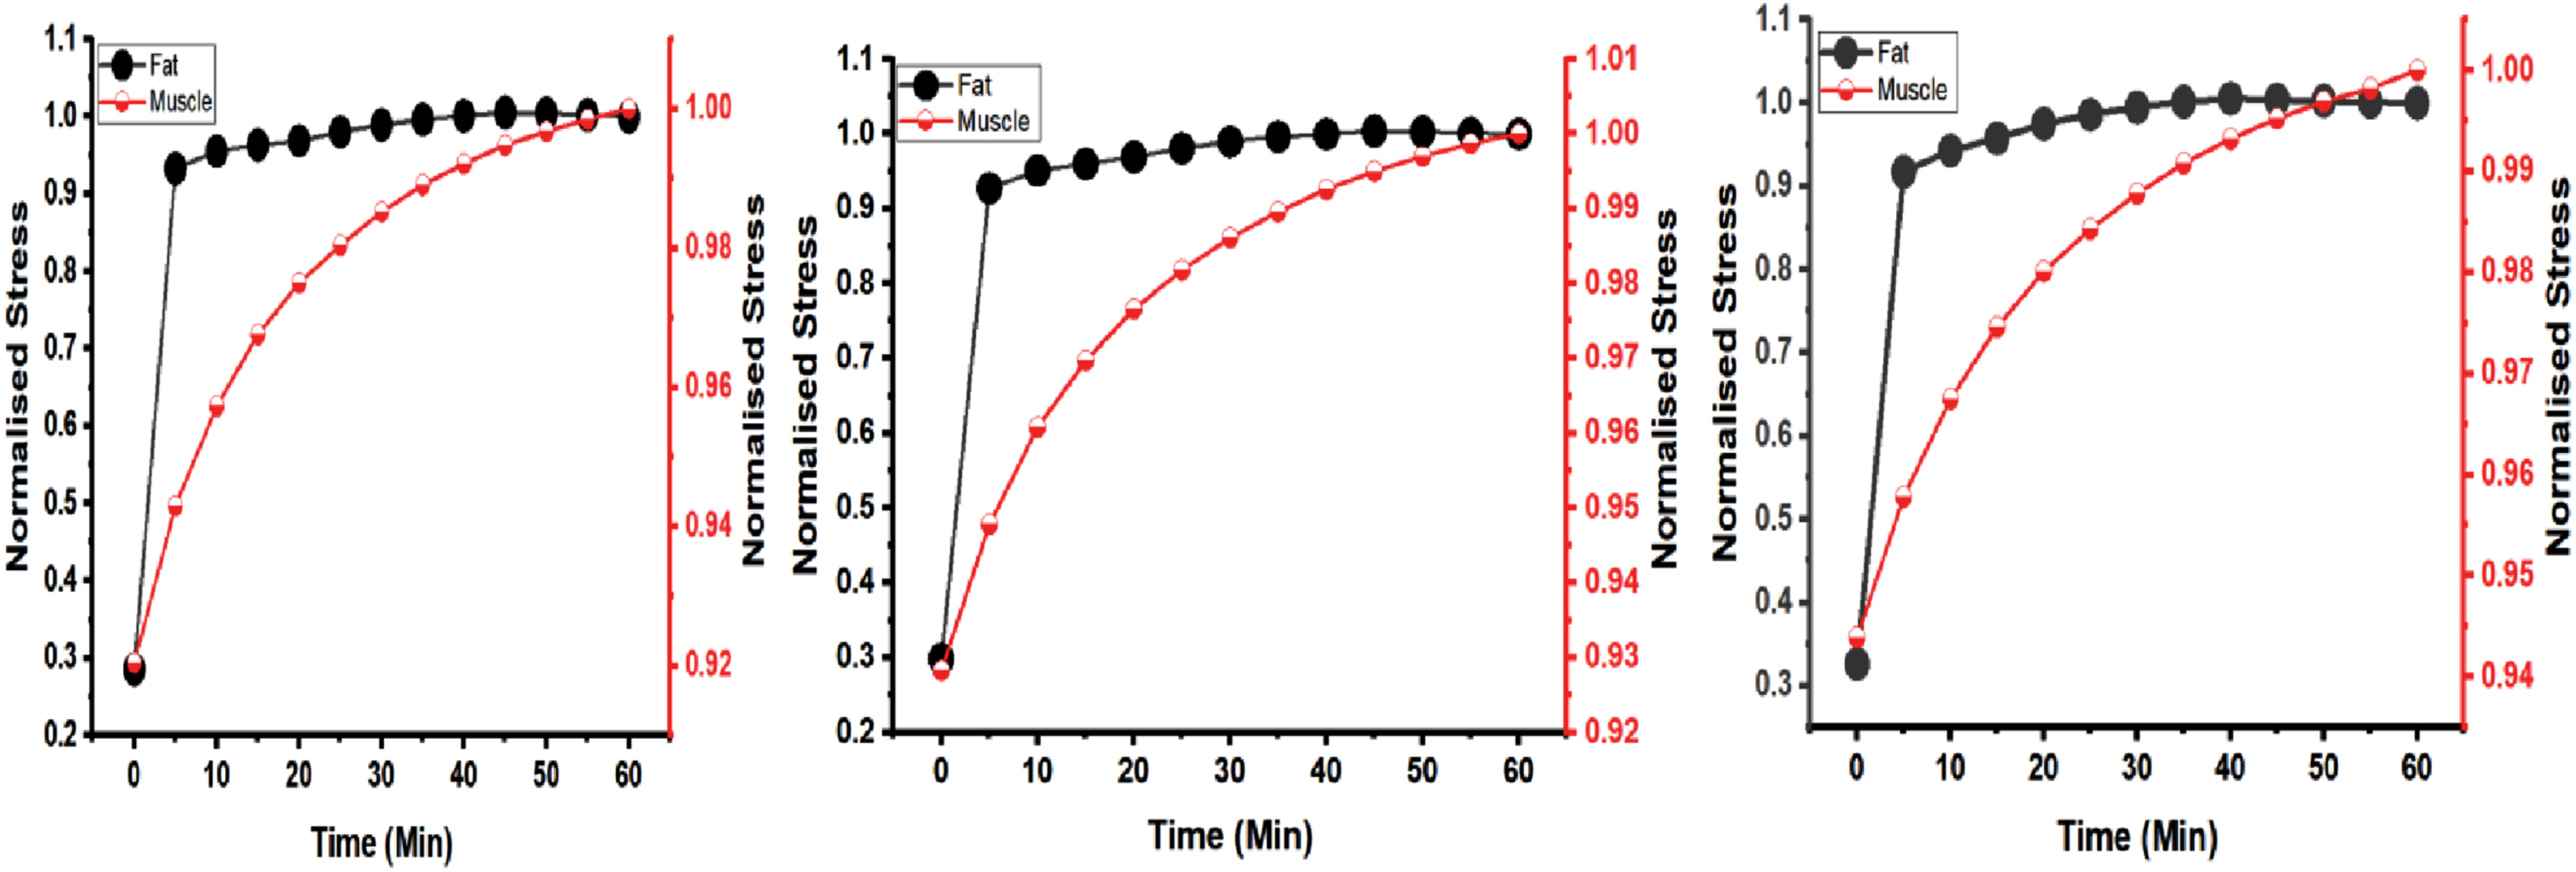
Variation of stress with time in standard model (normalized value in y-axis) (a) one sample from group 1 (b) one sample from group 2 (c) one sample from group 3.

Variation of stress with time in specific model (normalized value in y-axis) (a) one sample from group 1 (b) one sample from group 2 (c) one sample from group 3.
For the standard model, variations in temperature and stress with respect to time in each layer are obtained through multi-physics coupling. Comparison with real time images will help in checking the correctness of the results. Hence ultrasound images of the sacral region are obtained under similar conditions for all the subjects as explained. Skin and tissues undergo deformation due to external loading and regains its original shape and size on removal. Hence it exhibits elastic strain up-to a specific load. Though there are several possible inelastic strains like thermal, creep etc., effect of temperature in human system creates more impact [29, 30]. When sacral region is under pressure for long time (due to immobility), molecules start moving and colliding with each other increasing its temperature. In this condition extracellular fluid starts accumulating leading to physical expansion. This, we call here as thermal expansion mentioned in equation (2). Where, the thermal expansion is proportional to its secant coefficient, initial thickness of the layer in meters, and the temperature difference between initial ambient and reference. With these parameters, equation (2), helps in finding thermal expansion for any individual. For example, two individuals of 22 and 40 years in non-diabetic and one individual of 50 years in diabetic are shown below.
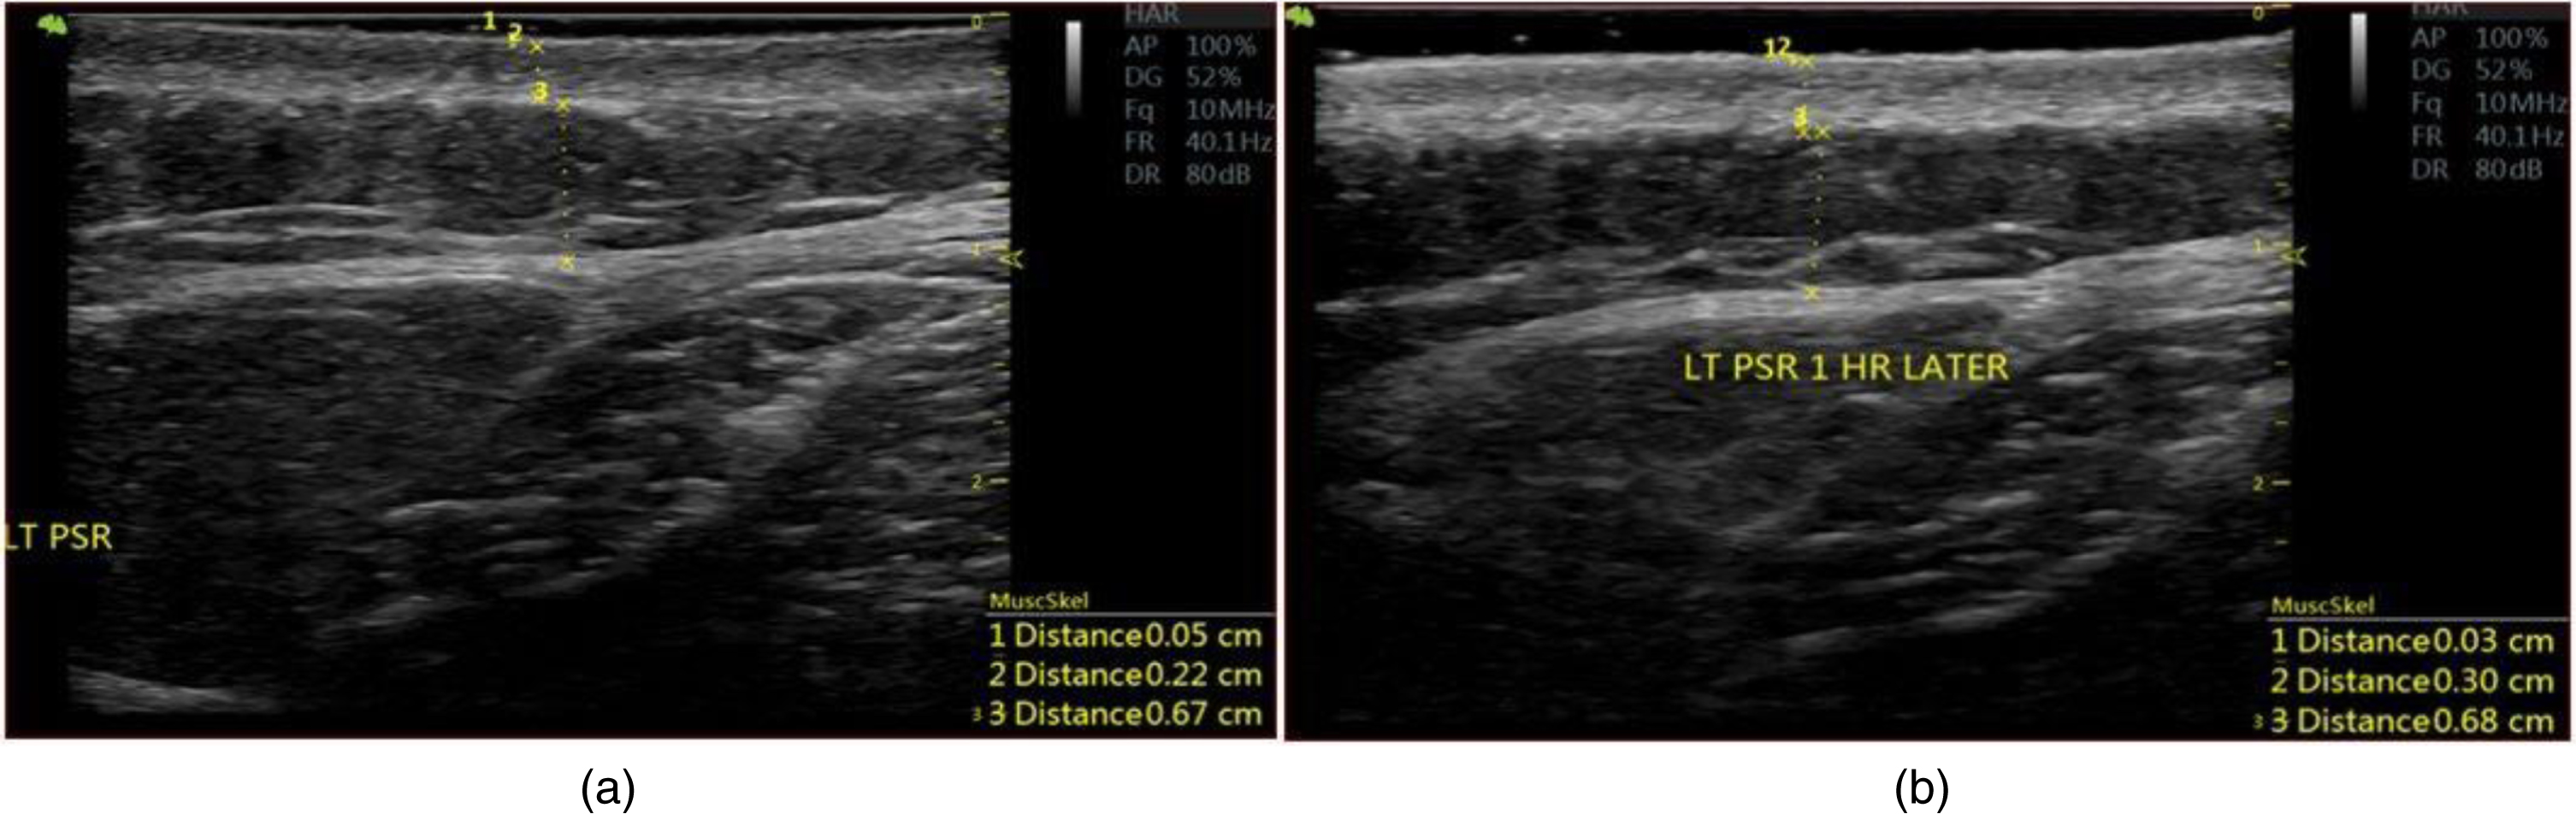
Sample of ultra sound image of the sacral region from group 1: a) initial time b) after one hour.

Sample of ultra sound image of the sacral region from group 2: a) initial time b) after one hour.
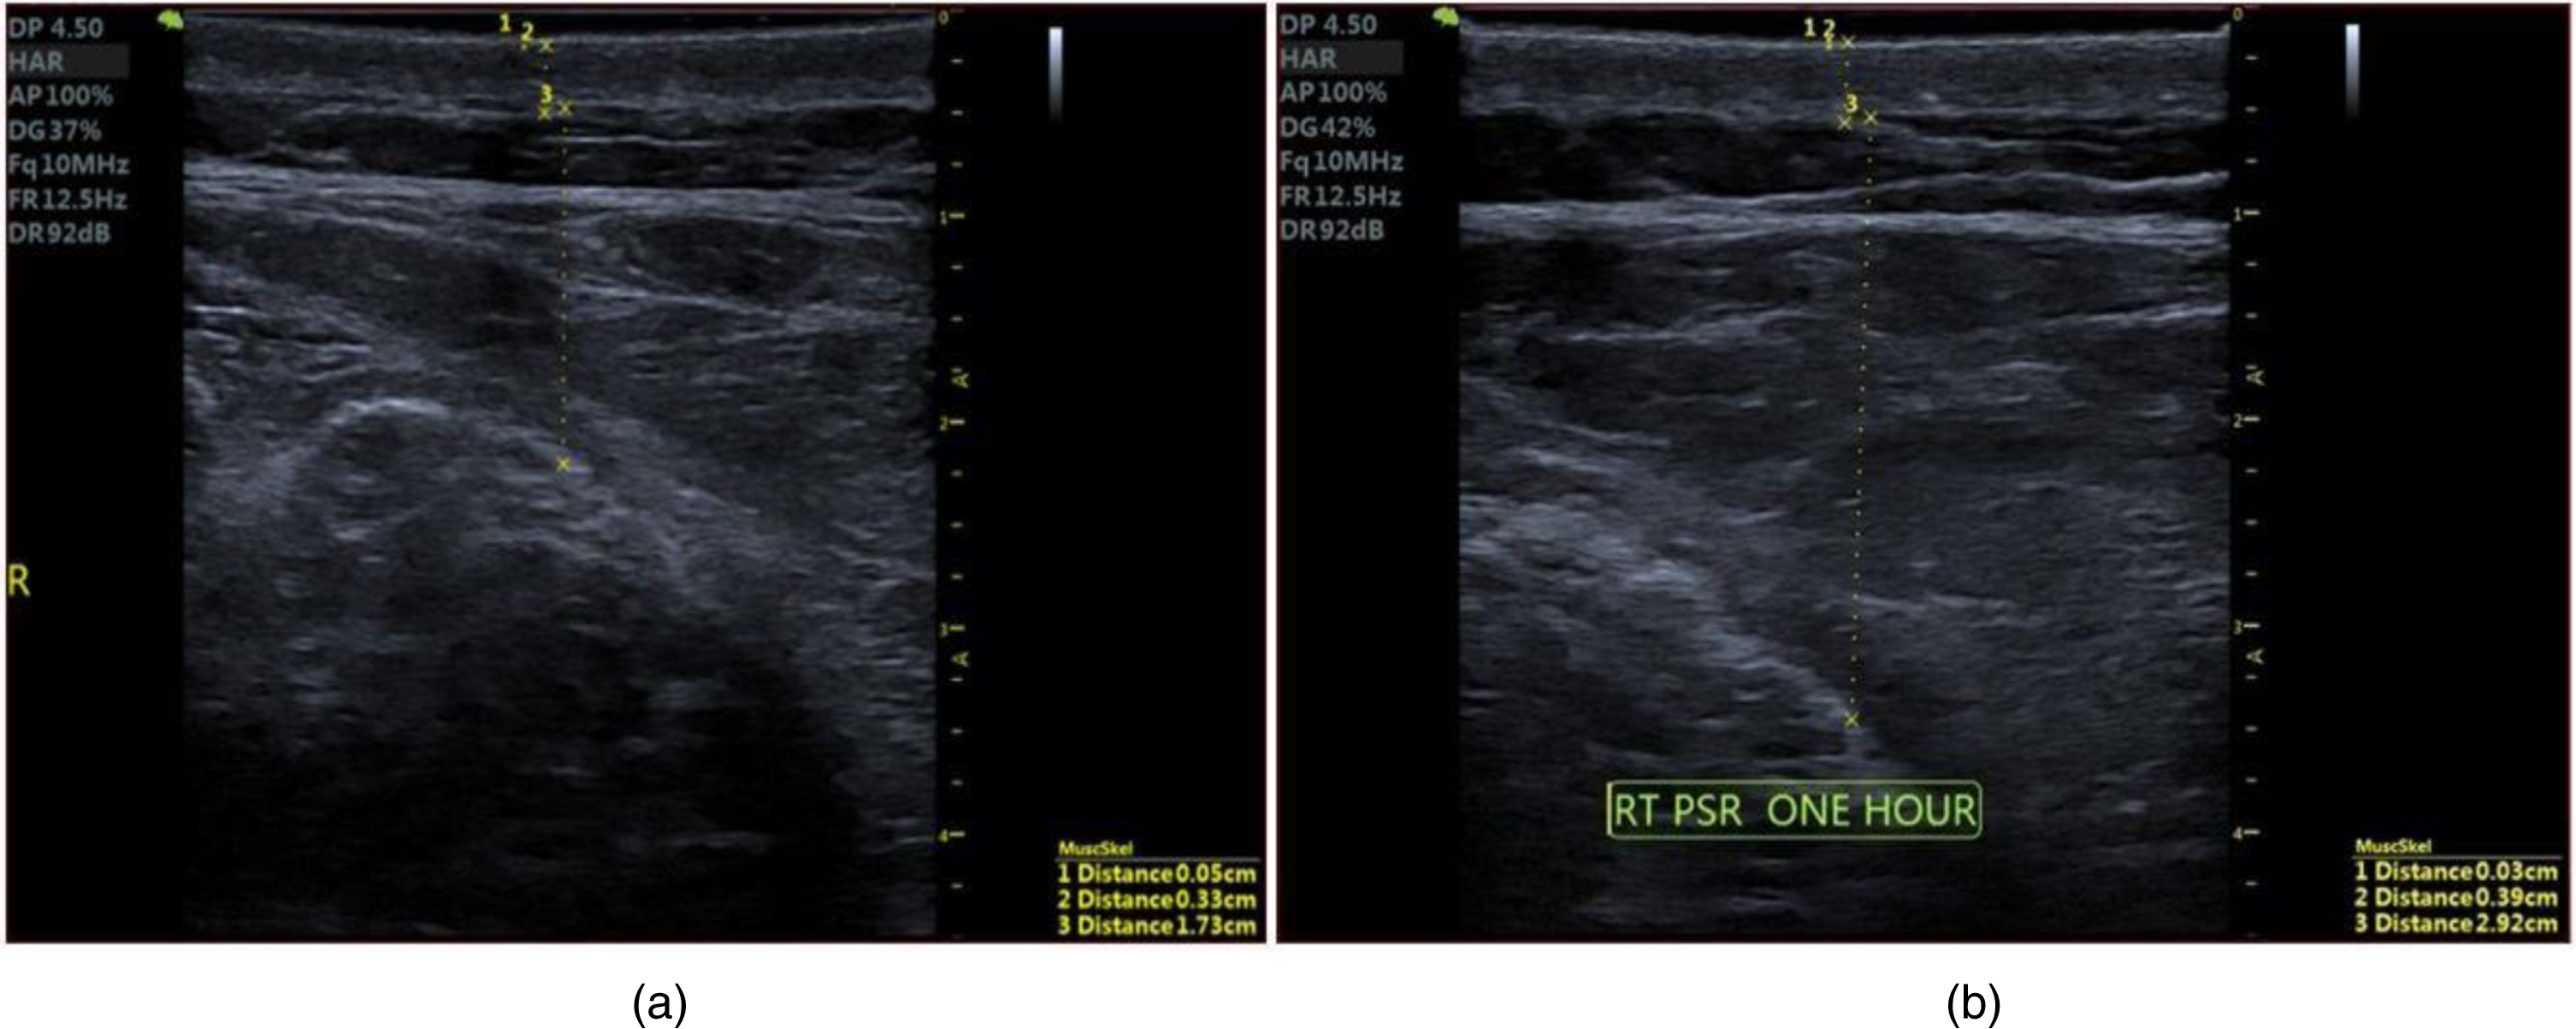
Sample of ultra sound image of the sacral region from group 3: a) initial time b) after one hour.
Comparison of expansion in internal layers of the sacrum between multi physics model and ultrasound images
The expansion observed in fat and muscle layers through the multi-physics modeling is agreeable with real time experiment. Bland Altman Analysis was done between the expansion in the standard model and the ultrasound measurement. It is seen that the results are within 96% tolerance level. Figure 10 (a), (10) b and (10) C shows the comparison in the fat layers of group 1, group 2 and group 3 between the measurements in the standard model and the ultrasound model using Bland Altman Method. Similarly, Figure 11 (a), (11) b and (11)C shows the comparison in the muscle layers of group 1, group 2 and group 3 between the measurements in the standard model and the ultrasound model.

Bland Altman analysis method for comparison of measurements in the fat layers between standard model and the ultrasound for a) Group 1 b) Group 2 and c) Group 3.
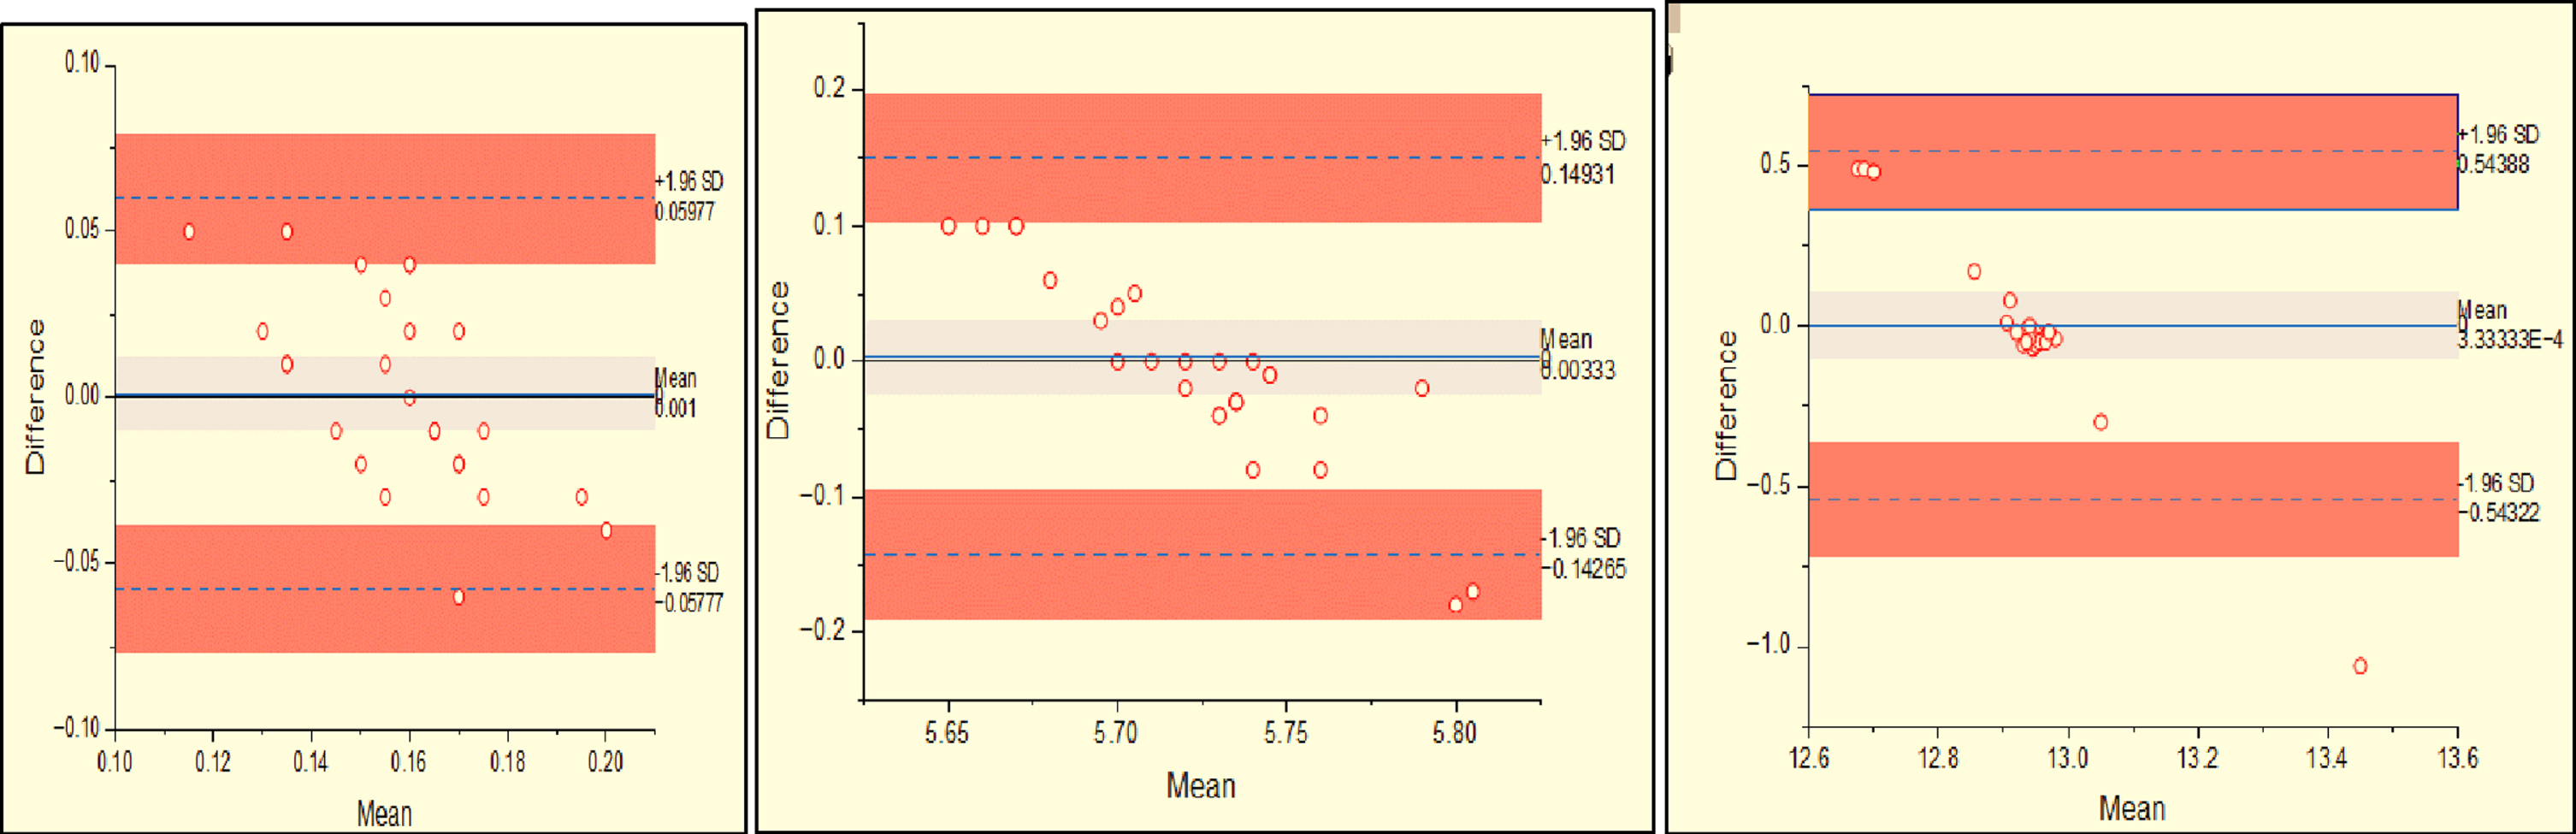
Bland Altman analysis method for comparison of measurements in the muscle layers between standard model and ultrasound for a) Group 1 b) Group 2 c) Group 3.
According to the National Centre for Biotechnology Information, nearly 2 - 5 percent of bedridden subjects are affected by pressure injury every year in the United States [31]. According to centers for Medicare and Medicaid Services, 2007 the additional cost for diagnosis and therapy for hospital acquired pressure injury is $43,180.00 per hospital stay [36]. Diagnosing and treating pressure injury increases the economic burden on the subject and care takers. In some cases, reimbursement also becomes complex despite considering pressure injuries as a severe event to be reported [32]. Bereded et al. [33], has compared the subjects confined to wheelchairs and bed and concluded that they are likely to develop 11times and 7.58 times more pressure injury than subjects who walked frequently. Among other bedridden conditions, subjects with diabetes and spinal cord injuries are most affected by pressure injuries [34]. Hence there is a need to predict pressure injuries at admission to avoid the implications of pain and economic burden of such subjects. On this basis, we have come out with a simple assessment technique to study the impact of pressure on temperature and stress in the inner layers of the skin. Although the main contributing factors for pressure injury formation are pressure, shear, friction and force, effect of pressure is more dominant.
The onset of pressure injury is always preceded by expansion happening in fat and muscle due to formation of edema. This expansion is computed through equation (2) after obtaining temperature from the standard model. For example, model corresponding to Fig. 7 (a) and 7 (b), before and after loading for one hour is shown in Fig. 12 (a) and 12 (b) and the expansion from the model is shown in Fig. 12 (c). It is found that when the fat and the muscle layers are coupled by combining their bio-thermal and the biomechanical properties, there is an expansion of 0.9 mm (considering fat and muscle layers alone). The corresponding expansion obtained through US images; Fig. 7 (a) and 7 (b) shows initial thickness of 0.22 mm and 0.67 mm in fat and muscle layers respectively.
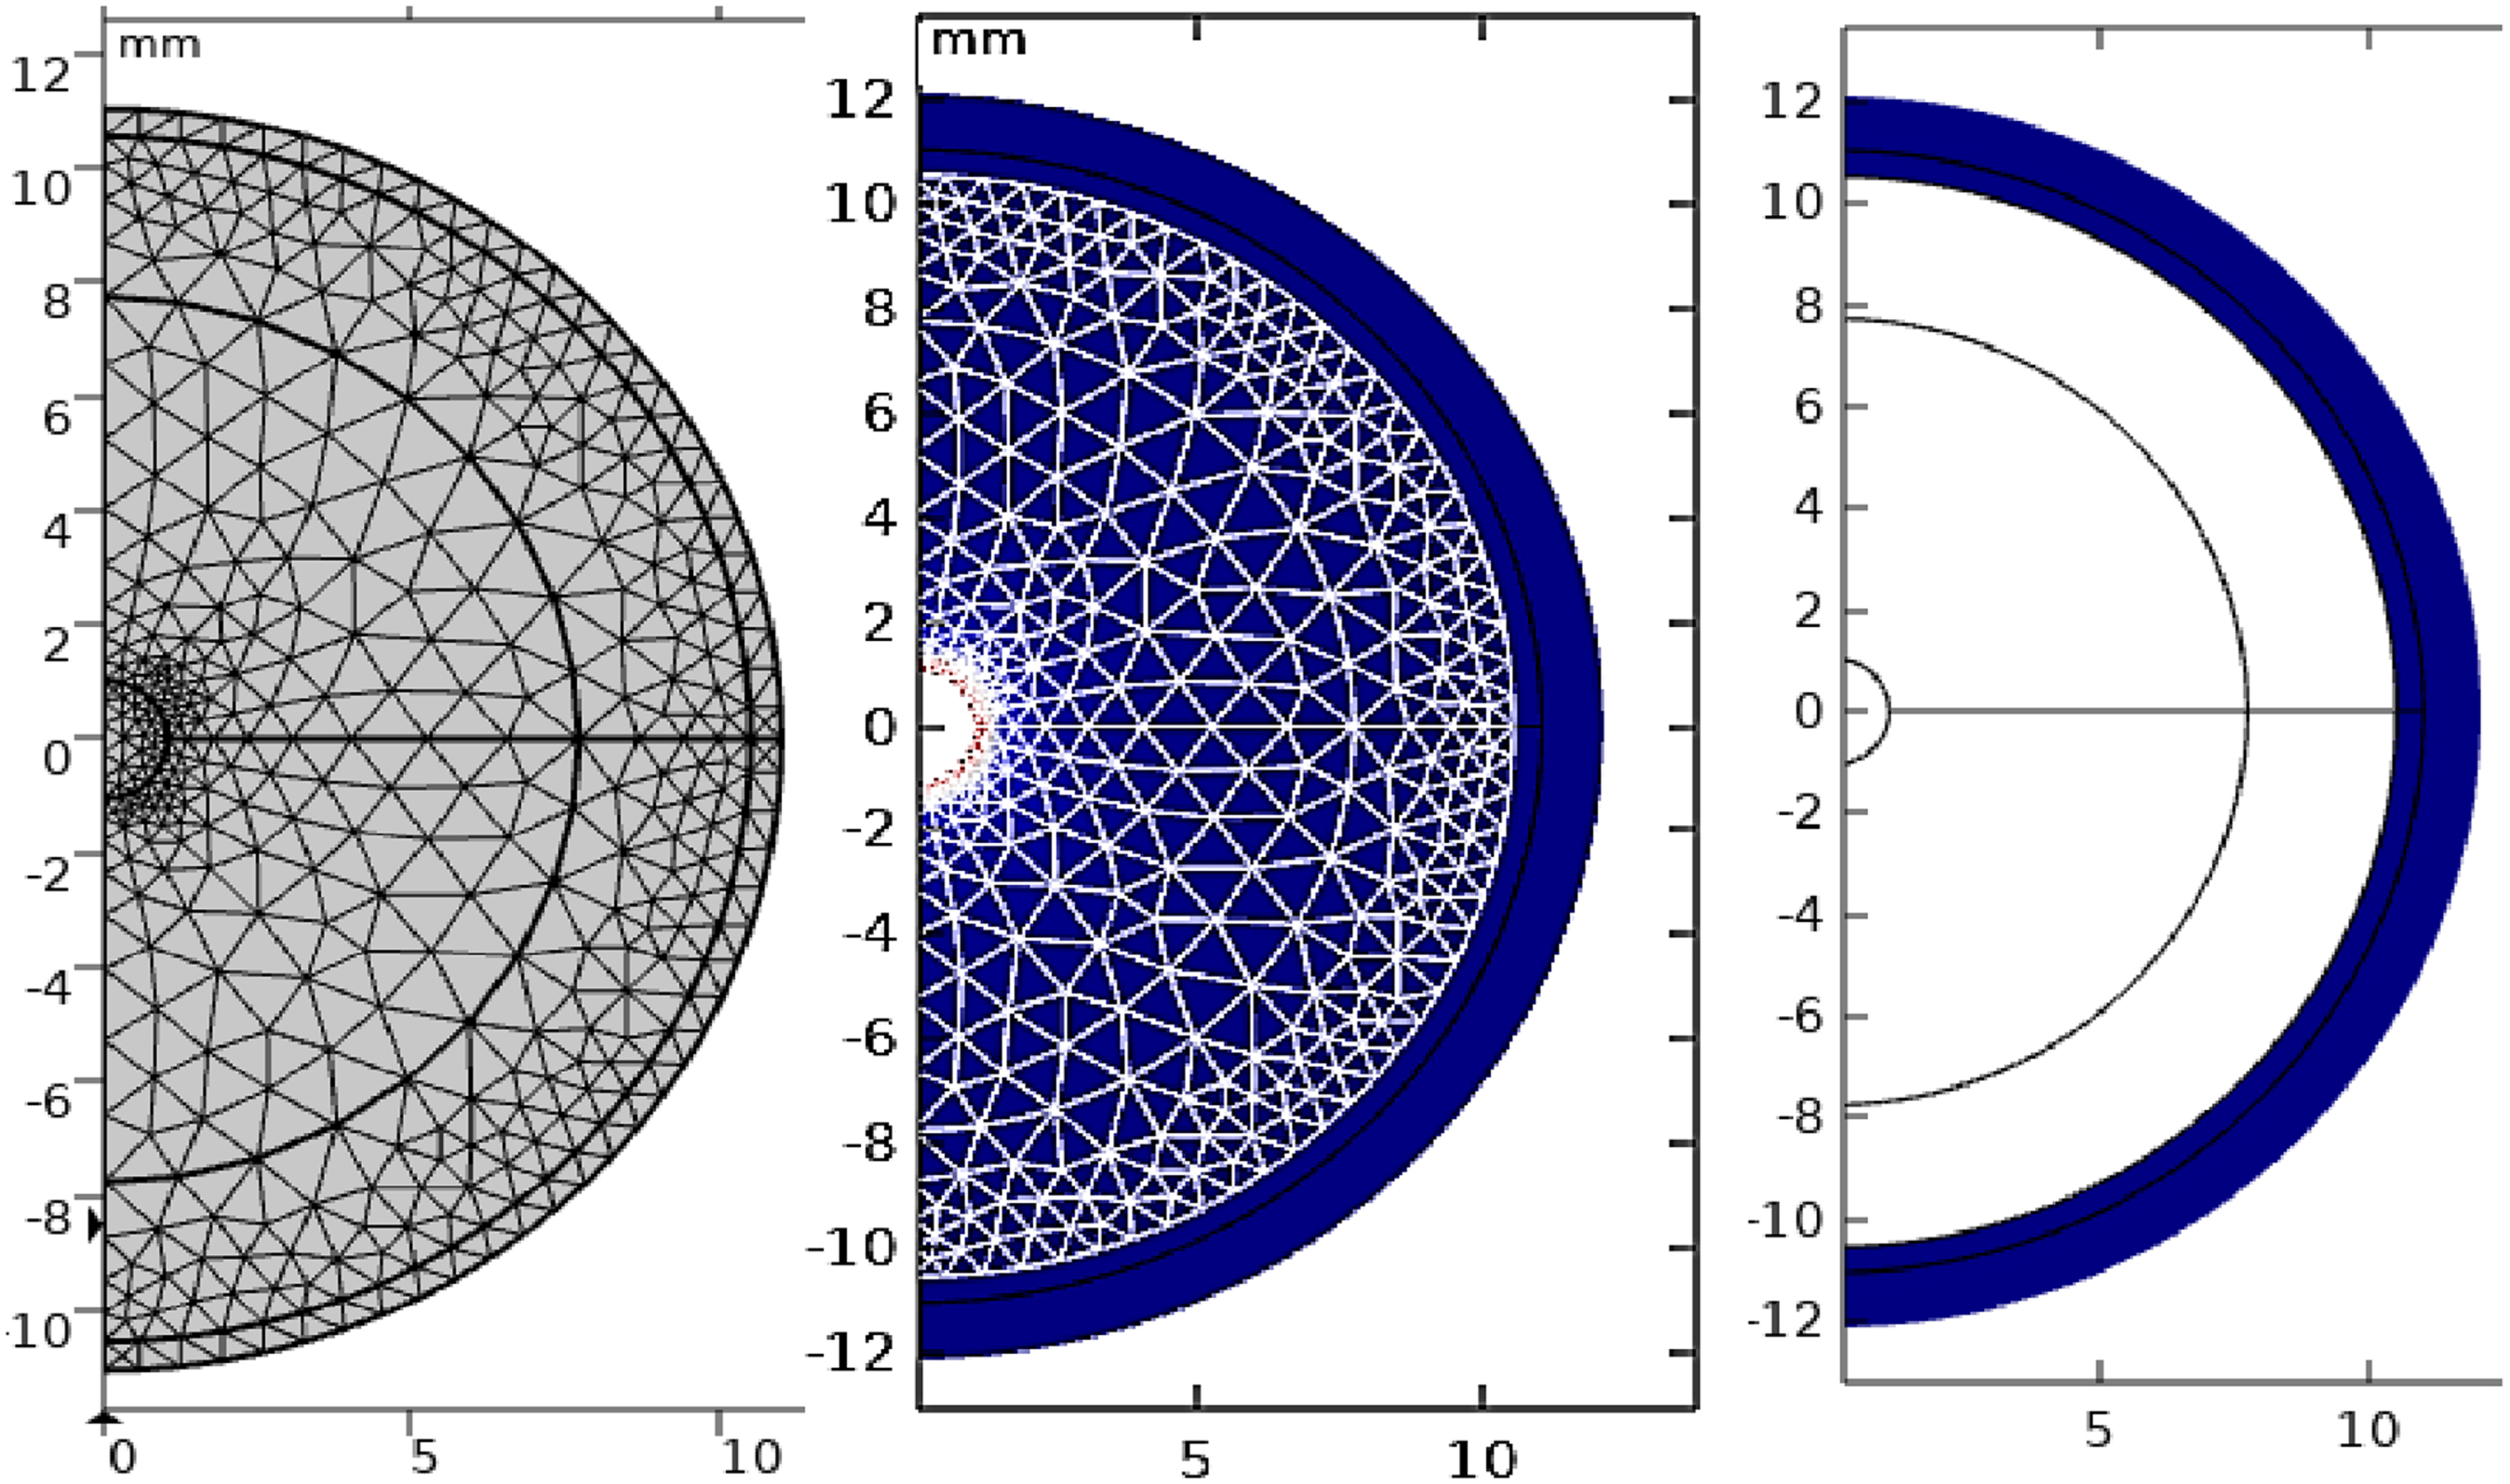
Multi-physics model of sacrum region for a sample from group-1: a) initial time b) after one hour c) expansion in the model. Time dependent study was performed after subjecting the constructed model under continuous load. The thermal expansion from the model coincides with the values obtained from ultrasound images of the same sample. (Figure 7).
These two layers increase to 0.30 mm and 0.68 mm after one hour of pressure, totalling to a difference of 0.9 mm which exactly tallies with the model output. The Young’s modulus, skin temperature, and self-load were considered to be the main factors in this method that were most susceptible to change. We were able to get equivalent results for group 1 and group 2 subjects using both the computational technique and the ultrasound data. However, there was a disparity in the measurements for the group 3 diabetes subjects. This was due to the fact that individuals with diabetes had significantly different tissue perfusion, which had an impact on the occurrence of pressure injuries [19, 41,43]. In addition to the previously stated parameters, the perfusion rate, one of the bio-thermal characteristics, was altered for group 3 individuals due to the participants’ diabetes.
As a result, we were able to get a result that was more consistent with the individuals’ ultrasound results. Thus, the proposed model could indicate the amount of thermal expansion in given time. This method would help the caretaker of bedridden subjects in deciding the time interval at which the subjects must be periodically turned [42]. Gefen et al., states that subject specific computational model if developed based on the parameters obtained by standard testing procedure could predict the damage to tissues from the computed deformation in each layer. This further strengthens our claim that the physical expansion in each layer primarily helps in predicting the onset of pressure injury [35]. Bland Altman method shows that the results are with 96 % confidence interval between the ultrasound and the standard model.
The proposed is a model which could predict the change that happens in muscle and fat layers for a given period under continuous pressure. It takes in the mechanical and thermal properties based on age, BMI and environmental conditions. In case of bedridden subjects, due to immobility pressure exerted on sacral region is because of the self-weight. Therefore, fluids start accumulating in the extracellular medium of the tissues. It can be seen that, the amount of accumulation becomes high especially in muscle layer in case of diabetics. The outcome of our prediction can be mainly used for two purposes. Progression of the pressure injury can be predicted and the information can be used to reposition the bedridden subjects and hence prevent it. Thus, based on the hypothesis expressed earlier the computational results are identical with the ultrasound measurements. Hence, the outcomes of this study would benefit bedridden subjects by suggesting the required frequency of physical care.
The time it takes for intracellular fluids to build up in sacral tissues under a one-hour load was computed in this study by taking self-weight, bio-thermal, and bio-mechanical characteristics into account. The sacrum region is chosen because among the other pressure points, it is the region which is most vulnerable to pressure injuries. The computed thermal expansion accounts for the three groups that were previously discussed. In this work, parameters like the Poisson’s ratio, specific heat, specific density, and the metabolic heat source were taken from the literature and assumed to be the same for both the standard model and the subject-specific model. In the advanced work, if the proposed study is turned into a more realistic model with even more individual data, it will be possible to predict onset of pressure injury. In this present study the experimentation is carried out for only one-hour duration. If the modelling is validated from volunteers for who stay in bed more than 2 to 4 hours, it could give valuable information for the care takers to predict the frequency of turning the bedridden subjects. These are the common periods for turning frequency of immobile patients in clinical practice.
Authors’ contributions
The entire research, clinical validation was carried out by the AN. KR participated in result analysis and interpretation as well as in documenting the entire research work. The SN is a clinician who guided all through the work especially during clinical validation.
Declaration of conflicting interest
The author(s) declared no potential conflicts of interest with respect to the research, authorship, and/or publication of this article.
Ethical approval
The study was approved by the ethics committee Rajalakshmi Engineering College, Chennai, India.
Funding
The author(s) received no financial support for the research, authorship, and/or publication of this article.