
Abstract
Many smart mobile devices, including smartphones, smart televisions, smart watches, and smart vacuums, have been powered by Android devices. Therefore, mobile devices have become the prime target for malware attacks due to their rapid development and utilization. Many security practitioners have adopted different approaches to detect malware. However, its attacks continuously evolve and spread, and the number of attacks is still increasing. Hence, it is important to detect Android malware since it could expose a great threat to the users. However, in machine learning intelligence detection, too many insignificant features will decrease the percentage of the detection’s accuracy. Therefore, there is a need to discover the significant features in a minimal amount to assist with machine learning detection. Consequently, this study proposes the Pearson correlation coefficient (PMCC), a coefficient that measures the linear relationship between all features. Afterwards, this study adopts the heatmap method to visualize the PMCC value in the color of the heat version. For machine learning classification algorithms, we used a type of fuzzy logic called lattice reasoning. This experiment used real 3799 Android samples with 217 features and achieved the best accuracy rate of detection of more than 98% by using Unordered Fuzzy Rule Induction (FURIA).
Introduction
Operating systems continue to be dominated by Android on a global scale. The percentage is as high as 74.13%, and other OS platforms have maintained their leadership position since 2012 [1]. It is estimated that 1.2 billion smartphones, or 87% of all smartphones produced by smartphone manufacturers, were shipped globally in 2021 [2]. Based on the demand for Android-based devices in the market, it is anticipated to reach 1.5 billion by 2022 [3]. Due to its completely open source nature, Android has a significant advantage over iOS in terms of popularity. Moreover, Android users have more control over it as they have the choice to download, install, or even modify its source code [4, 5].
While Android users appreciate the convenience brought by its wealth of features and applications, their personal information and critical data are also continuously in danger [7]. Because of the large quantity of private and sensitive information that Android smartphones store, they have become a very enticing surface assault for malware developers [8]. Moreover, security analysts found that for every 11 seconds, there is new Android malware on the rise.
Malware, also known as malicious software, is a computer program designed to cause harm and inconvenience [9]. Malware is evolving, becoming more difficult to analyze [10, 11]. According to [12] and [13], despite numerous malware detection approaches being developed, the number of malware outbreaks continues to rise. To illustrate, the researchers looked at Android malware because new features were added from time to time [14]. However, throughout this time period, most of the malware used features that were very similar to one another, while other malwares used features that were more recent and improved [15]. Therefore, it is necessary for the researchers to maintain their concentration on detecting this malware to fight against rapid growth of Android malware.
Coping with the nature of malware that always keeps changing, machine learning based is one of the approaches that can be considered to solve the problem regarding the limitation of malware detection. Therefore, many Android security practitioners adopt machine learning to detect malware. Machine learning techniques are a promising option for future prediction and have been involved in a huge number of samples to discover different fields, from facial recognition to genomics [16–18]. Machine learning (ML) is a technique for predicting future decisions (outputs) based on previously trained inputs (learning set). ML lets the computer discover and learn from the input data and is able to achieve accurate data and reliability.
However, to develop a robust machine learning model, selecting the features for machine learning is crucial [19, 20]. This is due to excessive insignificant features that will increase the dimensionality of datasets and irrelevant data, which will decrease the value of the detection’s accuracy [21, 22]. Therefore, it is important to find significant features to attain outstanding Android malware detection.
This study proposes the Pearson correlation coefficient (PMCC) algorithm with Heatmap to find the most correlated features between each other and identify the best and most significant among all Android features. Subsequently, the Unordered Fuzzy Rule Induction (FURIA) algorithm utilized those PMCC + Heatmap features for machine learning classification. This research detects Android malware, and the main contributions of this paper are as follows: Applied to a real dataset of 3799 samples with 217 features containing both anomalies and benign The experiment applied the selected features using a static analysis technique Applied Pearson correlation coefficient (PMCC) algorithm with a unique correlation matrix heatmap Adopted Unordered Fuzzy Rule Induction (FURIA) as a machine learning classification to detect Android malware, using the PMCC + heatmap unique features. We evaluated the proposed method with six state-of-the-art peer approaches in present literature. Our detection results achieved high accuracy in classification performance.
The remainder of this paper is structured as follows. Section 2 surveys the related works. Section 3 provides the methodology of the experiment. Section 4 presents the result, and Section 5 delivers the conclusion.
Related work
Feature selection is a strategy for determining the best feature subset, which can minimize processing complexity and enhance learning model performance by removing unnecessary information. For example, Alessandro et al. [23] selected a small feature subset from the list of the most important features and proved that these small subsets of features are sufficient for good classification. Hence, there is a need to reduce the features as it reduces overfitting, improves accuracy and reduces training time.
This study adopts the Pearson Product-Moment Correlation Coefficient (PMCC) algorithm with a Heatmap to reduce and identify the best features from the dataset. From a data scientist’s point of view, checking correlations between features is a crucial part of the exploratory data analysis process [24, 25]. Many researchers in many fields adopt the Pearson correlation coefficient (PMCC) technique. It is used to coefficient measure the linear relationship between two sets of data by dividing the product of each data sample’s standard deviation [26].
Previous studies are compiled in Table 1, along with their use of various feature selection strategies to achieve reduced feature sets. To the author’s knowledge, recent studies have adopted different feature selection algorithms to discover significant features. Additionally, in Algorithm column, it summarizes different types of machine learning algorithm used including Decision Tree (DT), Logical Regression (LR), Random Forest (RF), Naïve Bayes (NB), Support Vector Machine (SVM), and K-nearest Neighbors (KNN) However, there is an unavailable study that utilizes PMCC, and subsequently combines it with Heatmap (PMCC + heatmap) in Android malware detection.
Feature selection in previous studies
Feature selection in previous studies
Legends: FDS – Frequency differential selection, PCA – Principal component analysis, DT – Decision tree-based, GA – Genetic-based algorithm, PMCC – Product moment correlation coefficient.
Recent research in [27] proposed frequency differential selection (FDS) with weight measurement algorithm for feature selection, including the results of permission-based static analysis. However, while this research obtained 99% accuracy, their constraint of feature division is slightly rough, limiting some features for the FDS algorithms. Additionally, they performed different classifiers including KNN, Decision Tree, and Random Forest for malware detection.
Xusheng et al. [28] have presented a practical approach to remove irrelevant features in detecting Android malware. This study proposed the union of seven feature selection algorithms (DT, GBDT, ET, Chi2, GA, SVM-RFE and MI) to identify the best features to feed to the classifier model. However, these various feature selection methods use different mechanisms, resulting in different results for each feature selection algorithm. Therefore, obtaining guaranteed best features in practical applications is difficult.
Studies in [28] used 1664 samples with 806 of them are malware applications and 858 are benign applications. In a similar vein, studies in [29] used 2000 samples to validate the detection accuracy. However, the malware dataset used in these studies are smaller in comparison to the proposed method. A wide range of datasets contributes to enhanced malware classification efficiency [30].
Study in [29] used Principal Component Analysis (PCA) for feature selection algorithm. Furthermore, this study focused on the classification of the Android applications using Support Vector Machine (SVM) classifiers. The results indicated a detection accuracy rate of 94%. However, in the author’s knowledge, to date, it is still unavailable study that adopting PMCC + Heatmap for feature selection for Android malware detection. Hence, this paper discovers the potential of PMCC, and combines it with the heatmap method. Table 1 lists previous studies that adopt different features selection algorithm to discover significant features.
The process of selecting the highlights that contribute the most to the detection made by machine learning is referred to as the feature selection cycle. In this cycle, we physically or logically select those highlights. When our machine learning model attempts to cover all of the data points in a dataset, or more data points than are required to be present in that dataset, we have a problem called overfitting which results in poor and unreliable accuracy results [36, 37]. Therefore, it is necessary discover the list of significant features and simultaneously reduce the number of features as this will reduce overfitting, improves accuracy, and decreases training time [19].
This research utilizes the Product moment correlation coefficient (PMCC) algorithm in conjunction with a one-of-a-kind Correlation Matrix Heatmap in order to narrow down the features of the dataset and determine which ones are the most beneficial [38]. The correlation matrix data structure may be used if there are several variables and the goal is to identify the correlation between all of them and store them in a suitable data structure. The correlation coefficient can be used to calculate how the values of two variables change in relation to one another. The correlation coefficient formula is calculated as:
The correlation coefficient result values are only between -1 and 1. If the value is close to 1, there is a positive correlation between the variables. More value to 1, indicates as more significant the variable is, and is suitable to be used for machine learning classification. Next, a value of -1 indicates a negative correlation between the variables. More value towards -1, indicates that the feature is more of an insignificant feature, and is inappropriate to be used in machine learning classification. Finally, a value of 0 indicates that there is no correlation between the variables.
On the other hand, a heatmap is a graphical representation of data where values are depicted by color [38]. The color change could be in hue or intensity, giving the reader a clear visual indication of how the occurrence is clustered or how it changes over time. A heatmap is useful for gathering insights about the feature’s interaction visually in a form of heat color. Here is a sample of heatmap created to understand the linear relationship between different variables in the Android dataset. If the variable values (0.8, 0.65,0.47, 0.4, 0.29) are close to 1 as depicted in Fig. 1, the variables have strong positive correlation. Besides that, there are several variables that have no correlation in which the correlation value is close to 0.

PMCC in correlation heatmap.
This paper adopts PMCC with heatmap to find correlation between variables which use scatter plot that visualize the strength of relationship between numerical variables. These can be used to understand which variables are related to each other and the strength of this relationship.
This section describes how we use the Pearson Correlation Coefficient (PMCC) algorithm in conjunction with Heatmap to identify the best features in the Android dataset and Unordered Fuzzy Rule Induction classification method.
General architecture
The architecture of the main system is presented in Fig. 2. They are divided into three phases; 1) data collection; 2) preprocessing (feature extraction and feature selection); and 3) detection.
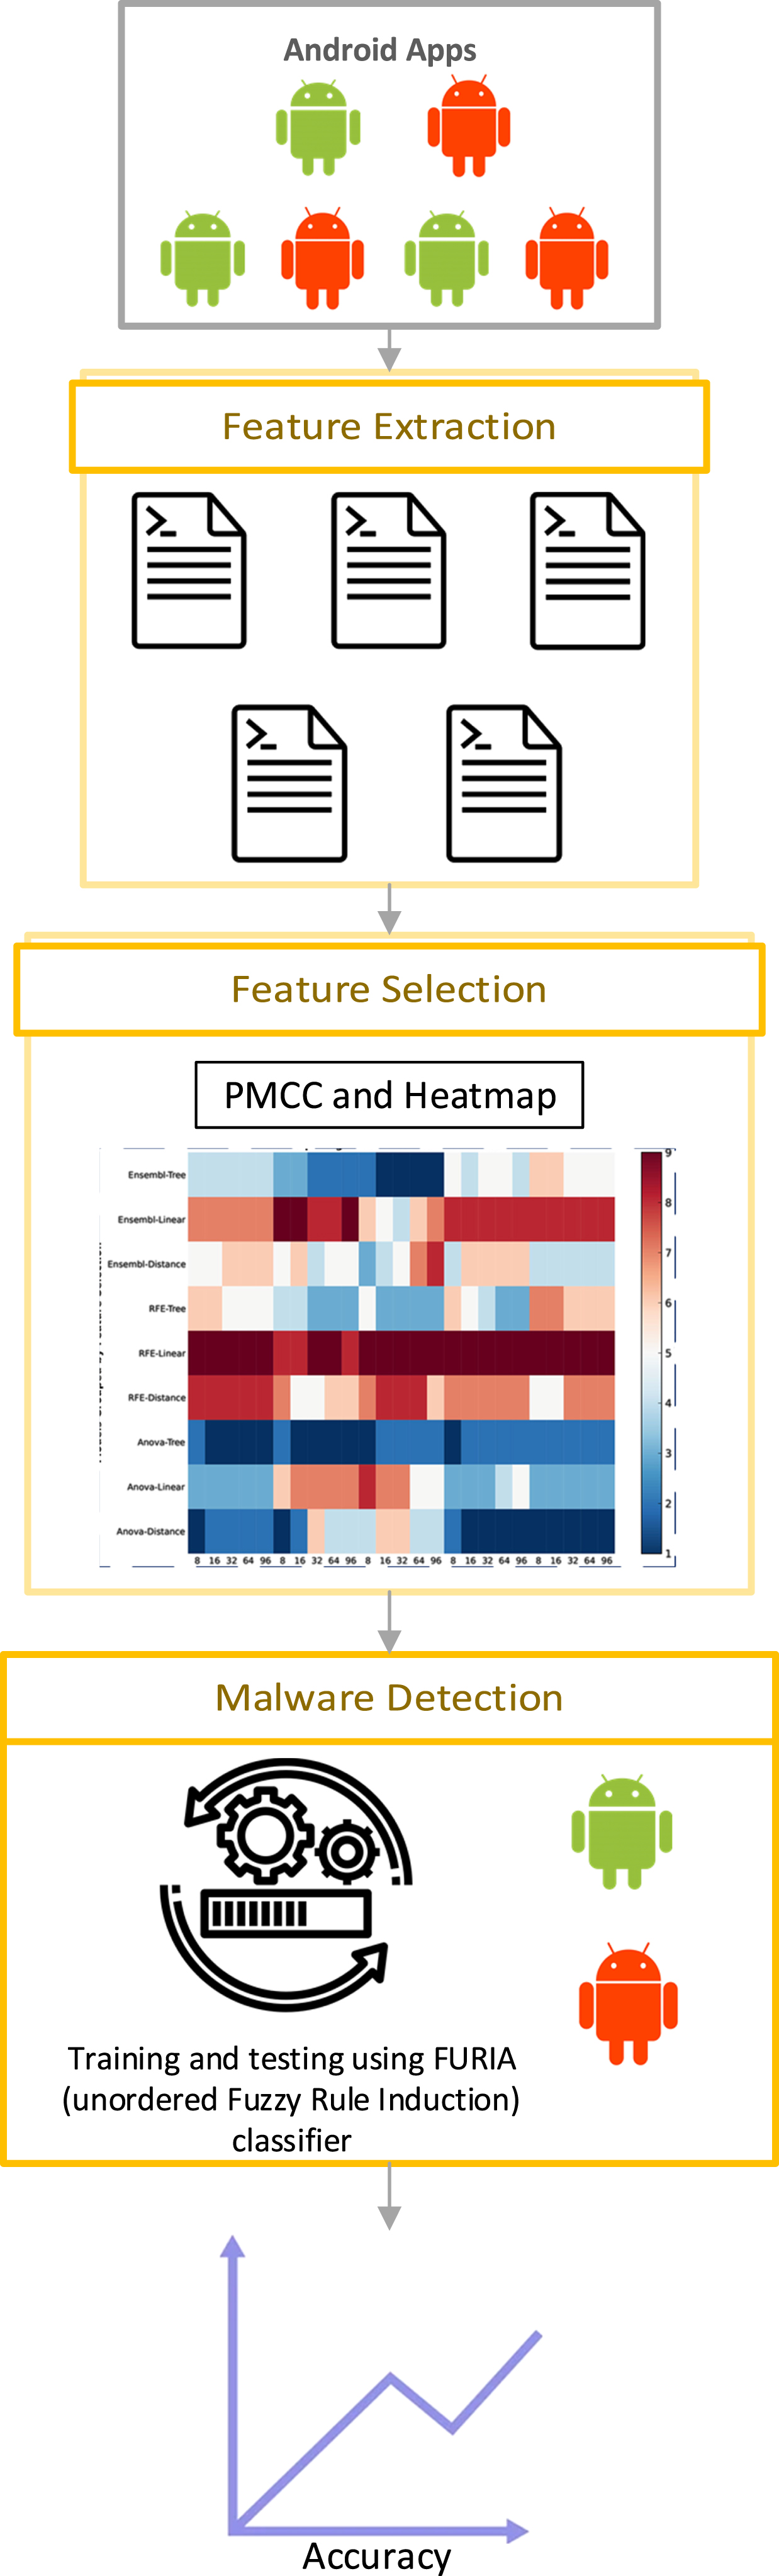
The Android malware detection system.
The detection process begins with the collection of benign and malicious datasets from the Android Malgenome project, which totals 3799 samples. The 2539 benign samples are from AndroZoo, which is owned by Google Play. The malware application is made up of 1260 applications downloaded from the Malgenome database. In this phase, the process involves decompiling the.apk file, extracting and filtering features. The downloaded datasets are extracted and compiled into a.csv file format. Table 2 tabulates the summary of the dataset in the data collection phase.
Summary of the dataset
Summary of the dataset
Considering that Android datasets have different formats and characteristics, preprocessing is crucial for managing the dataset. The preprocessing phase consists of two sub-phases, namely feature extraction and feature selection. These phases are integrated into each other. We preprocess the dataset to extract static features from APK by using various well-known Android application tools developed by Python, Baksmali, and AXMLPrinter.
As shown in Fig. 3, the APK is decompiled to extract the AndroidManifest.xml file and retrieve the application’s permissions and intents. This phase decompressed and converted the APK file to an XML readable format. In addition, we recovered API class through reverse engineering the.dex file using the Baksmali dissembler to retrieve smali code. Although the android application is based on java, this paper used smali code to represent its programming code. This is because smali instruction has finer-grained instruction than java. It is found that each line of java code corresponds to one or more lines of smali code. Resulting in more coverage indicators on datasets which is advantageous. The subsequent process will record the features in binary form and labeled with class values prior to feature selection.
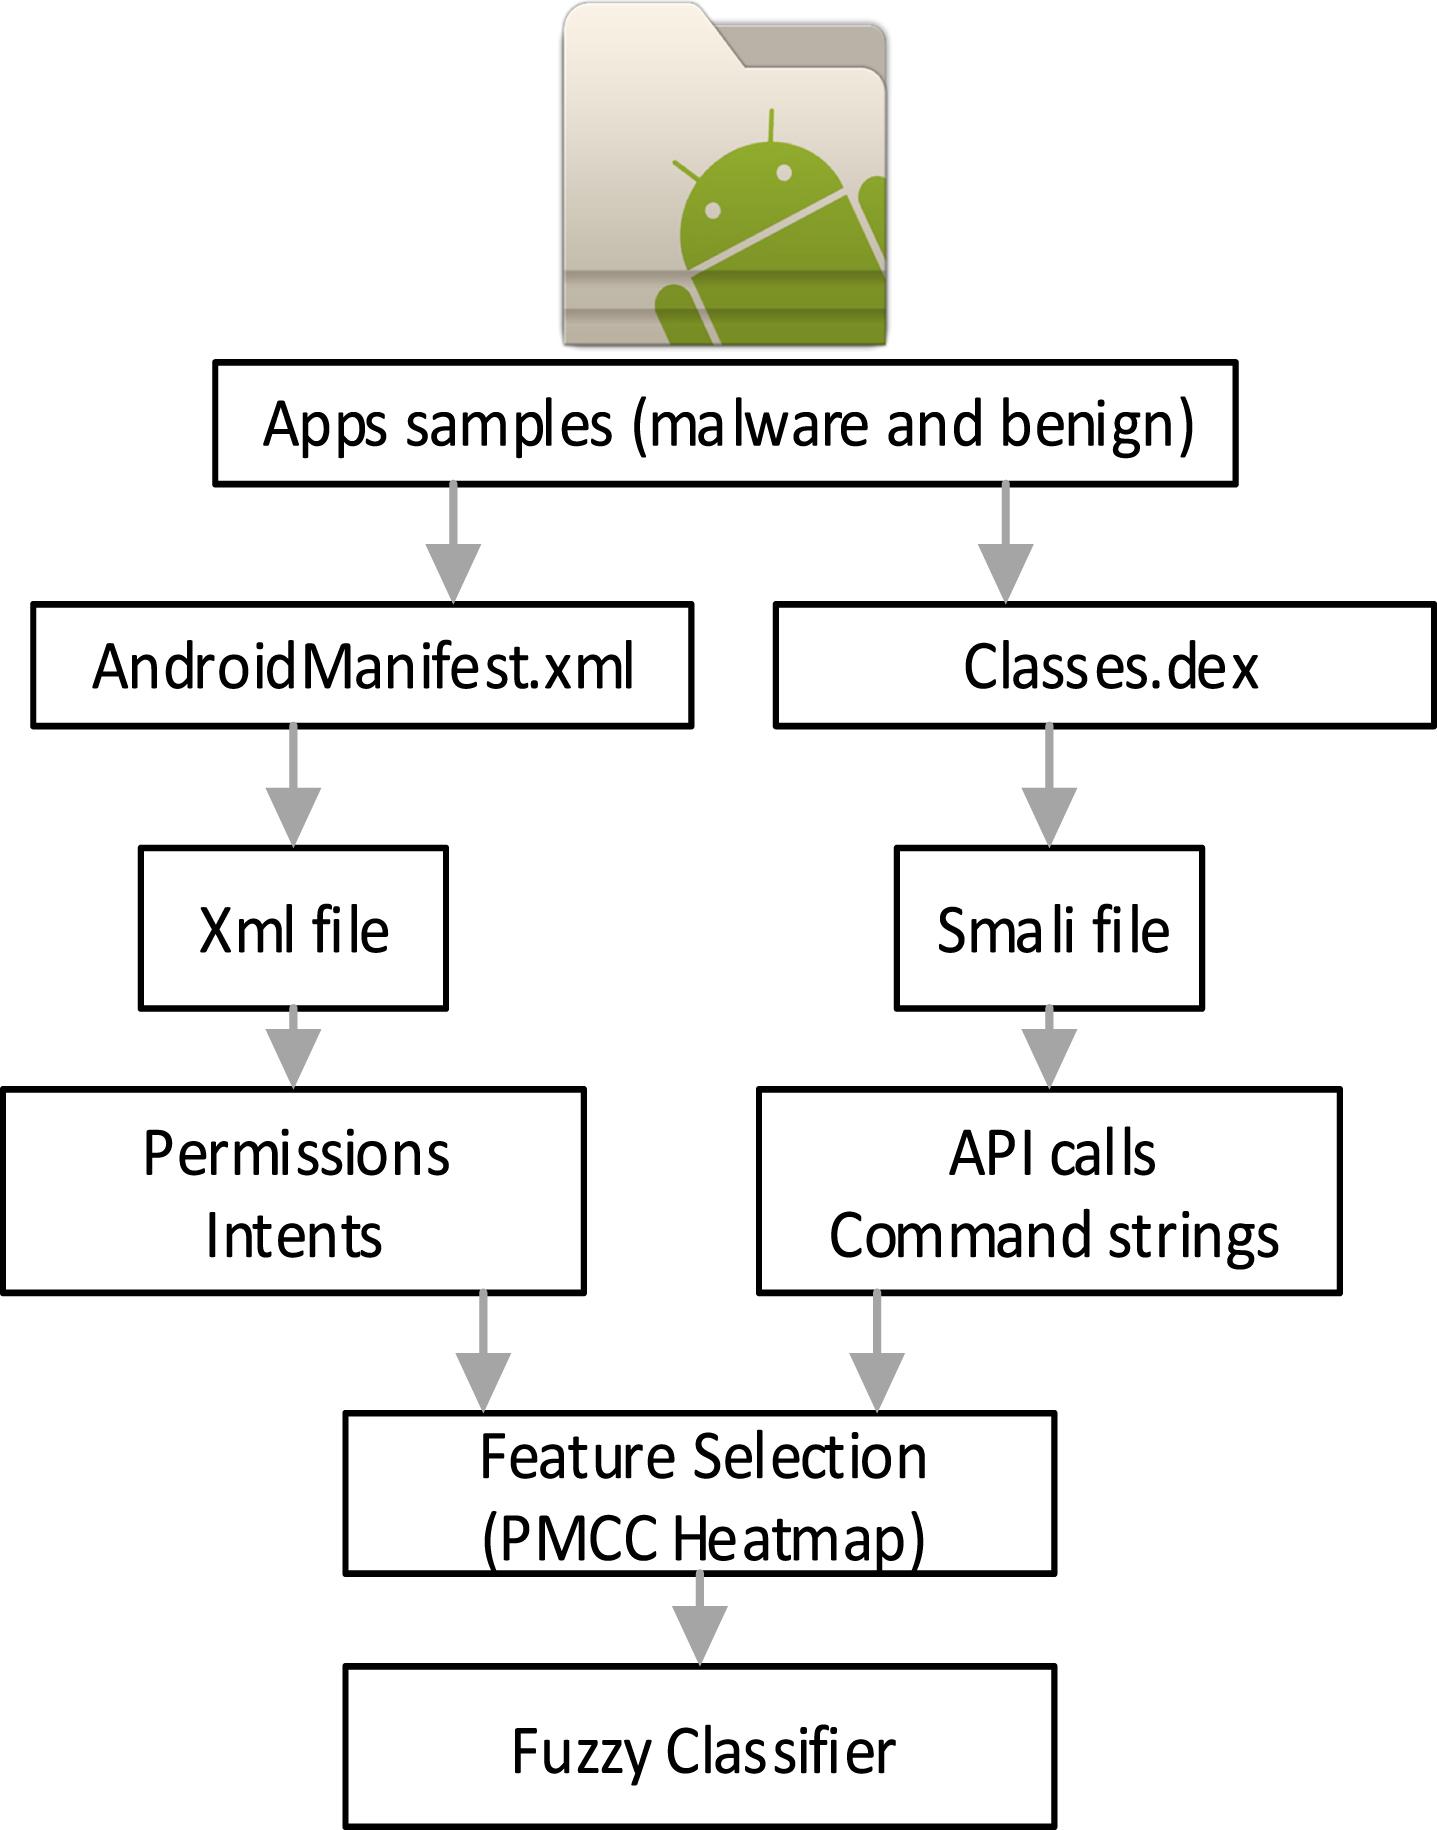
Overview of static feature extraction.
The next process involved in the preprocessing phase is feature selection. Feature ranking and selection are commonly used to reduce dimensionality, which reduces model computing cost. In this study, we adopt the PMCC algorithm with Heatmap to identify the best features in the Android application dataset by extending and filtering certain features that are irrelevant or have a negative impact on the results of classification. Studies in [39] employed permission-based features, another study in [40] and [41] used API call sequence characteristics, and two other studies that used intent [42, 43]. When it comes to training and testing, implementing feature optimization in permission features requires a significant amount of effort, but it aids in avoiding unnecessary lifting and facilitates malware detection.
The Pearson correlation measures the degree to which two variables are linearly connected and ranges from -1 to 1. A value closer to 0 indicates weaker correlation, in which case exact 0 shows no correlation. While a value closer to 1 indicated a stronger positive correlation, a value closer -1 indicated a stronger negative correlation. The heatmap is a dataset consisting of a dataset from Malgenome and Androzoo. The dataset will go through a data cleaning process which involves 215 features with 3799 rows.
Algorithm 1 in Table 3 demonstrates the PMCC with heatmap generated using Python and Seaborn tool to identify the best feature form the dataset. Lines 1-6 is used to read a dataset file and invoke DataFrame to determine the correlation between variables. Then, the Seaborn method is used to create the heatmap to represent the correlation matrix as in Line 9. We discovered strong and weak correlation between the independent variables as in Fig. 4. The PMCC with heatmap plots the output of correlation coefficient based on every feature. Then, the selected features and the number of attributes selected undergo different threshold values (0.1, 0.2, 0.3, 0.4, and 0.5) to get the best feature as an input for the machine learning model.
Constructing feature selection with threshold
The summary of features in different threshold
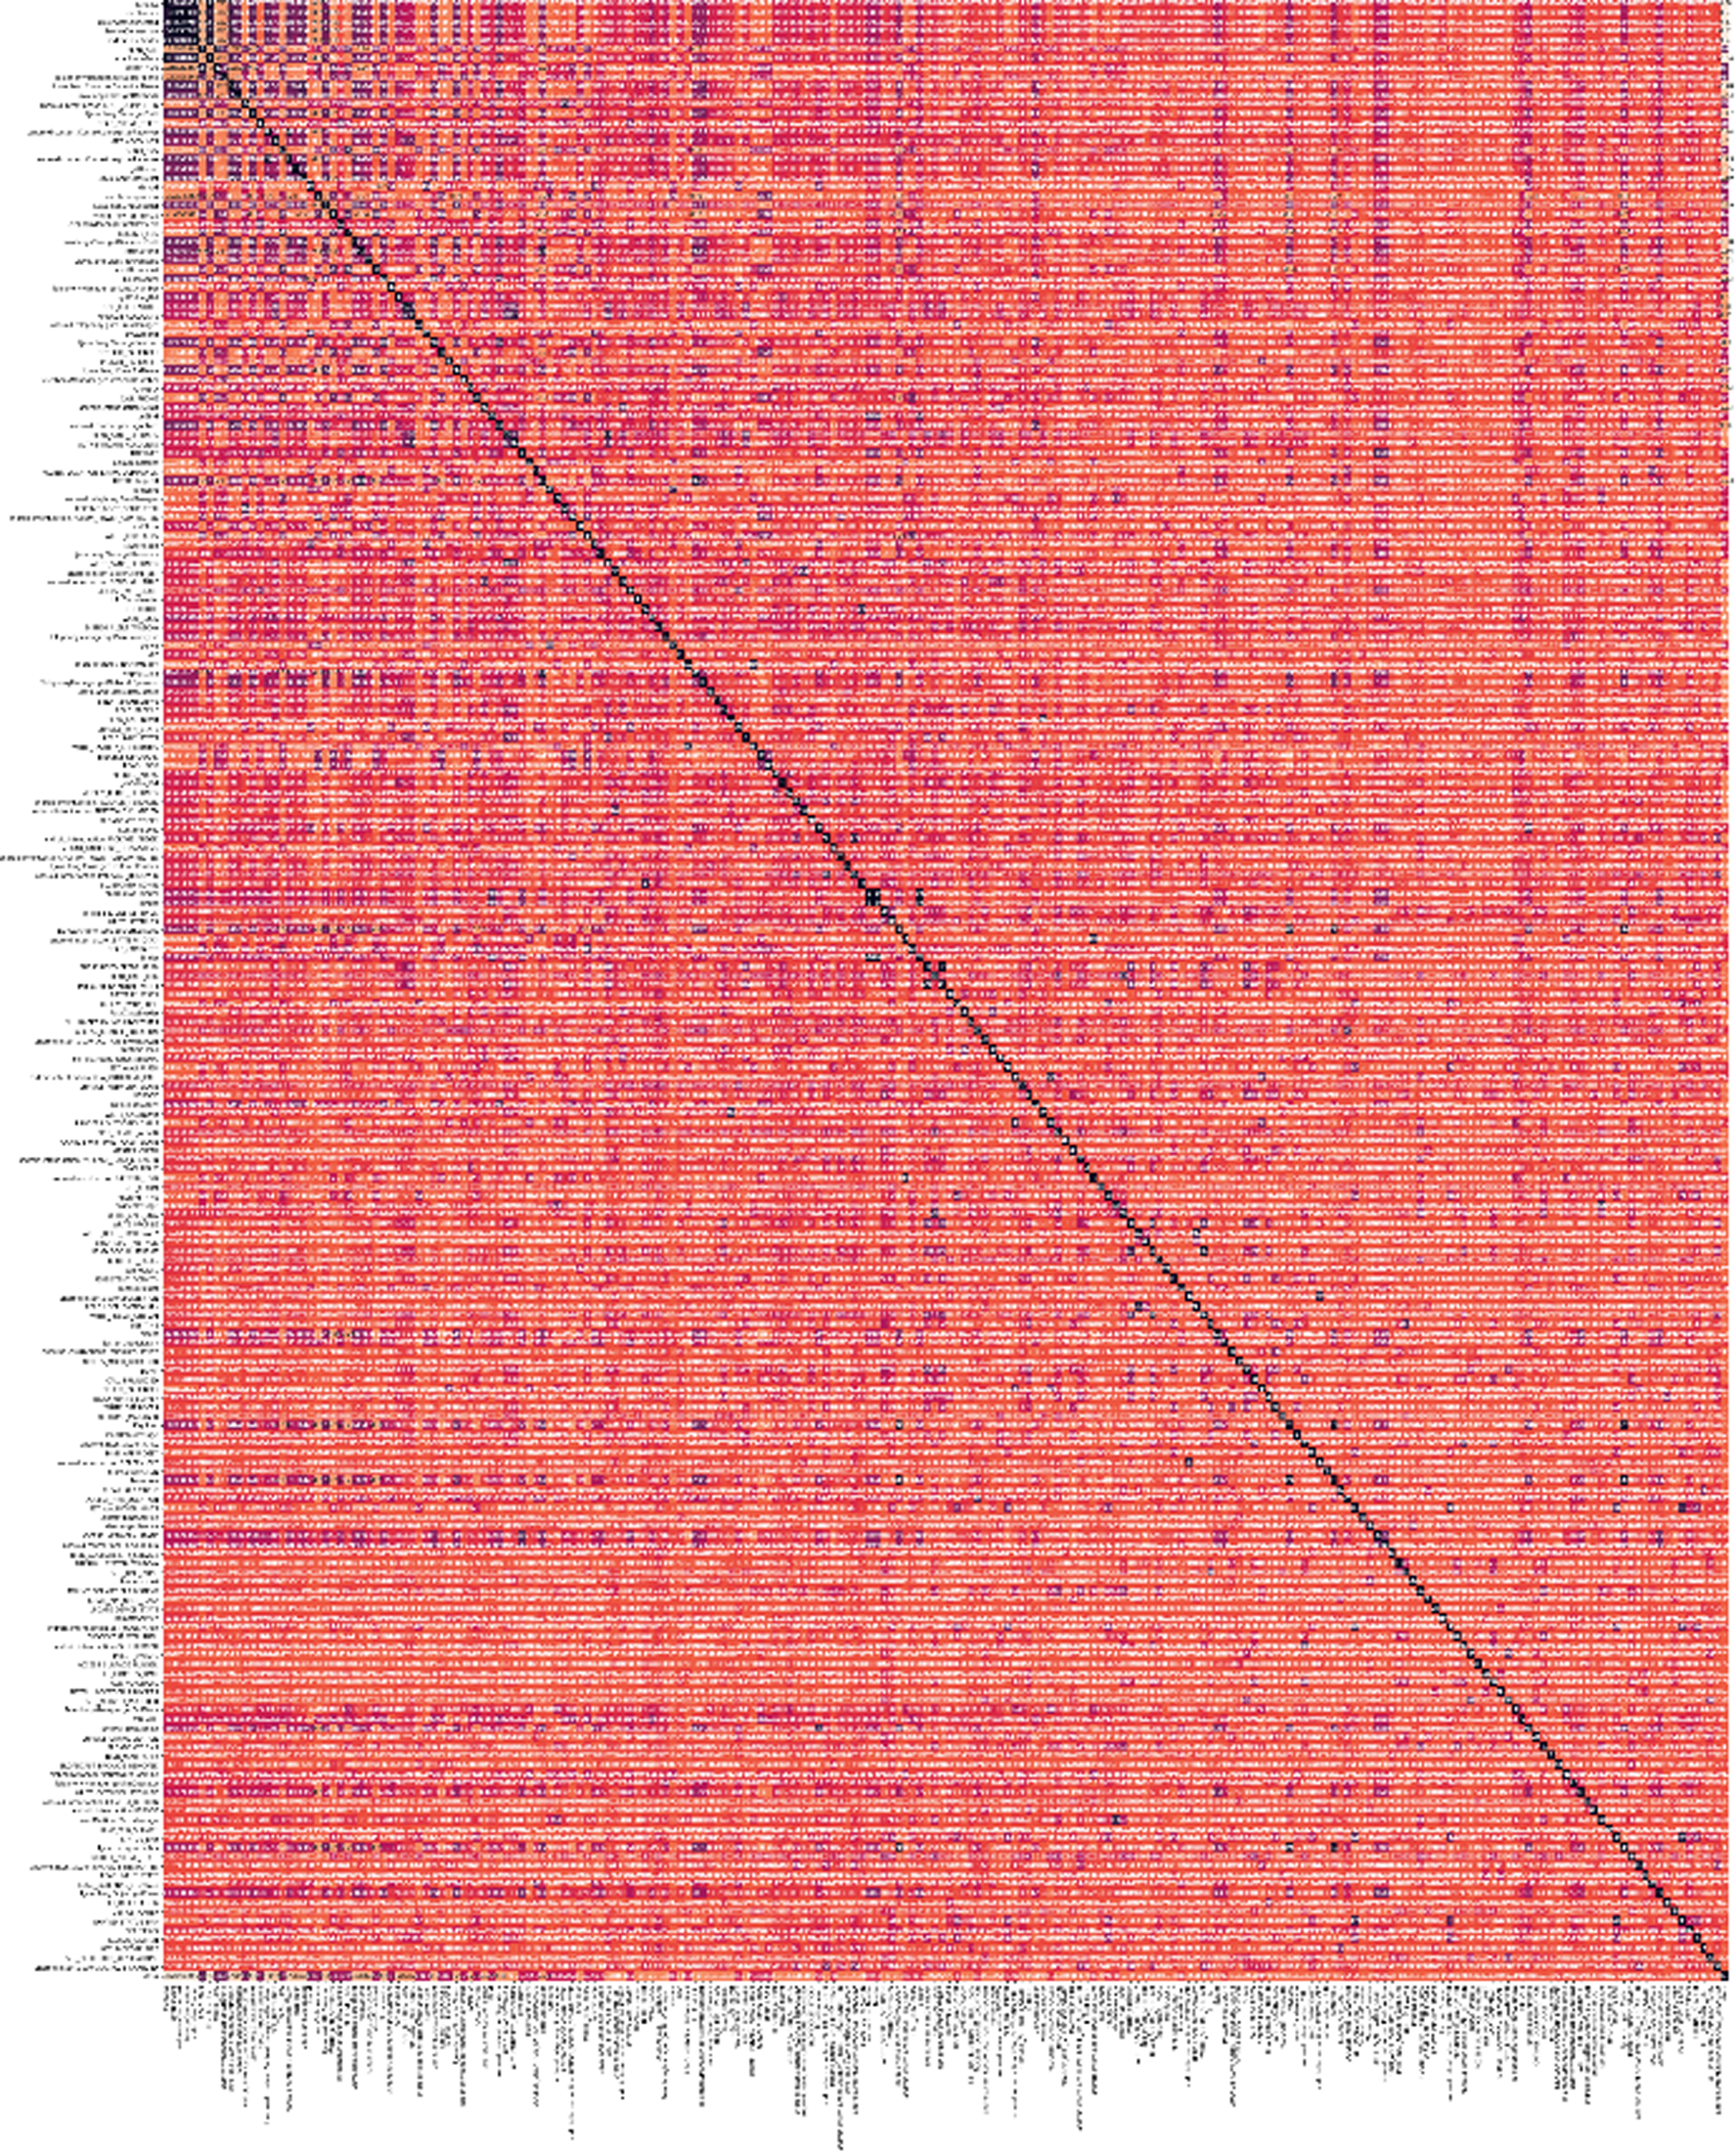
Dataset heatmap with 215 features.
In phase three, this study used the FURIA classifier in machine learning for malware identification, based on PMCC and heatmap features. The Fuzzy Unordered Rule Induction Algorithm, or FURIA for short, is a modification and expansion of the RIPPER rule learner, which is the most advanced rule learner available [44]. FURIA, in particular, learns unsupervised rule sets rather than rule lists and fuzzy rules rather than traditional rules. It also applies an effective rule that extends the method to dealing with uncovered cases.
Fuzzy rule representation
In a RIPPER rule, a selector constraining a numerical attribute Ai (with domain Di = R) can be expressed as (Ai ∈ I), where I ⊆ R is an interval: I=(–∞, p] if the rule contains a selector (Ai≤p), I = [R, ∞) if it contains a selector (Ai≥R), and I = [R, p] if it contains both (in the last case, two selectors are combined). A fuzzy rule is obtained by replacing intervals with fuzzy intervals, i.e. fuzzy sets with trapezoidal membership functions. A fuzzy interval of that type is defined by four parameters and is expressed as I G=(θi,R, θs,R, θs,L, θn,L):
A fuzzy interval can be open to one side (θi,R=θs,R, R = -∞ or θs,L = θn,L =∞). As will be seen later, the fuzzy antecedents sequentially learned by FURIA are exactly that form of fuzzy half interval.
A fuzzy selector (Ai ∈ I F i) encompasses an instance x=(x1... xn) to the degree I F r (xi). A fuzzy rule r F involving r selectors (Ai ∈ I F r), r = 1... n, covers x to the degree
Fuzzification of the rules
The objective is to fuzzify the rules supplied by our enhanced RIPPER algorithm in order to obtain fuzzy rules. The aim is to determine the best fuzzy extension of each rule by evaluating candidates against the training set DT ⊆ D, where a fuzzy extension is defined as a rule with the same structure but fuzzy intervals instead of intervals. The challenge is to find the best limits for each support, Ii, using the original rules as the cores [φc,Li,φc,Ui] of the sought fuzzy intervals I F I, the challenge is to find the best bounds for each support. For instance, to determine φs,Li and φs,Ui.
When fuzzifying a single antecedent (Ai ∈ Ii), it is crucial to evaluate only the relevant training data Di T. For example, to disregard those occurrences that are precluded by any other antecedent (Aj ∈ I F j), j = i:
Di T is divided into two subsets. Positive Di T + instances and negative Di T instances. The purity rule will be applied to assess the quality of the fuzzification:
Results
In this section, we present and discuss the findings of five sets of experiments that utilised the FURIA classifier to assess Android malware detection performance. In all experiments, we set the PMCC threshold (T) value to five different values: T = 0.5, T = 0.4, T = 0.3, T = 0.2 and T = 0.1. Moreover, for classification parameters, we utilize N = 10 and W = 3 for cross-validation and weight assignments, respectively.
Performance metric
Table 5 tabulates all the evaluation measures consisting of accuracy, true positive rate (TPR), false-positive rate (FPR), and more. The measurements of all evaluations, along with the descriptions, are as follows.
List of evaluation measures
List of evaluation measures
Table 6 tabulates the results in accuracy, the most intuitive measure of performance which combines true positive rate (TPR) and false-positive rate (FPR) into account). It is simply the proportion of correctly predicted observations to total observations. If the classification is highly accurate, the model is the best.
Accuracy results
Accuracy results
The table shows that the higher accuracy is between 98.82 and 98.61 when the threshold is between 0.1 and 0.2. Although the gap in the number of features between thresholds 0.1 and 0.2 is large (117 and 60), the accuracy number is still akin to each other, which is in the range of 98%. As our interest is to find the significant features in as small a number as possible, with a smaller number of them, therefore 0.2 is the best threshold.
On the contrary, for the smaller number of features (10), the 0.5 threshold marks the lowest accuracy in the table, which is 87.94%. Even though the number of features is ideal and minimal compared to other thresholds, its accuracy is the lowest among others. This demonstrates that FURIA needs more significant features for its classification.
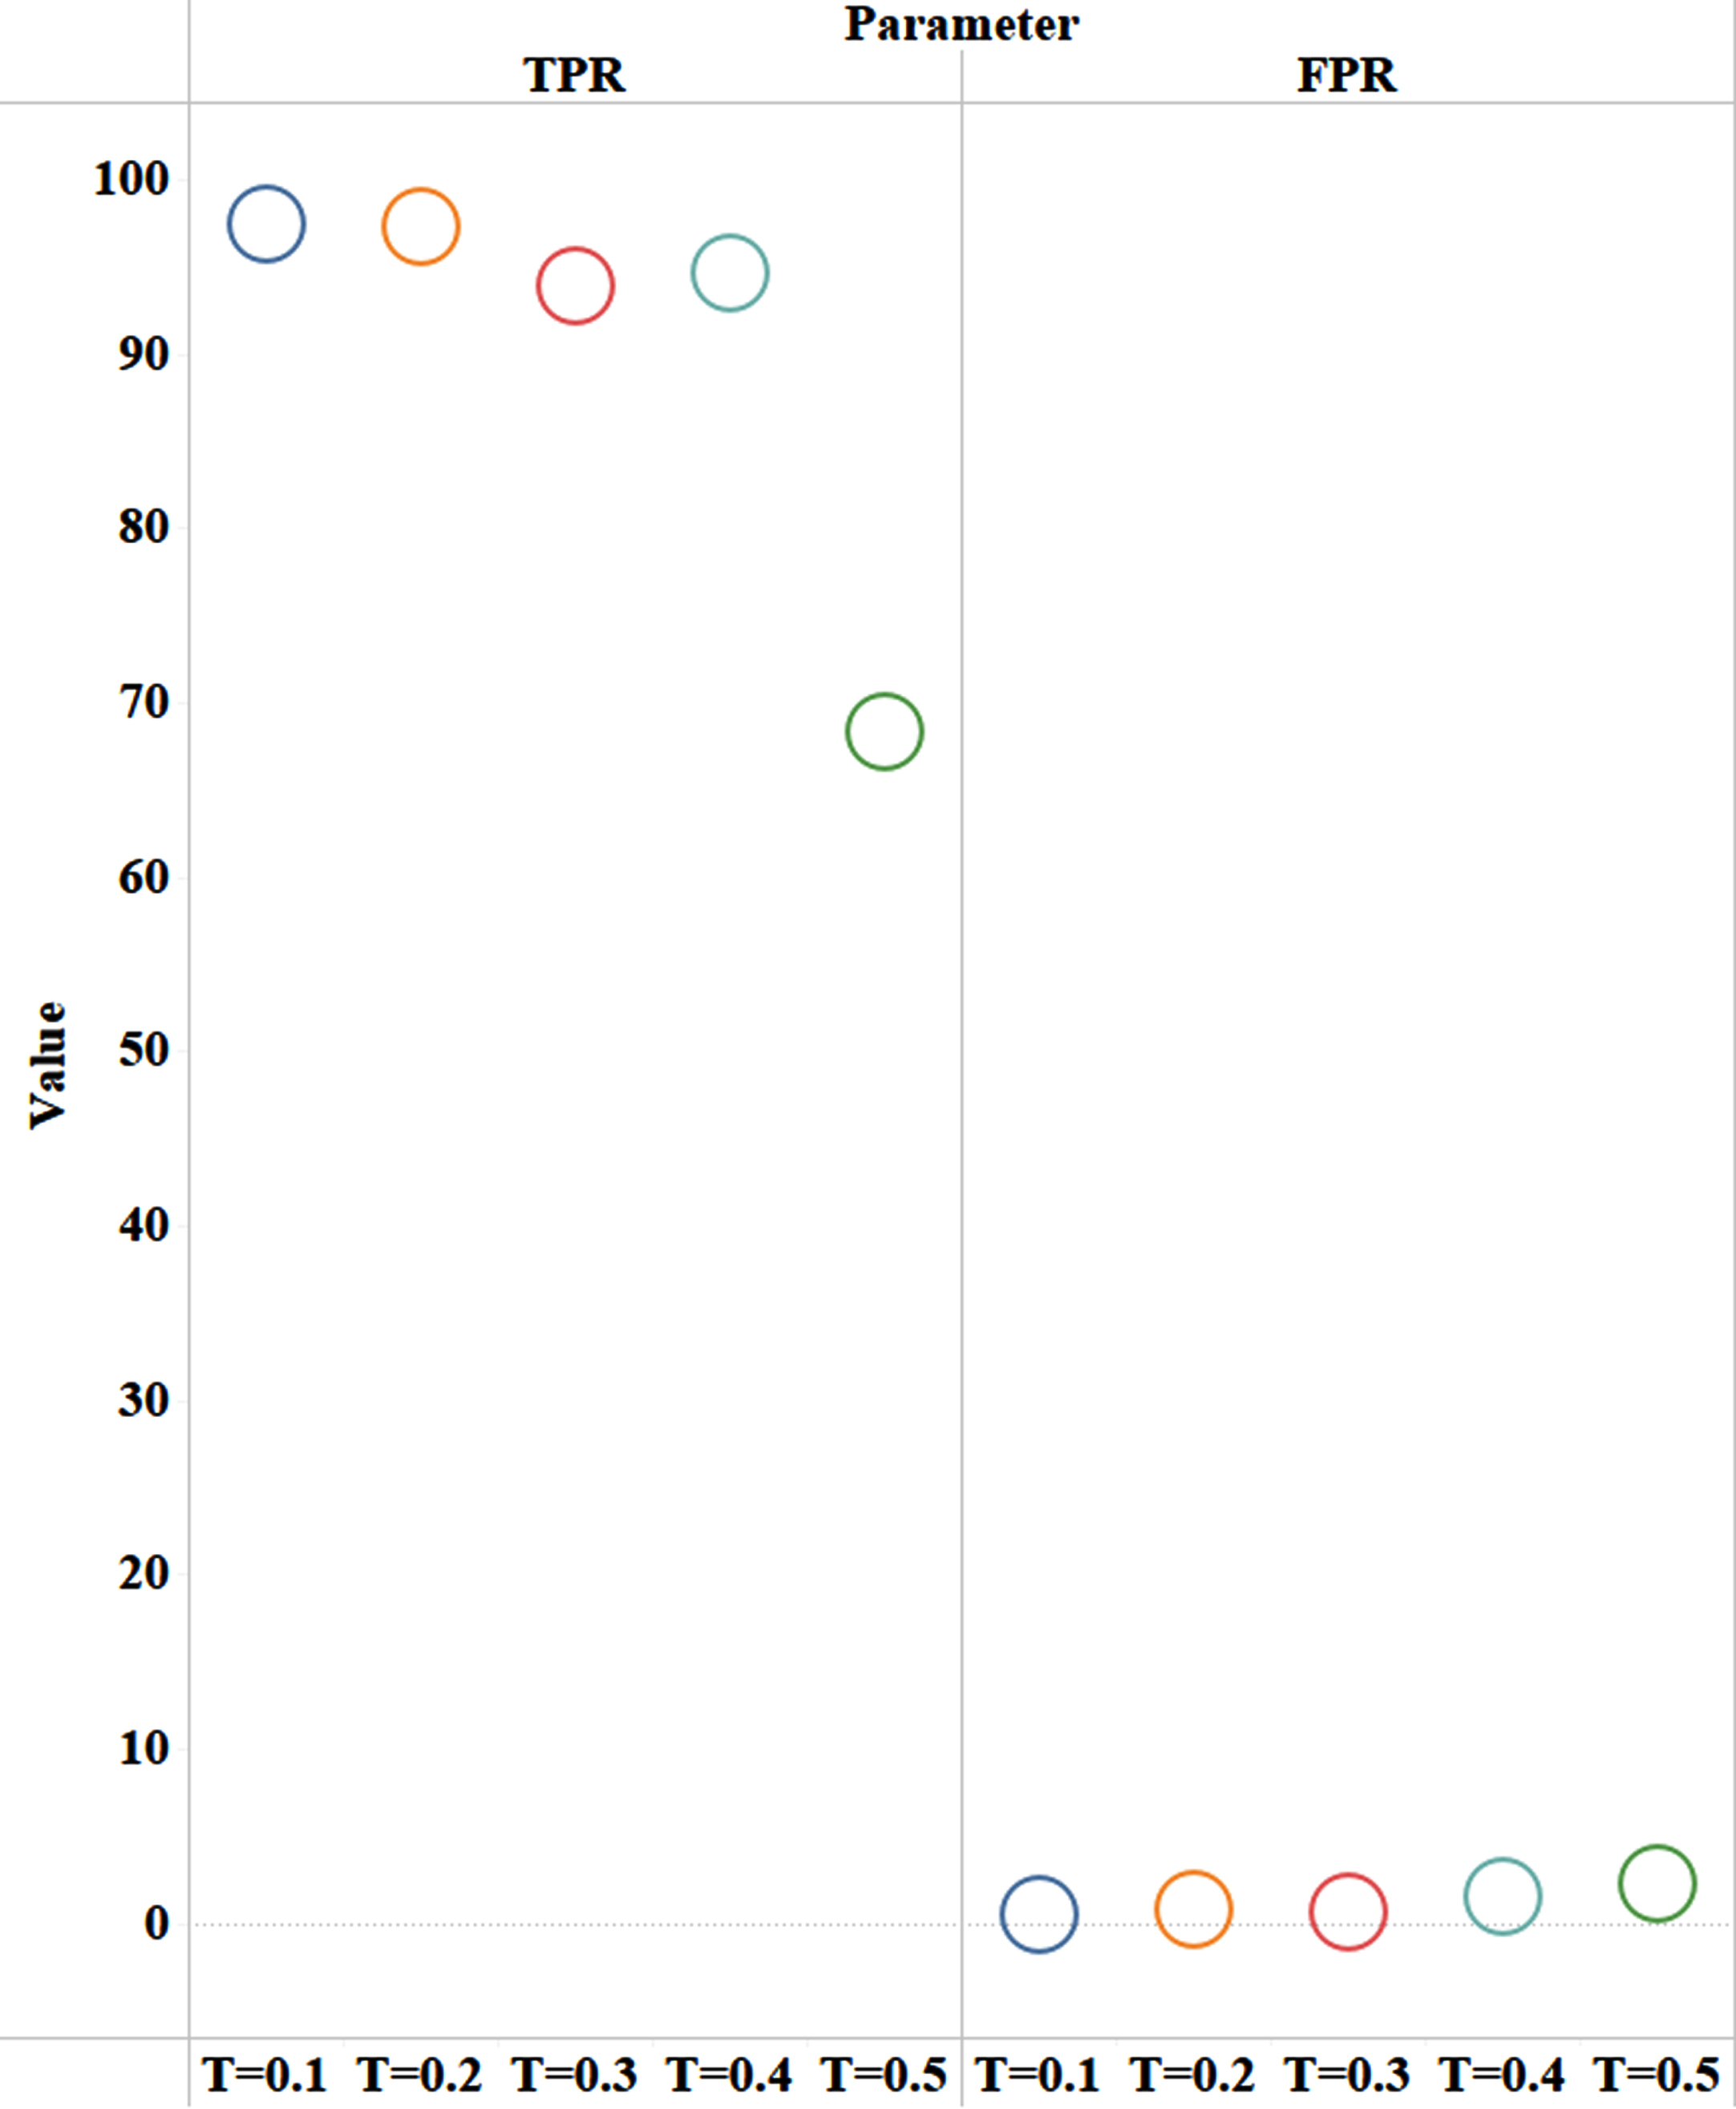
Figure 5 exhibits results of TPR and FPR and visualizes that the TPR range of T = 0.5 is dropped far greater among other thresholds, while the FPR of all thresholds is still quite similar to each other.
TPR and FPR rates in all thresholds.
In addition, Fig. 6 This shows the differences between correctly and incorrectly classified instances (between malware and benign). Similar to Fig. 5, the graph is also dropped greater in correctly classified instances. While the threshold is increasing, the classification is getting worse. In addition, the FPR rate of the 0.5 threshold is also rapidly high in T = 0.5, which indicates that it had more false classifications among other thresholds. This demonstrates that the 0.5 threshold holds insignificant features and is irrelevant for malware detection.

Correctly and incorrectly classified instances.
On the other hand, the boxplots in both Figs. 7 8 are the ranges of the detection across all thresholds (from T = 0.1 until T = 0.5). In Fig. 7, the boxplot of precision shows a good range between 95% and 100%, the most outstanding detections. While the other boxplots (recall and f-measure) are extending their detections range from 98% to 80%.
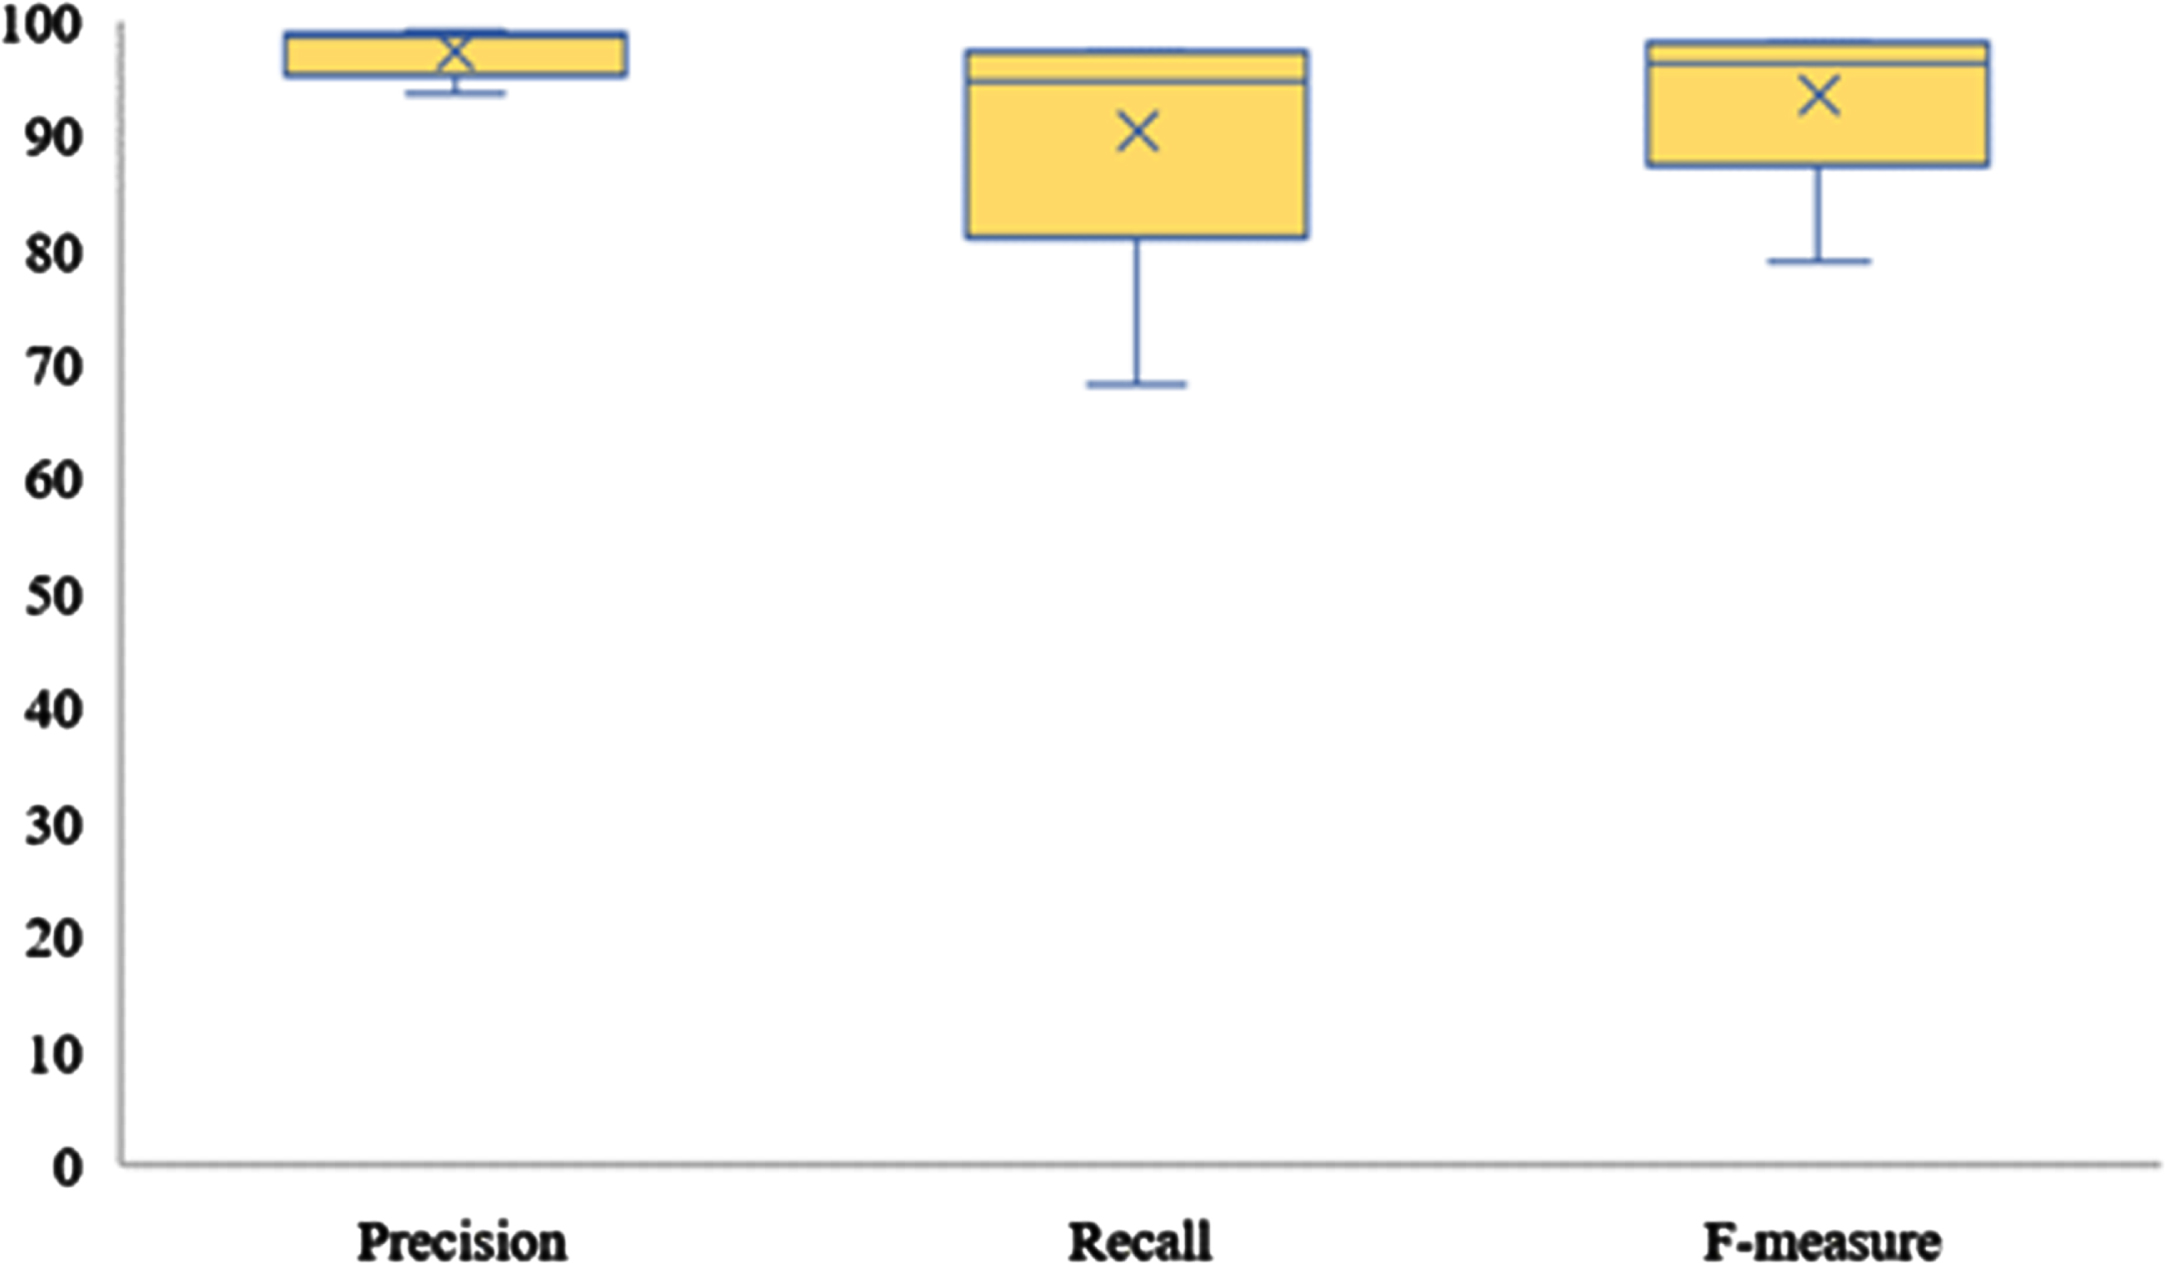
Boxplot of precision, recall and f-measure rates.
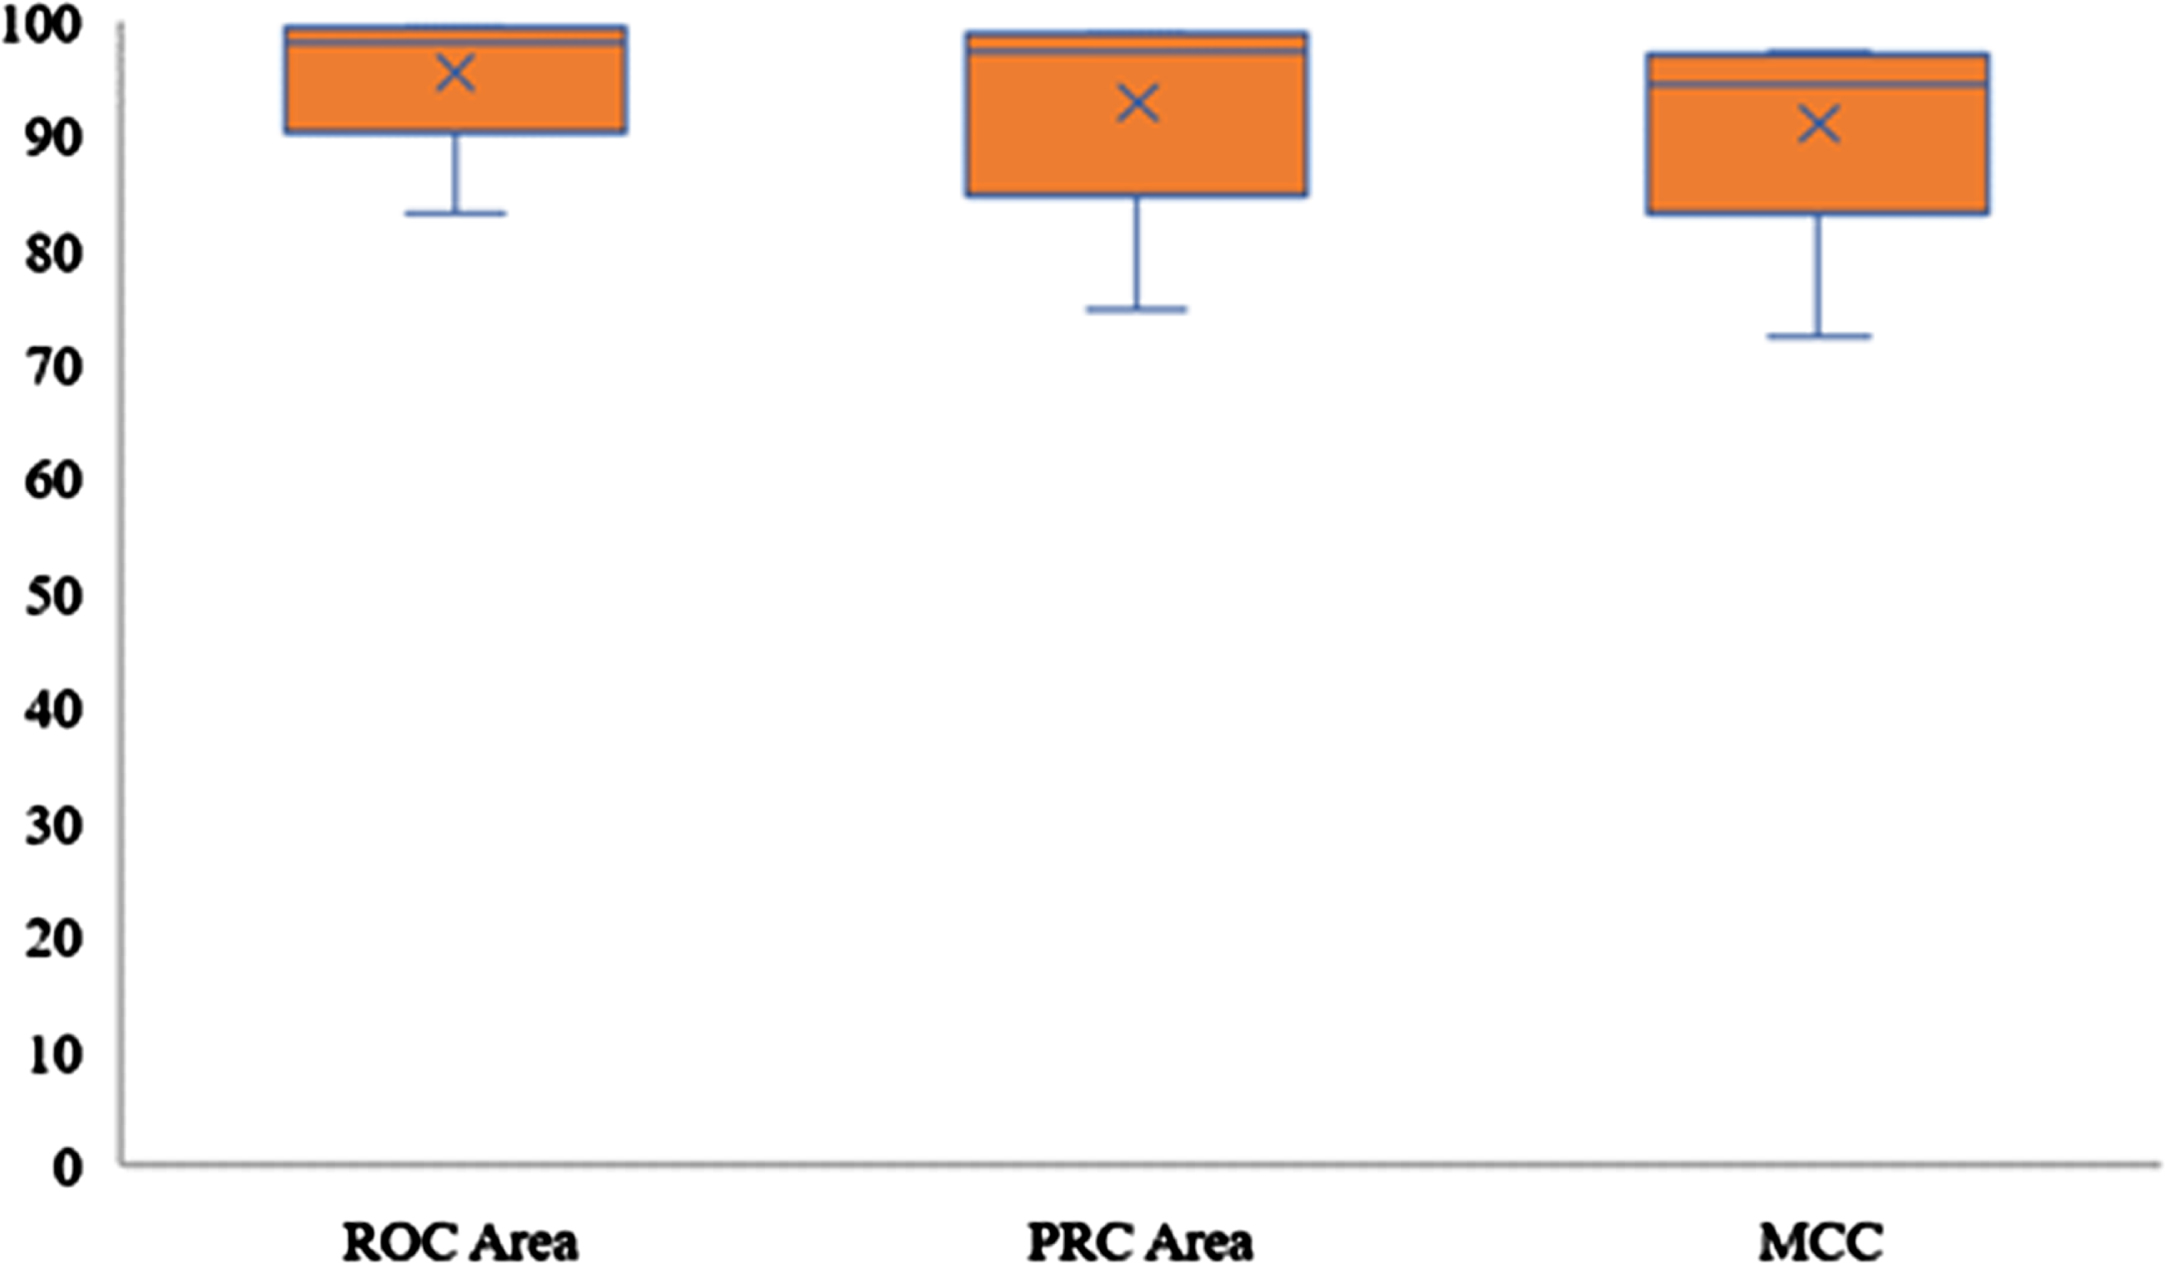
Boxplot of ROC, PRC and MCC rates.
Meanwhile in Fig. 8, the boxplot of ROC is much better in comparison to PRC and MCC, which range between 90% and 100%. While the other boxplots show the range slightly similar to ROC, which is between 85% and 100%.
All the figures (Figs. 4–7) show that T = 0.5 of PMCC has insignificant features, even though it has fewer features than the other threshold. The thresholds from T = 0.1 until T = 0.4 marks outstanding performance, with more than ten features. This demonstrates that the minimum number of features is unnecessarily the best indicator of classification accuracy. This is because it is also essential to investigate the significance and significance of the features.
On the other hand, T = 0.1 reached similar performance (accuracy, TPR, FPR, precision, f-measure, MCC, ROC, PRC) as T = 0.2. Even though T = 0.1 has more features than T = 0.2, it is unable to improve its accuracy while maintaining the akin performance as T = 0.2. This also demonstrates that too many features are still irrelevant and will burden the machine learning classifier in a real world intrusion detection system (IDS) when it comes to detecting hundreds of samples.
Therefore, the optimal number of features is the T = 0.2 threshold with only 60 features, as determined by the PMCC + heatmap technique. This method successfully identifies and selects among all the 215 features.
In this section, we present comparative experimental results of our proposed malware detection machine learning model with heatmap which are widely used in existing malware detection areas. As we described in Section 3.1.2, we applied Product Moment Correlation Coefficient (PMCC) with correlation heatmap algorithm and used Unordered Fuzzy Rule Induction (FURIA) as a machine learning classification to detect Android malware with the unique selected features from the heatmap.
Table 7 provides a state-of-the-art comparison of detection results to other related studies. Table 7 also reveals the comparison of the proposed method with other studies, considering number of samples and classification methods. As shown from the comparison of current state-of-the-art literature in Table 7 it emerges that, the best of authors knowledge, this represent the first attempt to provide an explainable methodology for malware detection using fuzzy classifier with correlation heatmap.
State-of-the-art comparison
State-of-the-art comparison
Table 7 demonstrates many machine learning practitioners focused on supervised machine learning methods, for instance, Random Forest, Naïve Bayes, and Support Vector Machine. In contrast, this study adopts the Fuzzy algorithm in which the detection results can achieve high accuracy as other studies. Even though a lot of work has been done using different machine learning techniques, the aim is still the same, to detect Android malware.
It can be seen that studies in [45] provide a huge number of datasets and achieved the highest rate of accuracy among others with 99% accuracy. A wide range of datasets contributes to enhanced malware classification efficiency [26, 47]. However, the focus is different with the proposed study in which they focused on family identification of obfuscated malware and they selected features by calculating the score from mean decrease impurity (IMD) to extract best features for the classifier.
Studies in [46, 48] and [49] achieved high accuracy with a few significant features. However, the malware dataset used in this study is trivial in comparison studies in [46–49]. In addition, the significant and minimal features can produce acceptable detection performance of more than 90% while reducing model resources and constraints. Other studies [47] achieved 97% accuracy using 2293 samples of benign and malware datasets. The malware dataset was taken from Malgenome Project that was issued by Yajin Zhou and Xuxian Jiang in 2012. They used 459 features for malware detection using HMM classifiers. Studies by [50] achieved 98% accuracy using different classifiers.
In contrast, this proposed study has used the AndroZoo database for benign detection, while the other studies used Google Play as their database. The results of this study are marginally equivalent compared to the previous studies. Despite other previous works demonstrating heatmap to visualize the correlation between features, the feature selection and machine learning classification methods are massive in comparison to other studies.
This research presented a static analysis of permission-based, API calls and command strings of features. These features were optimized using the Pearson Moment Correlation Coefficient Heatmap and FURIA algorithms. In this study, the selected features were tested at several thresholds in order to find the best performance evaluation in accuracy, TPR, FPR, precision, f-measure, MCC, ROC, and PRC. As a result, the PMCC threshold of T = 0.2 marked the best results in all benchmarks in evaluation with 60 significant features. The results also demonstrate that the smaller number of features (<60) is still unable to produce outstanding results. Furthermore, a greater number of features are also still irrelevant as they only perform with similar accuracy. Hence, the ideal way is to discover the perfect number in the middle.
It is anticipated that this information will inspire additional research in the future as a way to combat the burgeoning threat posed by malicious software. In addition, the results of this study would make Android operating systems more secure. In conclusion, this research offers a high-level overview of the subject matter, and its primary purpose is to emphasize how essential it is to deepen our understanding of malware affecting Android devices.
Footnotes
Acknowledgments
This study thanked to Ministry of Higher Education (MOHE) for Fundamental Research Grant Scheme (FRGS) with grant number RDU192607, RACER/1/2019/ICT02/UMP//5, and the Universiti Malaysia Pahang for additional financial support under Internal Research Grant UMP RDU192206.
Declaration of competing interest
The authors declare that they have no known competing financial interests or personal relationships that could have appeared to influence the work reported in this paper.