
Abstract
In the existing short-term forecasting methods of time series, two challenges are faced: capture the associations of data and avoid cumulative errors. For tackling these challenges, the fuzzy information granule based model catches our attention. The rule used in this model is fuzzy association rule (FAR), in which the FAR is constructed from a premise granule to a consequent granule at consecutive time periods, and then it describes the short-association in data. However, in real time series, another association, the association between a premise granule and a consequent granule at non-consecutive time periods, frequently exists, especially in periodical and seasonal time series. While the existing FAR can’t express such association. To describe it, the fuzzy long-association rule (FLAR) is proposed in this study. This kind of rule reflects the influence of an antecedent trend on a consequent trend, where these trends are described by fuzzy information granules at non-consecutive time periods. Thus, the FLAR can describe the long-association in data. Correspondingly, the existing FAR is called as fuzzy short-association rule (FSAR). Combining the existing FSAR with FLAR, a novel short-term forecasting model is presented. This model makes forecasting at granular level, and then it reduces the cumulative errors in short-term prediction. Note that the prediction results of this model are calculated from the available FARs selected by the k-medoids clustering based rule selection algorithm, therefore they are logical and accurate. The better forecasting performance of this model has been verified by comparing it with existing models in experiments.
Keywords
Introduction
Short-term forecasting of time series is a worthy study topic, as it involves many researches and application fields. Various intelligent models have been proposed for this topic, including the neural network model [1], the support vector regression model [2], and the autoregressive integrated moving average model [3].
The neural network (NN) model is an artificial intelligence model with the best abilities for self-learning and non-linear fitting [1]. Extensions of this model, including the artificial neural network model [4], the long short-term memory neural network model [5] and the convolutional recurrent neural network model [6], have been built for short-term forecasting. These models capture the correlations in data clearly and can be applied flexibly. However, their complexity and low interpretability limit their promotion.
The support vector regression (SVR) model is a prediction model developed from the support vector machine model [7]. Better prediction results can be obtained from this model because of its non-liner nature and single global minimum. However, the forecasting performance of SVR is heavily influenced by parameters and el function as analyzed in literatures [8–10].
The autoregressive integrated moving average (ARIMA) model consists of three components: autoregressive (AR), integration (I), moving average (MA), where AR and MA calculate future values from lagged variables and past errors, respectively [11, 12]. The best feature of this model is simple in form, however, the high requirement in data stationarity makes it impossible to be applied in some fields.
Other forecasting models, such as exponential smoothing [13], fuzzy time series based model [14] and fuzzy cognitive map based model [15], have been analyzed in depth by many scholars.
The superiorities of the above mentioned models in one-step forecasting have been proven through experiments, however, due to the occurrence of cumulative errors in the successive iteration of one-step prediction, their performance in short-term forecasting changes dramatically. For this reason, the fuzzy information granule based model has become popular in the short-term forecasting of time series [16, 17].
The fuzzy information granule (FIG) is constructed on the data with similar characteristics, which conforms to the thinking habit of human beings to consider the similar objects as a whole. Thus, the forecasting based on it is very interpretable. Lu et al. constructed FIGs on a stock time series, these granules express the fluctuations and trend of data exactly [18, 19]. Li et al. granulated time series to a series of FIGs in short-term temperature prediction [20]. The linear fuzzy information granule was proposed by Yang et al. for Mackey–Glass forecasting [21]. In these models, the fuzzy information granules are of equal-size, and the fuzzy association rules (FARs) established on them for describing the data association are between two consecutive equal-size time periods.
Lu et al. applied the unequal-size FIGs in stock time series forecasting [22]. Wang et al. created a granular time series with unequal-size by considering the temporal information of data for forecasting [23, 24]. Guo et al. combined FIGs of varying sizes with hidden Markov models to make predictions [25]. Additionally, a granular computing method was raised in [26] with the aid of clustering algorithm based on the dynamic time warping distance for long-term forecasting. The fuzzy information granules used in these models are of unequal-size, and the mined fuzzy association rules reflect the associations from an antecedent trend to a consequent trend at two consecutive unequal-size time periods. It should be pointed out that the mined FARs in both literatures [18–21] and literatures [22–26] are used to calculate the final short-term predictions.
The fuzzy information granule based forecasting models aforementioned have two faults can be found through the analysis in them:
the fuzzy association rules are constructed by two granules at consecutive time periods, they only capture the association of data from two consecutive time periods (called as short-association); all the constructed rules are used for forecasting, while neglect the availability of each rule.
Except the short-association, another kind of association exists in real time series: the association of data from two non-consecutive time periods (called as long-association). For example, the long-association between the continuous rising temperature and the short-term falling temperature in a seasonal temperature time series. The existing FARs can’t reflect this association, and are therefore ignored in many forecasting. Moreover, different association rules will have different effects on future predictions.
In order to overcome faults
Besides FLAR, a fuzzy inference system is built up based on the k-medoids cluster. This system contributes to selecting the association rules for forecasting by considering the clustering relationship between the premise granule and the current granule, where the selected rules are called the available FARs. Logical and accurate short-term predictions are calculated through this system.
On the basis of fuzzy long-association rules, a forecasting model is constructed to solve short-term time series prediction. The fuzzy reasoning and forecasting of this model are carried out using two kinds of rules: fuzzy short-association rule and fuzzy long-association rule. These rules comprehensively characterize the distribution and association of data. The mechanism of this model is that it calculates the short-term predictions from multiple historical data, which avoids the cumulative errors that occur in the existing models. Moreover, the predictions are calculated by the available FARs, which result in accurate and reasonable prediction results.
According to the above analysis, the main contributions of this paper can be concluded as follows: Fuzzy long-association rule is constructed to describe the long-association in time series ignored by other models; K-medoids clustering based rule selection algorithm is proposed, which beneficial in obtaining logical predictions by selecting the available fuzzy association rules for forecasting; Fuzzy long-association rule based short-term forecasting model is put forward, it contributes to obtaining accurate predictions by avoiding cumulative errors.
The rest of this paper is arranged as follows: Some preliminary data about fuzzy information granule and k-medoids cluster are given in Section 2. On the basis of these data, a new kind of association rule and its prediction model are introduced in Sections 3 and 4 respectively. This model uses the k-mediods clustering based algorithm to select the available rules for forecasting. In order to demonstrate the availability of the fuzzy long-association rule and corresponding forecasting model, five experiments are analyzed in Section 5. From these experiments, we can obtain the conclusions described in Section 6.
Preliminary data
After recalling the fuzzy information granule based model in time series forecasting [27–29], some related works about fuzzy information granule and k-medoids cluster are introduced in this section, which are necessary in the discussion of this paper.
Linear fuzzy information granule
Information granule was proposed by Zadeh in 1979 [30]. Following this, various representations of it, such as fuzzy sets and rough sets, were proposed [31–33]. The information granule is constructed under two requirements: semantic soundness and justifiable granularity. These two considerations imply that the information granule is high interpretable, and captures the data information effective. Thus, the information granule and lots of improved granules have been applied in the knowledge representation and time series analysis [34–36].
In this paper, a special information granule is expropriated: linear fuzzy information granule (LFIG), whose core is a line function of time that matches with the distribution and trend characteristic of the data [21]. Each LFIG LG(k, b, σ, T) carries a membership function such that the membership degree of value x at time t belonging to LG is expressed as: size812
For a given time series X ={ x1, x2, ⋯ , x n }, a series of successive subsequences are obtained by partitioning X under a given time granularity (T). Each subsequence is represented as an LFIG according to Equation (1). In this process, X is transformed to a granular time series, namely a series of LFIGs. The above process forms linear fuzzy information granulation. More detail about this granulation is introduced in the following steps:
For time series X, p subsequences are partitioned and shown in Equation (2), where T is the time granularity given ahead and
According to Equation (1), an LFIG is established by line regression on each subsequence, and then X is transformed to a granular time series G ={ G1, G2, ⋯ , G q }, where G l = LG(k l , b l , σ l , T)(l = 1, 2, ⋯ , q).
Through establishing granular time series G, the trend characteristics of time series X can be reflected accurately.
K-medoids cluster is a partition-based clustering method, which takes the object closest to the center as the clustering center [37, 38]. It is a commonly clustering method with high precision and robustness. In literature [39], Tavakkol et al. increased the accuracy of k-medoids clustering by considering the knowledge of uncertain data. Ushakov et al. put forward a high-quality clustering algorithm for huge-scale datasets through employing a nearest neighbor strategy to approximate the dissimilarity matrix [40]. And combine with the minimum spanning tree, Huang et al. proposed an improved k-medoids algorithm to cluster different kinds of spectral lines and determine the spectral line of interest [41].
In the k-medoids algorithm, the similarity of two objects is measured by the Euclidean distance. As required: the similarity (the distance) between two LFIGs LG1(k1, b1, σ1, T) and LG2(k2, b2, σ2, T) is calculated through the l1-type Hausdorff distance studied in literatures [21, 43], described below: size712
Three evaluation indexes, mean absolute error (MAE), average forecasting error rate (AFER) and root mean squared error (RMSE), are used to evaluate the forecasting performance of each model. These indexes, whose functions are defined as follows, have been used in many studies:
According to the analysis in Introduction section, it is of great significance to establish association rules for depicting the characteristics and short-term forecasting of time series [26, 42]. Thus, in this section, a new kind of fuzzy association rule is constructed consistent with the features in time series.
Suppose the given time series is X ={ x1, x2, ⋯ , x n }, and the granular time series established on it is G = {G(t) |t = … , 0, 1, ⋯}.
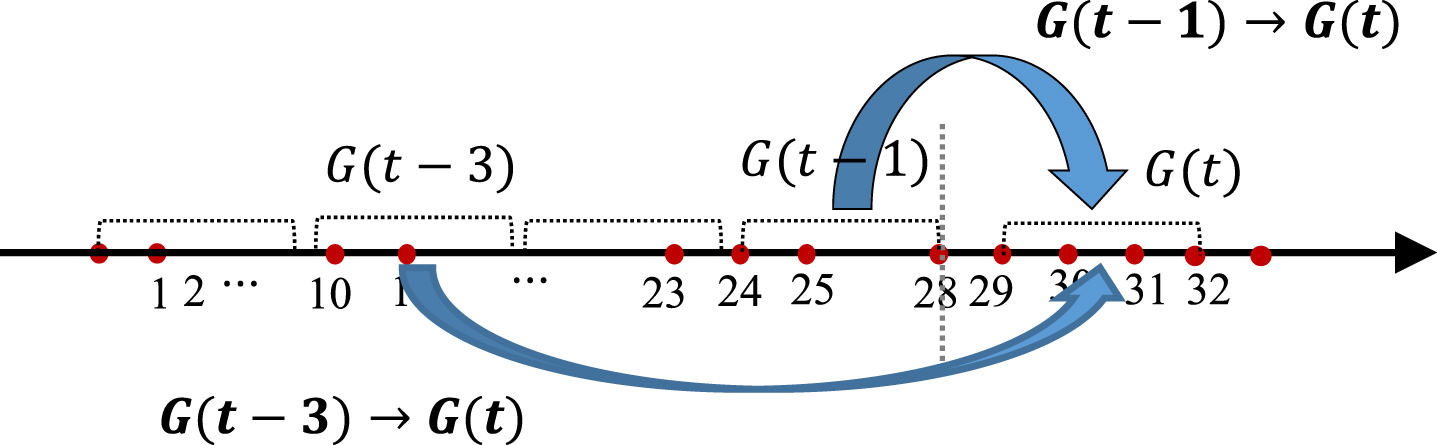
In the existing forecasting models, a fuzzy association rule in the form of G(t - 1) → G(t) is constructed to describe the association between the premise granule (G(t - 1)) and the consequent granule (G(t)) from consecutive time periods (i.e., the (t - 1)th time period and the tth time period), and it reflects the influence on the consequent observations from the premise observations at the consecutive time periods. However, this kind of association rule neglects a special association in time series, that is, the association between two granules from non-consecutive time periods, for example granules G(t - 3) and G(t). Such association exists widely in real time series, especially in seasonal and periodic time series. In order to characterize this association, we propose a new kind of association rule here, its definition is given as follows:
From the number of time lag p, the fuzzy association rule can be discussed from the following two aspects:
In this case, the FAR in the form G(t - 1) → G(t) is called fuzzy short-association rule (FSAR), whose antecedent and consequent are from two consecutive time periods. The FSAR describes the association between the premise granule and the consequent granule at consecutive time periods (short-association).
In this case, the FAR in the form G(t - p) → G(t) is called fuzzy long-association rule (FLAR), whose antecedent and consequent are from two non-consecutive time periods. The FLAR describes the association between the premise granule and the consequent granule at non-consecutive time periods (long-association).
Based on Definition 1, Fig. 1 expresses two fuzzy association rules: a fuzzy short-association rule G(t - 1) → G(t) and a fuzzy long-association rule G(t - 3) → G(t). By the comparison in Fig. 1, we can find that the FSAR reflects the influence on the current observations from the hisorical observations at their consecutive moments, while the FLAR reflects the influence on the current observations from the hisorical observations at their non-consecutive moments. Where G(t - 3) , G(t - 1) and G(t) are granules constructed on time series X.
Two kinds of fuzzy association rules.
The abbreviation of important concepts used in this paper
To facilitate the use of the above concepts, the abbreviations of them are listed as follows:
Yang et al. constructed fuzzy association rules G(t - 1) → G(t) for short-term forecasting, which are FSARs [20, 21]. His forecasting only considers the short-association in time series, while both short-association and long-association are considered in our study. That is to say, the FSARs and FLARs are established for depicting the associations in time series analysis and forecasting in our proposed model.
After mining various fuzzy association rules in time series, the next work is to make prediction from them. Since the prediction is implemented on different time periods, select the appropriate association rule is important in accurate forecasting. Therefore, an association rule selection algorithm is presented in Section 4.1. Combine with this algorithm, a novel short-term forecasting model is put forward in Section 4.2. The detailed contents are introduced below.
Let the given time series be X ={ x1, x2, ⋯ , x n }, the granular time series established on X be G = {G(t) |t = … , 0, 1, ⋯}.
K-medoids clustering based rule selection algorithm
For the forecasting on different time periods, it’s key to select the appropriate association rule, which is conducive to obtaining logical and accurate prediction results. Where the appropriate association rules are referred to as the available fuzzy association rules defined in Definition 2.
According to the number of p, the available FAR can be divided into two categories: the available FSAR and the available FLAR.
In Definition 2, granules G(k) and G(t - p) belong to the same cluster means they have similar time series trend characteristics. It’s natural to deduce that the two granules G(k + p) and G(t) have the same trend features. Thus, we use G(k) → G(k + p) as the available FAR to inference and forecast next.
On the basis of Definition 2, an available fuzzy association rule selection algorithm is presented, introduced in Algorithm 1, where G(k) and G(t - p) are clustered by the k-medoids clustering. Note that the distance used in the k-medoids cluster is l1-type Hausdorff distance (expressed in Equation (3)), which measures the similarity between two granules.
Figure 2 expresses the construction of FAR bases. In this process, if granules G i 1 , G i 2 , …, G i j belong to the same cluster, the FARs whose premise granule is one of G i 1 , G i 2 , …, G i j , namely
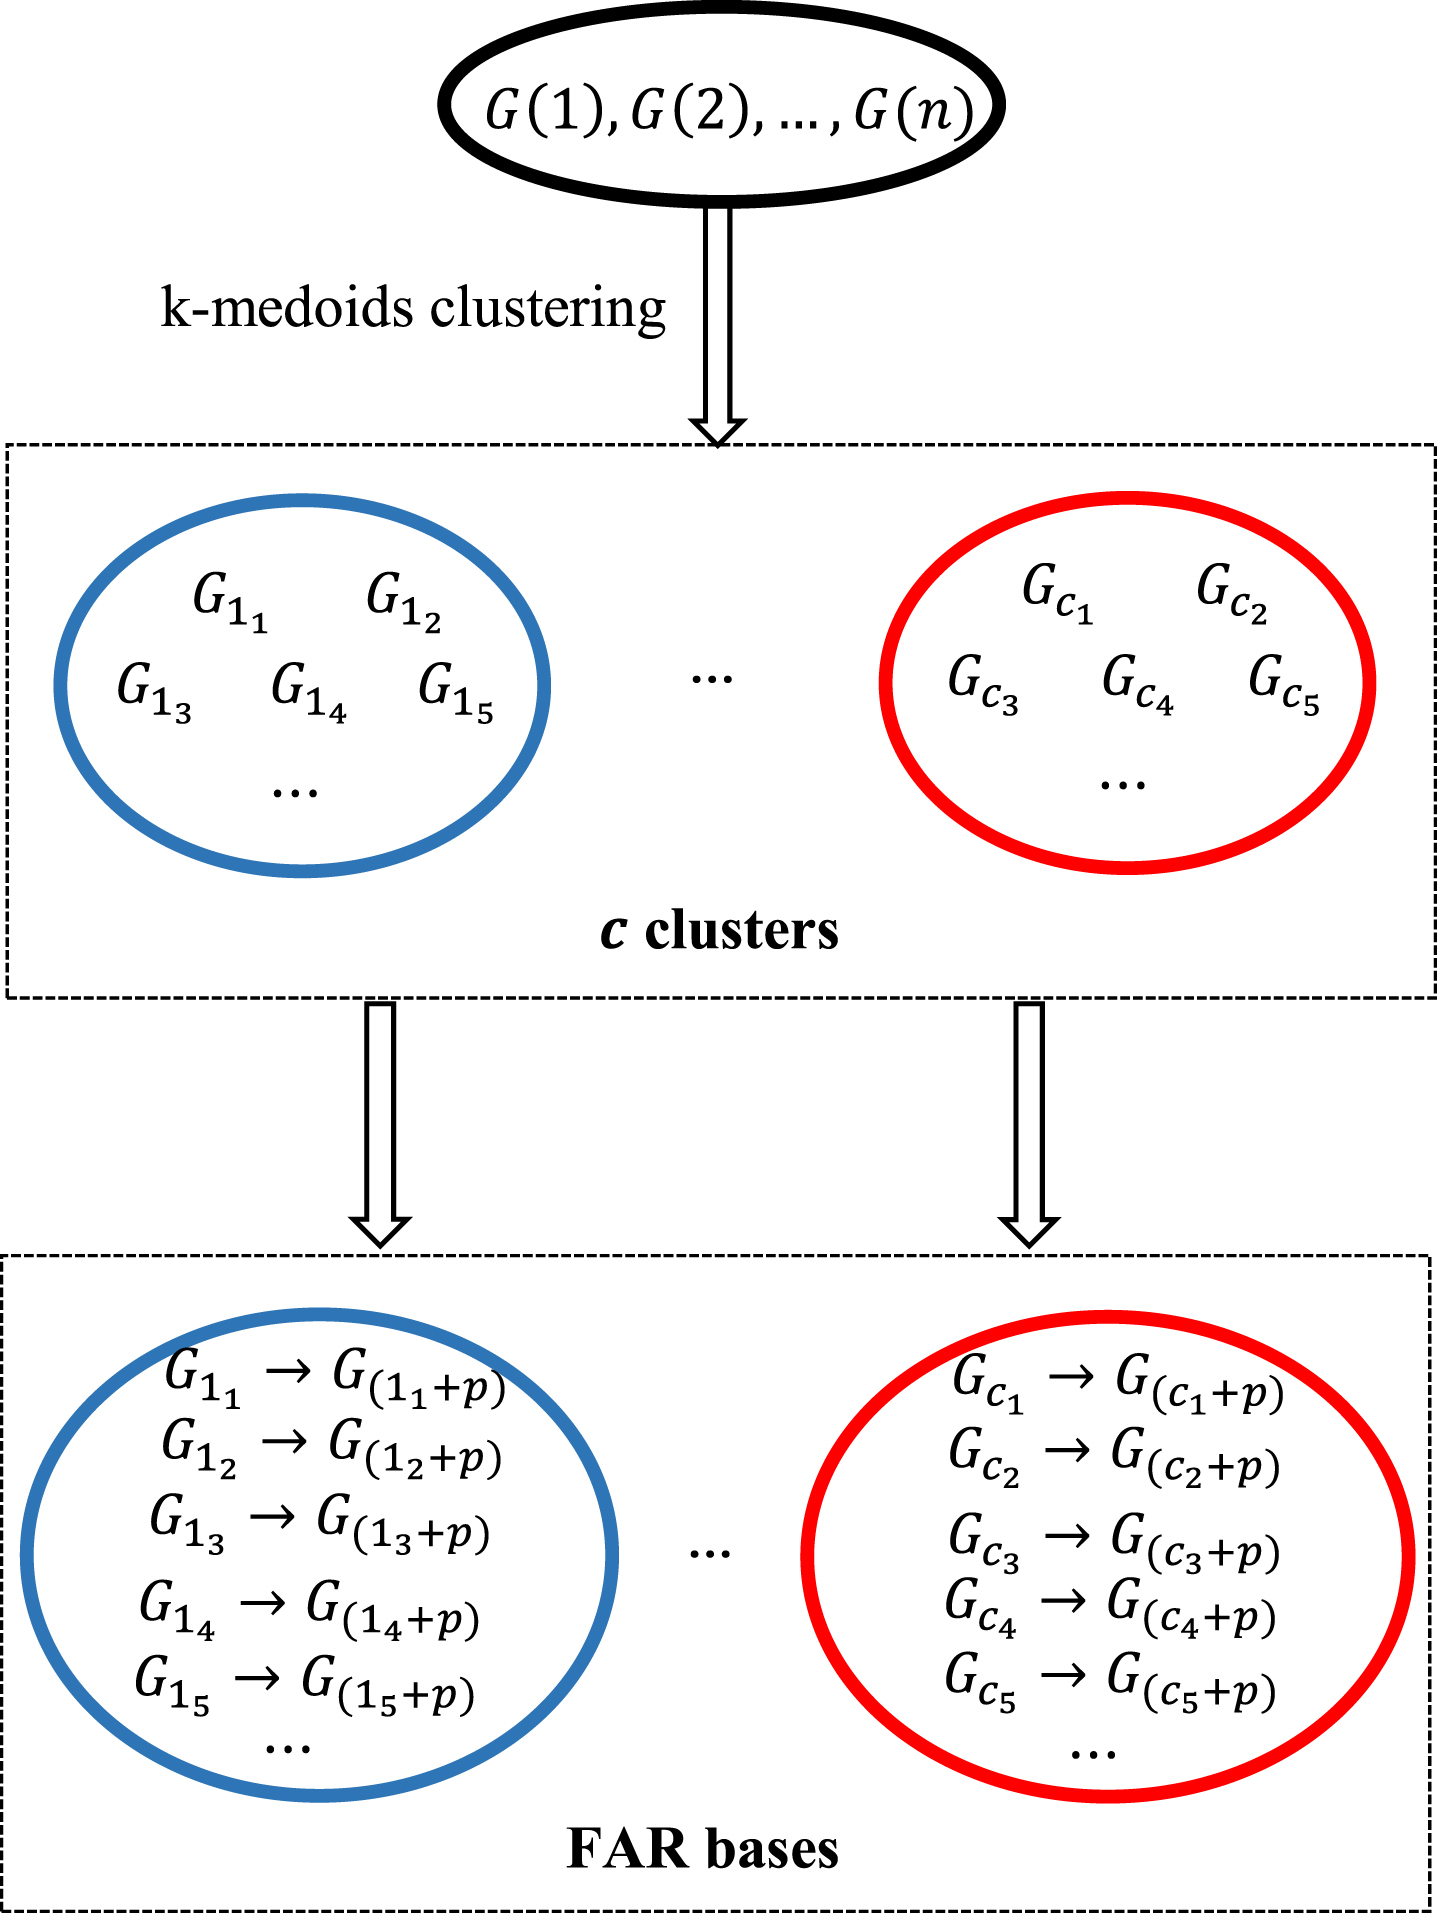
The framework of construction fuzzy association rule bases.
size8.512
On the basis of the FAR bases established in Fig. 2, the Algorithm 1 selects the available FARs as follows: if the current granule G k and G i 1 , G i 2 , …, G i j are belonging to the same cluster, the FARs in Equation (5) are the available FARs.
By the selection algorithm of the available FARs, if p = 1, the available FSARs can be mined; if p > 1, the available FLARs can be mined.
Based on the new proposed fuzzy association rules and the available association rule selection algorithm, a novel short-term forecasting model is arranged here, namely the fuzzy long-association rule based forecasting model.
In this model, two kinds of FARs are established for calculating predictions: fuzzy short-association rule and fuzzy long-association rule. These rules take into account not only the short-association used in the existing models, but also the long-association frequently presented in time series. Thus, they can accurately capture the correlation characteristics of the data.
After constructing FARs, a novel fuzzy inference system is proposed. This system calculates prediction results from the available FARs selected by the k-medoids clustering based rule selection algorithm, which makes for obtaining accurate and reasonable predictions.
The new proposed model consists of four steps, as introduced below and shown in Fig. 3.
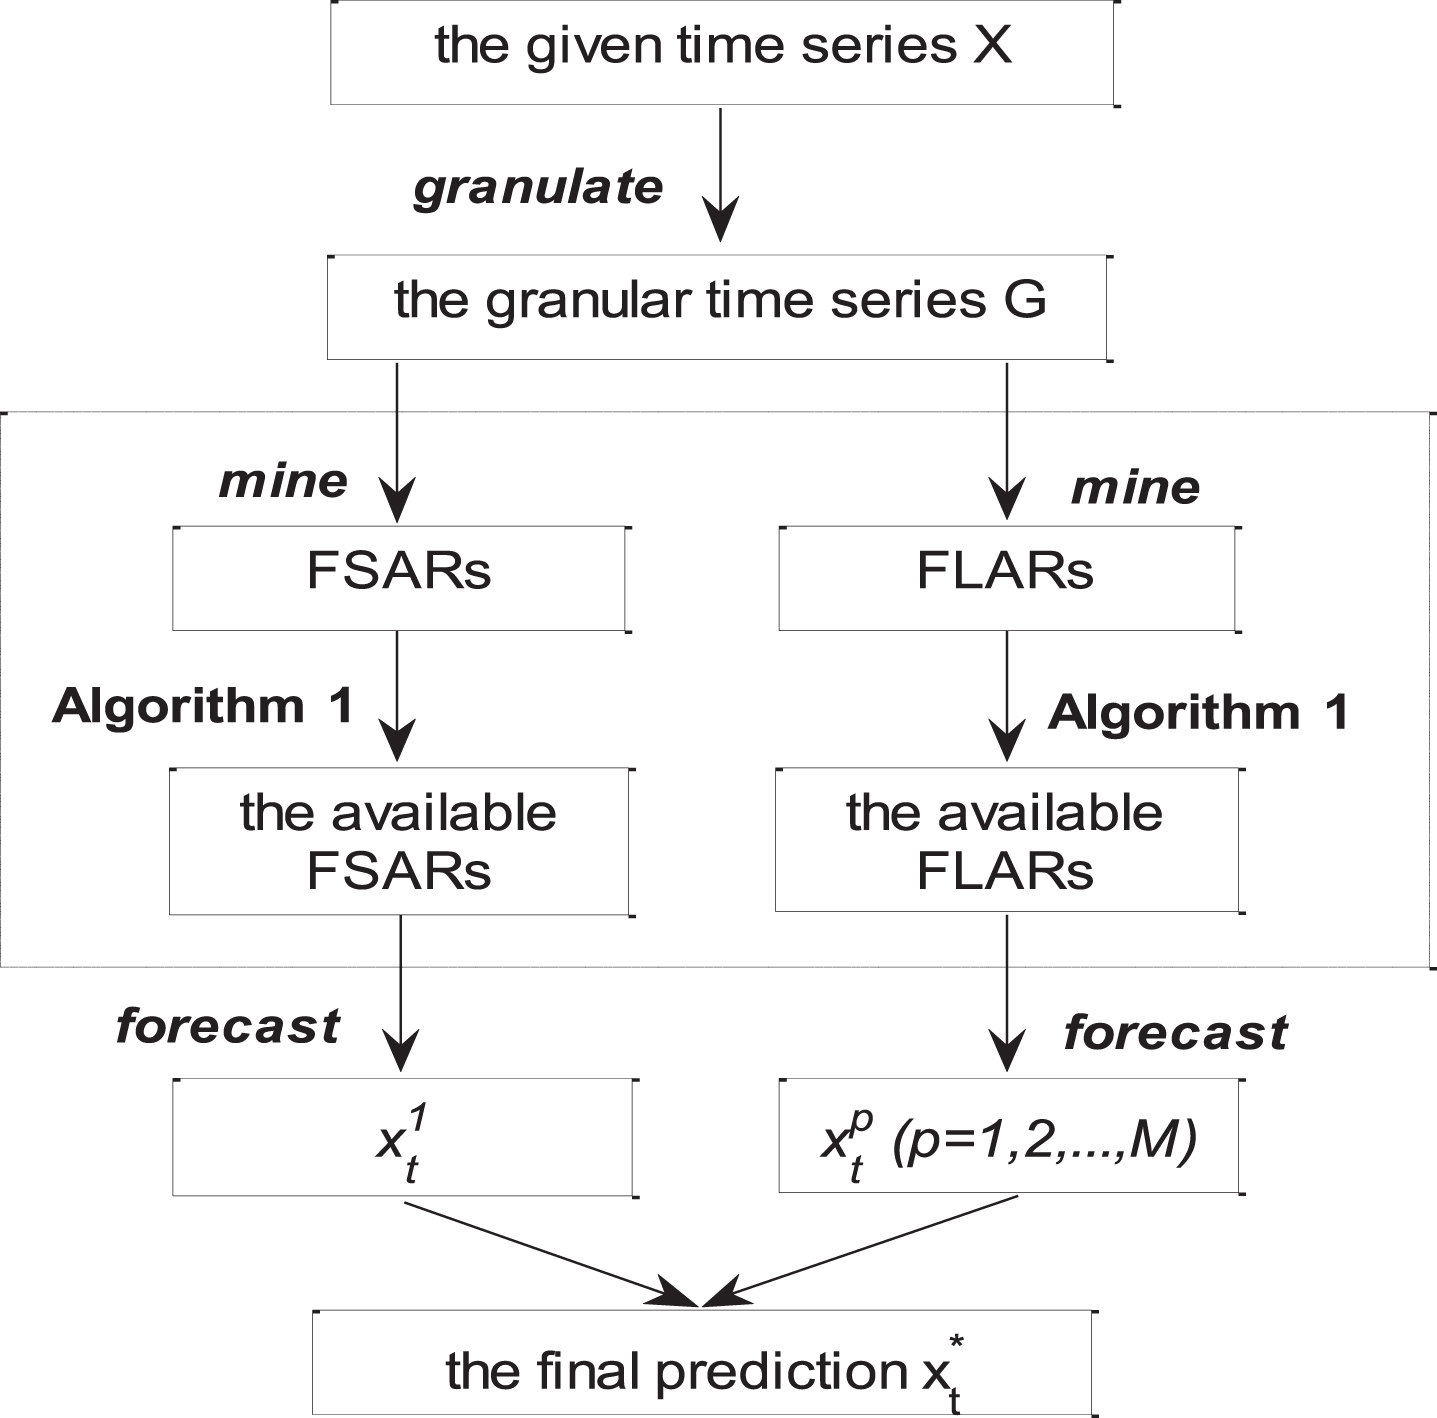
The framework of the fuzzy long-association rule based short-term forecasting model.
Suppose the forecasting is carried out on a given time series X ={ x1, x2, …, x n }, its process is described as the following steps:
By the linear fuzzy information granulation described in Section 2.2, X is granulated to a granular time series G ={ G1, G2, …, G
q
}, G
l
= LG(k
l
, b
l
, σ
l
, T)(l = 1, 2, …, q), where T is the time granularity given ahead and
In the proposed forecasting model, two types of FARs are established according to Definition 2, which are FLARs and FSARs:
A FSAR is in the form G(i-1) → G i , where G(t - 1) = G(i-1), G(t) = G i . Let R1 be the set of all the established FSARs;
A FLAR is in the form G(i-p) → G i , where G(t - p) = G(i-p), G(t) = G i . Let R p (p = 2, 3, …, M) be the set of all the established FLARs.
Two types of FARs are mined in Step 2, thus two types of available FARs are selected according to Algorithm 1, which are the available FSARs and the available FLARs.
Here, take the forecasting of values at the tth time period ({ xT×(t-1)+1, xT×(t-1)+2, …, xT×t }) as an example, and the historical granules constructed on the (t - 1) th and (t - p) th time periods, G(t-1) and G(t-p), are used to select the available FARs and forecasting.
According to granule G(t-1), N1 available FSARs are selected in R1 and collected in
According to granule G(t-p),Np available FLARs are selected in R
p
and collected in
Next, we will take the forecasting from these selected rules.
From the selected two types of available FARs, two kinds of predictions are obtained of value xT×(t-1)+r(r = 1, 2, ⋯ T), namely
Based on the number of available FSARs N1, the prediction
With the selected available FSAR G
i
h
→ G(i
h
+1), and G(i
h
+1) = LG(k(i
h
+1), b(i
h
+1), σ(i
h
+1), T), (h = 1, 2, ⋯ , N1) size8.512
This case means there is no available FSAR for forecasting, and the prediction is set as
Based on the number of available FLARs Np, the prediction
With the selected available FLAR G
j
h
→ G(j
h
+p), and G(j
h
+p) = LG(k(j
h
+p), b(j
h
+p), σ(j
h
+p), T), (h = 1, 2, ⋯ , Np)
This case means there is no available FLAR for forecasting, and the prediction is set as
The final prediction of xT×(t-1)+r is calculated by the average of the predictions obtained from the available FSARs and FLARs
The final prediction here reflects the functions of short-association and long-association in time series.
In the fuzzy long-association rule based short-term forecasting model, the correlations in time series are described by FSARs and FLARs. These rules characterize the influence on the consequent trend from the antecedent trend at the consecutive time periods and non-consecutive time periods. When a forecasting is made on them, the prediction results reflect the function of both short-association and long-association in time series.
To certify the advantages of FARs (FSARs and FLARs) and the FLAR based forecasting model, experimental studies are introduced from four aspects: Section 5.1 analyzes 5 datasets used in experiments; Section 5.2 introduces 7 other existing models, whose forecasting performance is compared with that of the proposed model. Following that, an example is described in Section 5.3 to illustrate the forecasting processes of the proposed model. Finally, 4 experimental analyzes are given in Section 5.4 and Section 5.5.
Datasets
The 5 time series used in experiments are given as follows. They have different trend characteristics: JD.com stock price time series (JD) [44]: the highest price from March 13, 2001 to August 4, 2003; Melbourne temperature time series (MEL-Temp) [21]: the daily maximum temperature from January 1, 1981 to May 30, 1987; General Electric Company stock price time series (GE) [44]: the highest price from March 13, 2001 to August 4, 2003; Northrop Grumman Corporation stock price time series (NOC) [44]: the highest price from August 27, 2014 to July 6, 2017; Intel Corporation stock price time series (INTC) [44]: the highest price from January 4, 2012 to October 15, 2014.
Seven comparative models
For verifying the superiority of the proposed model, we compare it with the following 7 existing models:
The FARs adopted in models FAR-1 and FAR-2 are fuzzy short-association rules, which ignore the long-associations in time series.
The FCM-Model and FTS-Model transform time series to fuzzy cognitive map and fuzzy time series for forecasting respectively, which have high interpretability.
•Exponential smoothing (ES): the function of this model is as follows:
•Autoregressive integrated moving average (ARIMA): model ARIMA(p, d, q) produces the time series with the mean μ by the following function:
•Nonlinear autoregressive (NAR) neural networks: it has h delayed inputs, expressed as
Experiment on the JD time series
In order to exhibit the forecasting process of our proposed model, an example is studied on JD time series X ={ x1, x2, …, x465 }. This example takes the ratio of training data to test data to be 2/1, and the FARs are with the forms of G(t - 1) → G(t) and G(t - p) → G(t)(p = { 2, 3, 4 }). The time granularity used in granulation is set as half a month, namely T = 15, and the number of clustering centers is 4.
From
For the sake of understanding, we take the forecasting of x462 (462 = 15×30 + 12) as an example, its forecasting is to be realized in granule G31. Known the historical granules G27, G28, G29, G30, the available FSARs and FLARs mined by
The selected available FSARs and FLARs in forecasting granule G31
The selected available FSARs and FLARs in forecasting granule G31
The prediction of x462 is implemented from the FARs in Table 2 as the following 4 sub-steps:
In FSAR G19 → G20, the premise granule G19 = LG(0.065, 27.582, 0.285, 15) captures the slow increase of data and the consequent granule G20 = LG(0.123, 28.935, 0.180, 15) reflects a rapid growth in data, therefore the rule G19 → G20 explores the influence of the slow increase trend on the rapid growth trend.
From G19 → G20, since x462 corresponds to the 12th moment of granule G30,
From G20 → G21, the prediction of x462 is
Thus,
From FLAR G19 → G21, the prediction of x462 is
Through the above steps, the prediction of other data can be calculated.
Next, we compare the forecasting performance of the proposed model with other existing models by three evaluation indexes (given in Equation (4)) and the prediction result depicted by
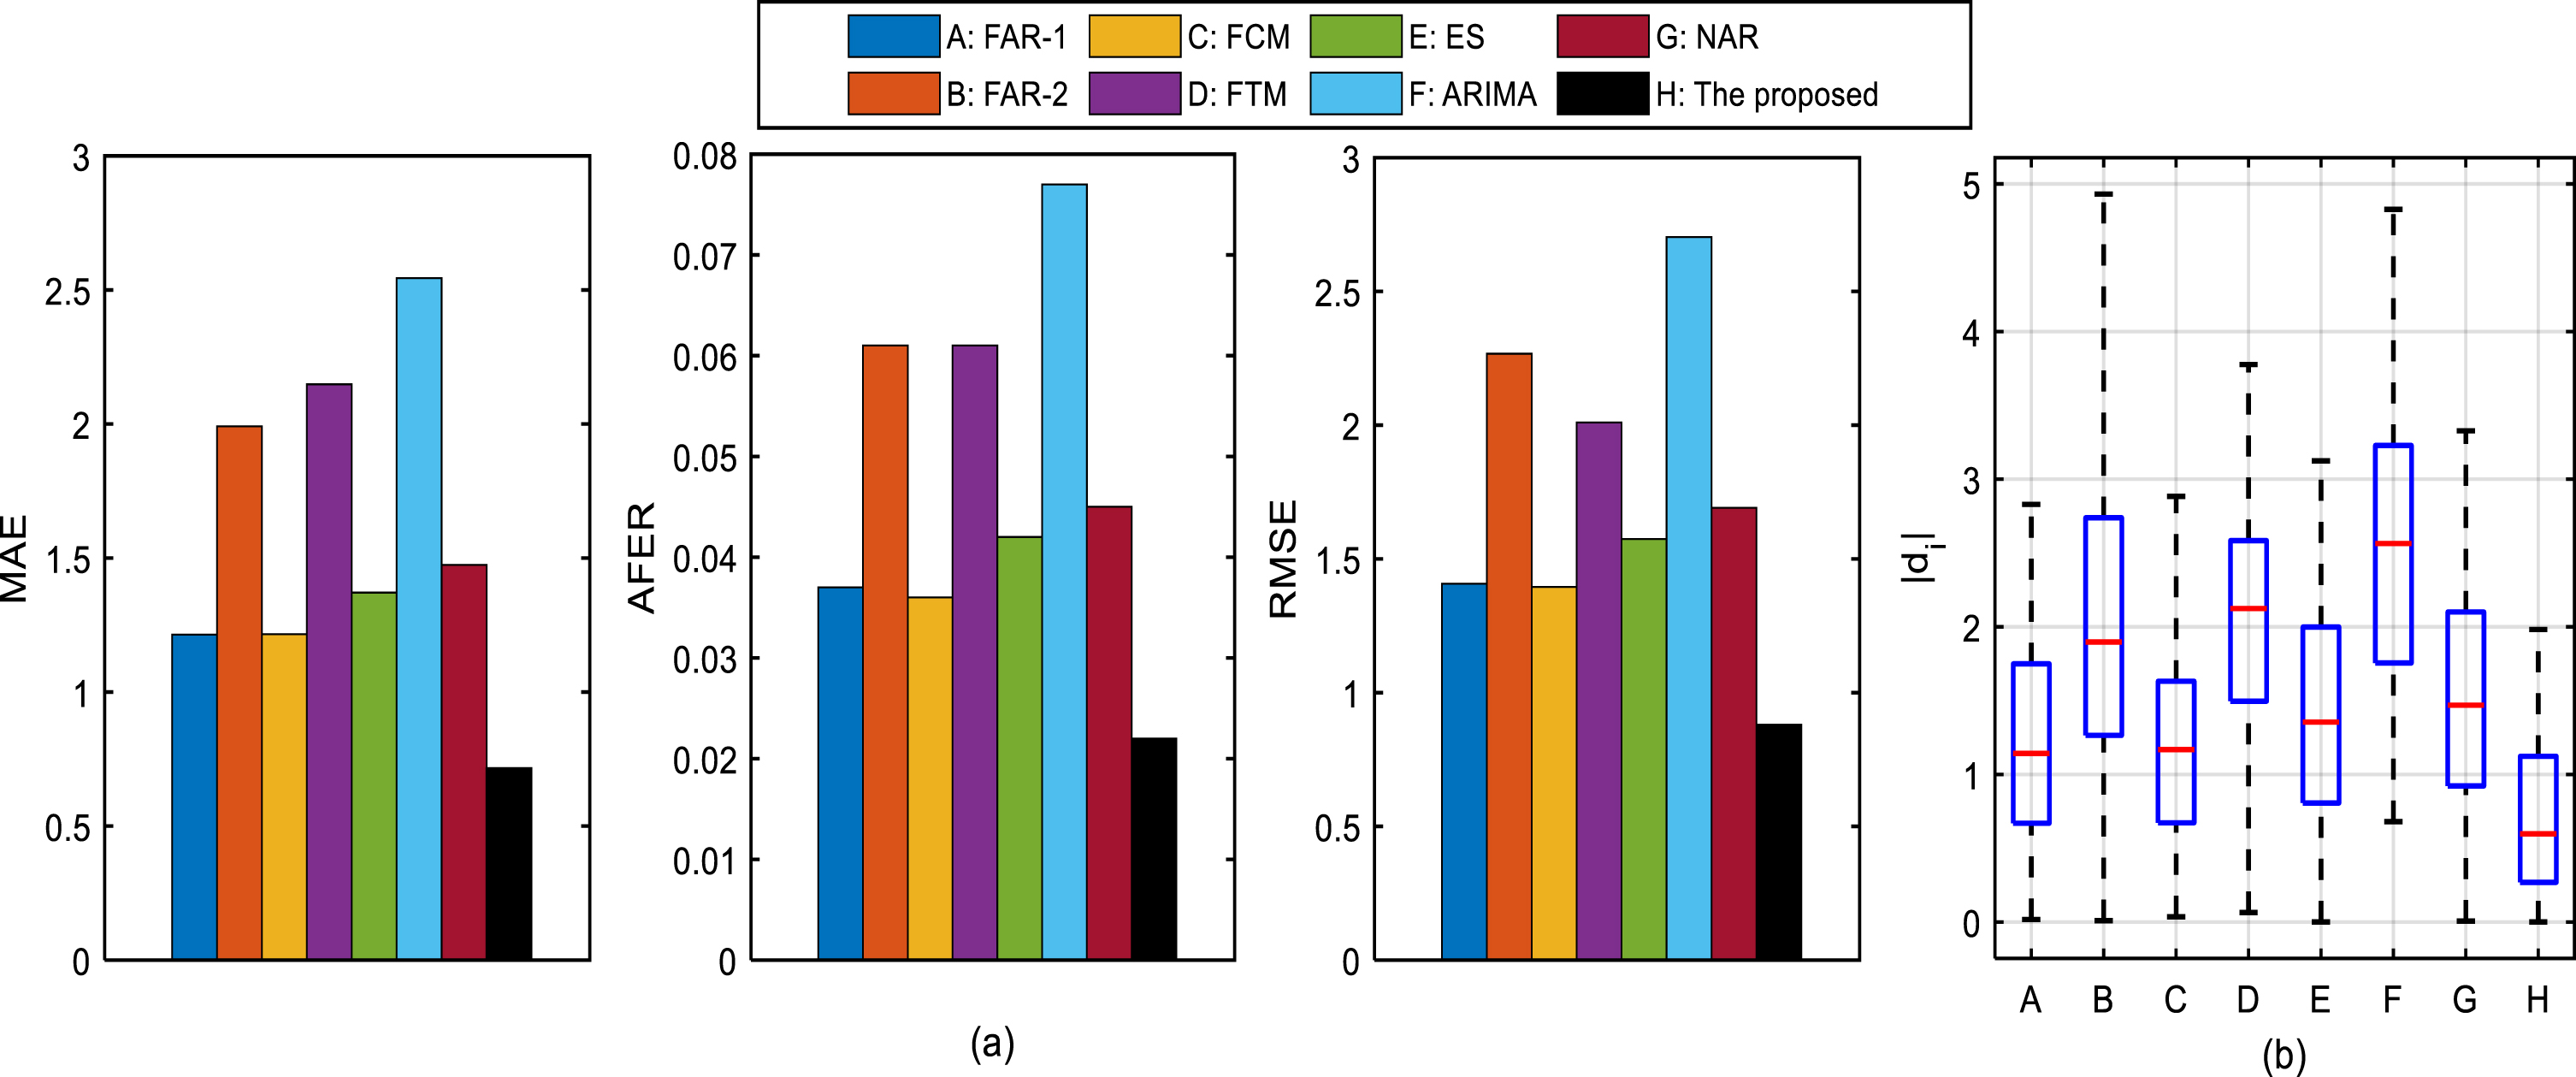
Table 3 lists the index values of each model, and those of our model are listed in the last row. In order to compare the forecasting accuracy from each model clearly, Fig. 4(a) is drawn according to the results in Table 3. From the results expressed in Table 3 and Fig. 4(a), we can find that the proposed model achieves the smallest value on each evaluation index.
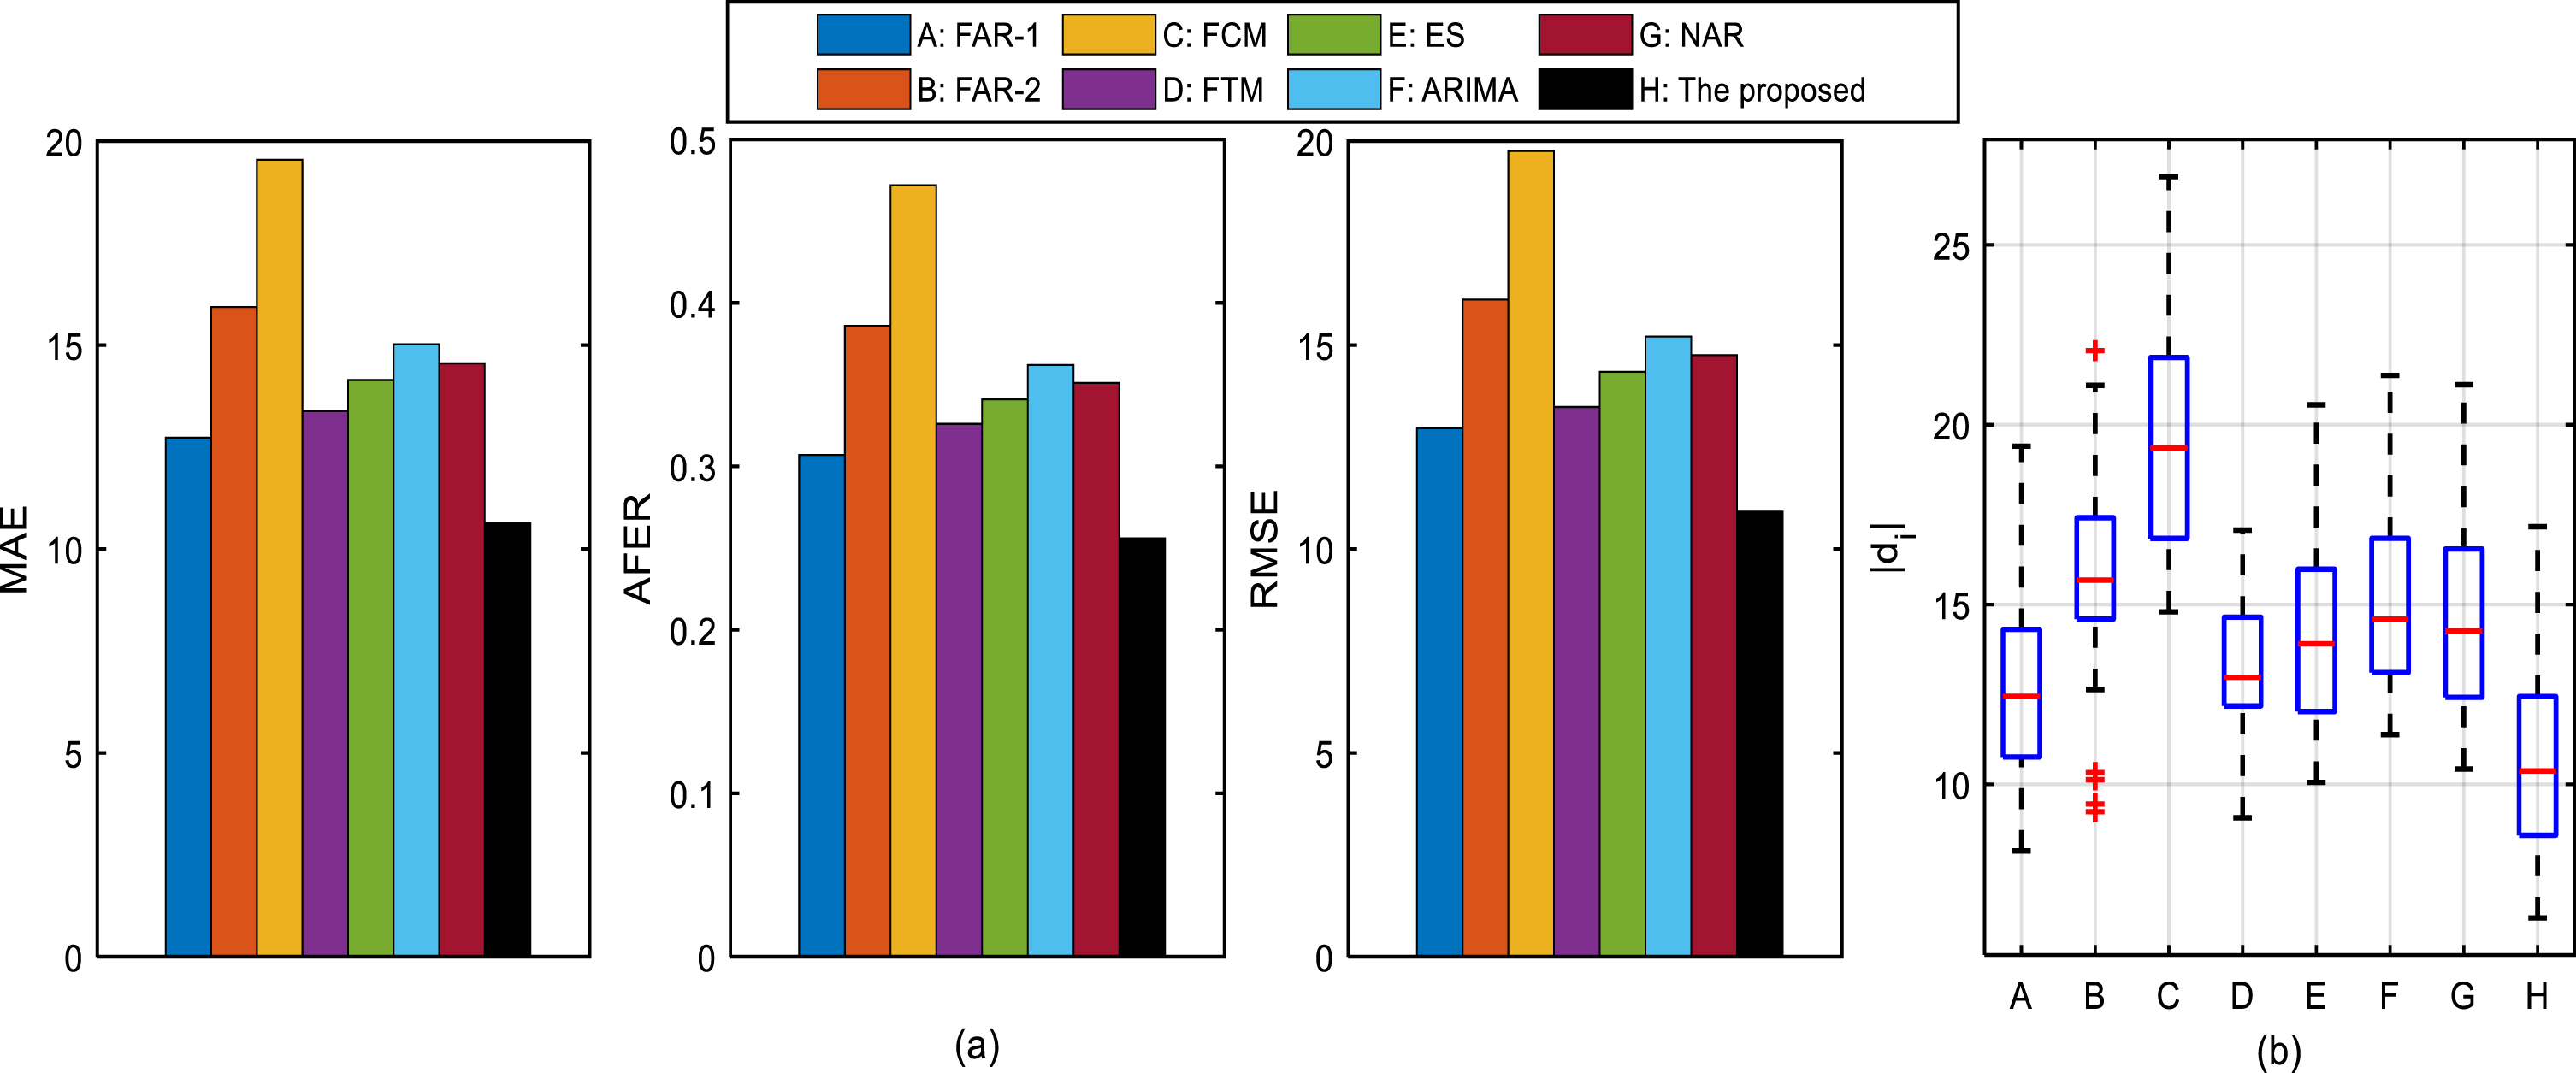
Comparisons of forecasting performance between the proposed model and 7 other existing models on the JD time series: (1) comparisons of MAE, AFER and RMSE values; (2) comparisons of d i .
Comparisons of MAE, AFER and RMSE values between the proposed model and 7 other existing models on the JD time series
In addition, the prediction results d i s of each model are drawn by a box figure in Fig. 4(b). It’s obvious that the length of the box figure of the proposed model is the smallest and the medium value of d i of our model is the closest to 0.
The forecasting accuracy of these models are analyzed as follows:
•Contrast between the proposed model and FAR-1
By contrasting the second row with the last row, the better forecasting performance of our proposed model indicates that construct the long-association rule is beneficial to capturing the characteristics of time series, moreover, select the available association rules can help us get better predictions.
•Contrast between the proposed model and FAR-2
After contrasting the third row with the last row, the benefits of fuzzy long-association rule can be verified, which indicate that considering the long-association in time series analysis is reasonable.
•Contrast between the proposed model and other models
After contrasting the last six rows, which calculate the short-term predictions through iterating one-step results, one can find that the proposed FLAR based model can improve the forecasting performance by reducing cumulative errors.
From the above analyses, we can declare that the proposed model outperforms the other 7 models on the JD time series.
The experiment on the MEL time series is the same as that on the JD time series.
In the proposed model, the number of the maximum time lag M has an influence on forecasting: the larger the number of M is, the more association rules are constructed. Thus, we will study the forecasting performance of the proposed model under different the maximum time lags in this experiment, i.e., M = 3, 4, 5.
Table 4 shows the evaluation index values of the proposed model under different M. From this table, one can see that the larger the number of M (the more FLARs), the better (the smaller) the forecasting performance. It indicates that the FLARs can improve forecasting accuracy by accurately considering the associations in time series.
Comparisons of MAE, AFER and RMSE values of the proposed model under different the maximum time lag M
Comparisons of MAE, AFER and RMSE values of the proposed model under different the maximum time lag M
The index values of 7 other existing models are expressed in Table 5. For easy comparison of the forecasting performance of the proposed FLAR based model with other models, Fig. 5(a) is drawn according to the results in Tables 4 and 5. The prediction results (d i s) of the existing models and the proposed models are exhibited in Fig. 5(b). From Fig. 5, one can find that the index values, the length of box and the medium values on d i s of our models are smaller than those of other models.
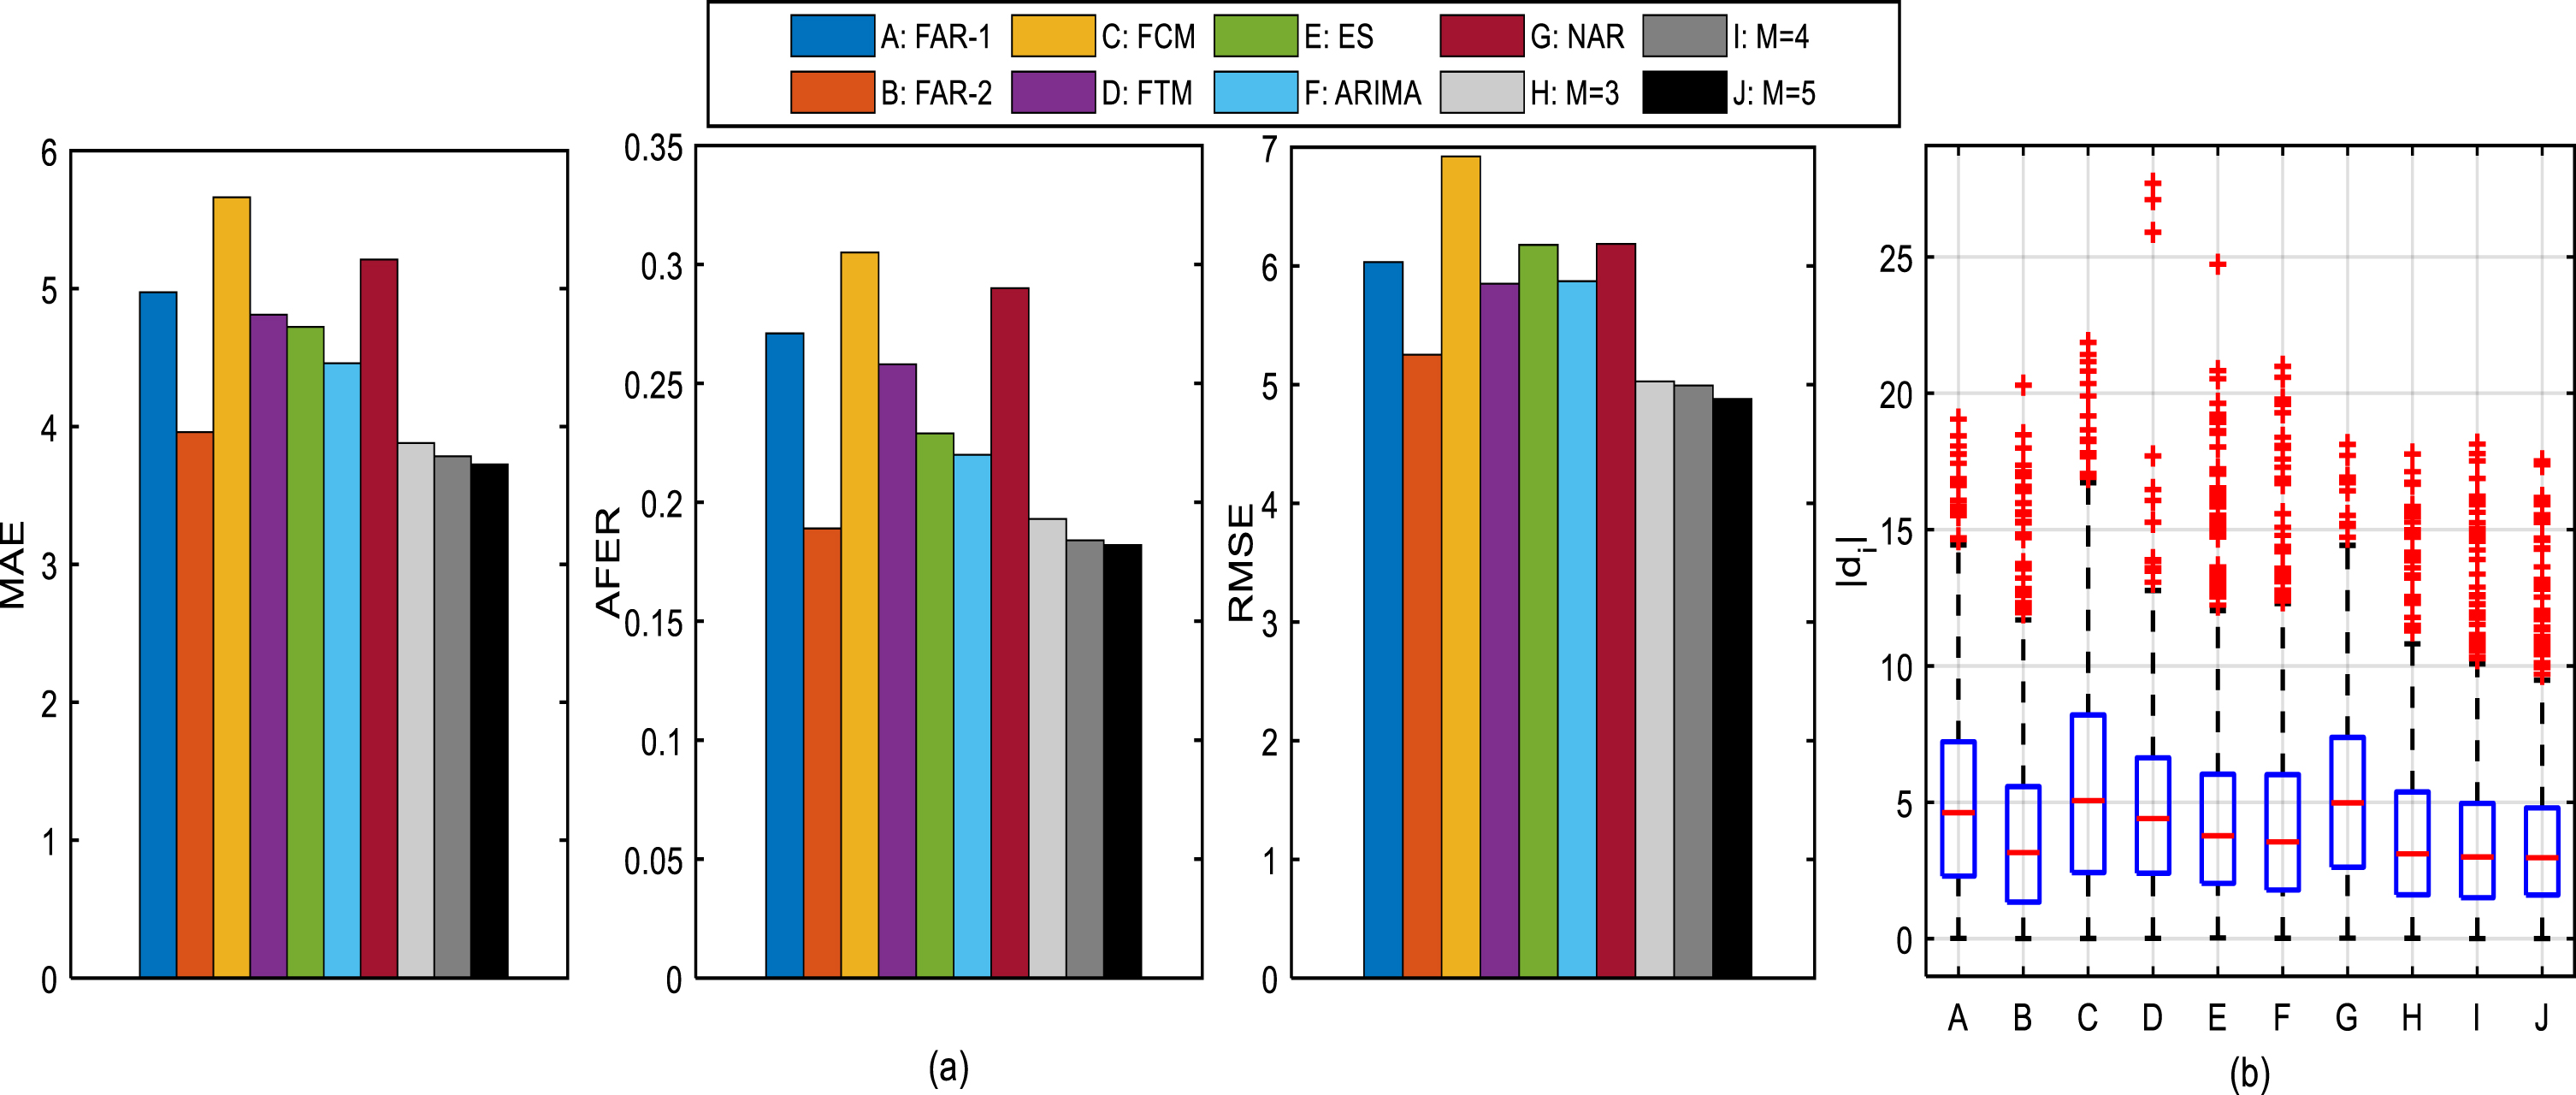
Comparisons of forecasting performance between the proposed model and 7 other existing models on the MEL time series: (1) comparisons of MAE, AFER and RMSE values; (2) comparisons of d i .
Comparisons of MAE, AFER and RMSE values of 7 other existing models on the MEL time series
The obtained results in Table 4, Table 5 and Fig. 5 show that the proposed model is superior to the other existing models in short-term forecasting. Especially, unlike FAR-1 and FAR-2, the FLARs have more contributions to improving forecasting performance. Compared with the other models, the cumulative errors are alleviated in the proposed model.
The experiments on three other stock time series (GE time series, NOC time series, INTC time series) are analyzed in this section, whose the maximum time lag and number of clustering centers are set as 5 and 3, respectively.
The forecasting accuracy (AFER, RMSE and MAE index values) of the proposed model and 7 other models on these stock time series are presented in Table 6. To visualize the comparisons between the proposed model and the existing models on the above index values, Fig. 6(a), Fig. 7(a), Fig. 8(a) are drawn. And the d i s of each model is shown in Fig. 6(b), Fig. 7(b), Fig. 8(b).
Comparisons of MAE, AFER and RMSE values between the proposed model and 7 other existing models on three other time series
Comparisons of MAE, AFER and RMSE values between the proposed model and 7 other existing models on three other time series
Comparisons of forecasting performance between the proposed model and 7 other existing models on the GE time series: (1) comparisons of MAE, AFER and RMSE values; (2) comparisons of d i .
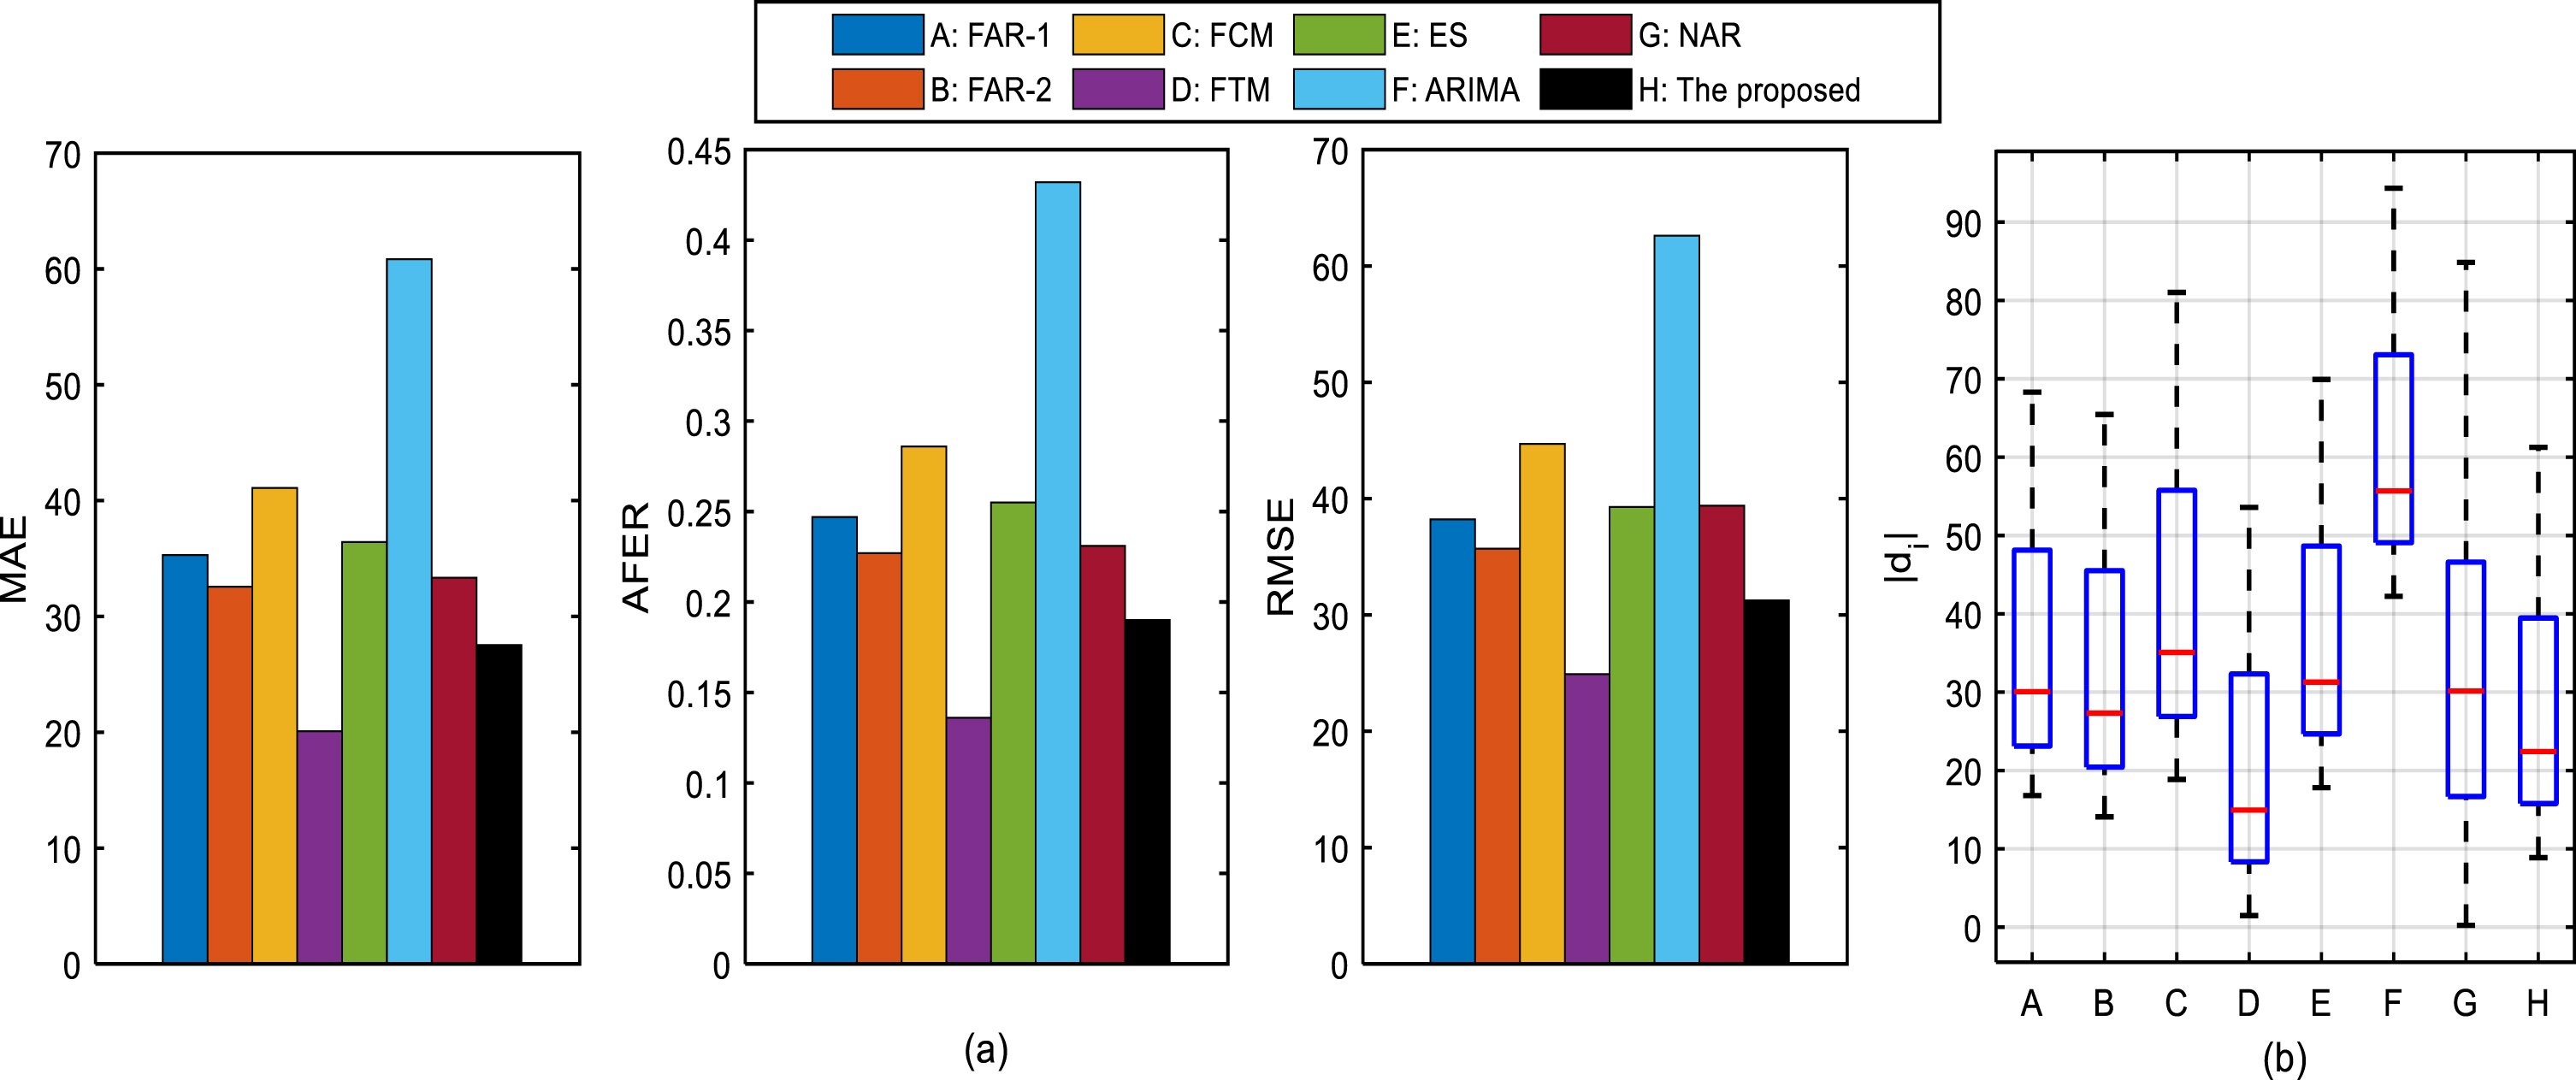
Comparisons of forecasting performance between the proposed model and 7 other existing models on the NOC time series: (1) comparisons of MAE, AFER and RMSE values; (2) comparisons of d i .
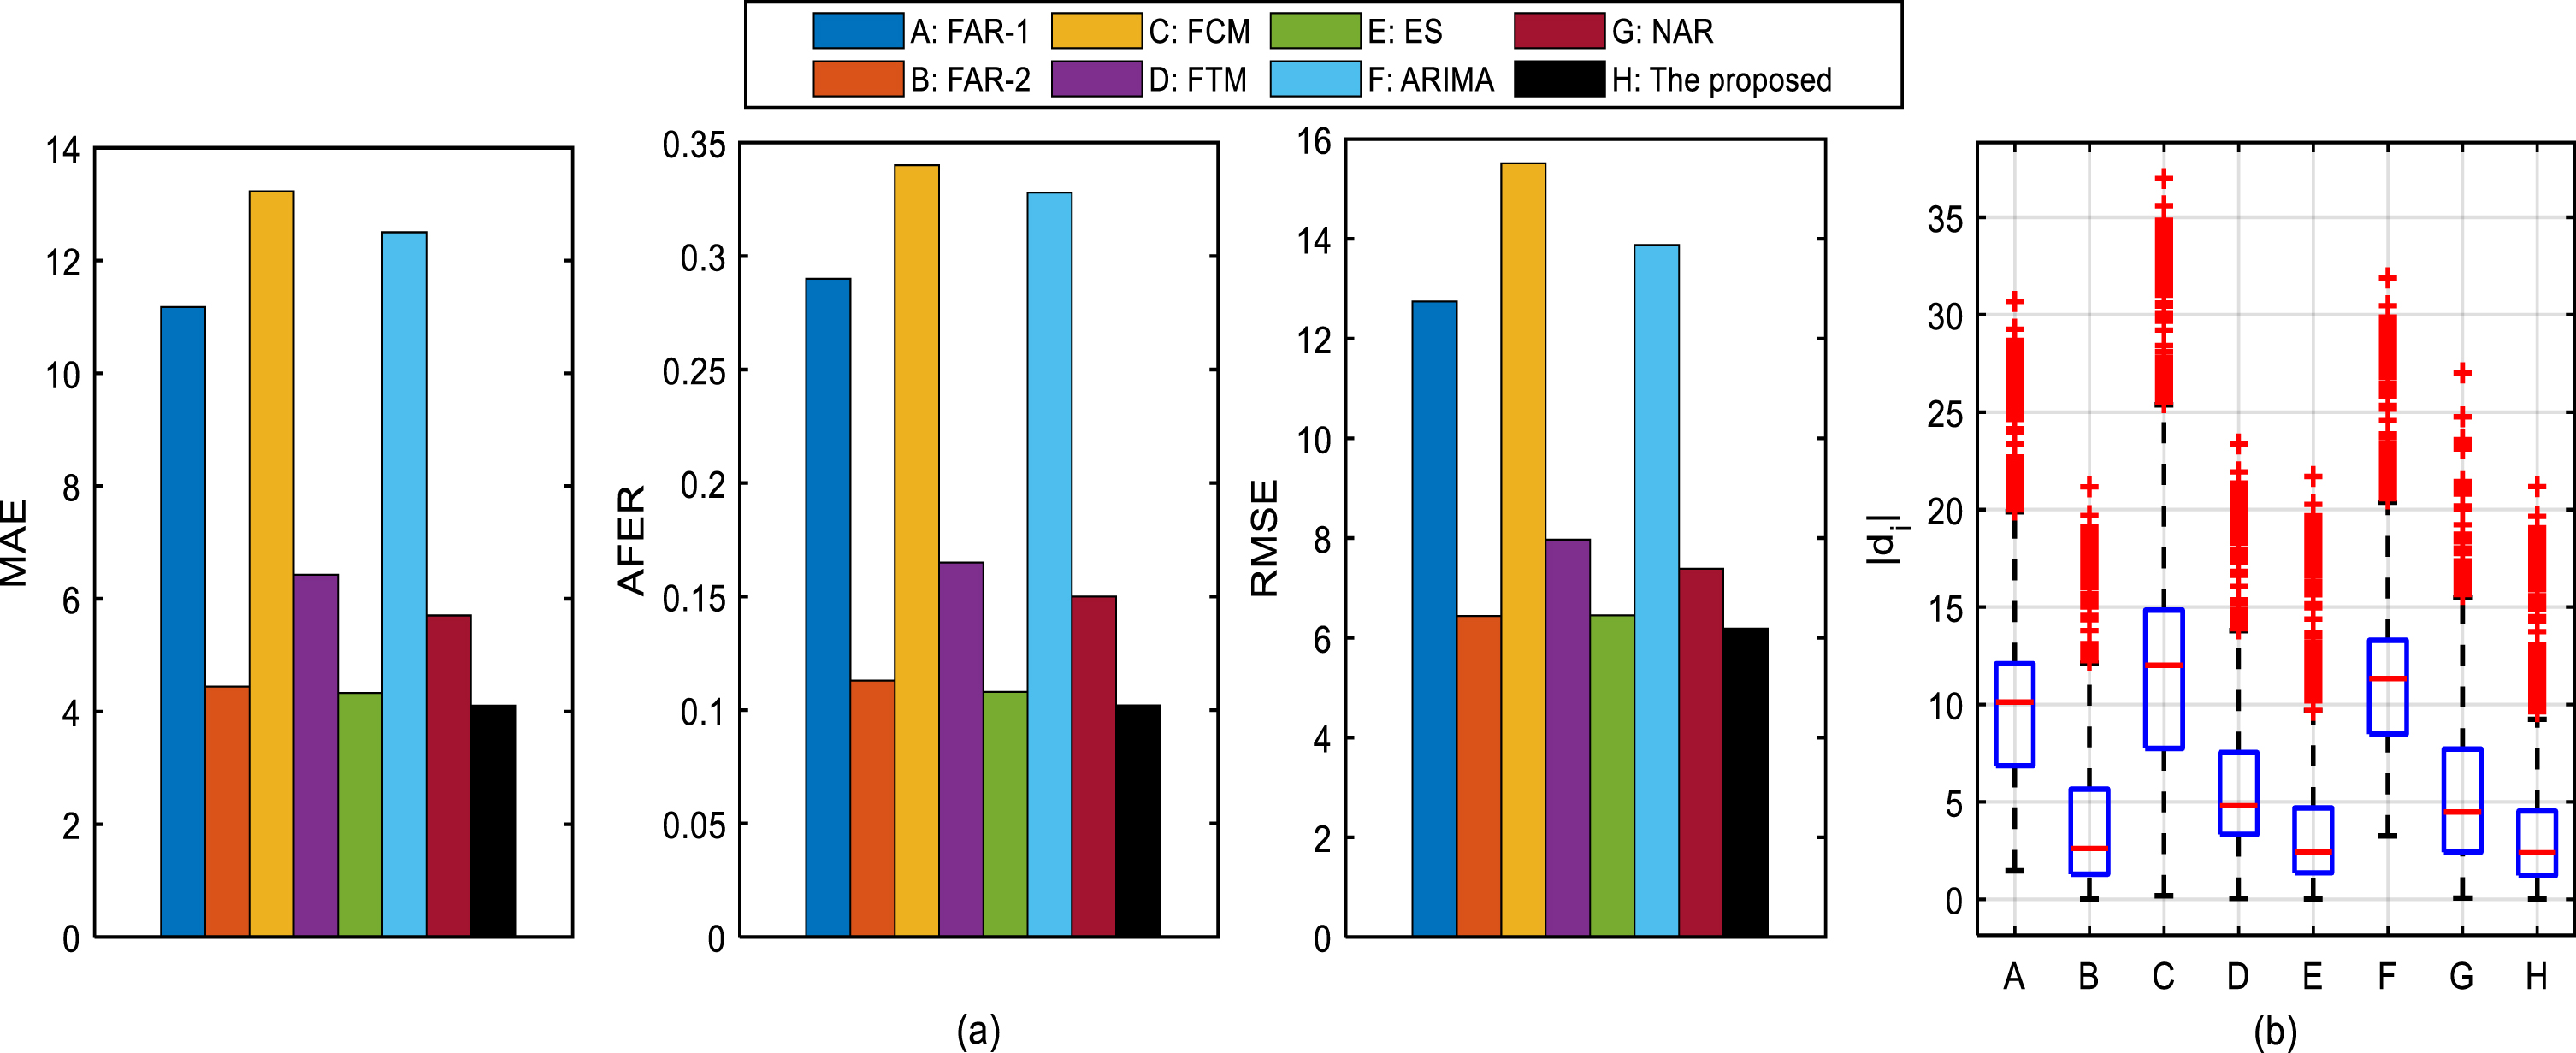
Comparisons of forecasting performance between the proposed model and 7 other existing models on the INTC time series: (1) comparisons of MAE, AFER and RMSE values; (2) comparisons of d i .
According to the results expressed in Table 6 and Figs. 6–8, we get the following consequences:
•GE time series and INTC time series
In Fig. 6, it’s obvious that the proposed model gets the smallest index values and the smallest medium value of d i s on the GE time series.
The same conclusion can be derived in Fig. 8. It means that the proposed model achieves the best (the smallest) forecasting performance on the INTC time series.
•NOC time series
In Fig. 7, although the FTS-Model achieves the smallest AFER, RMSE, MAE values on the NOC time series, and the medium value of d i s of our proposed model is larger than that of the FTS-Model, the forecasting accuracy of the proposed model tends to be the best, which is acceptable in real applications.
From the analysis in Section 5, we can get the following four conclusions:
1) Fuzzy long-association rules make up for the neglect of long-associations hidden in time series by the existing fuzzy association rules;
2) Fuzzy long-association rules improve the forecasting performance by accurately capturing the characteristics of time series;
3) K-medoids clustering based rule selection algorithm beneficial in obtaining reasonable prediction results by selecting the available FARs for forecasting;
4) Fuzzy long-association rule based short-term forecasting model is superior to 7 other models.
In this study, two kinds of fuzzy association rules are proposed: fuzzy short-association rule (FSAR) and fuzzy long-association rule (FLAR), where, the FSAR is constructed from two granules at consecutive time periods, and used to capture the short-association in data; the FLAR is constructed from two granules at non-consecutive time periods, and used to capture the long-association in data.
When a forecasting is carried out on these association rules (FSARs and FLARs), a rule selection algorithm is raised based on the k-medoids clustering. Through this algorithm, the available FSARs and FLARs can be selected for calculating the logical and accurate predictions.
On the basis of the new proposed FARs and the rule selection algorithm, a short-term forecasting model is put forward. This model differs from the existing short-term forecasting models in the form of FARs and fuzzy inference system constructed for forecasting. Comparing it with other models, one can find that the new proposed FARs and the novel fuzzy inference system help to improve forecasting performance.
In the construction of FLARs, the optimal time lag or the maximum time lag are given ahead. In the process of forecasting, different time lags will result in different FARs and different forecasting effects. Therefore, the selection of time lag is important in building forecasting model. Some intelligent methods, particle swarm optimization algorithm and ant colony optimization algorithm, can be applied for this work, and we will study it in the future. Moreover, the k-medoids cluster is introduced to select the available FARs for forecasting, next we will continue to analysis the function and influence of other clustering methods in this field.
Footnotes
Acknowledgments
We are grateful to the possible anonymous reviewers for their constructive comments on the manuscript. The authors thank AiMi Academic Services (![]() ) for the English language editing and review services.
) for the English language editing and review services.
This work is supported by the National Natural Science Foundation of China (No. 12201396) and the Fujian Natural Science Foundation Project (No. 2021J01001).