
Abstract
A spectrum-image based representation of machine vibration signals with deep convolution neural network is proposed for machine fault classification in which the convolution layer is used for automatic feature extraction as an alternate to the conventional feature-based methods. Two different forms of spectrum representations are proposed, one based on the short time Fourier transform of the original signals and the other based on the short time Fourier transform of the intrinsic mode functions acquired by empirical mode decomposition. Empirical mode decomposition has its own merits in discriminating non stationary signals and the novelty of the work is to use the short time Fourier transform of intrinsic mode functions with deep convolution neural network model. The classification and validation accuracy of the model are investigated with respect to epochs. It is demonstrated that both spectrum-based techniques perform good with 100% model accuracies in a numerical experiment of binary classification on a bearing dataset that comprises of normal and faulty signals. In another experiment using milling data set, short time Fourier transform of intrinsic mode functions representation performs better with 100% training accuracy, F1 score of 0.8933 which is better than that of using short time Fourier transform of raw signals whose training accuracy is 64% and F1 score of 0.7486. The numerical study shows that the empirical mode decomposition based spectrum representation delivers the highest accuracy in the learning model obviating the necessity for independent feature extraction, feature selection, and dimension reduction. The numerical experiment is extended using empirical mode decomposition based spectrums for multiple class classification problems in bearing dataset. The confusion matrix obtained for 10 classes, shows that validation accuracy is 100% for all classes. The performance comparison throws light on the merits of empirical mode decomposition spectrum method over other state of the art methods.
Keywords
Introduction
Vibration analysis is a powerful approach to perform condition monitoring for industrial machines and processes for identifying and predicting failures. The majority of portable vibration measuring devices have a Fast Fourier Transform (FFT) processing mechanism to analyse the vibrations. Depending on the severity and location of a machine problem, each vibration signature will be produced by the flaw [4]. Machinery investigation is required for the endurance of rotating machine parts, as it allows for recording continuous information on their status and scheduling optimized maintenance procedures. This process is named predictive maintenance. Predictive maintenance on rotating equipment frequently uses vibration monitoring. Unbalanced bearings, gears, and other components are the sources of the anomalies in the machine’s vibration. The time for repair can be precisely calculated if a condition monitoring and predictive maintenance system are put in place since it can detect parts that are about to malfunction in advance. Figure 1 shows the benefits of predictive maintenance.
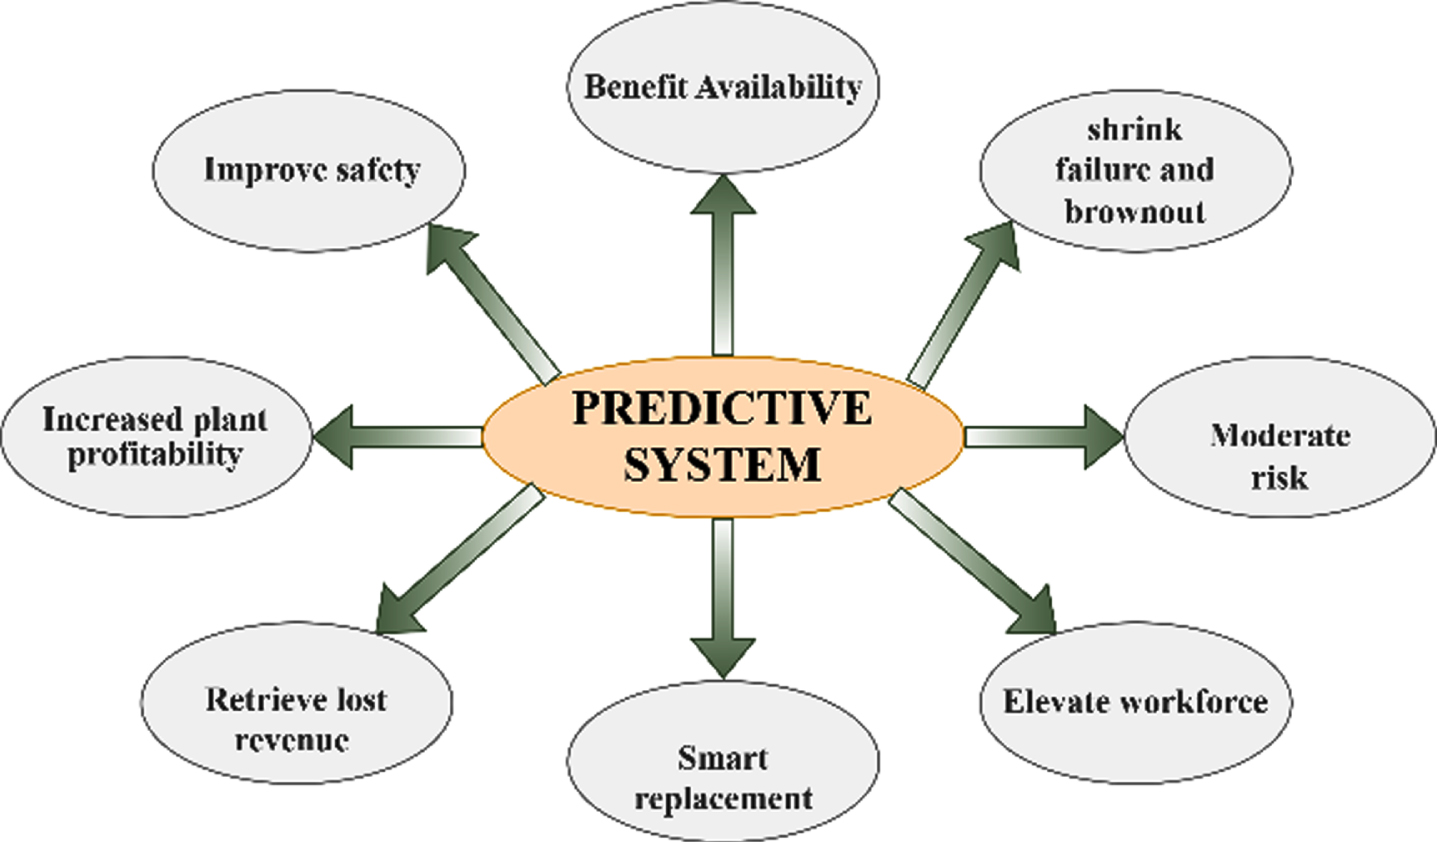
Benefits of predictive monitoring.
Rolling element generates vibration signals which include a wealth of information that can aid in condition monitoring, fault diagnosis, and machine health management by identifying the possibility of series of failures. The use of accelerometers in specific locations to quantify vibration is a typical practice. Machine learning techniques, particularly neural networks, have recently been popular in feature engineering to extract useful information from vibration signals. Fault diagnosis is a pattern recognition problem that consists of two main steps: feature extraction and classification [15]. Feature extraction involves the process of computation of statistical and signal parameters and involves a lot of computations and pre-processing steps [29]. Moreover, it’s a challenge to select the right features and sometimes a wrong selection of features affects the learning accuracy [15]. Feature selection introduces bias in the learning process [7]. The deep convolution neural network (DCNN) is a popular machine learning method for image classification and segmentation and is experimentally proven to give good classification results [18]. In DCNN the convolution layer extracts the useful feature directly from the input images and a separate feature extraction stage is not required.
Many research work had been carried out [27] to represent vibration signals in the form of images and to learn the images using machine learning algorithms to classify the machine faults. The very primitive method is to reshape the one-dimensional time domain vibration signals to two dimensional images and to use the images to train DCNN model. [17]. The frequency domain based image representation will discriminate the good and fault classes better and the modern approaches like wavelet analysis had been used in a recent work to create signal images from time domain vibration signals [27]. In this research, we propose to represent vibration signals as spectrums and apply DCNN directly on the spectrum images, eliminating the feature extraction signal processing block. In a recent work, sub-spectrograms of vibration signals are used with DCNN with improved classification accuracy [31]. Many researchers are attracted by the method of analysing the vibration signals using empirical mode decomposition (EMD) which is proven to be robust in bringing out the machine fault [5] with the help of intrinsic mode functions (IMF) for non-stationary signals. The IMF signals of the EMD analysis are time-domain signals and in a research work [21] the entropy of the each IMF signal is calculated and the set of entropies is used as additional features along with the features learned using CNN from the Fourier spectrums of the original vibration signals. In this proposed paper, the following research question is raised assuming the environment of DCNN learning. Will learning the spectrum images of the time-domain IMF signals obtained by EMD analysis of the vibration signal lead to better accurate classification than learning the spectrum images of original vibration signals ?. It is expected that the EMD based method will have a better performance, as EMD is a better analysis tool for non-stationary signals. It is also expected that the proposed method will also have the benefit of the automatic feature extraction capability of DCNN. The objectives of the proposed research are to show the efficacy of the proposed CNN method of using spectrum images of EMD-IMF to classify machine faults for a benchmark vibration dataset and to reassure the repeatability of the precision of the proposed method for different kinds of datasets.
In this paper, an investigation is done on the method of using short-time Fourier transform (STFT) as the spectrum image representation technique for vibration signals and to use the images in DCNN to develop a model to discriminate the good and faulty conditions of the machine. It is proposed to integrate EMD analysis with the imaging technique to represent the signal fault distinctly. In this paper, the proposed STFT imaging is performed in two ways one on the original vibration signal and another on the IMF’s signals obtained using EMD. The images obtained are used to train the DCNN to classify the normal signal and faulty signal and the experiment is conducted on two different data sets to bring out good models with better training and validation accuracies than the other state-of-the-art methods. This research throws light on the answer for the research question by bringing out the merits of EMD-based spectrum imaging of vibration signals. The experimental results show that the EMD-based spectrum imaging technique used in DCNN is very promising and gives almost 100% classification accuracy. The validation accuracy graph plotted over epochs clearly indicates that results obtained for EMD-IMF0 is far better than other IMFs and also better than the direct method that uses STFT analysis of original vibration signals. To reassure the efficacy of the method, the numerical experiment is conducted for another small dataset named milling dataset to classify the milling tools as good or bad using the proposed approach. This selected milling dataset problem is not a very ideal as it involves too many dissimilar images in same class and highly non stationary. In one of the trial of the numerical experiments, it is brought out that learning the spectrum of EMD-IMF0 signal has a validation accuracy of 81.25% which is better than the direct method based on STFT on original signal whose validation accuracy is around 50%. These classification methods using vibration signals for milling data is analysed statistically by performing 50 trials of same CNN experiment and it is found that EMD-IMF0 leads to the best average validation accuracy of 74.29%. There are 42 testing samples in the experiment and using binomial distribution based sign test [10] approximately a minimum number of 28 wins are required to have p < 0.05. It is brought out by an experiment that EMD-IMF0 based method has 37 wins and is much superior over direct method that has only 28 wins.
This best method of using EMD-IMF0 spectrums in DCNN is extended for multiple fault classification problems on bearing datasets considering 10 different fault classes which is also found to be very accurate that gives a proper diagonal confusion matrix that implies 100% validation accuracy. The experimental results obtained in this proposed research for CWRU bearing dataset is compared with other state of the art methods those used the same CWRU dataset and it is inferred that the proposed CNN learning method on EMD-IMF0 based spectrum images outperforms all other methods The objective of the research is to validate the proposed idea in two different datasets and the objective is achieved by bringing out the merits of the novel method of high accurate DCNN learning on STFT images of the EMD-IMF0 signals. The novelty of the paper is its idea of using the STFT image representation of IMF signals of EMD analysis to use in DCNN which is the best tool for image classification. In previous work on EMD-based vibration analysis, the IMF signals are not used completely and only the energy of the signals are used in the machine learning problems as feature vectors [26] which makes this proposed work outstanding as the whole spectrum information of the IMF signals is used. The proposed method of completely using STFT images of EMD-intrinsic mode functions is new and novel, throwing light on the merits of EMD analysis of vibration signals in the machine learning problems of machine monitoring.
The aim of this research is to study the efficient methods to represent vibration signals produced by machines in form of images that can be used for accurate fault classification using DCNN. As DCNN is a very good classifier for visual images the method will lead to very accurate machine fault classification. Case Western Reserve University’s (CWRU bearing vibration signal database [33] is a popular benchmark dataset used by lot of researchers [8,9,11,13,14,16,18,26–28, 8,9,11,13,14,16,18,26–28] and in this work, it is proposed to use the same CWRU dataset. The very simple primitive method to represent the vibration signals as image is to arrange the one-dimensional time-domain signal obtained from the dataset as two-dimensional image and to use it in CNN learning. In a recent work, [17] the one-dimensional CWRU vibration data are converted to reshaped time-domain two dimension images and used in CNN to obtain an accuracy more than 96%. In another work [13] similar method of reshaped time-domain images is used with the Alexa-net based transfer learning architecture and an accuracy of 98% is achieved. The frequency-domain analysis works better than time-domain analysis as frequency-domain analysis brings out lot of hidden details of the signal. In another work [18] the frequency-domain sub-spectrograms of the vibration signals are used as images in a similar Alexa-net based CNN transfer learning architecture and classification accuracy of 99% is demonstrated. The key merit of both the methods [17,18, 17,18] is that they use transfer learning architecture and thus characterised by a very high accuracy, leveraging the previous learning done in Alexa-net. In another work [27] continuous wavelet transform (CWT) is applied to get signal spectrums and using these in CNN a very high accuracy of 99% is demonstrated. Using the IMF obtained by EMD of vibration signals for further analysis is attracting many researchers as it fits much better for non-stationary signals [8,9, 8,9]. In another work, [26] the very basic entropy feature of the IMF signals and other time-domain features are used along with CNN learned features in a SVM-based classifier and an accuracy of 99% is demonstrated. This work is based on a multi-stage architecture in which the CNN is used to learn the features from STFT images of the vibration signals and used along the EMD-IMF energies and other time-domain features in a SVM classifier for further classification. The IMF of EMD of signals are time-domain signals and as a novel method, in the proposed paper, it is proposed to use STFT spectrum images of the IMF signals in DCNN for fault classification. It is proposed to test STFT-based spectrums of the raw signal and also the STFT of IMFs of EMD of vibration signals for better classification of machine faults. To prove upon the robustness of the proposed EMD-IMF method and its merit over raw signal STFT method another milling dataset [34] is also used in this paper. This dataset comprises of many other data along with vibration signal to study the wear and tear of the tool used in milling process and this data set had been used in many work [1,3,6,12,19,22,24,25,30,32, 1,3,6,12,19,22,24,25,30,32] to develop machine learning algorithm to estimate remaining useful life (RUL) of the tool by using all the data columns of the database. In this work it is restricted to use only the spindle vibration signal to classify the tool as good or fault.
This extended experiment is to verify the repeatability of the proposed method of CNN learning on spectrum images of EMD-IMF signals to classify the tools as good or faulty.
Proposed work
In this research, the CNN directly learns the useful parameters to classify the vibration sample signal, thus eliminating a separate feature extraction stage. The STFT is applied to both the original signal and EMD-IMF signals on two different data sets, the bearing data set [33] and the milling data set [34] which are discussed in previous section. The process involved in the proposed experiment is represented as an algorithm using standard block diagram structure as in Fig. 2.
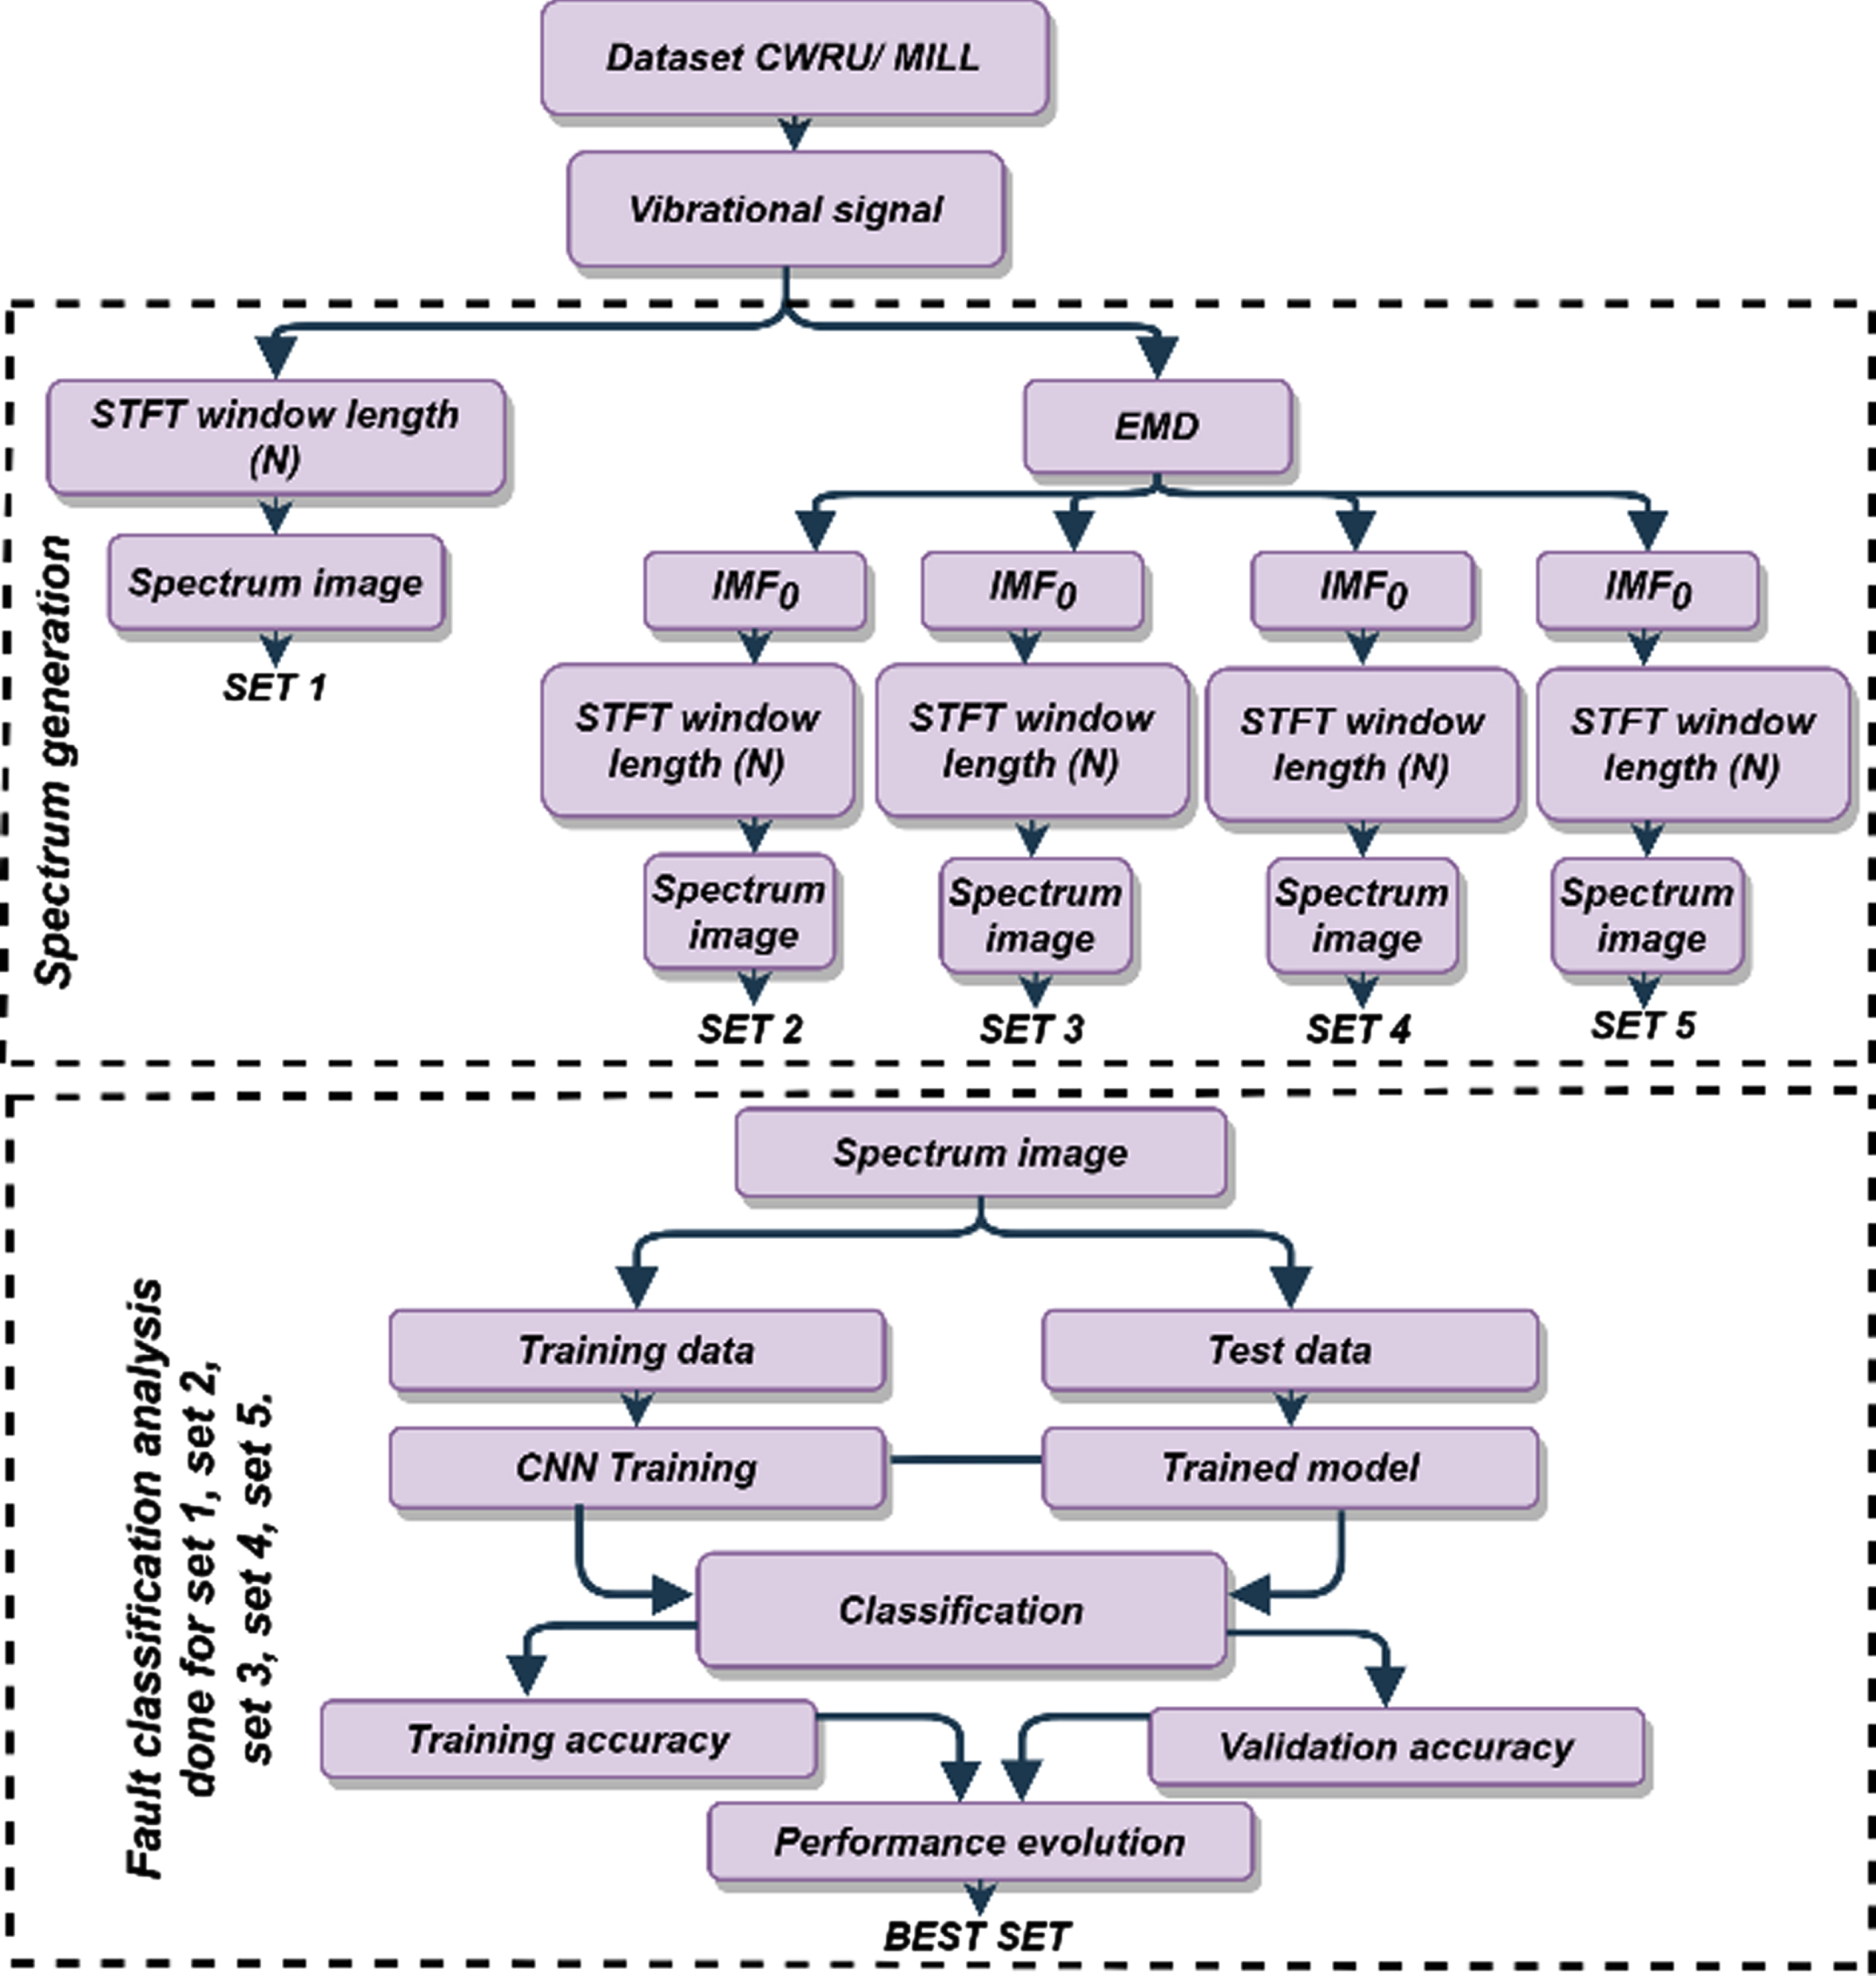
Algorithm of proposed work.
Spectrum image formation method
The vibration signals corresponding to good condition and faulty conditions are fetched from the data set and subdivided into K overlapping short signals that exist for T time units. Every such signal is considered as a class member of either a good or faulty class. Then the spectrum image for the member signal is obtained by applying STFT with FFT length N and with 50% overlapping to two different forms of the signal (i) original signal and (ii) M intrinsic mode functions obtained by EMD. The K depends upon the dataset we select and, in this study, we considered two datasets [33,34, 33,34]. In case (i) STFT transforms the original time-domain signal that is seen through the window into the frequency-domain and the peaks are formed corresponding to the spectrum components. In a grayscale image, the peaks appear as white points. STFT is complex-valued and magnitude value is used in the spectrum display. The spectrum depicts the change of frequency with respect to time. Figure 3 shows the spectrum image formation using STFT for case (i) in case (ii) Empirical mode decomposition decomposes the time-domain signal into separate intrinsic mode functions and STFT is applied to each function. The minute details of the time-domain signal will be distributed in the IMF. The IMF is still the time-domain function and serves as the orthogonal basis for the signal [2]. Figure 4 shows the spectrum image formation using EMD.
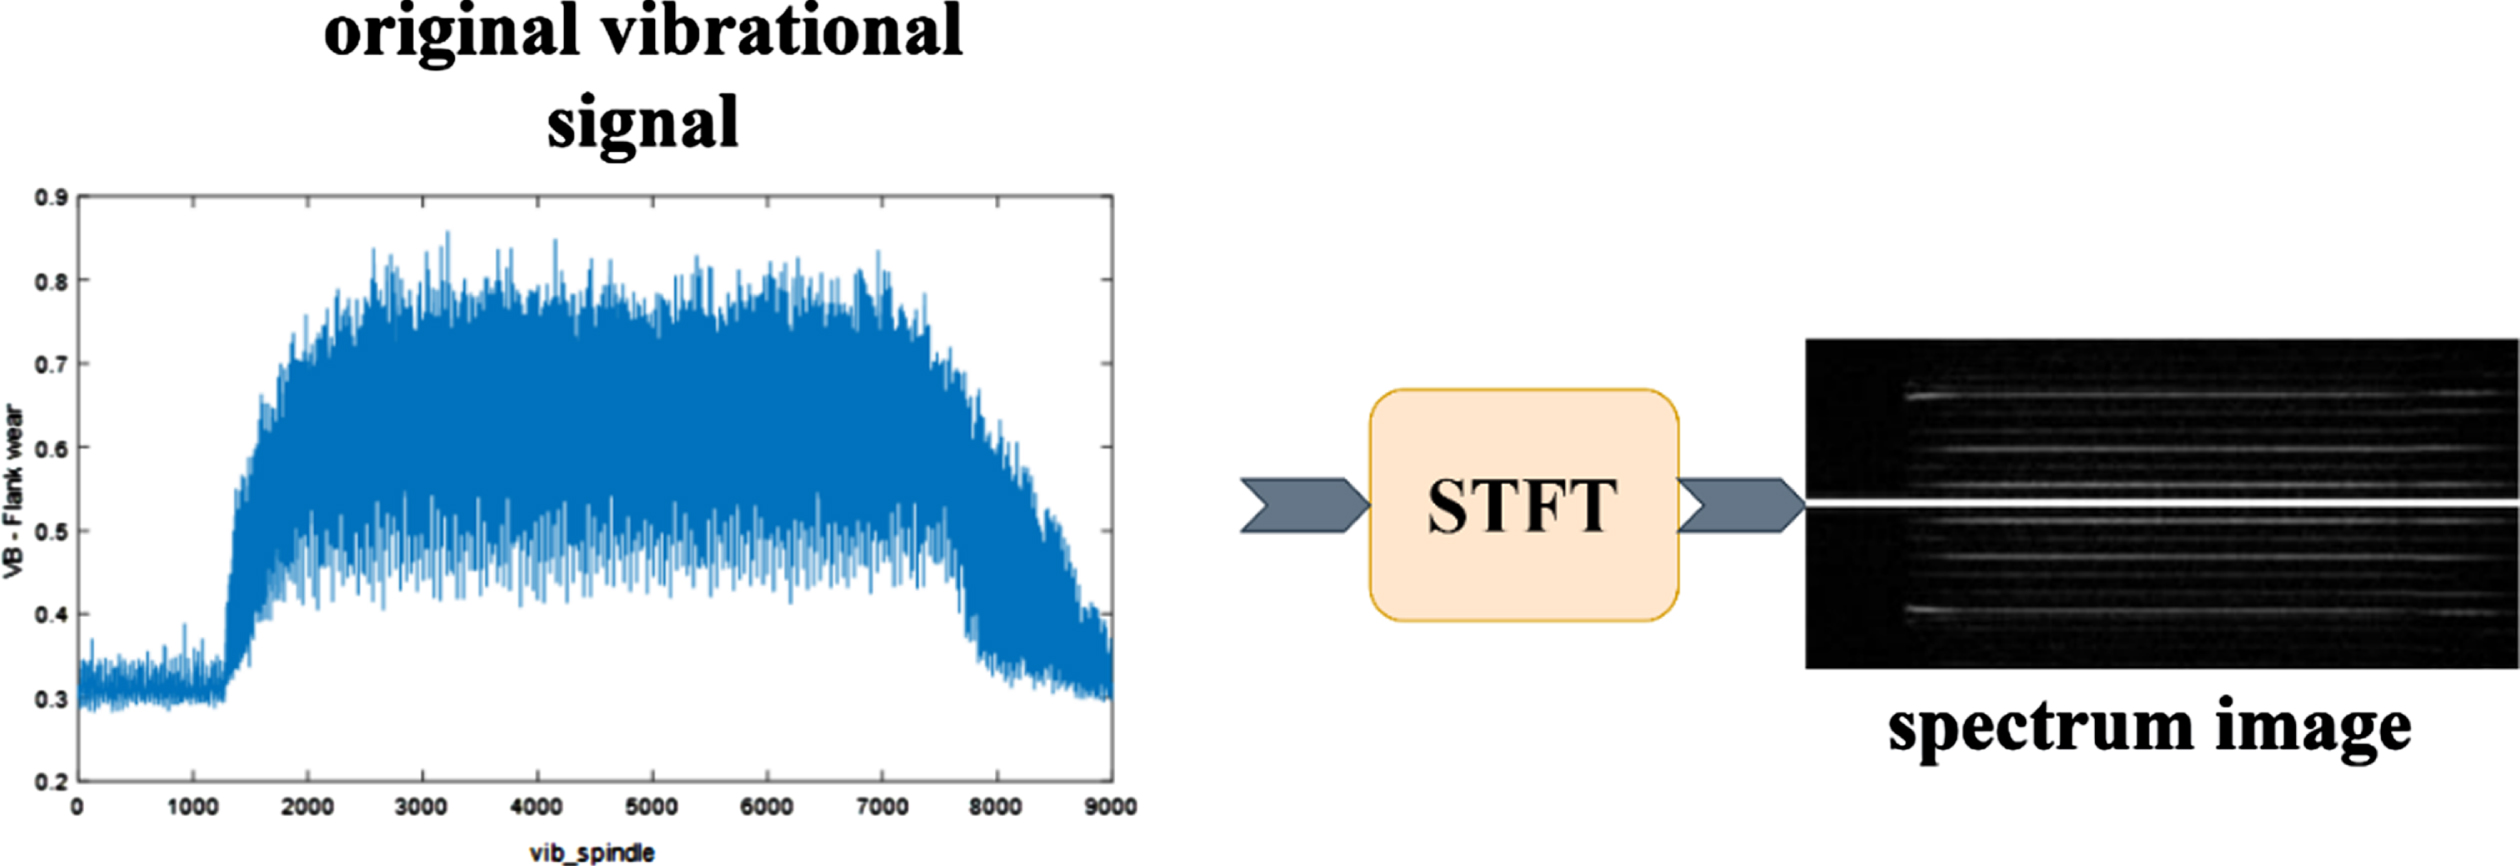
Spectrum image formation using STFT.
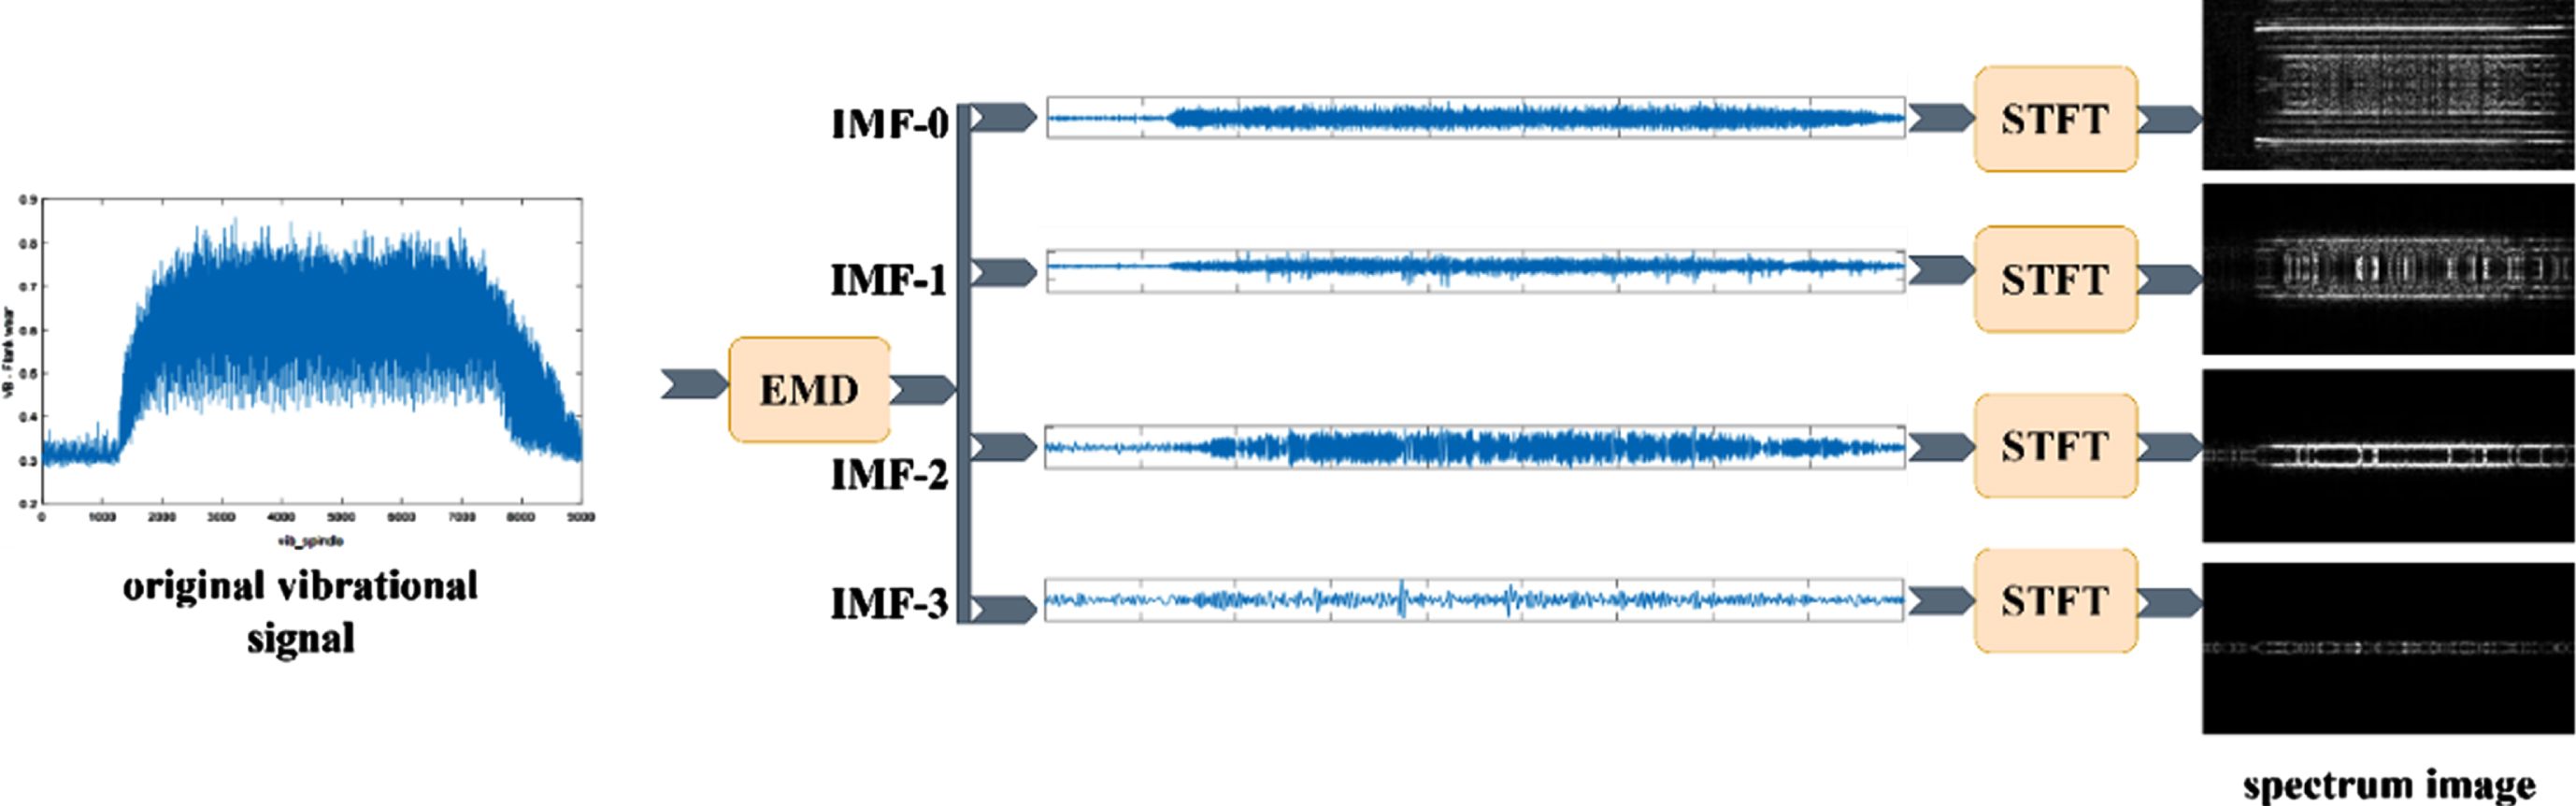
Spectrum image formation using STFT-EMD.
To show the efficiency of our approach, experiments were performed on the bearing vibration signal database of Case Western Reserve University (CWRU). Figure 5 depicts the components of the test stand, which include a 2 HP motor, a torque transducer, control electronics, and a dynamometer. The test bearings hold up the motor shaft. The test bearings are being subjected to electro-discharge machining to produce single-point flaws with diameters of 7, 14, 21, and 28 mils (one mil equals 0.001 inch). For drive-end bearing failures, digital data were captured at a rate of 12,000 pulses per second. The torque transducer was used to measure speed and horsepower, which had to be manually recorded. Vibration data will be measured using accelerometers. According to the reference [33]. the bearing vibration signal database includes numerous signal components and specifications. It covers a wide range of experiment apparatus fault types, such as inner race (IR), ball (BA) and orthogonal (OR) faults. In this experiment, the normal signal and BA fault were taken into consideration. In the proposed experiment, drive end (DE) accelerometer data is used for analysis of the vibration signals corresponding to normal conditions and BA fault.
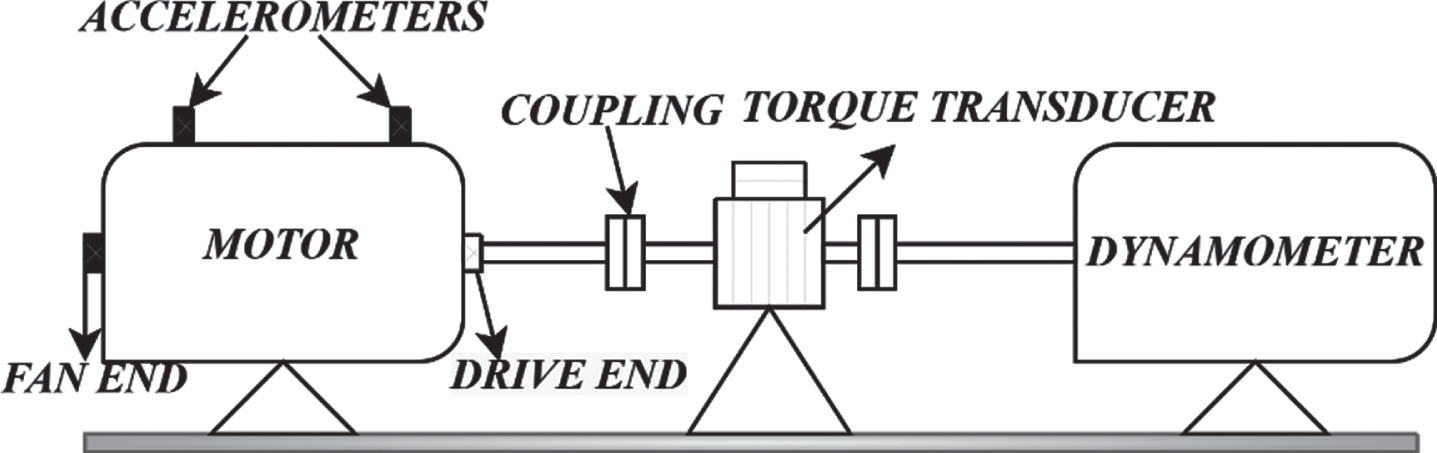
Block diagram of experimental setup of CWRU bearing dataset.
As explained in section 3.1.1 case (i), the original DE vibration signals of the bearing dataset corresponding to normal and BA fault are transformed to image data with N = 256, to get 4737 normal images and 1096 images corresponding to BA fault as shown in Table 1. A sample of normal and faulty spectrum images are given in Fig. 6.
Configuration of normal and ball fault bearing dataset
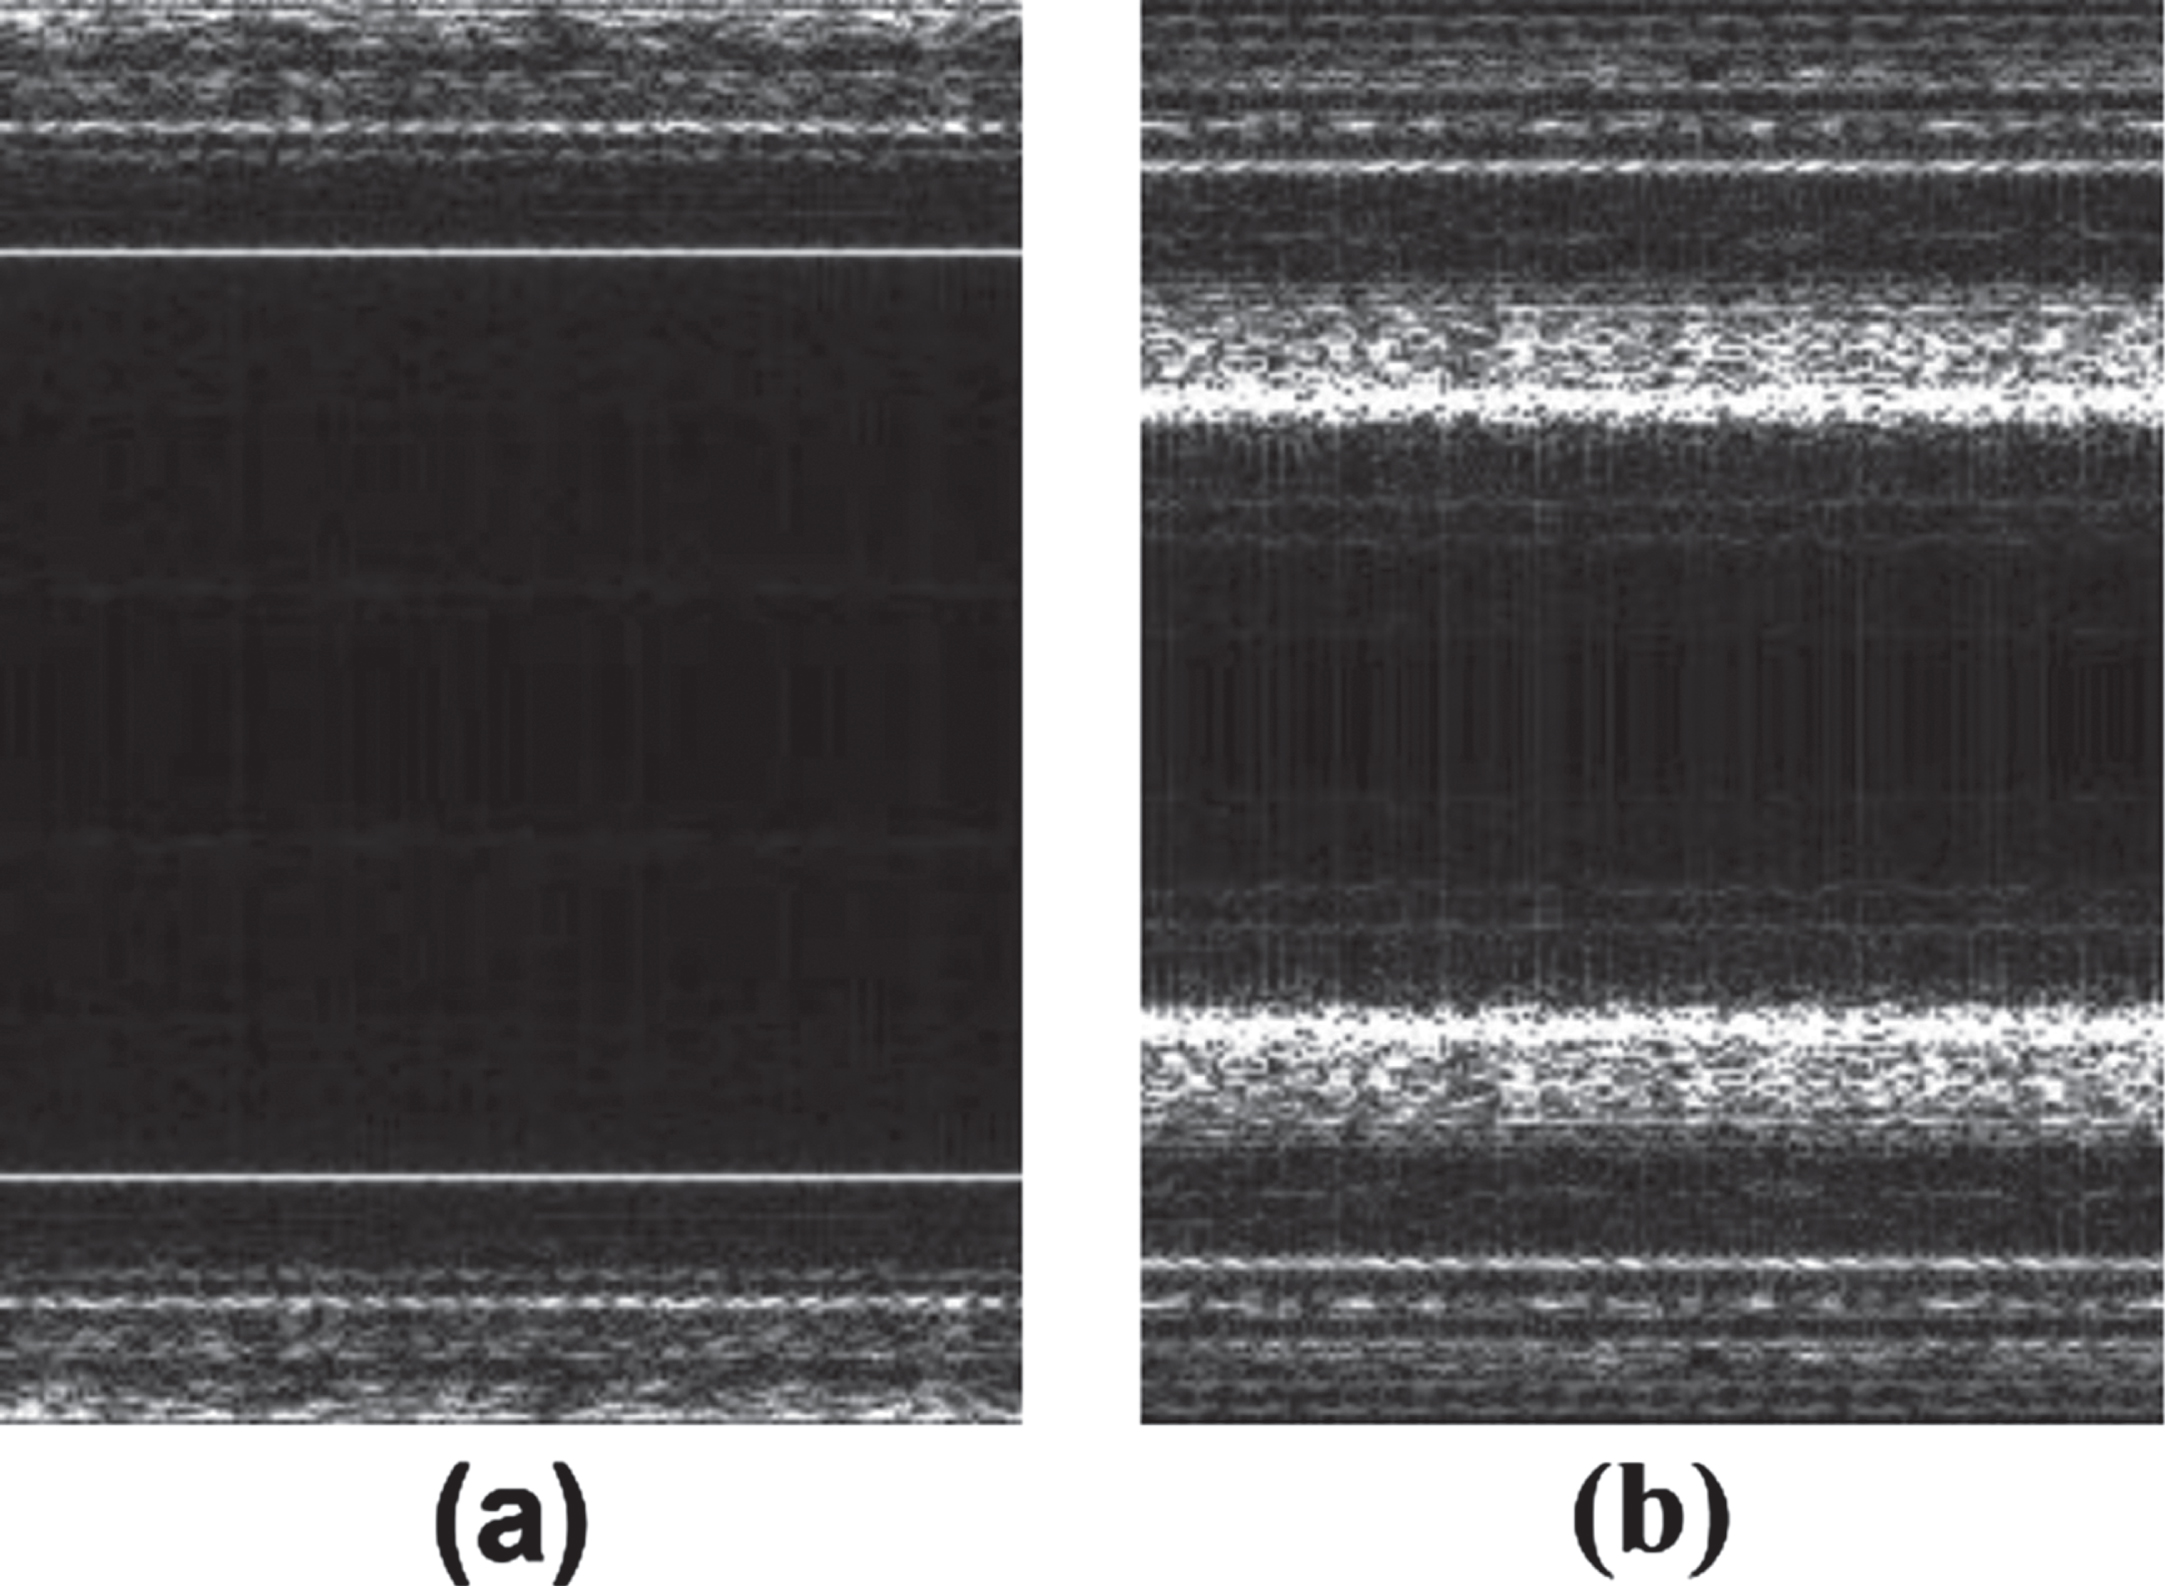
(a) STFT normal. (b) STFT fault.
As explained in section 3.1.1 case (ii), the original DE vibration signals of the bearing dataset are decomposed to M components using EMD and the first 4 IMF signals are considered and STFT is applied to every IMF signal and transformed to image data with N = 256, to get 4737 × 4 normal images and 1096 x 4 images corresponding to BA fault as shown in Table 2. A sample of normal and faulty spectrum images is given in Fig. 7 for all the 4 IMF’s. The columns of the image corresponds to frequency the image is carrying this column frequency information varying in x axis. These are images obtained for just one good sample and faulty sample and these images can be used in DCNN for further classification. Quick analysis reveals that frequency component distribution Fig. 7e for faulty signals is like a noisy pattern.
Configuration of normal and ball fault bearing dataset IMF(0-3)
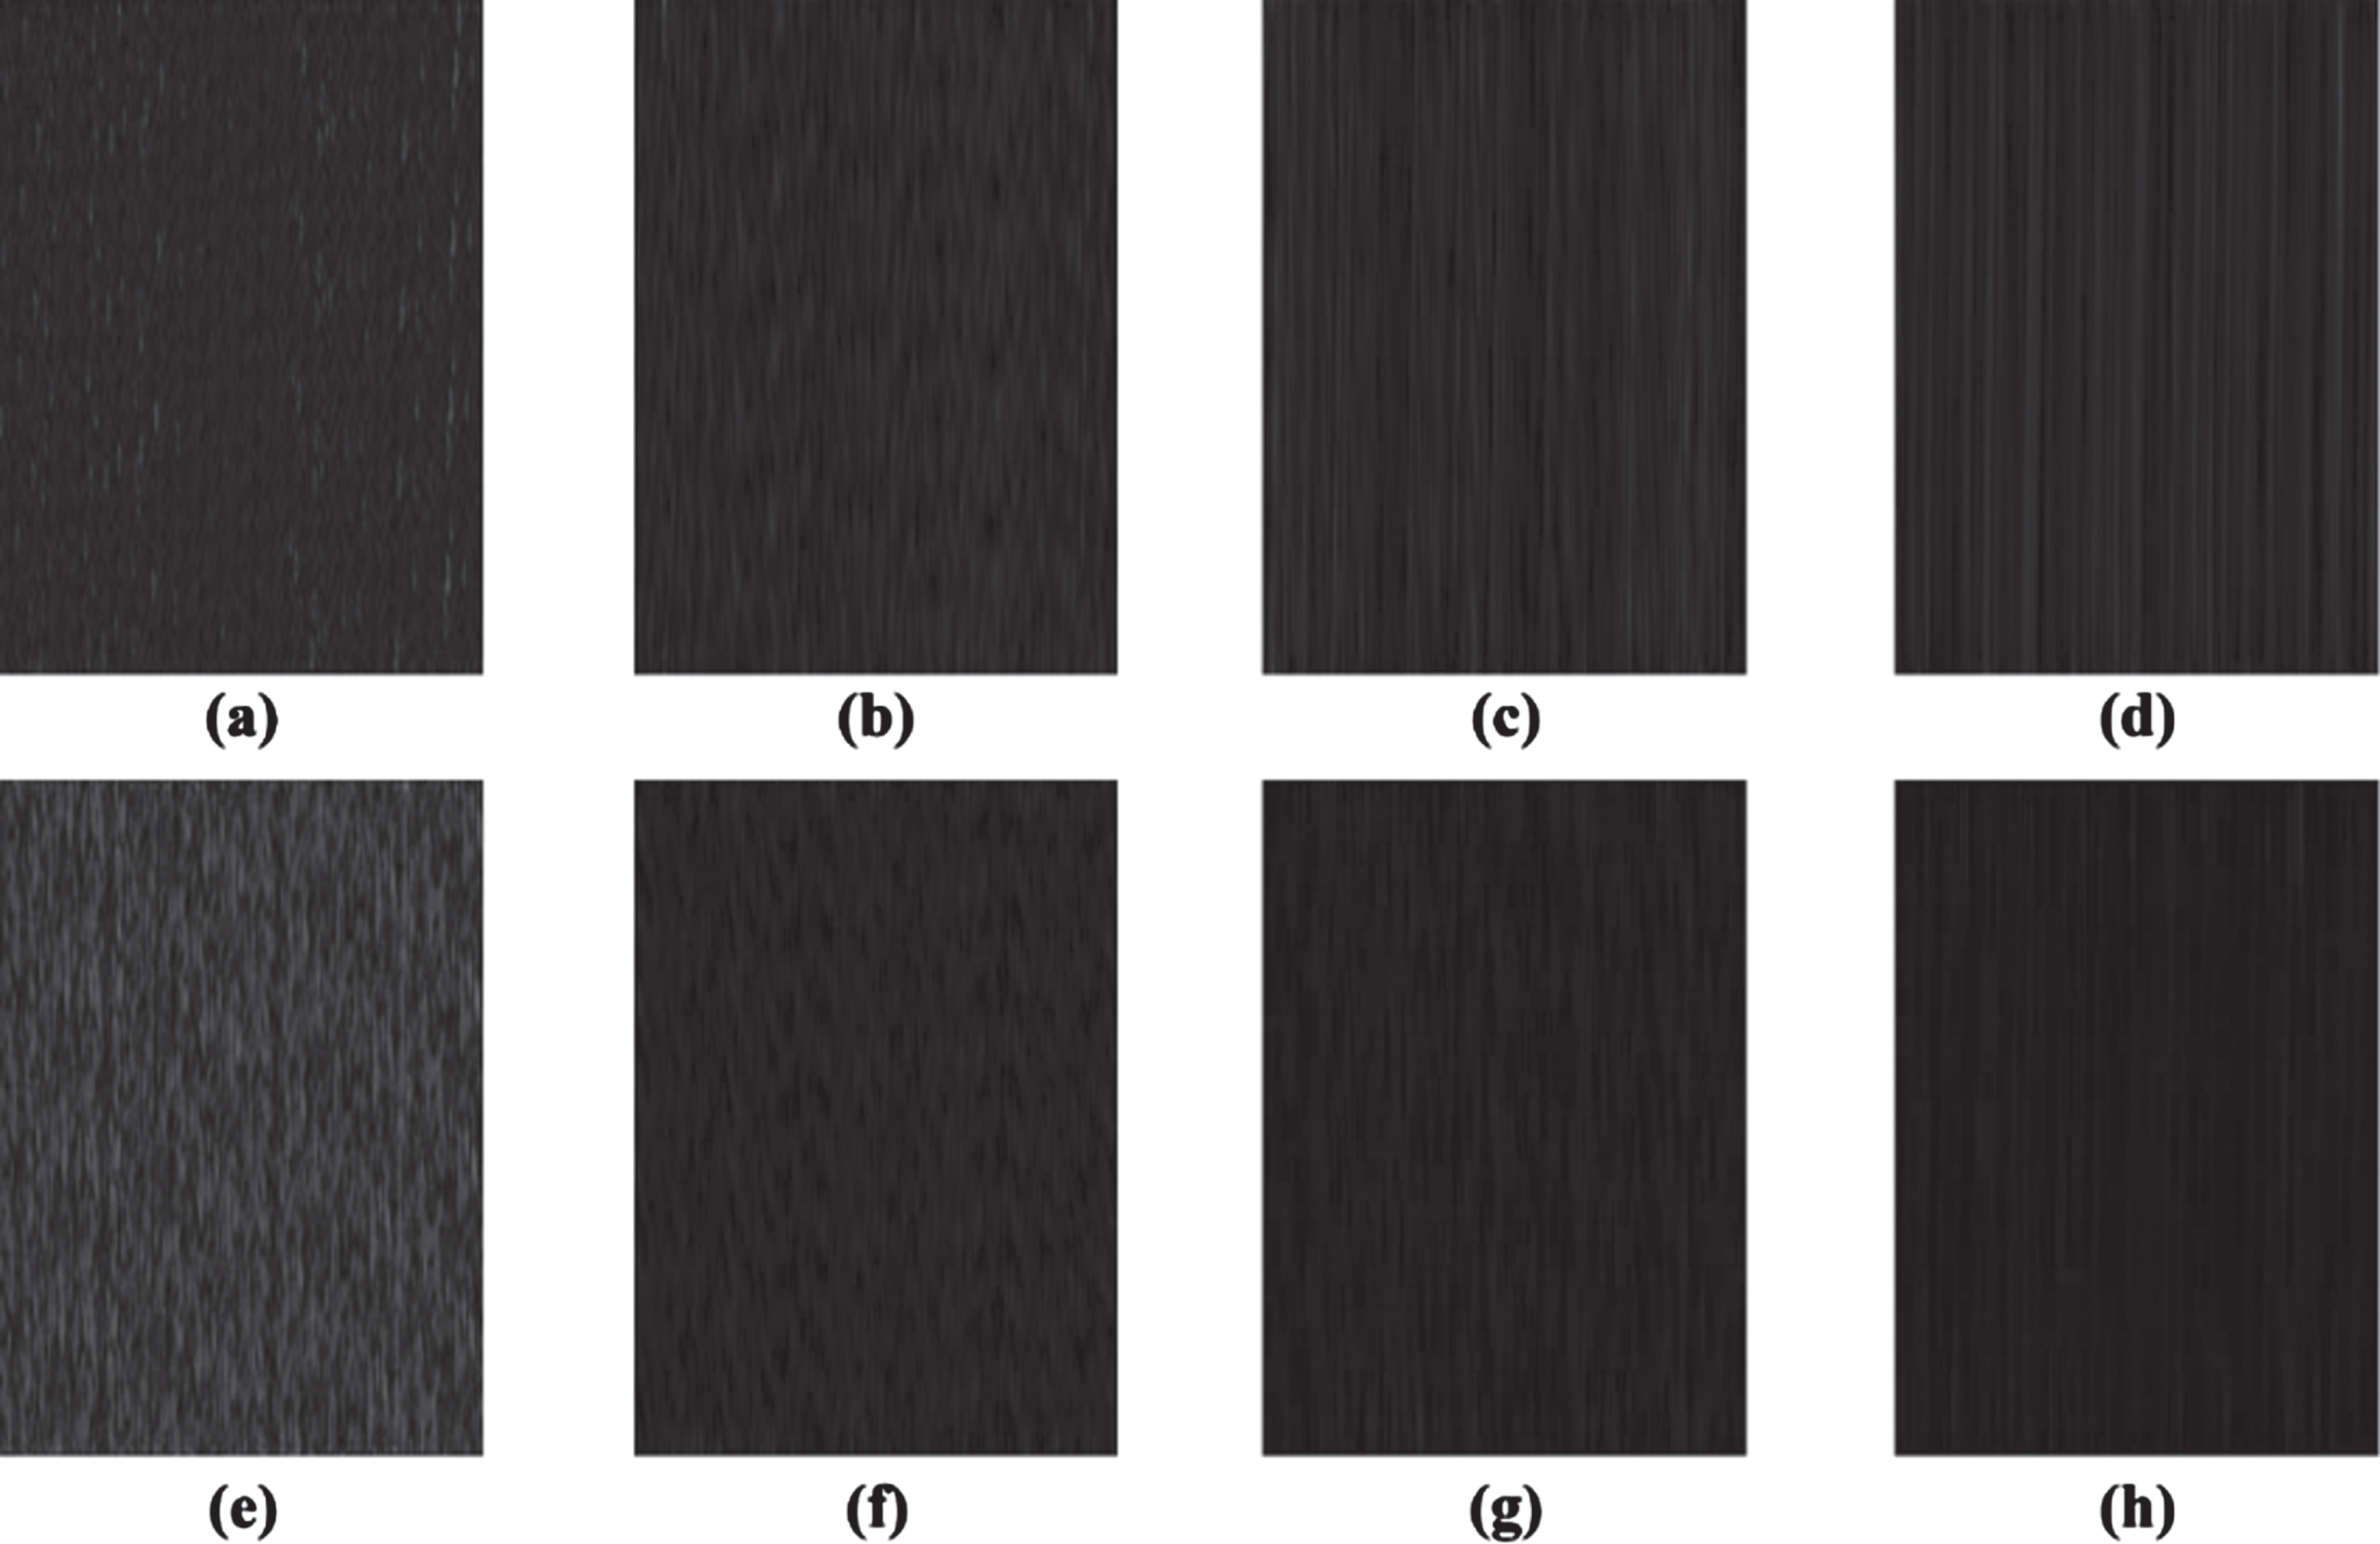
(a) STFT of IMF0 of normal bearing. (b) STFT of IMF1 of normal bearing. (c) STFT of IMF2 of normal bearing. (d) STFT of IMF3 of normal bearing. (e) STFT of IMF0 of fault bearing. (f) STFT of IMF1 of fault bearing. (g) STFT of IMF2 of fault bearing. (h) STFT of IMF3 of fault bearing.
Another dataset we consider to demonstrate the efficacy of the proposed method is milling data [34]. Milling data comprises of 1×167 struct array with fields: Case, run, VB, time, DOC, feed, material, smcAC, smcDC, vib_table, vib_spindle, AE_table, AE_spindle. This struct array corresponds to 167 recordings of the experiment done and in this, we use the vibration data vib-spindle for analysis. For every recording, the VB data represents the flank wear and tear involved in the tool at the end of the experiment. In our analysis, we considered two cases Normal and Fault. The data with less wear and tear corresponding to VB of range (0-2) are considered normal and data with high wear and tear corresponding to VB > 3 are considered Fault.
As explained in section 3.1.1 case (i), the original Milling vibration signals are transformed to image data with N = 256, to get 54 normal images and 70 fault images as shown in Table 3.
Configuration of normal and fault Milling dataset
Configuration of normal and fault Milling dataset
As explained in section 3.1.1 case (ii), the original DE vibration signals of the bearing dataset are decomposed to M components using EMD the first 4 intrinsic mode functional signals are considered, and STFT is applied to every component signal and transformed to image data with N = 256, to get 54 × 4 normal images and 70 × 4 images corresponding to BA fault as shown in Table 2.
In this paper, it is proposed to analyse the raw vibration data represented in the form of a spectrum image to determine the condition of the machine. This eliminates the need for a separate feature extraction process. Based on the fact that the frequency spectrum captured over time comprises the complete details of the signal of interest we proposed to use the spectrum images to learn the machine condition. In doing so a binary classification problem is assumed for vibration data samples obtained in two use cases. (i) bearing setup with two classes of signals normal and faulty (ii) milling process with two classes of signals normal those with less wear and tear of the tool and faulty those with more wear and tear. In this process, the first use case uses the CWRU data set, and it’s a quite straightforward problem as the data set contains normal and fault vibration signals. In the second use case, the problem is slightly complex as it is assumed that the samples with a wear and tear factor less than 2 as a normal class and those greater than 3 as a fault class. In this use case, both the normal and fault classes accommodate signals with a range of wear and tear factors which will make the classification process difficult and this dataset samples are highly non stationary. Further, to this, it is proposed to use two types of STFT-based spectrum image techniques (a) applying STFT for raw signals and (b) applying STFT for IMF of raw signals obtained using EMD. Recent work [21] demonstrates that EMD analysis of vibration signal is very promising to determine the machine condition and, in our proposed work, it is planned to demonstrate the merits of EMD-based spectrum imaging techniques. It is proposed to use the spectrum images obtained using (a) & (b) in machine learning problems to classify the samples as normal and fault for the use cases (i) & (ii). DCNN is a promising AI architecture that gives robust classification results for images as good as humans and in some places better than humans [23]. As the approach is an image-based classification approach DCNN suites well for the numerical demonstration. The convolutional neural network (CNN) is a feed-forward neural network that keeps the actual connectivity of neurons. It is performed on the basis of the nervous system of living creatures and now has implications in machine vision, recommender systems, and natural language processing. The values of the convolution operation are linked, giving them the ability to train.
CNN is a tool with a remarkable capacity to learn features in a robust and sensitive approach since they automatically obtain the properties of the images through convolutional filters. The three layers of the CNN architecture are convolutional layer, sub-sampling layer, and fully connected layer. In CNN, categorization is done in a single body removing the need for manual handling while extracting data features. The CNN model parameters that is used in this numerical demonstration are given in Table 5. The suggested deep CNN model is composed of three stages. Convolution, activation, and pooling layers are included in each stage, which represents a feature learning stage with various feature levels. The proposed deep CNN model contains two convolutional layers with 64,(3,3) and 128,(3,3) filters, respectively, as illustrated in Fig. 8. Additionally, two 2x2 pooling size max-pooling layers were utilised. To feed the input images into the CNN model, the input images are resized to 64x64. ReLU (Rectified Linear Units) activation function was used to add nonlinearity to each level, enabling CNN to train sophisticated models. Subsampling was used to introduce pooling layers, and the proposed model used max-pooling to reduce the number of extracted features and to minimise over fitting. The feature maps were flattened into a column vector after the three steps. A feed-forward neural network received the flattened output vector, and backpropagation was used during each training cycle. The suggested model was able to distinguish between the dominant and low-level features in texture images during training and classify them using a fully connected layer. One of the optimization techniques based on gradients was utilised to estimate the parameters of the suggested model. In order to obtain quicker convergence, the parameters were updated using the Adam optimizer.
CNN model parameters
CNN model parameters
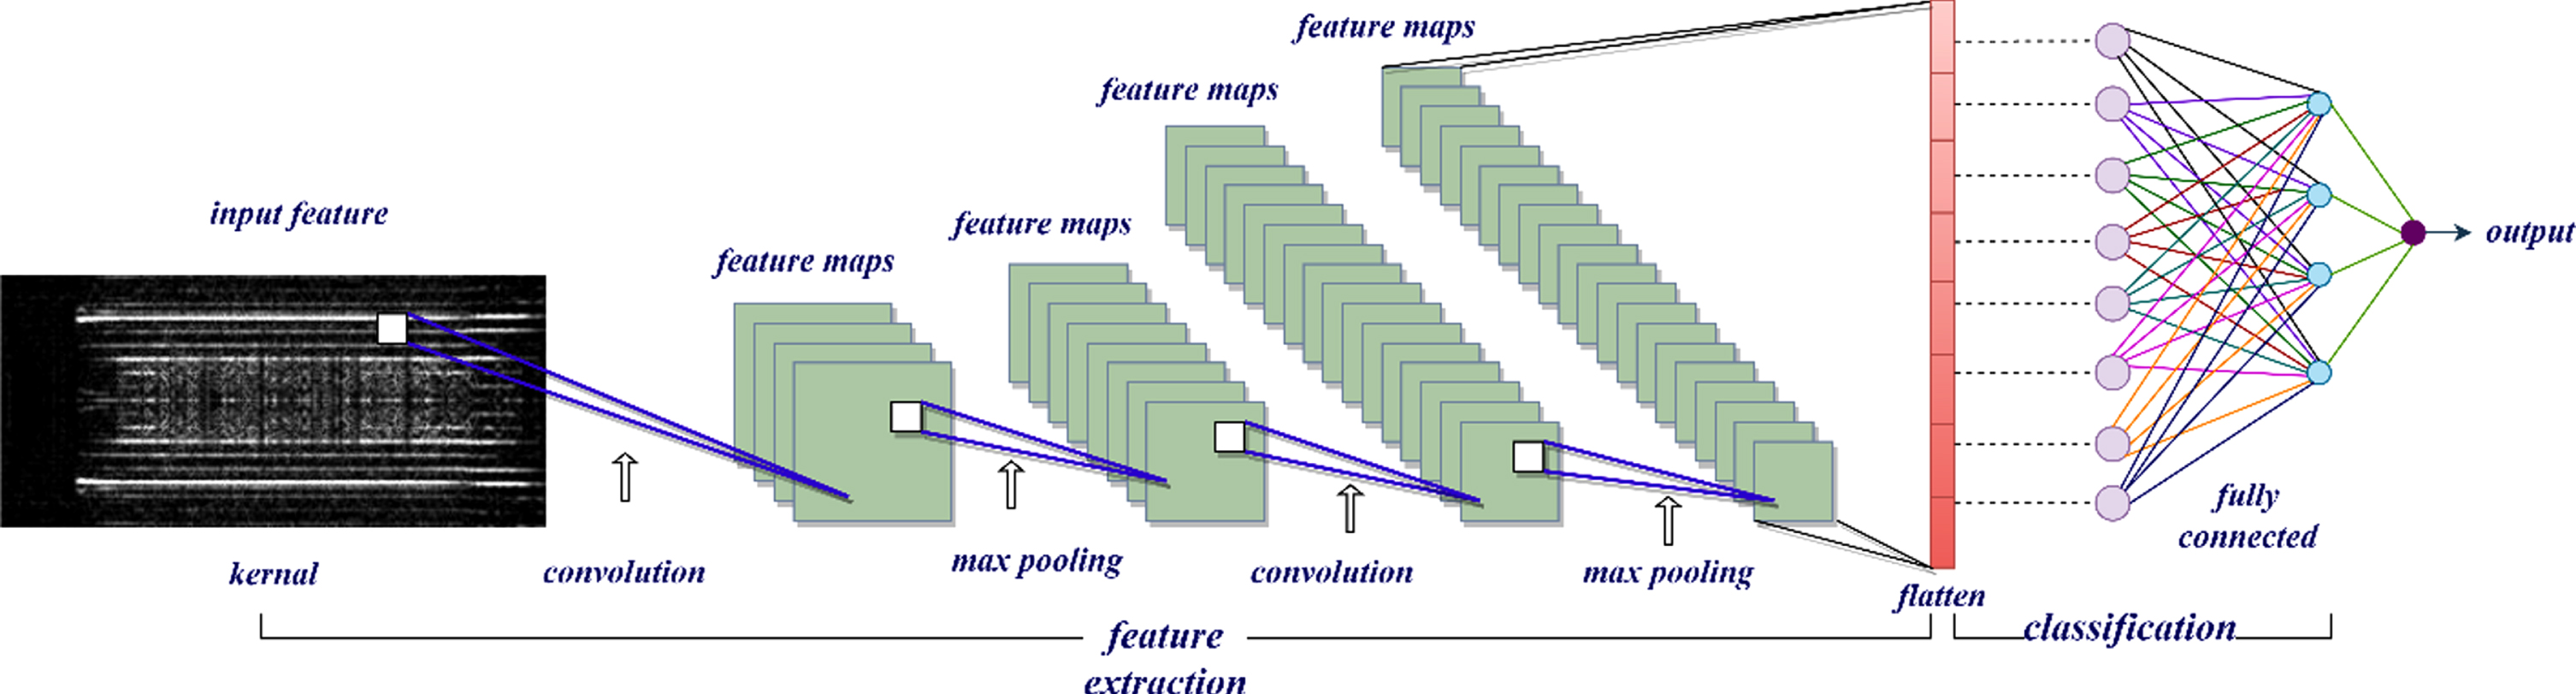
CNN architecture.
Principally using this CNN model, learning experiment was conducted for the following ball bearing use case with STFT done for original raw data using the image dataset Table 1. ball bearing use case with STFT done for EMD-IMF (0-3) using the image dataset in Table 2. milling use case with STFT done for original raw data using the image dataset Table 3. milling use case with STFT done for EMD-IMF (0-3) using the image dataset in Table 4.
The result of CNN model learning accuracies for (1) & (2) is tabulated in Table 6. For all the cases depicted in Table 6 the classification accuracy, and validation accuracy are plotted against epoch and & Fig. 9 shows the accuracy and validation accuracy of bearing dataset of both STFT & all IMF’S in a stack plot for better visualisation.
Configuration of normal and fault Milling dataset IMF(0-3)
Model accuracies for CNN classification of normal & fault for bearing dataset
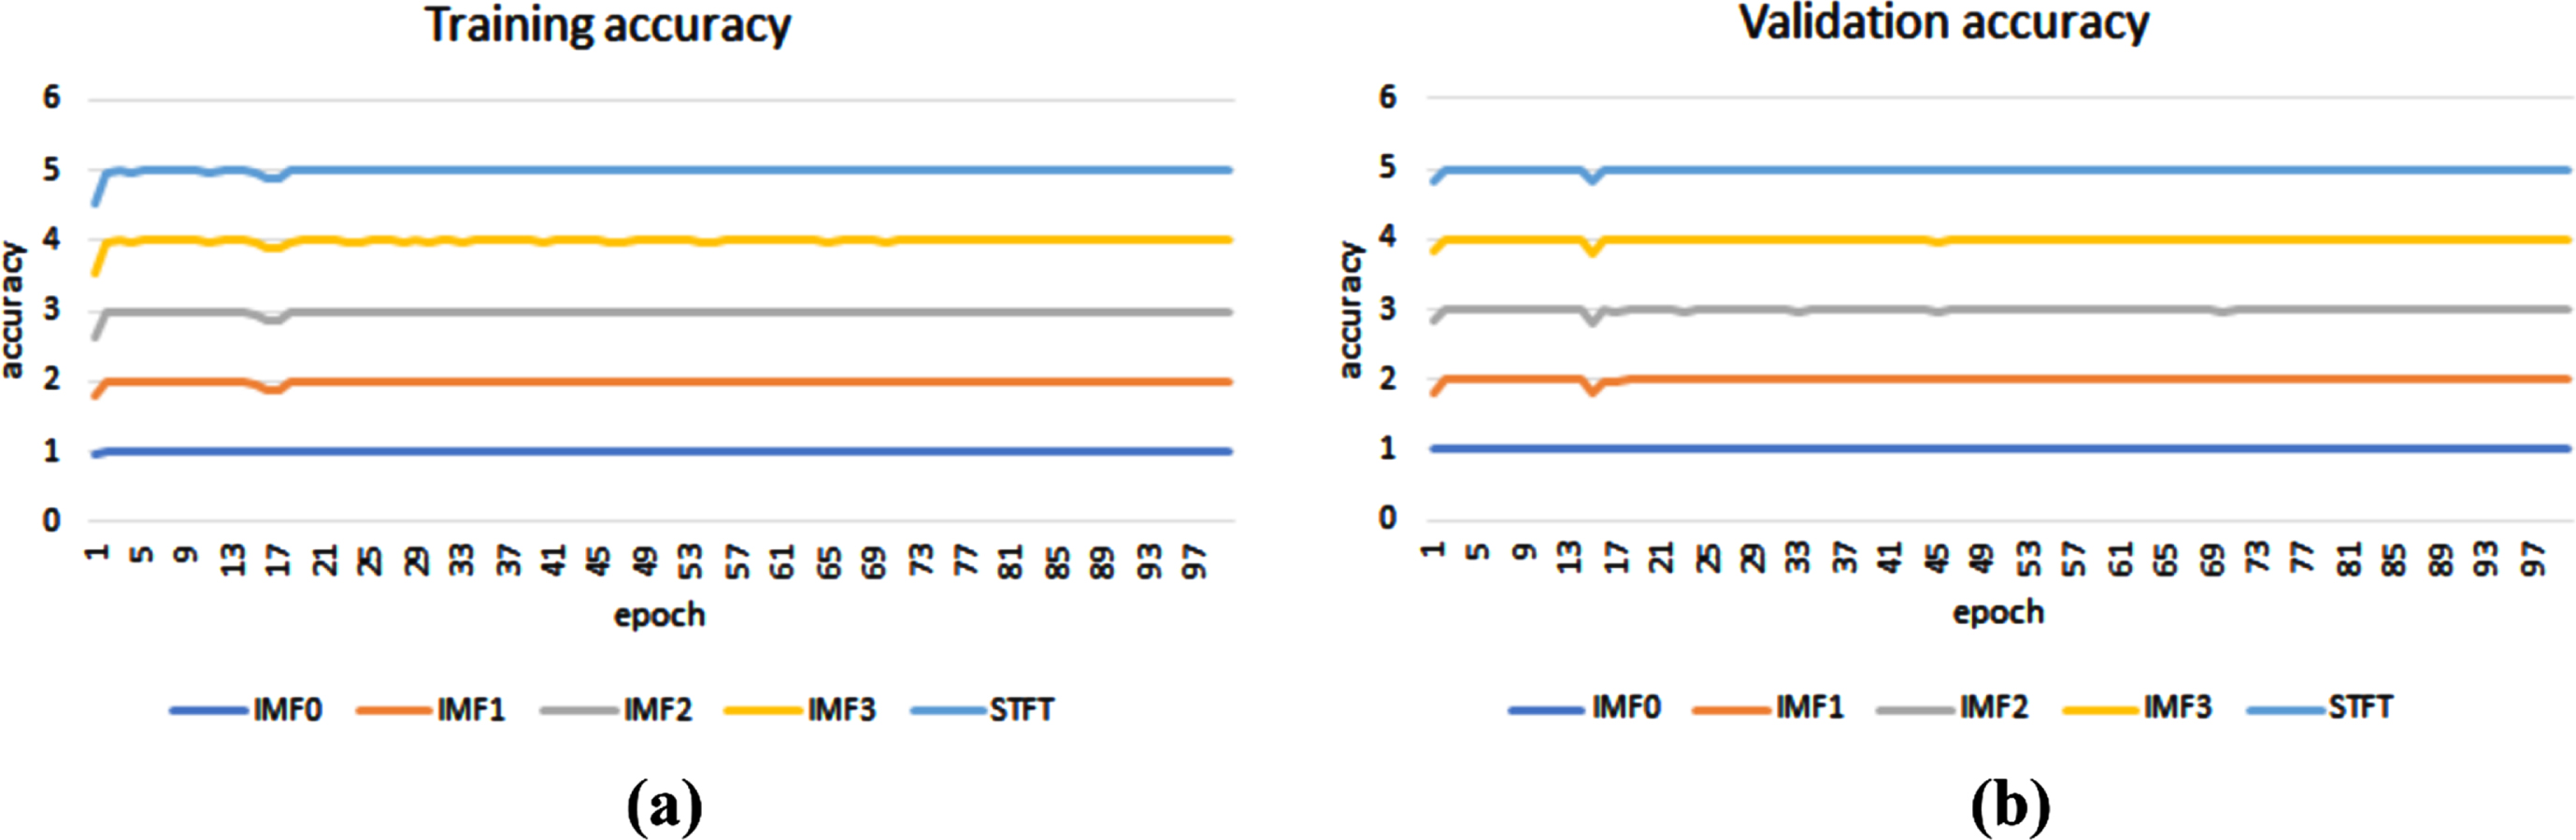
(a) Consolidated stack plot of model accuracy with respect to epochs for bearing dataset using STFT spectrum of IMF0, IMF1, IMF2, IMF3 and the STFT spectrum of raw data (a) Training accuracy (b)Validation accuracy.
The result of CNN learning accuracies for (3) & (4) is tabulated in Table 7. For all the cases depicted in Table 7 the classification accuracy, validation accuracy, classification loss & validation loss are plotted against epoch and Figs. 10 & 11 shows the accuracy, validation accuracy, training loss and validation loss of milling dataset of both STFT & all IMF’S in a stack plot for better visualisation.
Model accuracies for CNN classification of milling dataset
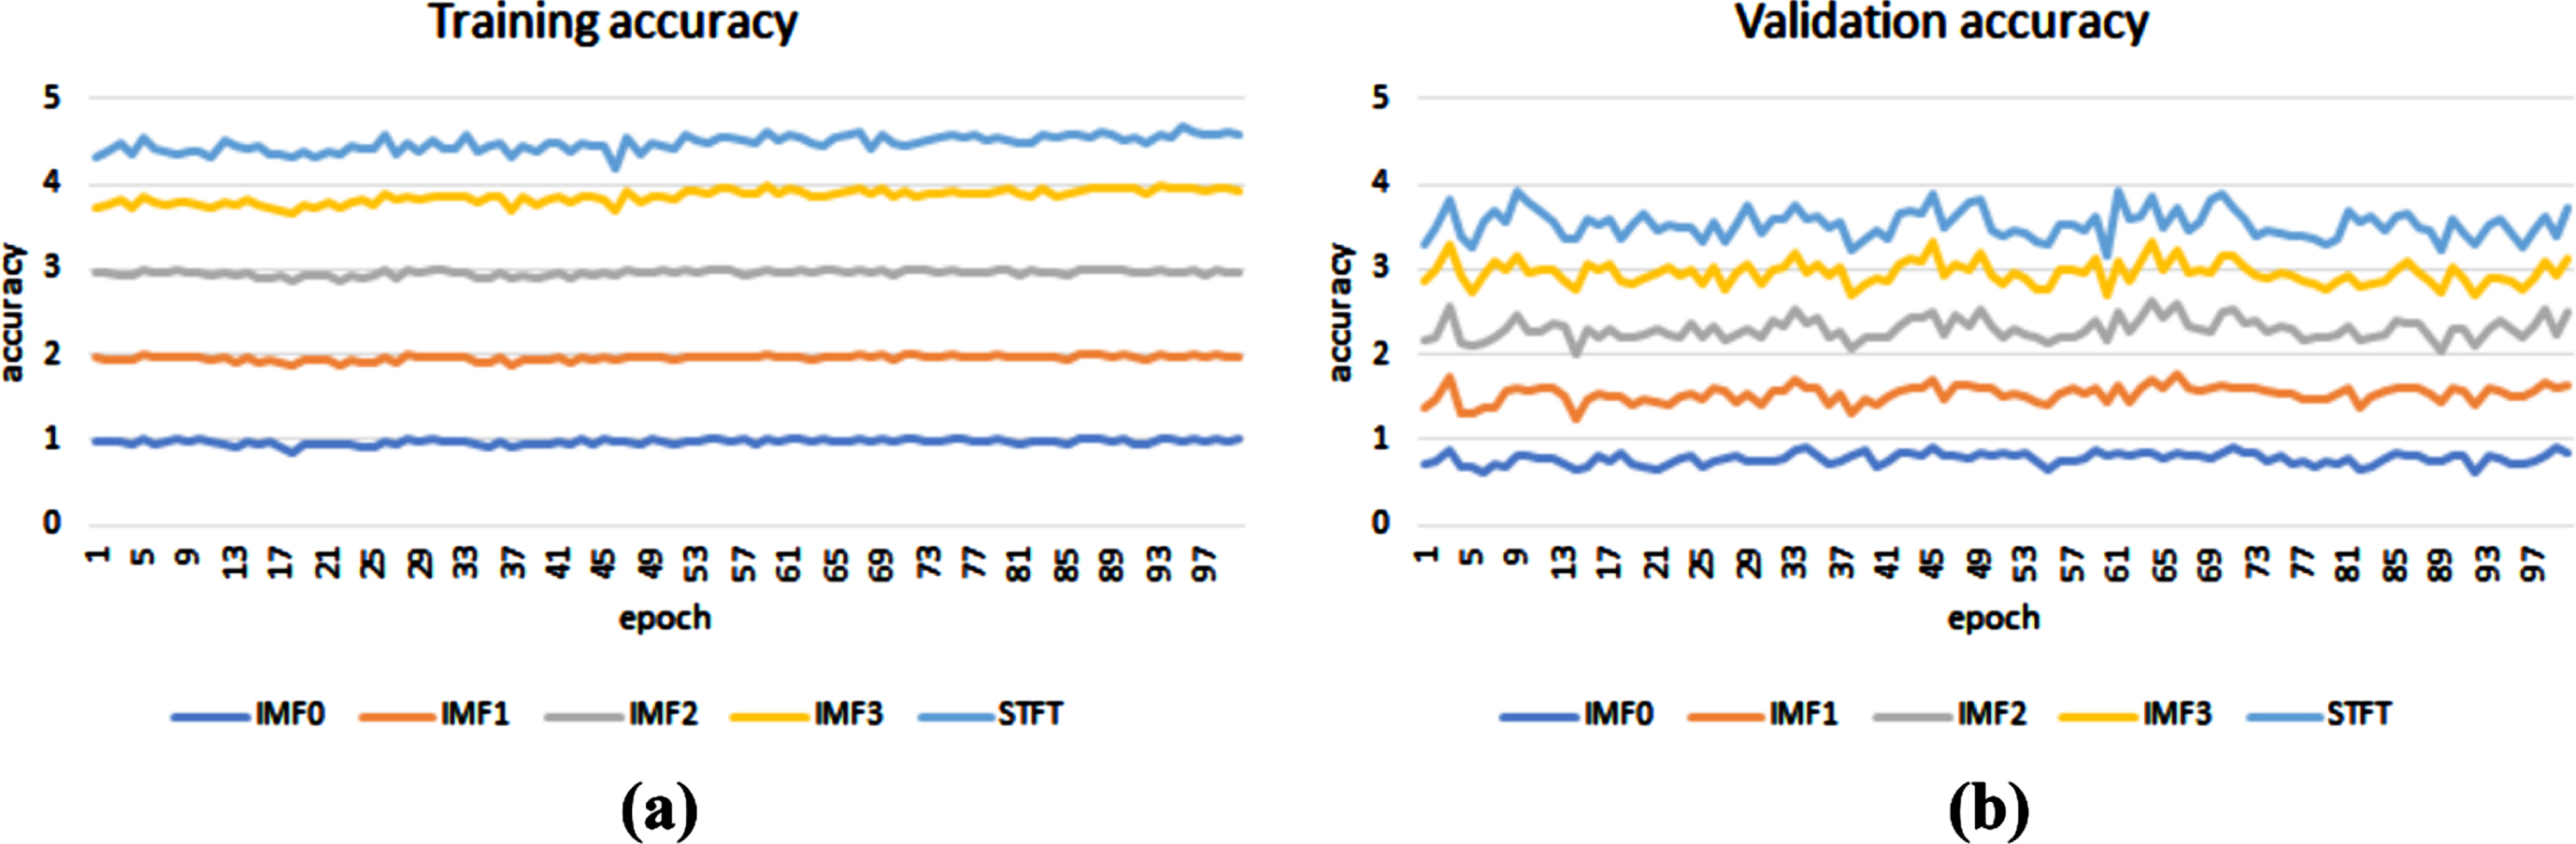
Model accuracy & validation-accuracy with respect to epochs using the STFT spectrum of raw data, STFT spectrum of IMF0, IMF1, IMF2, IMF3 of milling dataset.
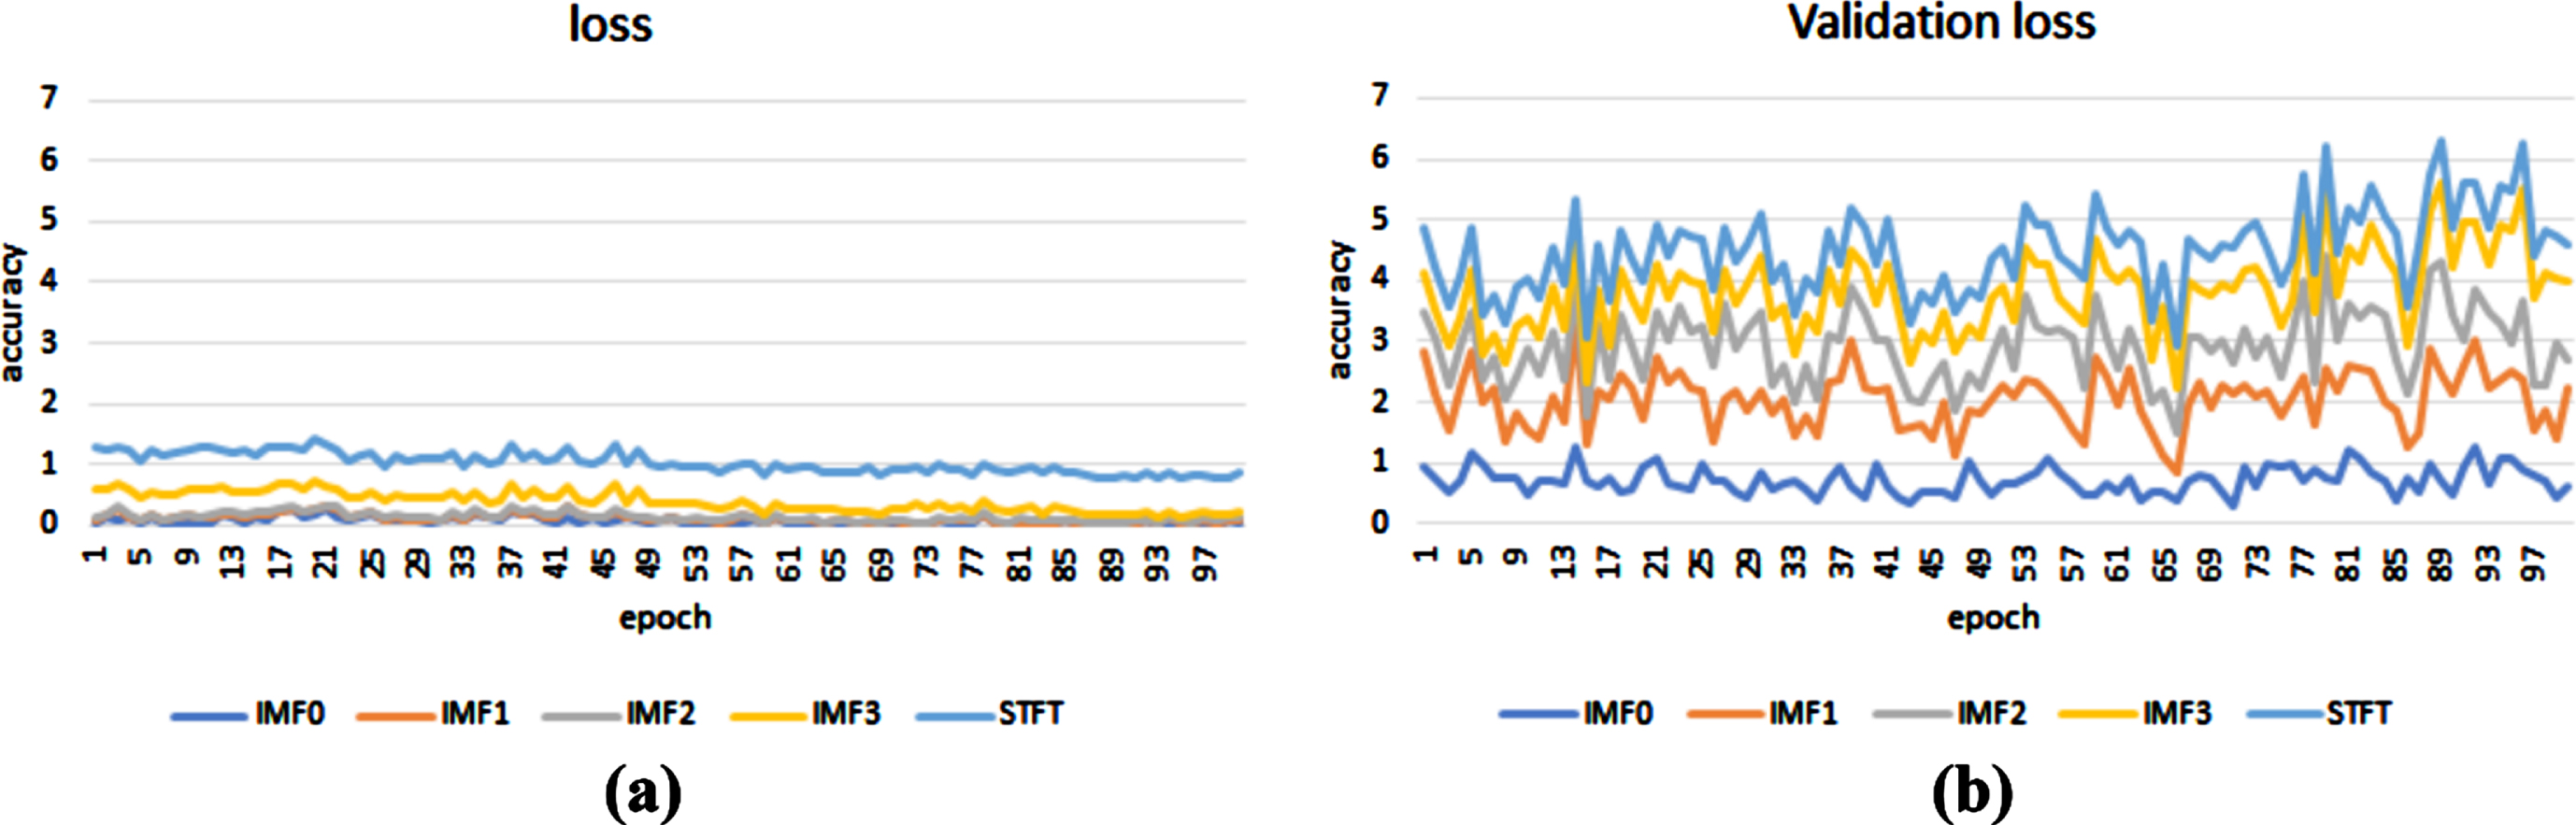
Model loss & validation-loss with respect to epochs using the STFT spectrum of raw data, STFT spectrum of IMF0, IMF1, IMF2, IMF3 of milling dataset.
So, for the numerical experiment conducted is to build DCNN for classification of binary classes and here the inference from the results obtained is discussed. The multiclass extension of the problem is also addressed for bearing dataset and the performance of the proposed method is compared with other state of the art methods.
Inference from the numerical experiments for binary classification
By observing the classification accuracy depicted in Table 6 that corresponds to the bearing dataset and Fig. 9, it can be inferred that it’s very promising for both the cases of spectrum formation. The classification and the validation accuracy are found to be 100% when STFT is applied to the original signal and also for the case of STFT applied to EMD_IMFs. This achievement of 100% accuracy without any feature extraction stage is achieved by DCNN in which the convolution layer functions as a feature extractor. The stack plot given in Fig. 9 shows that the results obtained using EMD- IMF0 is consistently good through all epochs but overall, all the methods have similar performances. As both STFT on the original signal and EMD_IMFs are performing similarly, the experiment using bearing dataset does not bring out the merits of the EMD application.
The accuracy of CWRU bearing fault diagnosis by different classification algorithms
The accuracy of CWRU bearing fault diagnosis by different classification algorithms
The outcome of the experiment conducted for the milling data set can be observed in Table 7 and in Figs. 10-11. In this case the maximum classification and validation accuracy is achieved for the case STFT applied for IMF0 of EMD. It can be inferred that the model accuracy for the case of STFT on original signal is 64% which is quite low and it’s improved to 100% for STFT applied to IMF0 of EMD. This brings out the merits of EMD in highlighting the defective portion of the vibration signal. To substantiate the inference, the conventional performance metrics calculation of all methods used for milling dataset is performed and a simple nonparametric statistical analysis [10] for the numerical experiment on milling dataset is done and tabulated in Tables 8 & 9. In Table 8, the F1 score of method using EMD-IMF0 is about 0.8933 which is in very higher side than that of the method using STFT of raw data whose score is 0.7486. This brings out that the EMD-IMF0 is better than direct method in terms of sensitivity and selectivity. The total number of test samples used are 42 and assuming binomial distribution, as per the sign test thumb rule, [10] minimum of
Performance metrics of CNN classification of milling dataset using n = 42 samples
Statistical performance analysis of CNN classification of milling dataset for 50 trials
The result and discussion made in 5.1, clearly shows that using the spectrum images obtained by STFT on EMD-IMF0 in the DCNN gives a robust result for a binary classification problem. This method is extended for a multiclass classification problem and the class confusion matrix is analysed. As we explained in 3.1.2 in case (ii) IMF0 of bearing data are taken for 10 different faults as illustrated in the dataset description [33] and tabulated in Table 10. After training and testing the DCNN model we obtained a model accuracy of 100%. The classification of different faults which is been predicted by the model is shown in Fig. 12 as a confusion matrix which is perfectly a diagonal matrix. This shows that the method of using the spectrum of EMD intrinsic function directly with DCNN results promising model accuracies without a need for feature extracting stage.
Configuration of multi class bearing dataset using IMF0
Configuration of multi class bearing dataset using IMF0
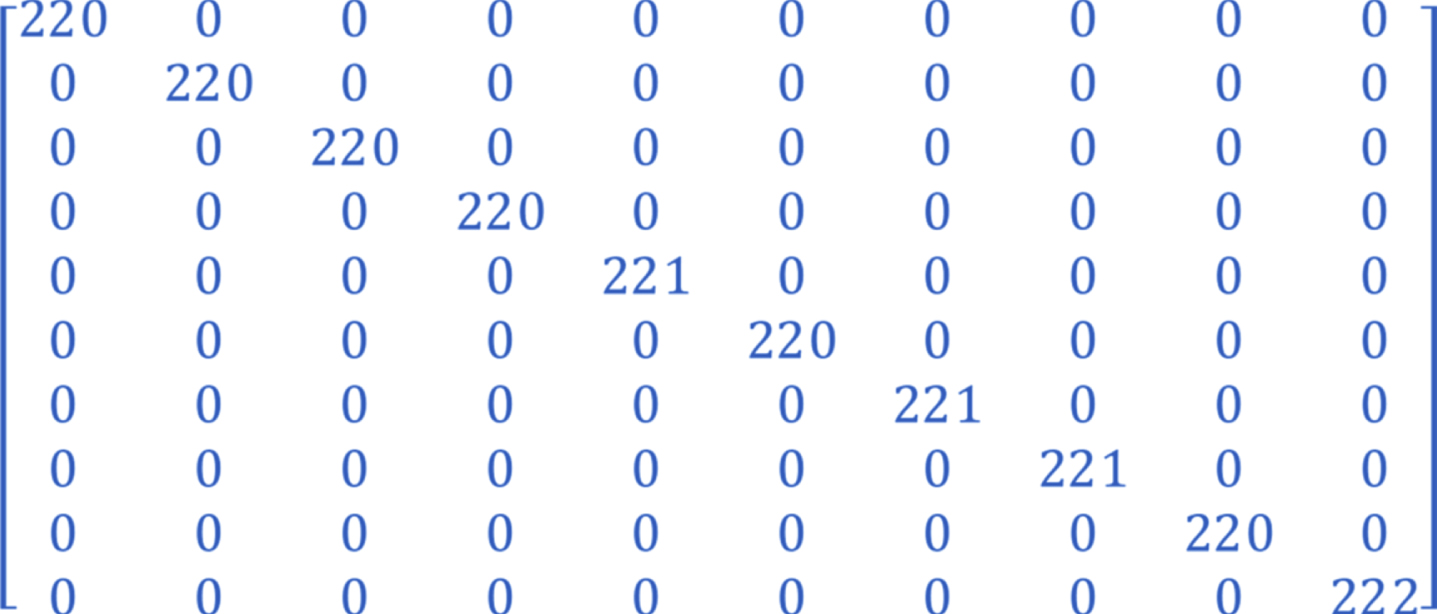
Confusion matrix of validation of bearing dataset.
enlargethispage 2pt In this work, machinery condition monitoring is demonstrated by using vibrational analysis with help of machine learning algorithms. Instead of extracting signal parameters and features from the vibrational signal, a spectrum-based image representation is proposed to use with DCNN in which the convolution layer is used for automatic feature extraction and classifying the input as good or faulty. Two types of spectrum representations are proposed, one is based on the STFT of the original signal, and the other one is based on the STFT of IMF signals obtained using EMD. An Adam optimizer-based CNN is used for training and classification and validation accuracies are studied. The numerical experiments are conducted on two different datasets. In the numerical experiment on CWRU, a ball-bearing dataset that has clearly demarcated normal and faulty signals, it is shown that both spectrum-based methods perform very well with 100% model accuracies. In another experiment based on the milling dataset in which we assume the vibration signals corresponding to less wear and tear as a good signal and with more wear and tear as a faulty signal, it’s shown that EMD-based STFT analysis performs better with 100% training accuracy. F1 scores of both the methods reveal that second type of EMD based representation is better than first type. Statistical analysis is also done to reassure that EMD based method is better in consistence. The numerical experiments demonstrate that the spectrum image representation by applying EMD performs very well with DCNN-based signal classification which also eliminates the need for separate feature extraction feature selection and dimension reduction. The improvement of classification accuracy with respect to epochs is studied and reported. This imaging method is extended for a multiclass fault classification using CWRU bearing dataset in which we considered 10 different fault classes and the confusion matrix obtained is purely diagonal implying 100% validation accuracy for all the 10 classes. The performance of the proposed method is compared with state of the art methods of same kind those used CWRU dataset and it is shown that the proposed method using EMD-IMF spectrums is better than other similar methods. The merits of EMD is well known but it is first time to use the spectrum images of EMD-IMFs with DCNN to classify machine faults which is the novelty of this work. One of the limitation in the proposed work is that, the joint learning of the individual IMFs of EMD is not performed which can be considered for futurework.