
Abstract
Stroke is a major reason for disability and mortality in most of the developing nations. Early detection of stroke is highly significant in bio-medical research. Research illustrates that signs of stroke are reflected in the eye and may be analyzed from fundus images. A custom dataset of fundus images has been compiled for formulating an automated stroke detection algorithm. In this paper, a comparative study of hand-crafted texture features and convolutional neural network (CNN) has been recommended for stroke diagnosis. The custom CNN model has also been compared with five pre-trained models from ImageNet. Experimental results reveal that the recommended custom CNN model gives the best performance by achieving an accuracy of 95.8 %.
Introduction
Stroke has been delineated as one of the most overwhelming of all neurological ailments. Developing countries account for 85.5% of world-wide stroke fatality and are troubled with higher stroke-linked disability [1]. A co-agulation or breakage in the cerebral artery can disturb blood supply to brain. Stroke due to a blood vessel clot is ischemic stroke and due to rupture of a cerebral blood vessel is hemorrhagic stroke [2]. The abrupt rise in blood flow due to hypertension or clogging of blood vessels for a few moments can lead to death of brain cells. Timely diagnosis of stroke is still an encounter and is extremely significant in biomedical research.
Biomarkers play an important role in the prediction of several cerebrovascular disorders like stroke. Retina can be considered as a biomarker, as any deviation in the cerebral map will be reflected in the eye [3]. Retinal vasculature share similar anatomical, physiological and embryological characteristics to that of brain [4]. Moreover, retinal fundus imaging is a non-invasive, quick, and high- resolution method which gives a two-dimensional depiction of the eye [5].
Artery contraction and vein expansion in retina boosts the risk of stroke. Morphological variations in blood vessels like diverging pattern and thickness, existence of lesions, bifurcating angle and coefficient are some of the major defects in retina linked with stroke [6, 7]. Since the incidence of clinical disease disturbs the homogeneous retinal texture, clinicians count on texture feature to perceive the anomalies in an image. So, texture assessment can be applied for the automated diagnosis of stroke from these images [8].
In the recommended work, an endeavour has been made to diagnose stroke from retinal images using CNN. A custom dataset and a custom model have been made for training and testing the suggested scheme. A comparison of hand-crafted features with CNN for stroke diagnosis has been realized in this work.
The paper is outlined into six sections as follows. Section 2 features the associated work in this area. Section 3 details the proposed methodology for stroke prognosis. Experimental setup and the dataset are explained in section 4 and section 5 discuss the results. A comparative study between hand-crafted features and CNN for stroke diagnosis has been clearly illustrated. Concluding remarks and scope for prospective work are explained in section 6.
Literature review
Extensive volume of research has been made in the area of eye imaging. Fundus photography remains a major imaging tool which permits non-invasive monitoring of disease advancement [9, 10] over time and requires no dilation. Hence, systematic ophthalmic analysis is noteworthy for the exposure of retinal blood vessel anomalies to find out people at high-risk for early and in-time treatments.
Works by Patton et al. [7] reveals anatomical and physiological link between eye and cerebrum. De Silva et al. [11] demonstrated that patients who experience arterio venous nicking and arteriolar tapering were more prone to stroke. Works by McGeechan et al. [12] revealed that venular thickness plays a key role in stroke prediction while arteriolar width was not associated with stroke. Sparser micro retinal vasculature, as illustrated by Ong et al. [13] is an important characteristic of ischemic stroke victims. Cheung et al. [14] showed that the increase in the intricacy of retinal microvasculature was also linked with stroke.
Image processing with advanced machine learning algorithms enable the recognition and classification of normal and pathological retinal images [15] by analysing various features. An extensive amount of work has been made in textural feature extraction [16–19] and a concatenation of textural and structural features [20]. Literature survey summarizes the importance of Gabor filters for feature extraction in the last few years [21]. Local Binary Pattern (LBP) introduced by Ojala describes the local spatial configuration of an image [22]. Sandra Morales et al. [23] explored the textural features of fundus images to distinguish between pathological and healthy ones. HoG (Histogram of Oriented Gradients) descriptor [24, 25] can capture delicate details present in images.
Most of the stroke prediction work has been implemented using various machine learning methodologies. But these traditional models often fail to simulate the intricacy of medical domains. Numerous applications of deep learning models have provided efficient solution for various computer vision tasks and in medical image analysis. Liang et al. [26] recommended the relevant application of deep network towards data modelling from health information systems. Another work reported stroke prediction using deep learning applied on a cardiac database [27]. This work is based on the fact that atrial fibrillation is one of the substantial risk factors of stroke. The influence of other risk factors has not been reflected in this work. CNN based network to detect cardiovascular risk factors used a pre trained model to differentiate certain features from retinal images such as age, sex, blood pressure and tobacco usage [28]. Unfortunately, this study achieved an accuracy of only 71 %.
Since prediction of stroke using deep learning methods are possibly noteworthy and beneficial, we decided to work on stroke diagnosis from retinal fundus images using CNN. In brief, the major contributions of this paper include development of a CNN based framework for the automatic prognosis of stroke and comparing the performance of our model with conventional multi texture approach. Performance of five different pre-trained models trained on Imagenet have also been compared with the proposed model. Number of trainable parameters are less in the suggested CNN model when compared with other pre-trained models. To the best of our understanding, no other works have reported stroke detection from retinal fundus images using CNN.
Methodology
An automated stroke prognosis system from fundus images has been recommended in this research work. Acquisition of fundus images is done by a Zeiss fundus camera, having a field-of-view of 30 degrees and input images of dimension 2336×3504 pixels. To classify these images into stroke/normal, we experimented with hand-crafted features and CNN features. This model has been developed using Keras with Tensor-Flow backend in Python. A sample retinal image of a stroke patient and a normal person has been shown in Fig. 1.
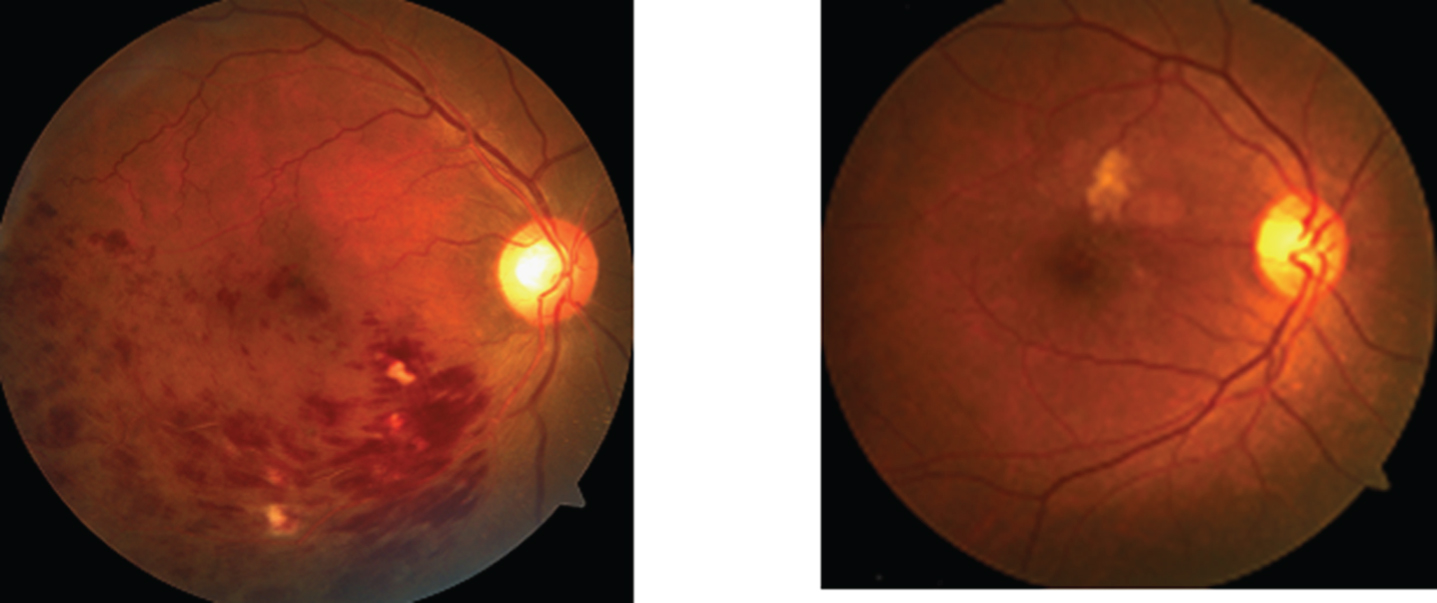
(a) Retinal image- Stroke, (b) Retinal image- Normal.
After removing the unwanted borders of the converted grayscale image, it has been down sampled to a size of 64×64 pixels. A feature vector has been extracted after applying three different descriptors, Gabor filters, Histogram of Oriented Gradients (HoG) and Local Binary Patterns (LBP). Texture extraction from retinal images after selecting region of interest has been implemented by the same authors [8]. HoG feature vector provides the shape features, while the other two offers texture features. An innovative combination of shape and texture features for stroke detection has been proposed in this work.
Gabor filters
Multi-resolution description of image texture assessment has been made possible by Gabor filters. Two-dimensional Gabor can decompose an image into components associated with various scales and orientations, thus capturing spatial localization, orientation selectivity and spatial frequency. A two-dimensional Gabor filter consists of a complex exponential centered at a specific frequency and modulated by a Gaussian envelope given by Equation (1).
Local Binary Pattern is intended for illustrating local spatial structure of an image which was familiarized by Timo Ojala [22]. The binary number computed based on the difference in intensities is transformed into decimal form to obtain the original LBP label. Texture descriptor was obtained by combining the histogram of all the labels.
LBP is defined by Equation (2)
v n : Pixel value of neighbour
v c : Value of middle pixel
s: Thresholding function
By implementing HoG descriptors, the shape and appearance of an image can be analysed by the distribution of intensity derivatives. The major steps in HoG include gradient computation, block normalization and HoG feature vector computation. The final HoG feature vector will be the concatenation of all the 36×1 vectors [29]. The feature descriptor attained by combining Gabor, LBP and HoG descriptors can provide information about shape and texture. Final stage is classification, which has been implemented using Naïve Bayes classifier accessible in data mining package WEKA [30].
Since a hand-crafted feature-based classifier fails in case of camera parameter variations, a CNN based system has been proposed for stroke prognosis.
Convolutional neural network
Deep learning methods like CNN has produced striking results in medical imaging and in the detection of various pathologies. During the training phase of CNN, both feature extraction and classification are learned together in an end-to-end model, eliminating the need of human intervention and previous knowledge. Figure 2 shows the workflow diagram of the proposed system.
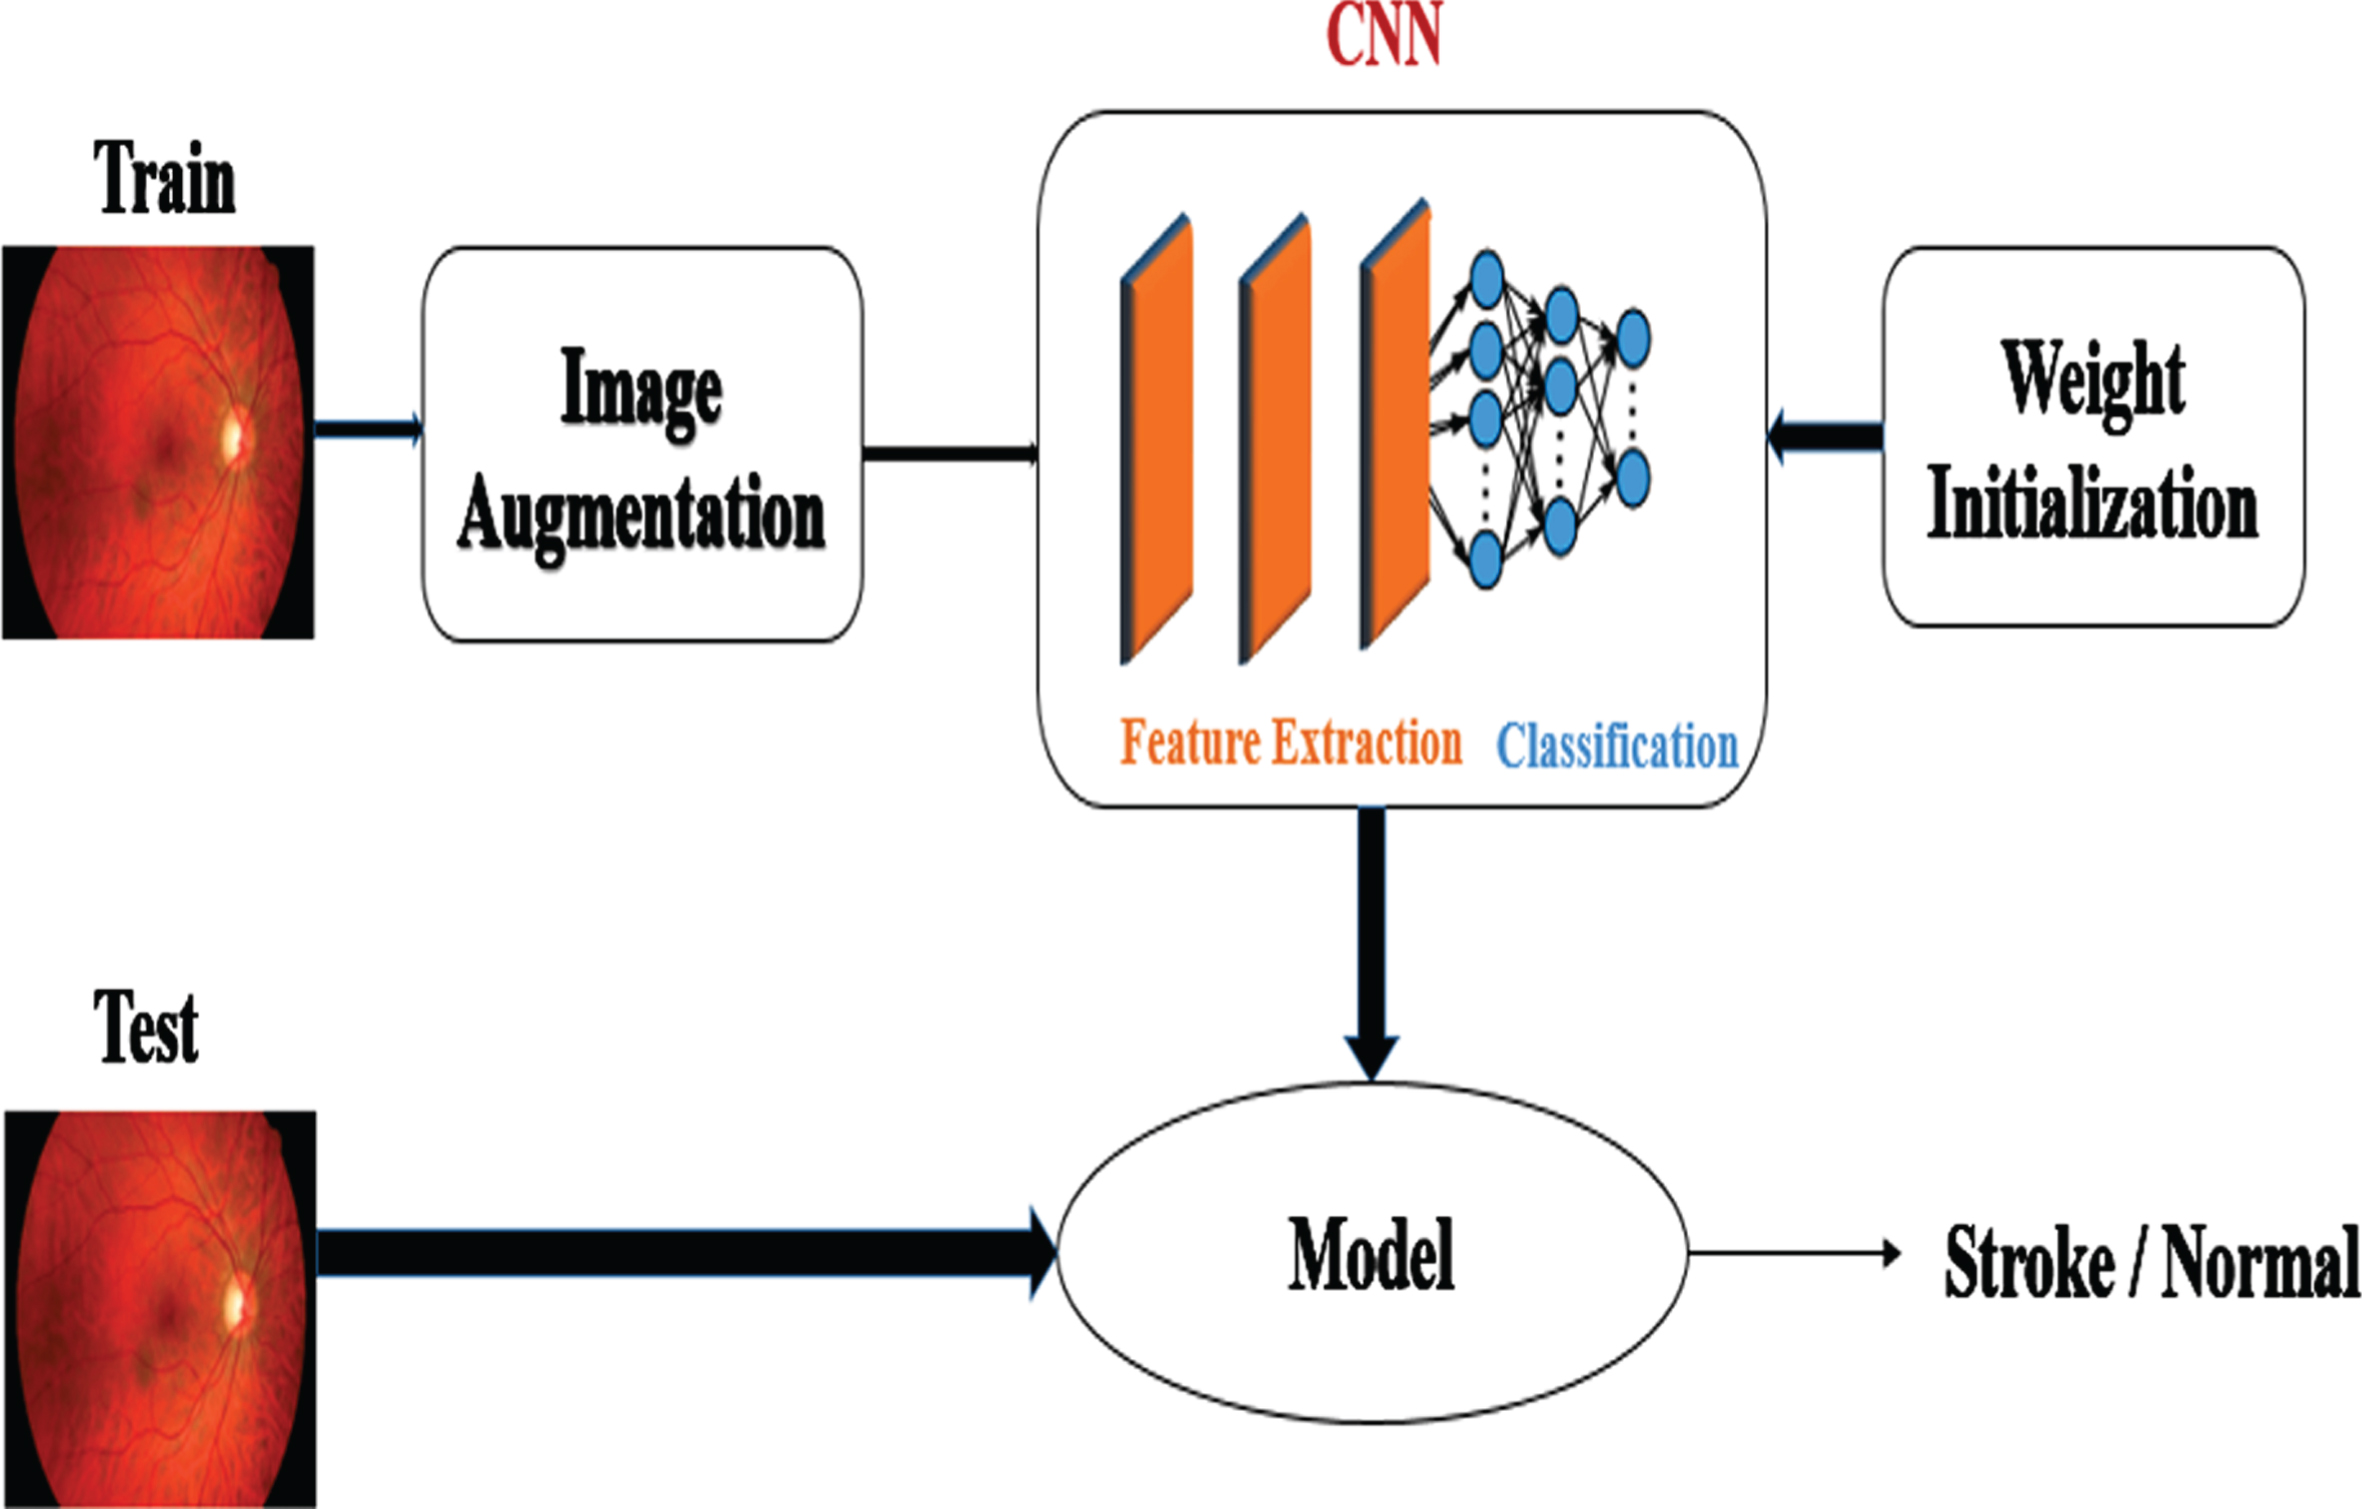
Workflow diagram of the proposed approach.
Since CNN is translational and viewpoint invariant, data augmentation methods like flipping, rotation, etc. has been applied to enhance the number of images. The minimal image size of this dataset that provided the finest performance for the custom CNN was 64×64 and so the input image was resized. After cropping the unwanted border regions and resizing to a fixed size of 64×64 pixels, images were used for training and testing the model.
The proposed CNN model works on a 64×64 RGB image. The custom-defined CNN network comprises of 3 convolution layers, 3 max-pool layers and 2 fully connected layers as shown in Fig. 3.
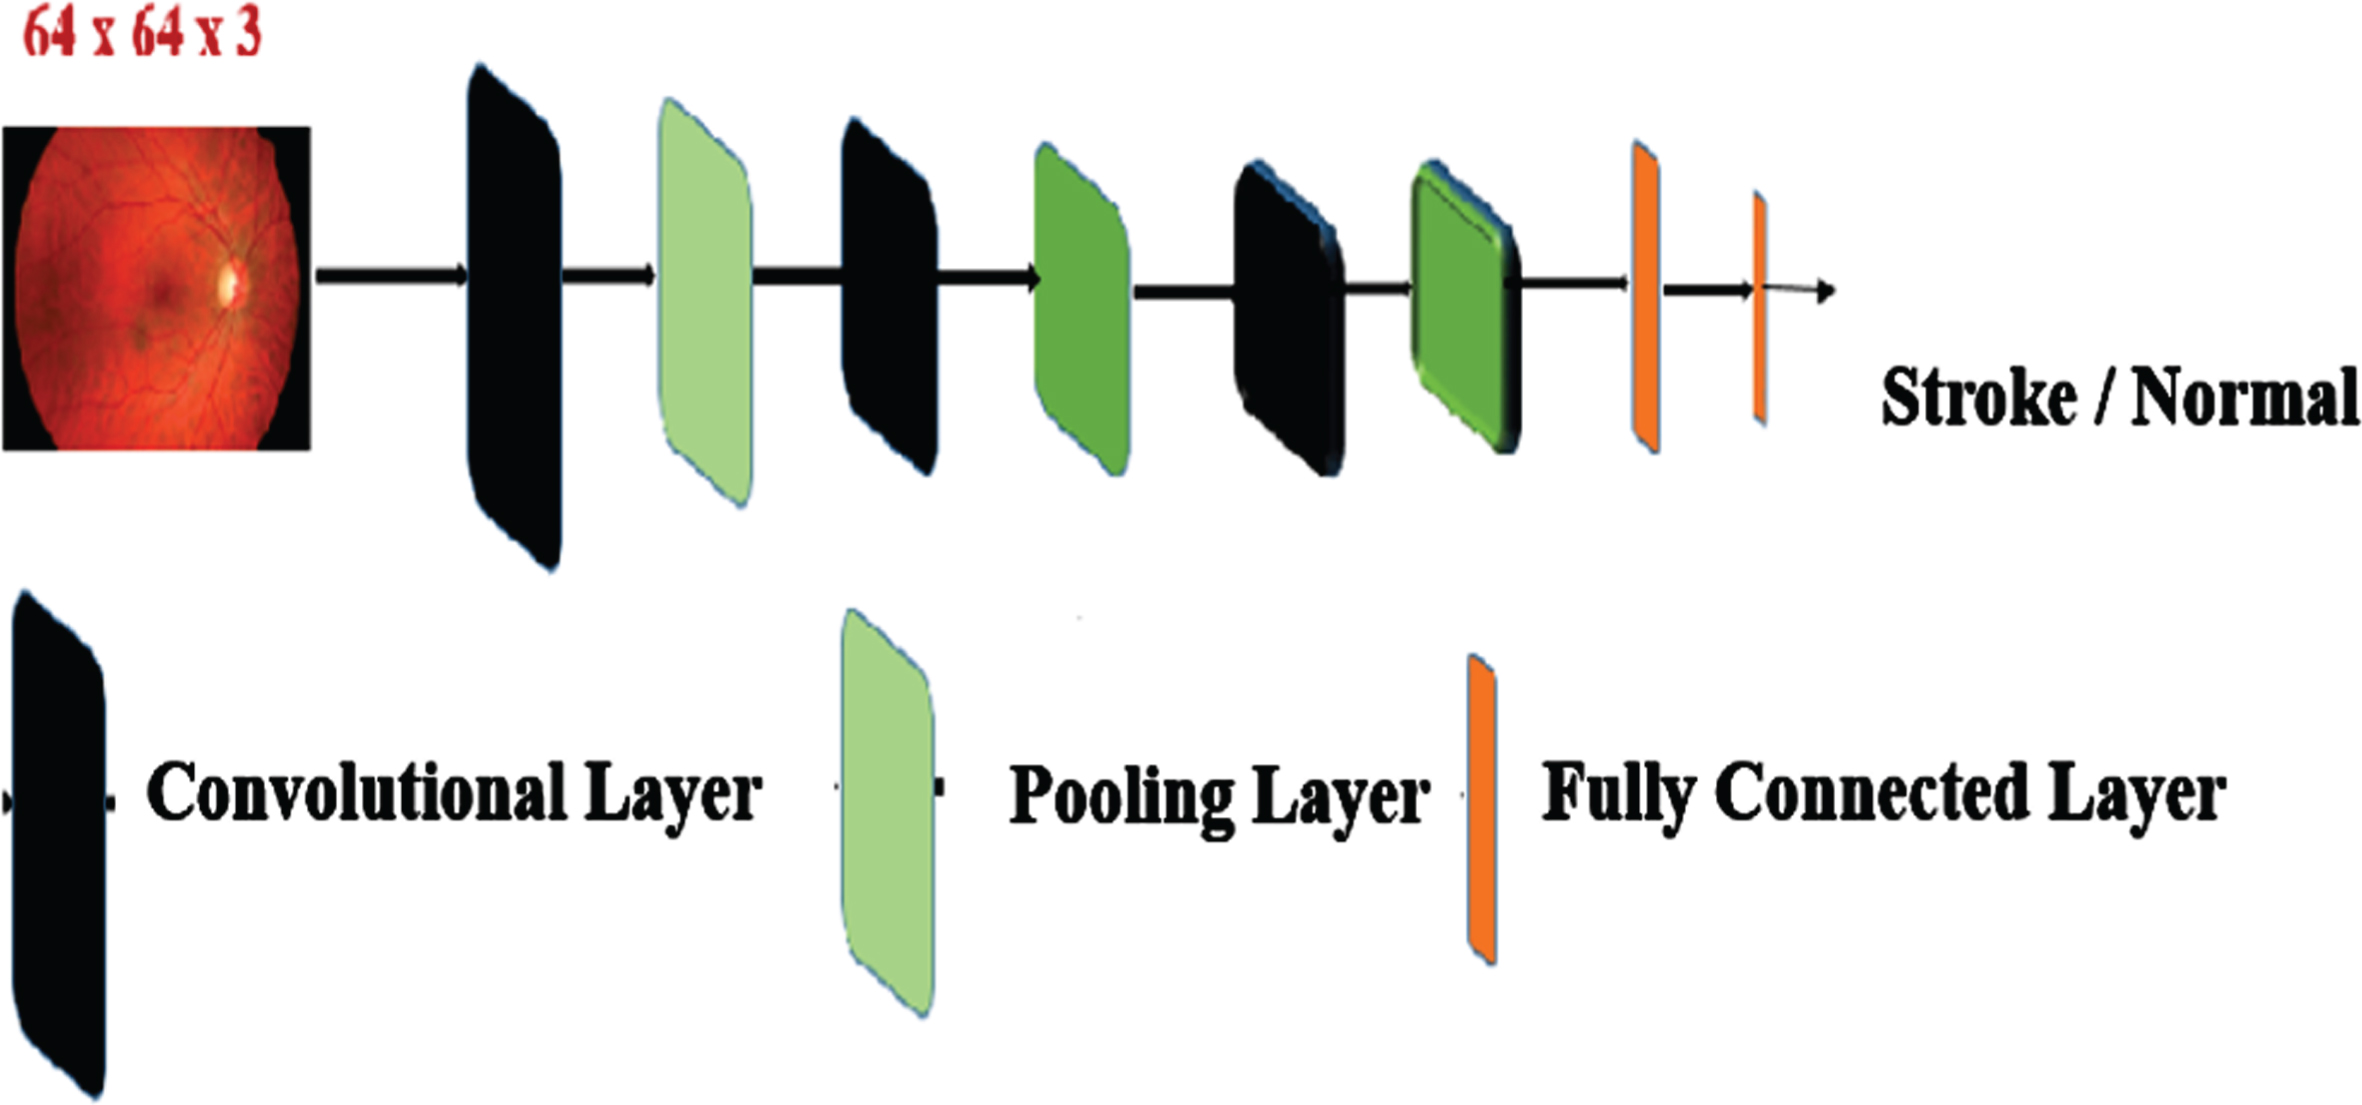
Flow diagram of custom CNN.
Low-level features from the image are captured by convolving 32 filters of size 3×3, which is followed by a ReLU (Rectified linear unit) activation function. Training of CNN s are commonly implemented using ReLU activation function, which is mathematically defined by Equation (3).
Pooling layer guarantees translation-invariance and reduces computational complexity by lowering the feature map resolution. Max pooling is implemented in this work, where the output will be a feature map covering extremely important features of the previous feature map. Feature map size gets reduced again after next convolution with 32 filters of size 3×3. After max-pooling and ReLU activation, final convolution layer uses 64 filters of size 3×3. Strided convolutions have been applied to reduce the feature size. Two fully connected layers follow the convolution layer. Fully connected layer can be regarded as a specific convolutional layer with the receptive field size equal to one. To circumvent overfitting, a drop out factor of 0.6 has been applied in the first fully connected layer. A sigmoid activation function has been used in the last fully connected layer. To establish a nonlinearity in the model, sigmoid function is popularly used in CNN. It inputs real numbers and squeezes them into range (0, 1). Sigmoid function is defined mathematically as:
The aim of both machine learning and deep learning is to make the predicted output as much as accurate as that of the actual output, which is referred to as a cost function. The cost function is Sparse Categorical Cross-entropy, which is used when the classes are mutually exclusive. To reduce the loss function, weighted parameters need updation by optimizers. The optimizer used within the network is Adamax type. Adamax is a variant of Adam optimizer that uses the infinity norm, while the Adam optimizer itself uses the L2 norm for optimization.
The number of hidden layers, neurons that make up each layer, the activation function and the number of learning steps are the parameters that has been manually configured in each trial. The architecture of customized CNN model used for stroke prognosis is given in Table 1.
Architecture of CNN
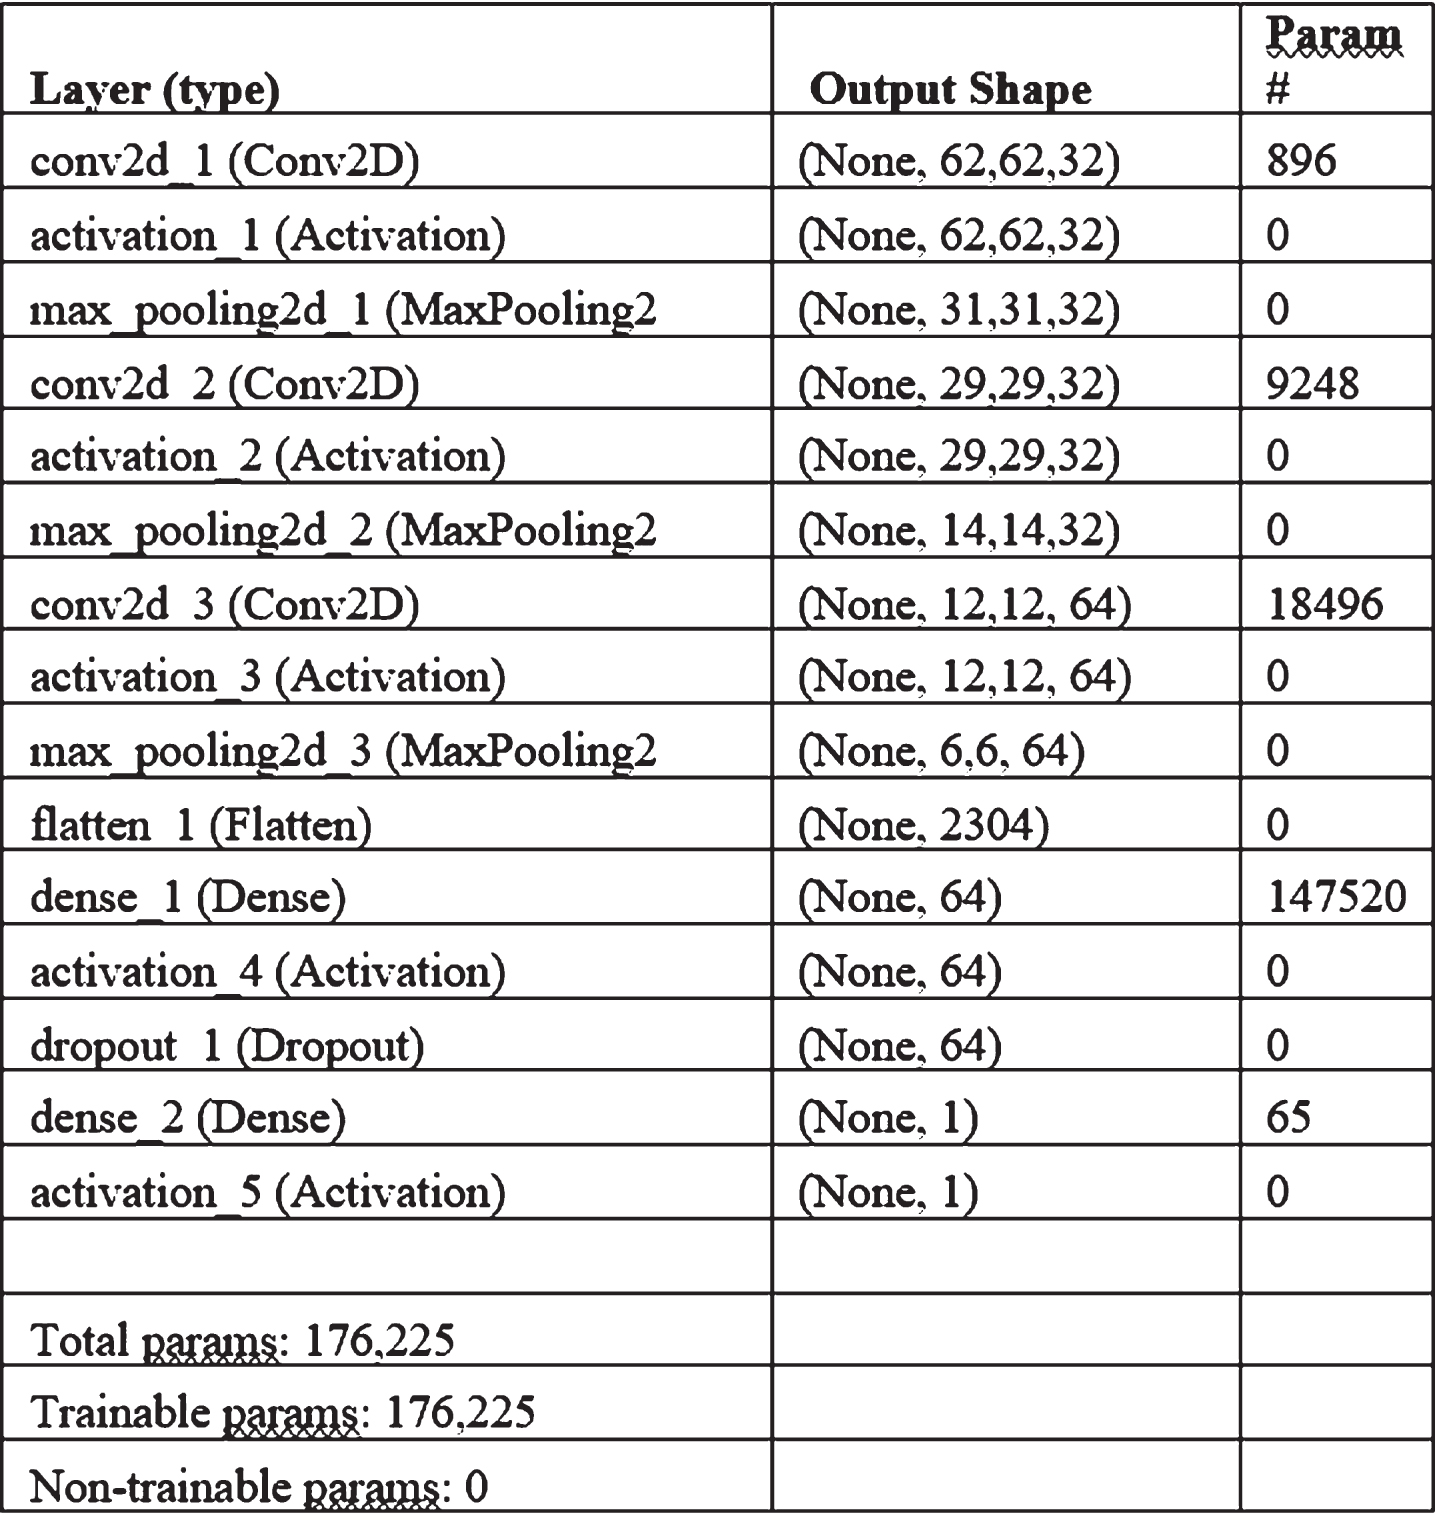
This network uses only 176,225 trainable parameters compared to 23 million parameters in Inception v3, 25 million parameters in ResNet and 0.8 million parameters in DenseNet100, respectively. Computational power required for both training and testing this CNN is less when compared with other pre-trained models. This feature makes this model significant when deploying on an embedded platform.
Dataset
Retinal images had been collected from Sree Gokulam Medical College and Research Foundation, Trivandrum. Dataset includes 130 images of which 80 are normal and 50 are those of stroke patients. The dataset consists of both male and female patients with an age group ranging from 40 to 65 years. Images are having a field-of-view of 30-degrees and of dimensions 2336×3504 pixels. Since the dataset of retinal images of stroke patients collected from hospital are relatively small, data augmentation is required to artificially expand the datasets. This prevents overfitting and helps the model generalize better. The cropped images are then resized to a fixed size of 64×64 pixels and are used in training the model.
Performance metrics
A 10-fold cross validation has been implemented using Naïve Bayes classifier and the performance of the classifier is assessed by the following evaluation metrics given by Equations (4), (5) and (6) respectively.
(TP – True Positive, TN – True Negative, FP - False Positive, FN – False Negative)
Receiver Operating Characteristic (ROC) curve is another evaluation metric of a classification model which illustrates its diagnostic capability. It implies the outcome for binary assessment problems in data mining and shows the correlation between True Positive Rate and False Positive Rate. The value of area under the ROC curve near to 1 represents a good measure of separability.
This section reports the experimental results for both hand-crafted and CNN features. The performance metrics for hand-crafted feature descriptors are summarized in Table 2.
Effect of combinations of feature descriptors
Effect of combinations of feature descriptors
Texture descriptors like Gabor filters, local binary pattern and histogram of oriented gradients were applied and the individual and combined effects has been analysed. HoG features were extracted from the ROI with 16×16 cell sizes (2×2 cells / block), unsigned gradients and 9 orientation histogram bins. With 8 horizontal and 8 vertical positions, a total of 7×7 = 49 positions are possible. Each image can provide a feature vector of size 1×1764. Gabor features were computed by choosing number of scales as 5 and number of orientations as 8 to form 40 different Gabor filters shown in Fig. 4.
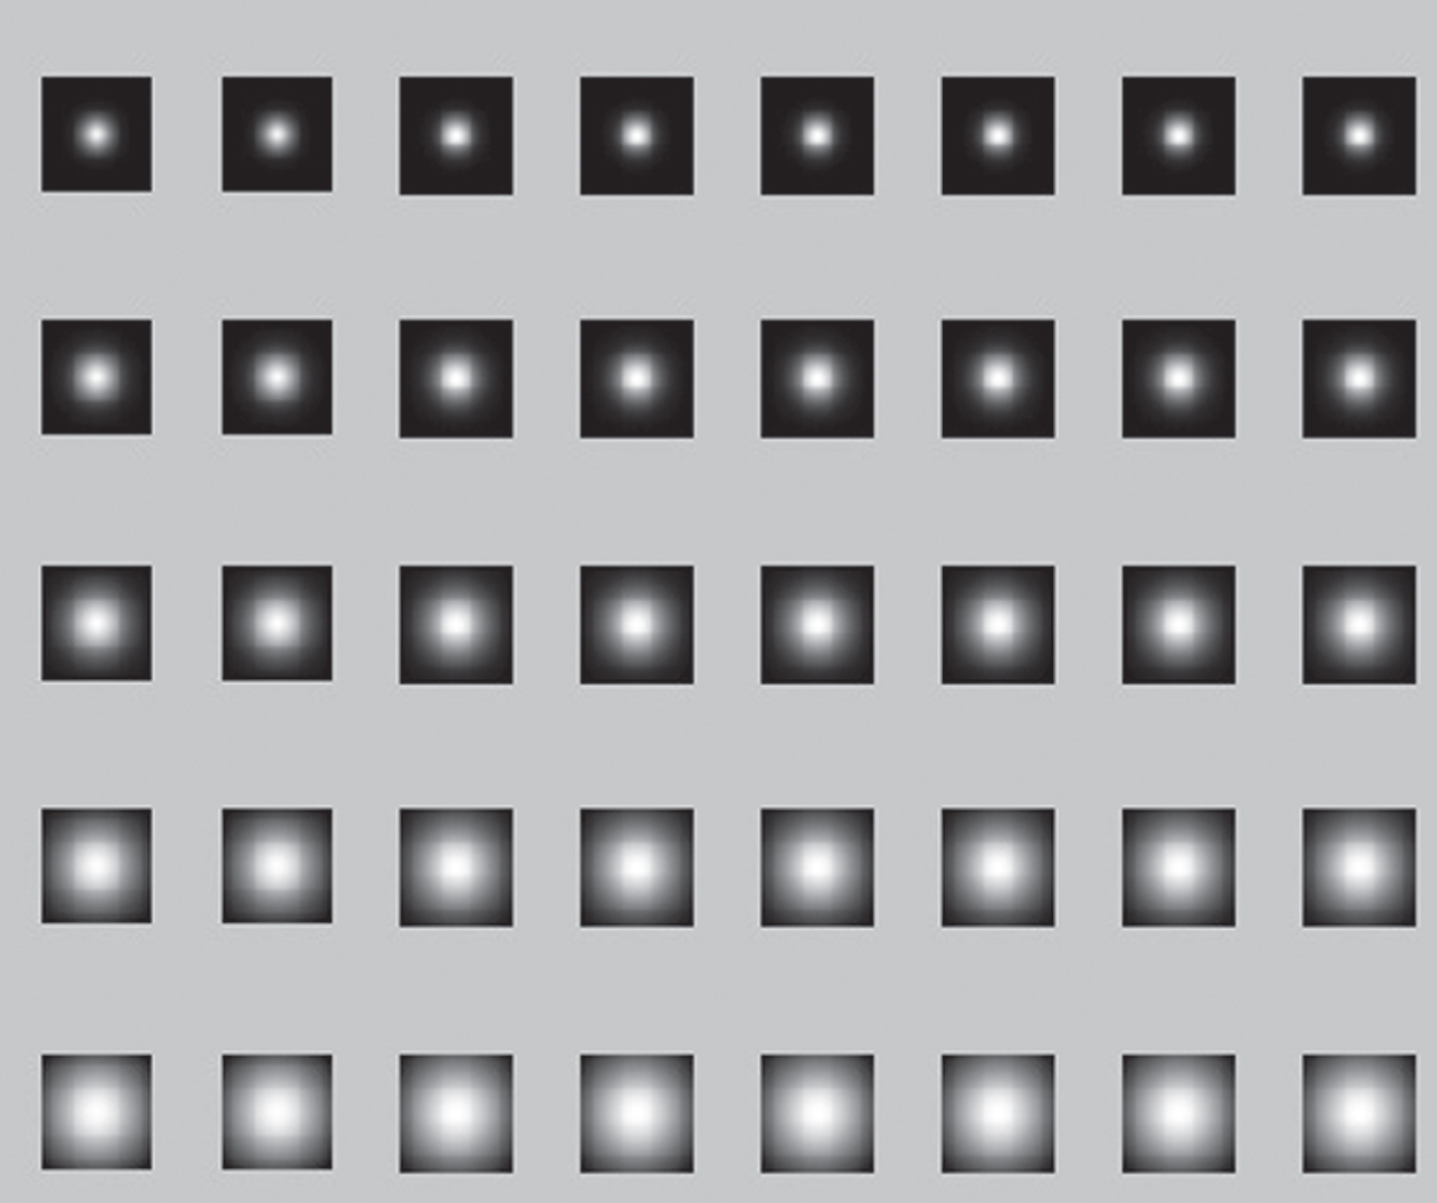
Gabor filter masks.
Each of these filters were convolved with the input image to get 40 diverse depictions of the same image. Since each feature vector has a length of 64, a total of 64×40 = 2560 features are generated. In the extraction of local binary pattern, the distribution of all numeric values is denoted as a 256 bin-histogram representing the image texture.
The feature descriptor is fed to several classifiers, but classifiers guided by distinct algorithms will perform in different ways. It has been found that Naïve bayes classifier gave a favourable predictive accuracy [8]. The area under the ROC curve for the most successful classifier gave a hopeful value of 0.94. Table 2 shows the result of combinations of texture descriptors.
Experimental results clearly demonstrate that multi-texture descriptor combination considerably increases the performance compared to the individual texture descriptors. The major limitation of hand-crafted features regarding the variation in camera parameters can be alleviated if we are using a CNN based model.
The CNN model has been implemented in Python as it is seen that the resources required for Matlab for such learning is vast and it needs immensely powerful resources to execute the learning algorithms in short span of time.
Data augmentation is the initial phase before applying the resized image to custom CNN. In this work, translation (shift between –20 and 20 pixels), rotation (0°–360°) and shearing (randomly with angle between –20° and 20°) has been applied for generating 200 images for each class. With an augmented data set of 200 images for each class, 26 epochs were carried out to obtain a training accuracy of 98.7 % and validation accuracy of 95.8 %. The trial and error method were carried initially using different optimizers for various epochs. Adamax optimizer gave a maximum accuracy of 95.8 % in the validation phase with a learning rate of 0.045, momentum of 0.9 and learning rate decay of 0.4. Since the increase in number of epochs led to overfitting, the number of trials were limited to 26.
A visual representation of the custom model can aid us to realize the features learned by each layer of CNN, which in turn can be utilized to modify the system parameters for improving the accuracy. Feature map of lower layer responds to the color information of the corners and edges and middle layer feature map captures comparable texture features while high-level feature map shows the relevant pose of the whole image after the extraction of the high-level abstract features. The feature map generated for a retinal image is given in Fig. 5.
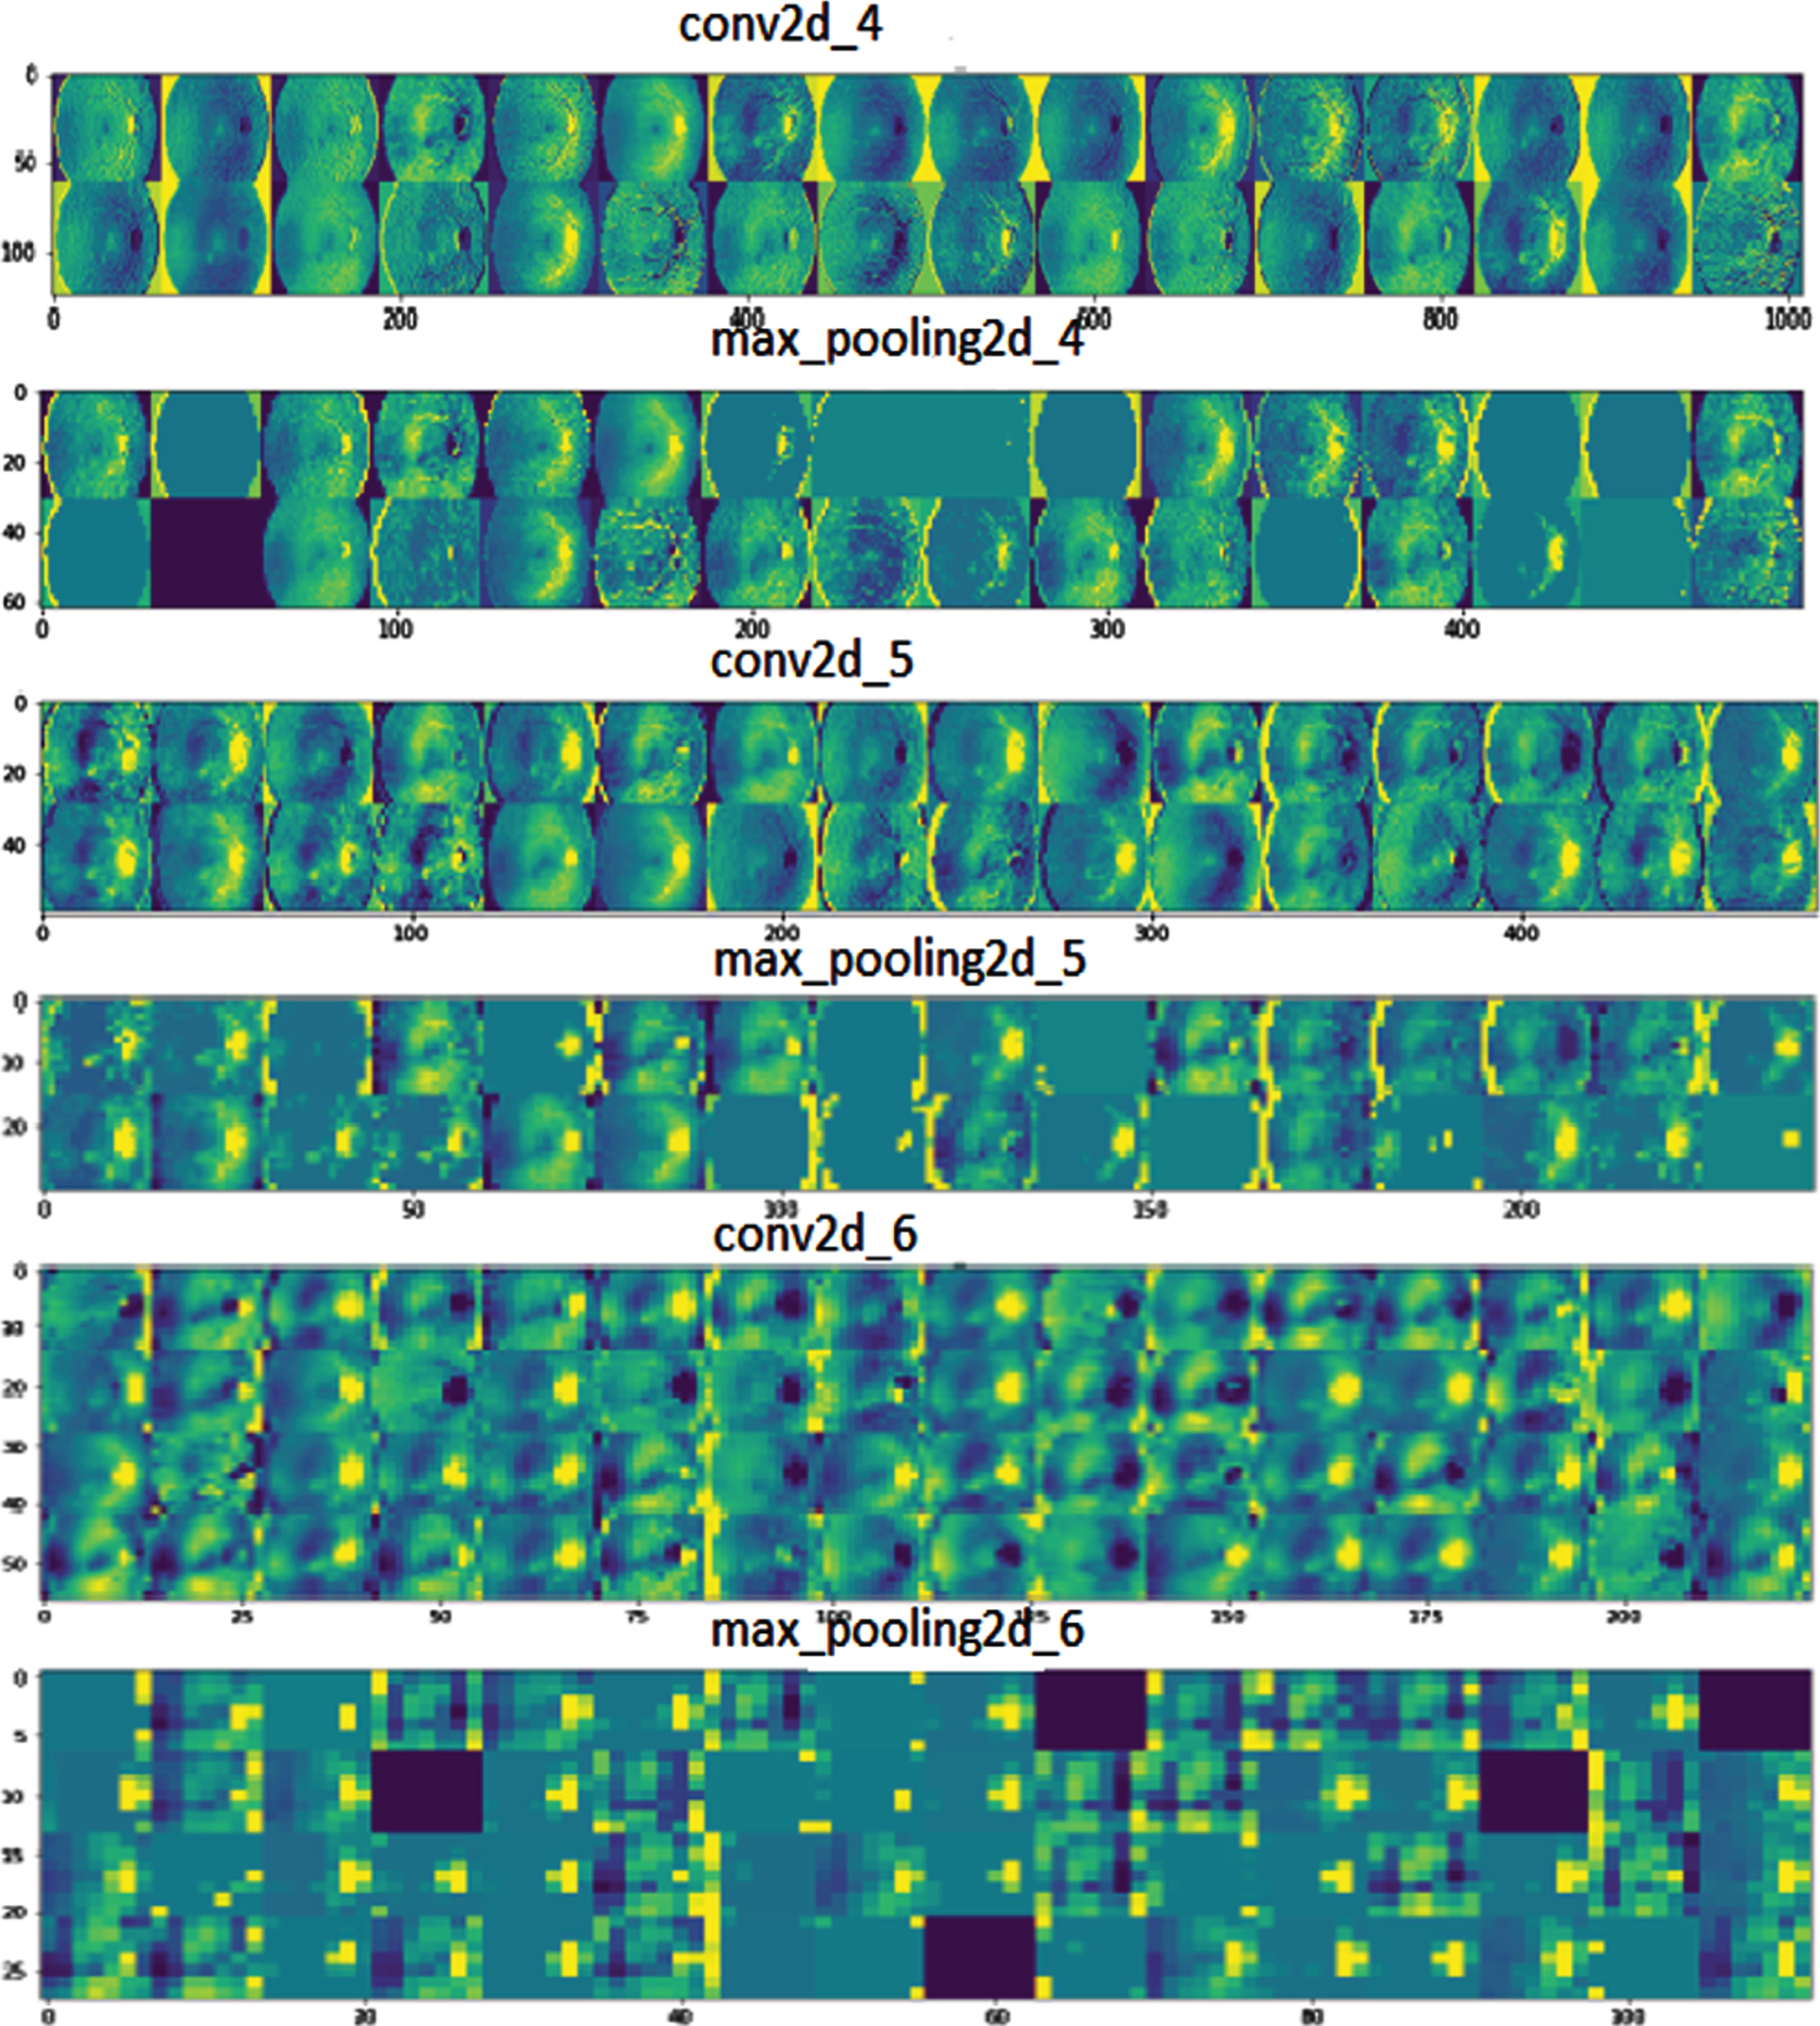
Feature map of a retinal input image.
The features generated are concatenated as a feature vector and fed to 2 fully connected layers. Final layer performs classification using a sigmoid function.
CNN based stroke prognosis system shows an accuracy of 95.8 % for the custom dataset. The area under ROC curve also offered a promising value of 0.97. Figures 6(a) and 6(b) shows that the custom model converges faster offering a high accuracy (95.8%) and low loss (0.13) within 26 epochs.
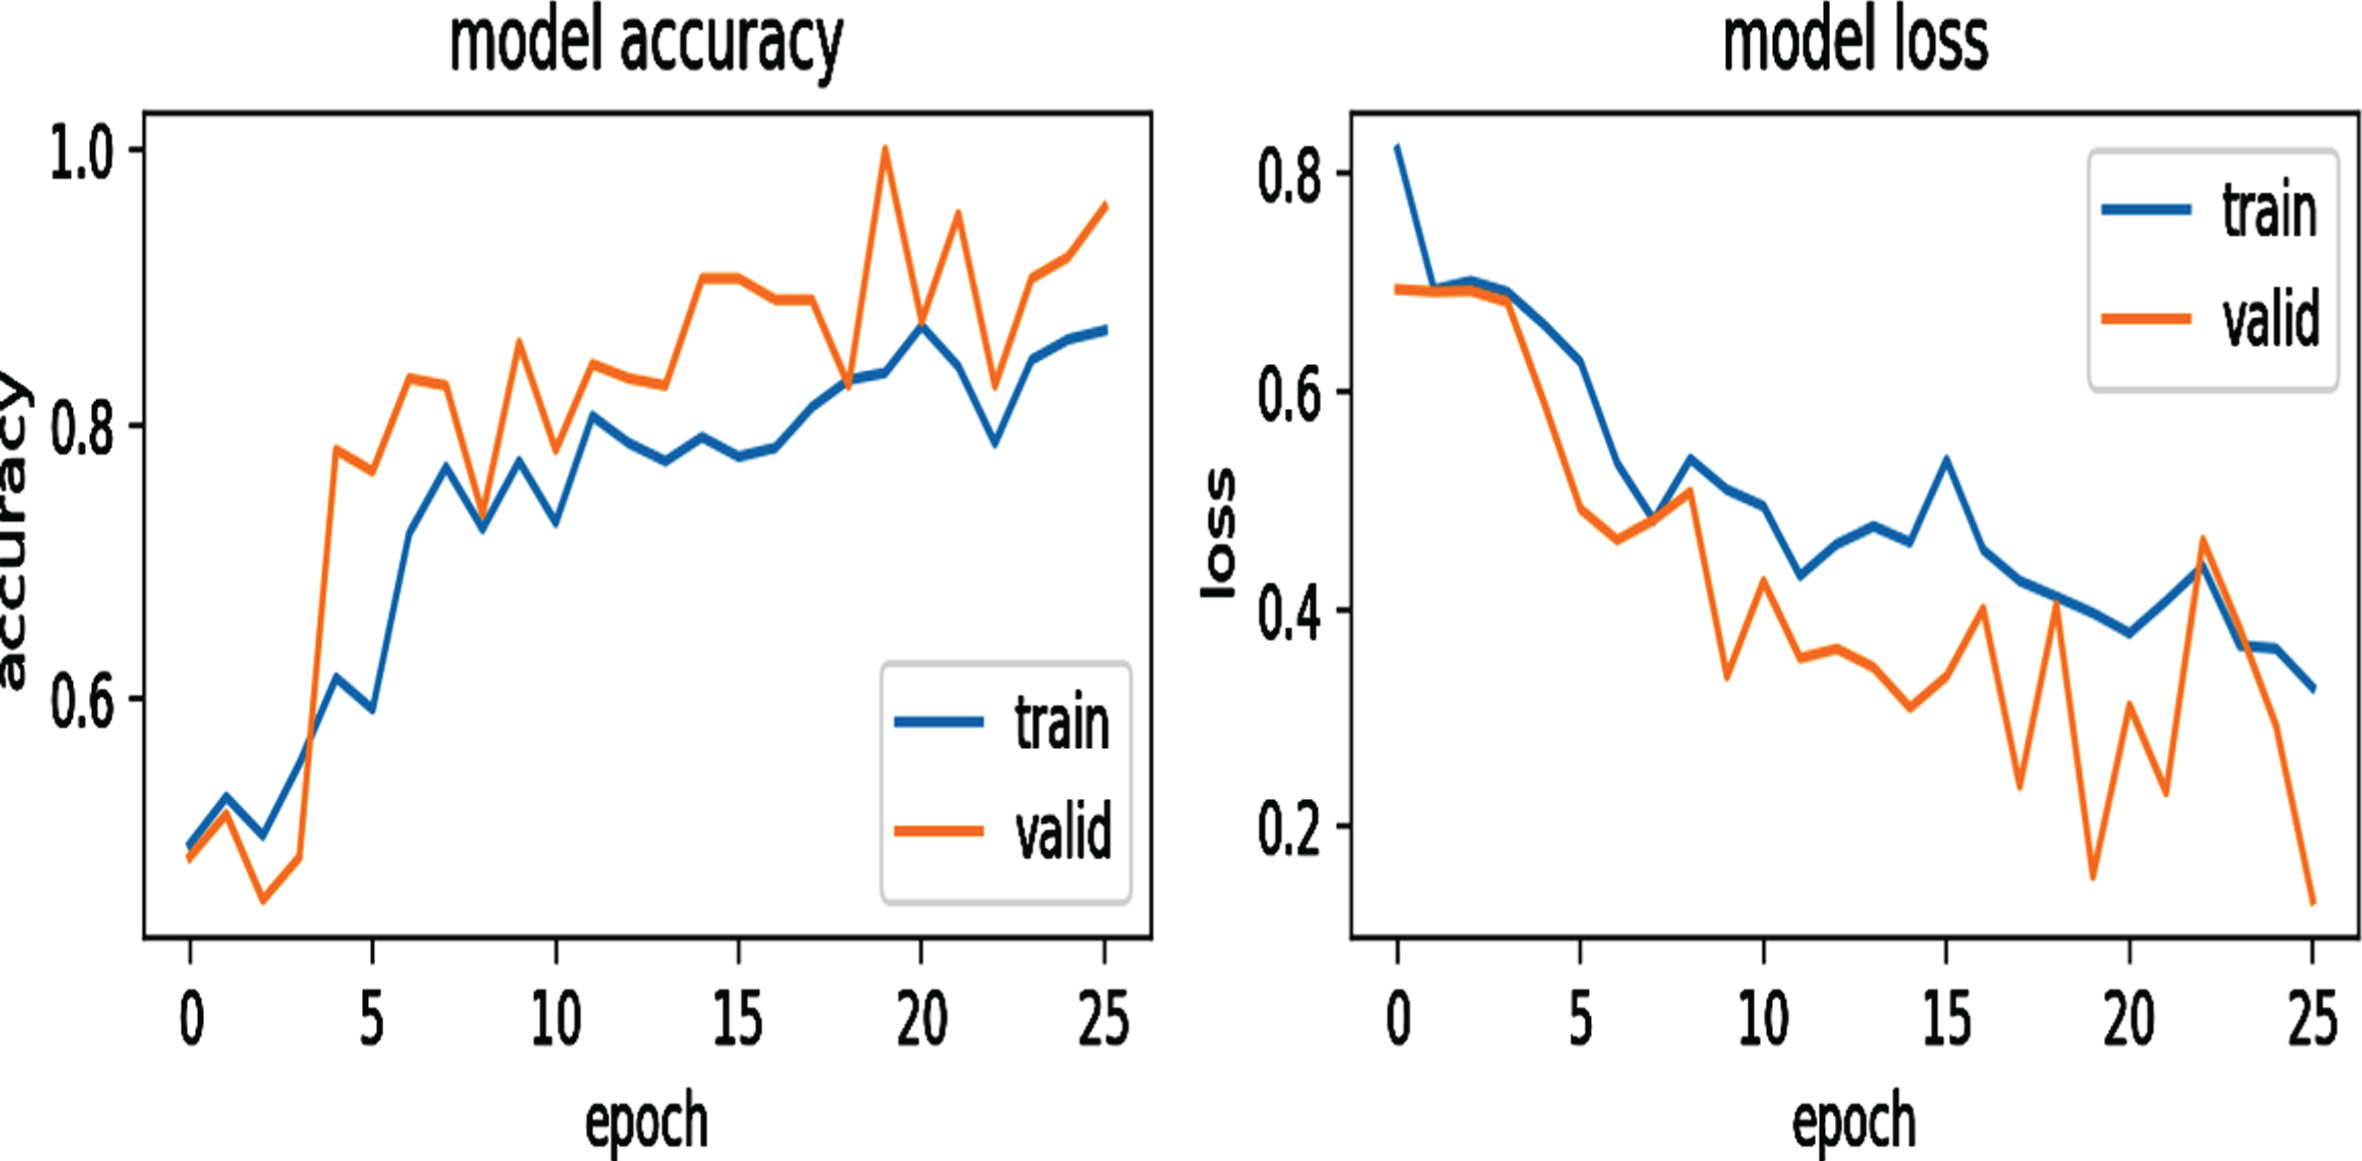
(a) Accuracy vs Epoch (b) Loss vs Epoch.
The results obtained using custom CNN model has also been compared with other pre-trained models like Inception v3, MobileNet, Xception, DenseNet 121 and ResNet50 after reconfiguration. The comparative analysis of these pre-trained models with custom CNN is given in Table 3. As shown in the table, the custom CNN excels hand-crafted features and other pre-trained models in terms of all evaluation metrics.
Comparison of custom CNN with pre-trained models
Pre-trained models classified the retinal images by exploiting the knowledge already gained from the Imagenet. Pre-trained models, which are computationally expensive, fail to give promising accuracy due to overfitting. After analyzing the predictions of the five pre-trained models and hand-crafted features, it is found that our custom CNN outperforms them by providing a promising accuracy of 95.8 %.
In healthcare, biomedical and bioinformatics fields, classification is currently one of the emerging research topics, especially for disease detection. This work made a comparative analysis of stroke prognosis from retinal fundus images using traditional descriptors and deep learning approaches. This research work compared the performance of three hand-crafted features, pre-trained CNN models and custom CNN for predicting the occurrence of stroke in retinal images. Experimental results gave 94.6 % accuracy with the Naïve Bayes classifier and an accuracy of 95.8 % with the Custom CNN classifier. Even though hand-crafted features are a better choice than custom CNN for embedded applications because of its prediction time, custom CNN seems to be superior in terms of accuracy and other evaluation metrics. In future, these methods can be implemented on much larger datasets of high-resolution images for stroke detection.