
Abstract
DoS, GH, Sybil, Masquerading, Spoofing, Man in the Middle, etc. constantly attack IoT networks. Internal or external attacks reduce end-to-end delay, throughput, energy use, and other metrics. To counter these attacks, researchers have proposed a number of security & privacy mechanisms with varying computational complexity and security levels. Immutability, traceability, transparency, and distributed nature make blockchain-based models secure. QoS depends on blockchain length, so these models aren’t scalable. Researchers say sidechaining improves QoS while remaining secure. Splitting or merging complex sidechains requires machine learning. Low-power IoT networks can’t use models. This text suggests a lightweight MGWO Model that helps establish initial routes by choosing high-trust nodes, reducing sidechaining power consumption, and incorporating fault-aware trust establishment. MGWO Model determines blockchain piece count for high QoS. MGWO Model uses Q-Learning to detect network faults. Fault identification is controlled by a stochastically modelled and activated Intrinsic Genetic Algorithm (IGA). Q-Learning, MGWO, and IGA can mitigate Sybil, Masquerading, Grey Hole, DDoS, and MITM attacks. Even when attacked, the proposed model maintains high QoS, improving real-time deployment efficiency. The proposed model improves energy efficiency by 15.9%, throughput by 10.6%, communication speed by 8.3%, and packet delivery by 0.8% for different network scenarios.
Introduction
The design of encryption, hashing, privacy preservation, route establishment, attack mitigation, fault detection, and QoS aware modelling techniques are required for trust establishment with security in IoT networks. Researchers have suggested a wide range of trust-based methods for designing these models, and each of them has unique nuances, benefits, limitations, and future research potential. Figure 1. shows an example of a blockchain-based trust establishment model where data security is enforced using single chained Byzantine Fault Tolerance (BFT) based blockchains.
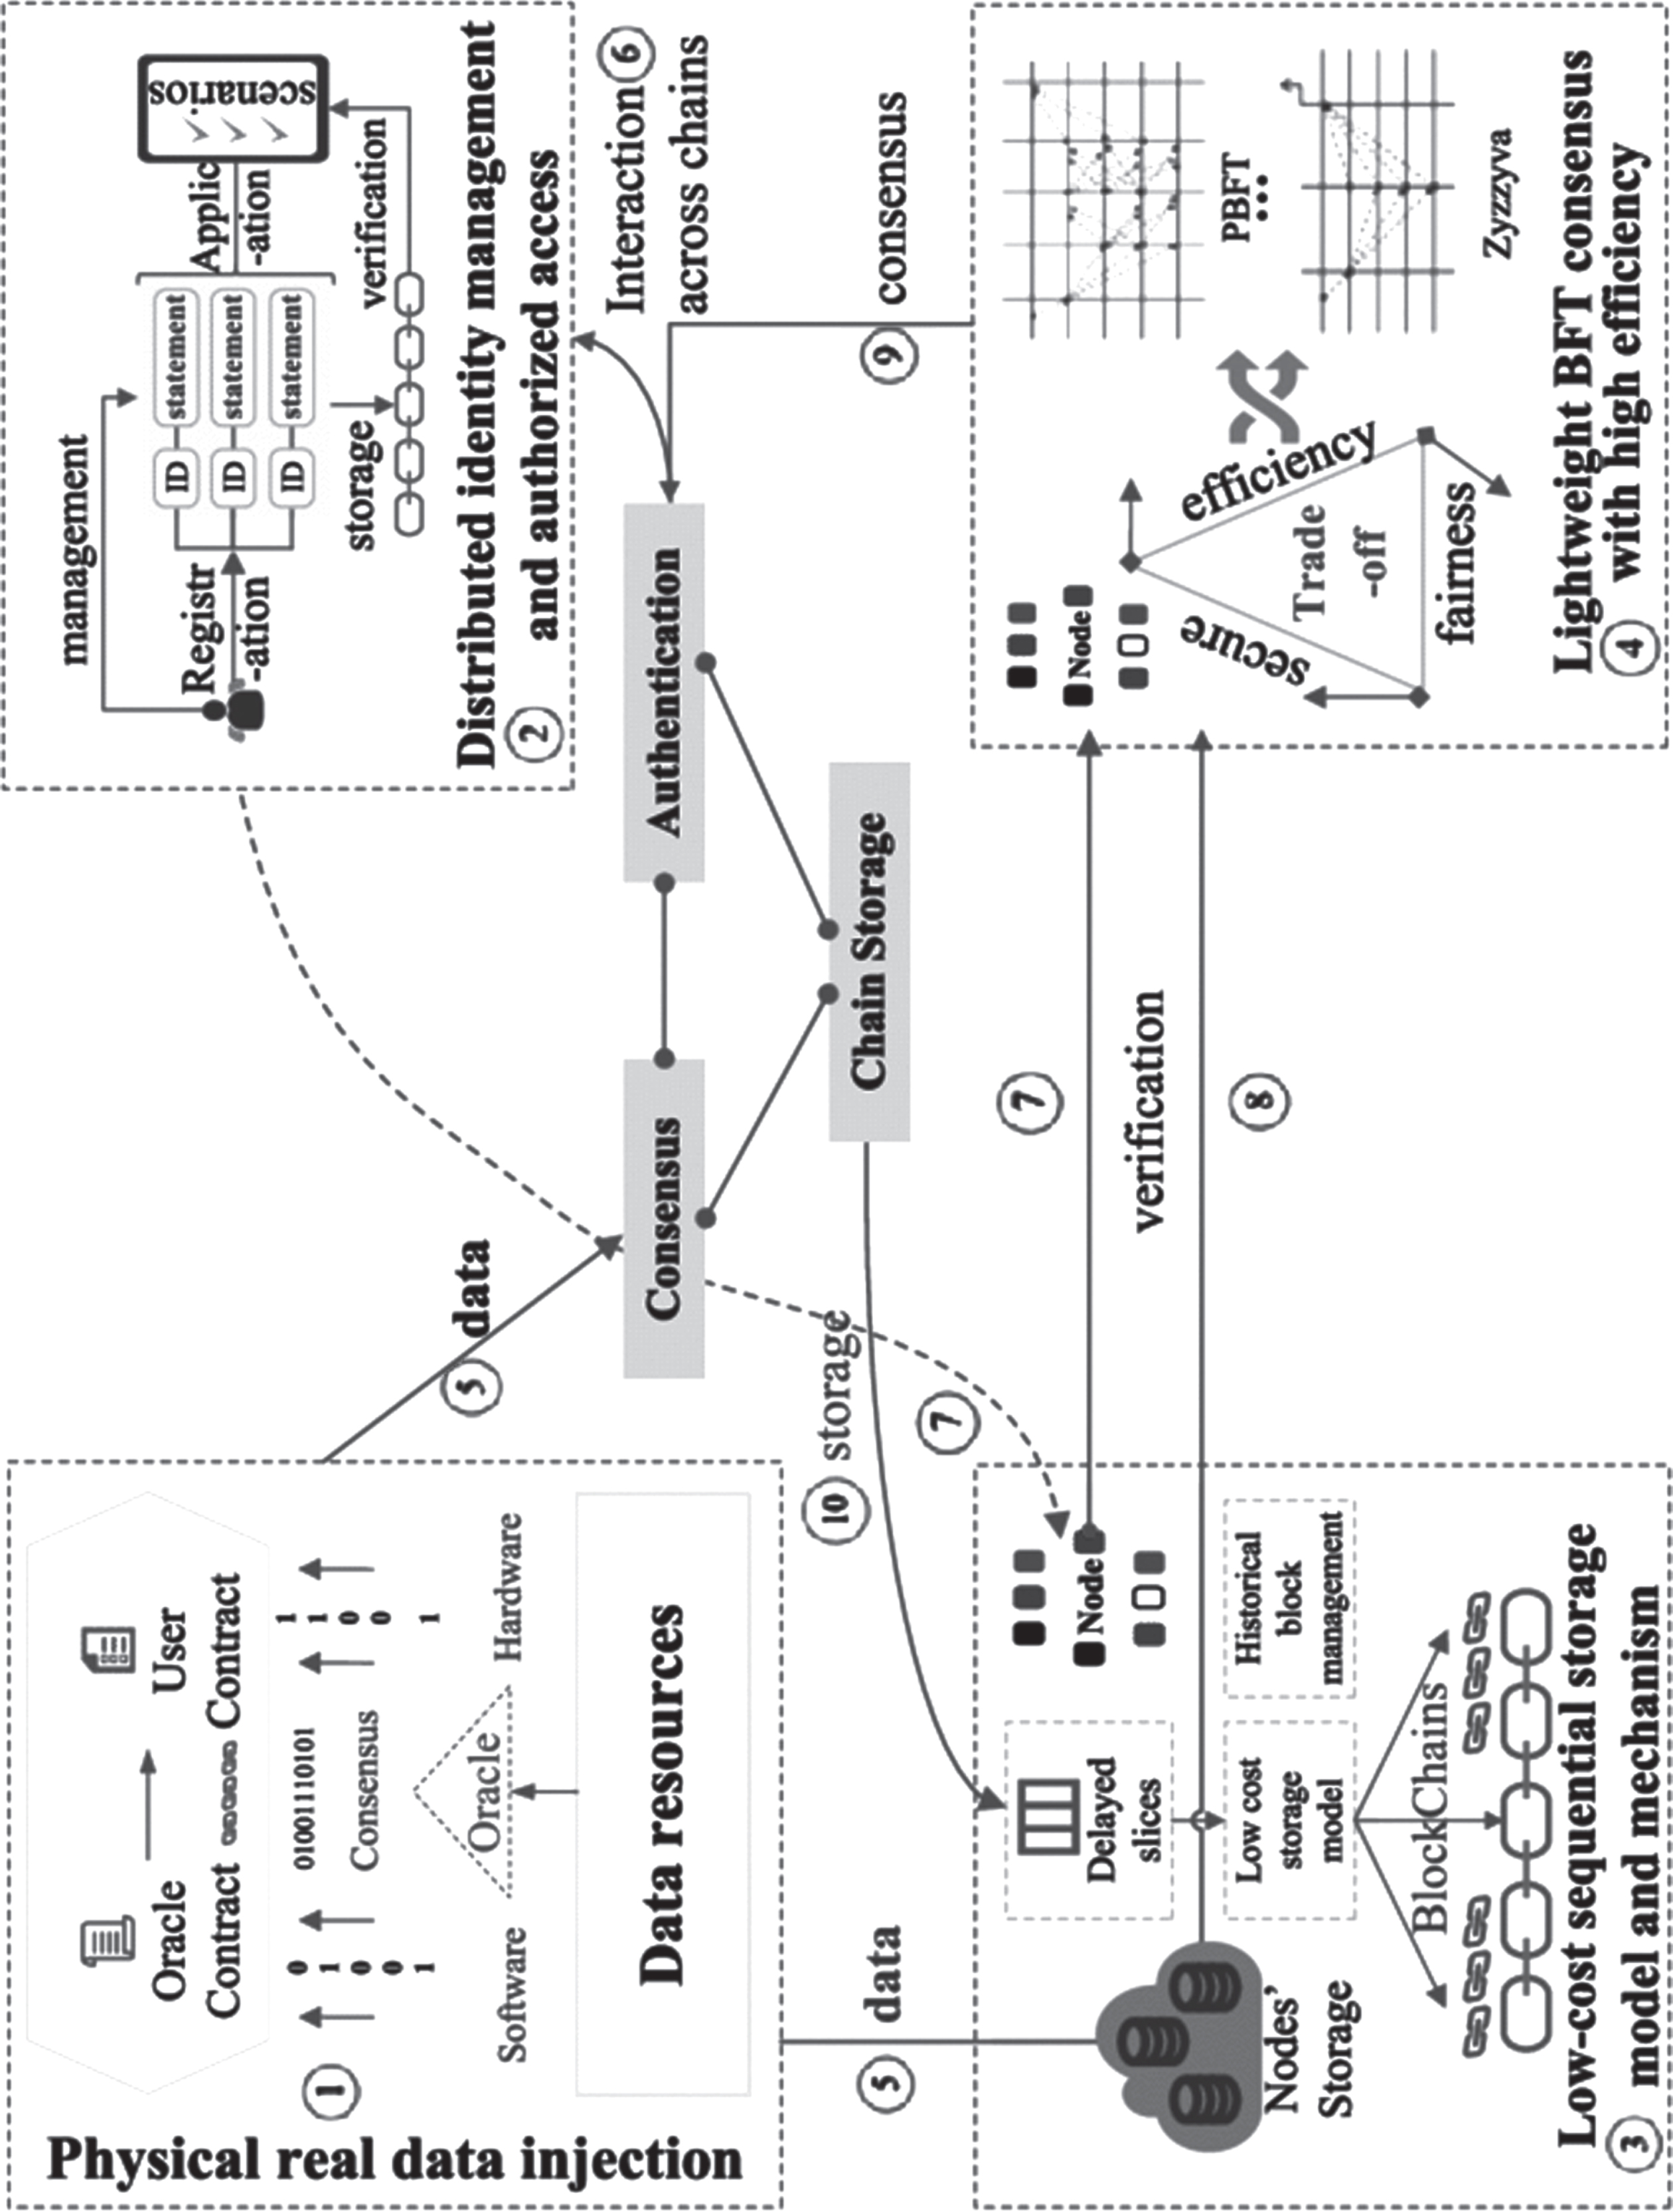
A typical blockchain based model for distributed trust establishment & control.
The model uses various authentication & consensus models for distributed identity management, resource management, security, and privacy preservation mechanisms. Due to use of single chained blockchain, the delay required to add a block into the chain (mining delay) can be evaluated via Equation 1 as follows,
Where, N blocks represents total number of blocks in the chain, D (Read) , D (Write) , D (Check) , D (Verify), and D (Hash) represent delays needed to read a block from the chain, write a block to the chain, check the block’s hash value, verify uniqueness of the block, and hash the block before adding to the blockchain. In such cases, delay needed to add a block increase exponentially w.r.t. length of the blockchain, which limits its real-time deployment capabilities.
To overcome this issue, various sidechaining models are proposed by researchers, and a survey of such models [1–4] is discussed in the next section of this text. This survey also includes study of different fault tolerant & trust establishment models, which would assist readers to identify their working characteristics. Based on this review, it was observed that QoS of these models is highly dependent on complexity of blockchain mining, delay needed to establish trust, and complexity of fault detection models. Thus, most of these models have lower QoS performance, which limits their real-time scalability characteristics. To overcome these limitations, section 3 discusses design of a fault-aware trust establishment model for low-power IoT deployments via generic lightweight sidechains. The major contributions of this work include, Design of a Multiple Objective Grey Wolf Optimization (MGWO) for improved security performance Design of Q-Learning Model for improving QoS levels Design of an Intrinsic Genetic Algorithm (IGA) for incrementally improving QoS & security level
The model was evaluated in section 3, w.r.t. various state-of-the-art models, in terms of various QoS metrics. Based on this evaluation, readers will be able to identify nuances, advantages & limitations of the proposed model w.r.t. standard trust-establishment methodologies. This paper finishes with some insightful observations regarding the suggested model and offers a number of suggestions for enhancing it.
Researchers have proposed a wide range of trust formation models that support numerous scale network deployments with little complexity and high security performance levels. For instance, work in [5, 6] proposes use of Optimized User-Friendly Transaction Time Management and Object Name Service (ONS), which helps with performing fundamental blockchain deployments for various network types. However, these models’ usability is constrained by the fact that they are not saleable. The work in [7] proposes the design of the Dynamic Ordered Node Selection (DONS) model, which helps with low complexity and high density blockchain-based access control under various network scenarios. Similar models are covered in [8–10], which advocate the use of Edge Computing, Bitcoin-NG, and Byzantine fault tolerance (BFT) based consensus models to support high scalability and low complexity trust establishment with delay minimization for various network types. Extensions to these models are discussed in [11–13], which recommend using Authentication with Key Management, Collaborative Internet-of-Things, and Space-Structured Greedy Heaviest-Observed Subtree (S2GHOST), thereby minimizing overheads while deploying various blockchain network types. Work in [14–16] proposes the use of Adaptable PBFT, lattice constructions, and Beekeeper Model, which uses low complexity blockchain methods for integrating into highly scalable networks, to further enhance these models.
Models that further develop blockchains for Distributed Charging-Record Management [17], service-oriented architecture (SoA) [18], Deep Reinforcement Learning (DRL) [19], and Federated Learning (FL) [20] also make use of a variety of fault tolerance mechanisms that can be implemented for high-efficiency network applications. These models aim to reconfigure networks at runtime, which restricts their performance for real-time & high-speed application use cases. To address these problems, work in [21–23] suggests using Time Protection Schemes, short signatures with hash functions, and lightweight blockchains that enable adaptive reconfigurations without overwhelming the network with beacon signals. These models are further expanded through the use of application-specific blockchain deployment tools like Service-Oriented Permissioned Blockchain [24], Inhomogeneous Poisson Point Process (IP3) [25], Single Point of Failure (SPOF) [26], Federated Learning (FL) [27], and Transactive Energy Models (TEMs) [28]. These models improve network energy efficiency for various scenarios and reduce mining complexity by pre-empting search spaces. Extensions to these models are discussed in [29–33], which recommend using faulty probability determined (FPD) with faulty number determined (FND), Sybil-proof wireless network coordinate-based Byzantine consensus (SENATE), and Mobility Aware Blockchain-Enabled Offloading Schemes (MABOS) to help deploy large-scale networks that can be used for low-complexity, high-speed deployments. However, the QoS performance of these models is strongly influenced by the size of the blockchain, making it impossible to scale them for more extensive deployments. Even the creation and maintenance of sidechaining models requires complex machine learning techniques to make split or merge decisions for various chain types. They cannot be used for low-power applications because they use complex models. The design of a novel, lightweight Multiple Objective Grey Wolf Optimization (MGWO) process is covered in the following section in order to lower this power consumption during sidechaining and incorporate fault-aware trust establishment. The model’s performance was validated for various real-time application scenarios by evaluating it under various QoS, fault, and attack scenarios and comparing it to various cutting-edge models.
Design of the proposed fault-aware trust establishment model for low-power IoT deployments via generic lightweight sidechains
Based on the detailed literature survey on different Fault Aware IoT Models that enforce trust establishment, it can be observed that blockchain based models outperform other security techniques. Thus, the main role of blockchains is to improve security performance under different network attacks. But QoS performance of existing models is highly dependent on length of the blockchain, due to which they cannot be scaled for larger deployments. To overcome such scalability issues, sidechaining methods are proposed by researchers, which assist in maintaining QoS & security performance. But design & maintenance of sidechaining models is complex and requires Machine Learning Methods to take split or merge decisions for different chain types.
Due to use of complex models, they cannot be deployed for low-power applications. To reduce this power consumption during sidechaining, and incorporate fault-aware trust establishment, this section discusses design of a novel light-weight Multiple Objective Grey Wolf Optimization (MGWO) process. Flow of the model is depicted in Fig. 2. wherein it can be observed that the model assists in initial route establishment via selection of high-trust nodes. The MGWO Model also takes split & merge decisions, which assists in maintaining high QoS performance while showcasing better security levels. The model is accompanied with a light-weight Q-Learning layer, that assists in incremental training for MGWO Model to identify network faults. The fault identification process is controlled via a stochastically modelled Intrinsic Genetic Algorithm (IGA) which is activated by the MGWO Model depending upon progressive QoS performance of the network under different communication scenarios. Due to integration of Q-Learning with MGWO & IGA the proposed model is capable of mitigating Sybil, Masquerading, Grey Hole, Distributed Denial of Service (DDoS), and Man in the Middle (MITM) attacks.
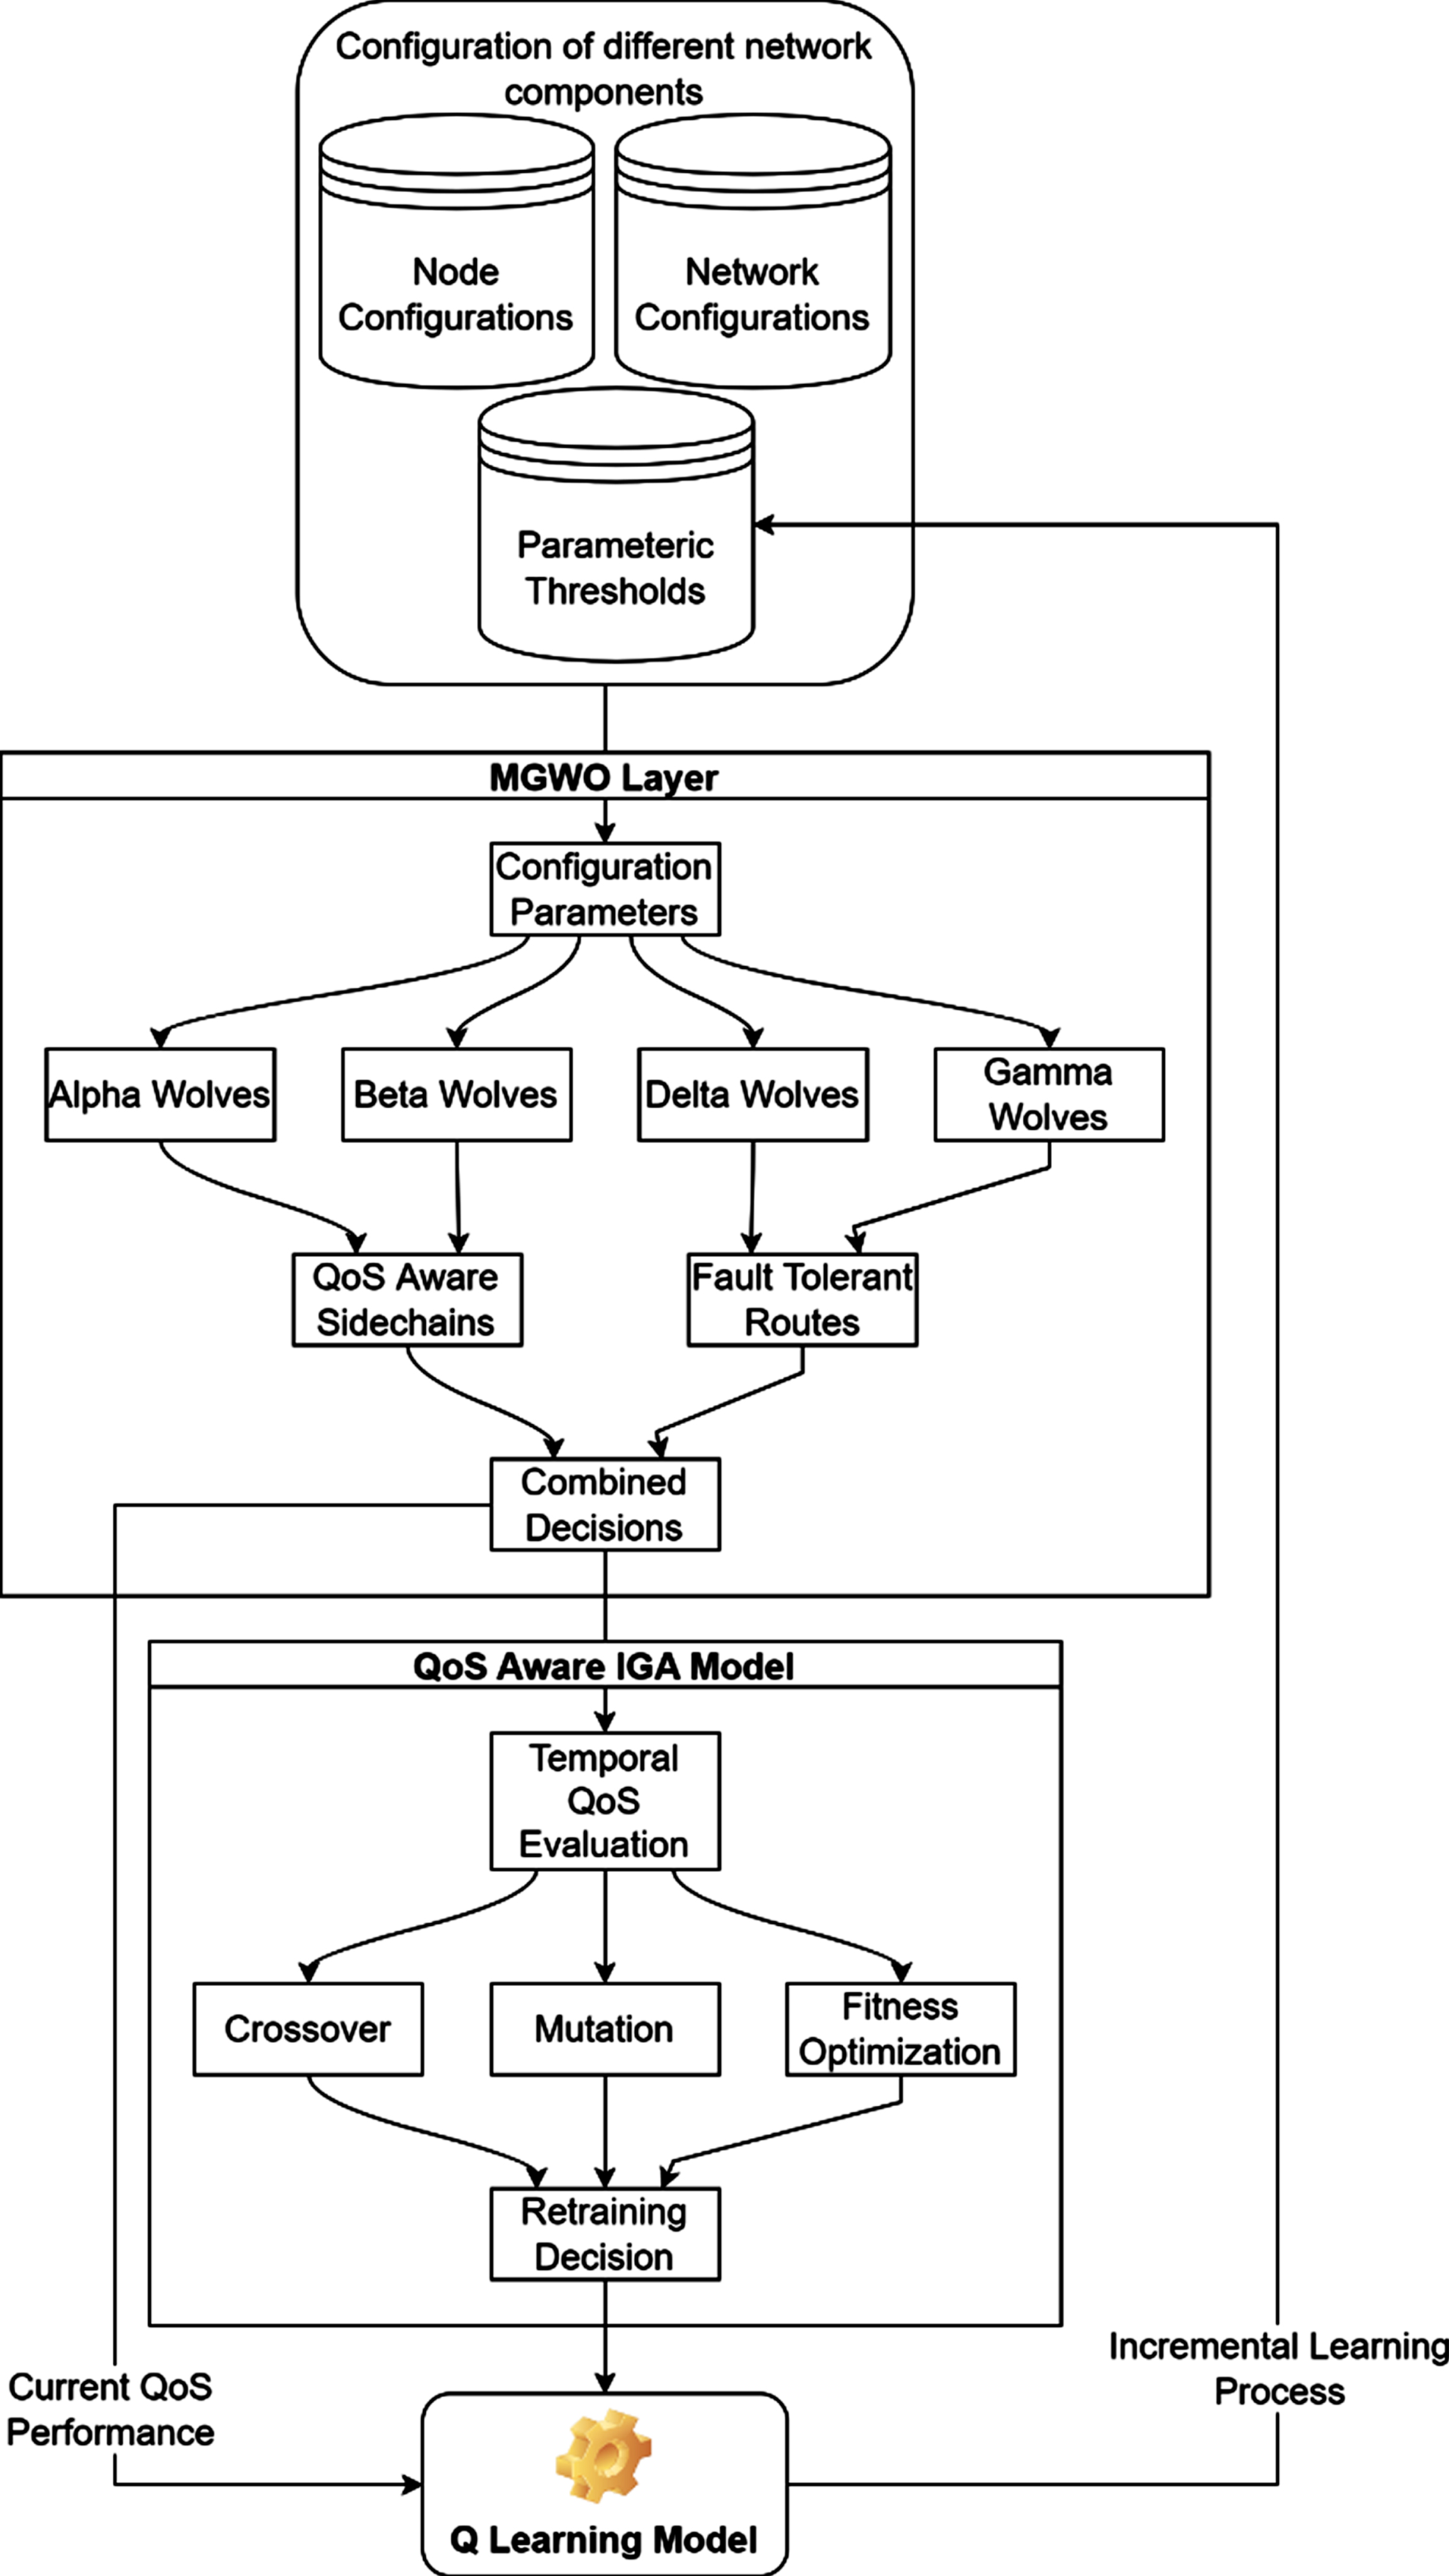
Flow of the optimized routing process.
To effectively describe flow of the proposed model, it is segregated into different sub modules, and each of these modules are discussed in separate sub sections of this text. Based on this discussion, researchers will be able to implement these models for their application-specific deployment use cases.
The GWO Model is used to decide sidechain management operations, and to establish fault tolerant routes based on temporal node performance. The model initially collects node-level & network-level information that includes temporal communication delay, temporal throughput, packet delivery performance, and energy consumption per communication. This information is processed by a GWO Model, which works via the following process, Initially the following parameters for GWO are set by network designers, Number of Wolves (N
w
) Total iterations (N
i
) Wolf learning rate (L
w
) Current blockchain & sidechain configurations (C
s
) Initially mark all the wolves as ‘Gamma Wolves’, which indicates that these wolves must be modified during initial iterations. For each GWO iteration between 1 to N
i
, perform the following tasks, Scan each of the wolves between 1 to N
w
, and analyze them via the following processes, If the wolf is marked as ‘Alpha’, ‘Beta’, or ‘Delta’, then go to the next wolf in sequence. Else, generate wolf configuration via the following process, Add N
d
dummy blocks to the current blockchain, by sending requests from requesting list of sources (s) to requesting list of stochastic destination (d) nodes. Identify paths with N
s
stochastic hops, which are evaluated via Equation 2,
To communicate data between these node pairs, identify N
s
nodes, that satisfy Equation 3,
Where, N
h
represents maximum allowable hops for the given network configuration and can be setup by network designers.
Where, d (s, i) & d (i, d) represents distance between source & current node, and distance between destination & current node, while d
ref
represents distance between source & destination node pairs. Based on this selection, communicate data packets between nodes, and add blocks to the blockchain for each communication sequence. For each block addition, evaluate single wolf fitness via Equation 4,
Where, D (mine) , & E (mine) represents delay needed & energy needed for mining, while Thr, PDR, E & D represents temporal throughput, packet delivery ratio, residual energy (not consumed energy), and communication delay for the nodes when evaluated for N
c
previous communications. Based on this value, evaluate current wolf fitness via Equation 5,
Evaluate these fitness levels for all wolves. At the end of each iteration, identify wolf fitness threshold via Equation 6,
Based on this threshold, mark all wolves into the following categories, If f
wi
> 3 * L
w
* f
th
, then mark the i
th
wolf as ‘Alpha Wolf’. Else, if f
w
i
> 2 * L
w
* f
th
, then mark the i
th
wolf as ‘Beta Wolf’. Else, if f
w
i
> L
w
* f
th
, then mark the i
th
wolf as ‘Delta Wolf’. Else, mark the wolf as ‘Gamma Wolf’, and repeat the process for next iterations. At the end of the final iteration, estimate wolf fitness levels, and use them for route planning & sidechain optimization process.
Once all iterations are completed, the configuration following Table 1 is generated for every combination of communicating node sets.
Creation of configuration table for the GWO model
In the table f
w
represents best fitness levels for final iteration, while f
w
(sd) represents best fitness levels for current source & destination pairs. Based on this evaluation, select the path with highest f
w
(sd) levels for routing the data, while evaluate Sidechain Split Function (SSF) via Equation 7 to estimate if the sidechain is needed to be split or merged with other chains.
After this evaluation, the current sidechain is needed to be split if
The GWO Model recommends split & merge decisions, and trust-based routes, but it cannot be re-evaluated for every communication sequence. Because re-evaluating the model will require higher energy consumption, which will reduce its deployment capabilities. Thus, to avoid frequent reconfiguration of routes, an IGA Model is deployed, that continuously scans communication requests, and maps them with existing GWO evaluated paths. This model is activated for every new communication request, and works via the following process, Initially setup the following IGA parameters, Number of IGA iterations (N
i
) Total solutions for the IGA Model (N
s
) IGA’s learning rate (L
r
) Mark all initial solutions as ‘to be updated’. Scan each solution for N
i
iterations via the following process, If current solution is ‘not to be updated’, then skip it and go to the next solution in sequence. Else, generate new solution via the following process, Select a stochastic entry from Table 1, and evaluate its correlation with current source & destination via Equation 8,
Where, P (sel) represents selected path, N (n) & N (s, d) represents number of nodes possible between current source & destination, and current node ID used for correlation matching process. Select path with maximum value of correlation, and evaluate solution fitness via Equation 9,
Repeat this process for all solutions, and evaluate iteration fitness threshold via Equation 10 as follows,
Mark solutions as ‘to be updated’, if f
i
< f
th
, else mark them as ‘not to be updated’. Repeat this process for all iterations and identify solution with highest fitness levels.
Based on the identified solution, rearrange nodes as per condition 3, evaluate value of f
w
(s, d) via Equation 4, and estimate change decision (CD) as per Equation 11,
Where, f w (IGA) represents the fitness evaluated by the IGA Model and is used to evaluate reconfiguration decisions. This process is performed for N d communication requests, and for each request a counter is incremented if CD > L r , which assists in confirmation of reconfiguration decisions. At the end of N d communications, if the value of counter > N d * L r , then the model doesn’t need reconfiguration, else the GWO Model is re-evaluated and Table 1 is appended with new route combinations. This process assists in reducing energy requirements by reducing unwanted model evaluations. To further enhance this performance, next section discusses design of a Q-Leaning model, which assists in auto updating Table 1 for better correlation-based matching performance under real-time communication requests.
The IGA Model is useful for improving QoS performance via reducing number of GWO reconfiguration processes. This model is further optimized via use of a Q-Learning model, that assists in estimation of reward functions for every IGA iteration sets. The Q-Learning model identifies highest fitness solutions for each IGA iteration, and estimates a reward function via Equation 12 as follows,
If the value of reward function for this iteration satisfies Equation 13, then solution of current IGA iteration is added to Table 1, else it is discarded from list of solutions. The accepted solutions are used to incrementally update routing configurations, which reduces complexity during selection process. Due to which, energy efficiency of the model is improved. This efficiency along with evaluation of other QoS & security related parameters under different attack types is discussed in the next section of this text.
The Summary of Key notation used in the proposed work is illustrated in Table 2.
Summary of key notation
Summary of key notation
The proposed FATMLPGS Model uses a combination of GWO with IGA & Q-Learning in order to estimate fault-tolerant, QoS aware & secure routing paths. The security component of the model is handled by sidechains, which are managed via the multiple objective GWO Model under real-time network scenarios. The proposed model was evaluated in terms of different QoS & security measures and compared with the standard blockchain powered networks discussed in S2GH OST [13], DRL [19], and SEN ATE [30]. To evaluate this performance, standard network configuration parameters were used, which can be observed from Table 3, wherein number of nodes, communication energy model, underlying Medium Access Control (MAC) protocol, etc. are defined w.r.t. different use cases.
Simulation configuration for evaluation of network performance
Simulation configuration for evaluation of network performance
Based on this network configuration, initially QoS performance of the network was evaluated under different communications in section 4.1, this was followed by section 4.2 where estimation of QoS performance was done under different attack types. Section 4.3 evaluates network performance under different fault types, which will assist in identification of network performance under different fault types. Based on these 3 evaluations, researchers will be able to identify model performance under real-time scenarios.
In this section, QoS performance of the network under different Number of Communications (NC) was evaluated for different number of wireless nodes. The wireless nodes were varied linearly between 100, 500, and 1000, thereby simulating small-scale, medium-scale, and large-scale network scenarios. For each of these node configurations, number of communications were varied between 150 to 3000, and QoS metrics including communication delay (D), energy consumption (E), throughput (T), and packet delivery ratio (PDR) were averaged for each set of communications. Based on this strategy, communication delay w.r.t. Number of Test Communications (NTC) can be observed from Table 4 as follows,
Delay needed for communication between 100 nodes
Delay needed for communication between 100 nodes
As a result of this assessment performed on a smaller number of nodes, it has been determined that the suggested model exhibits a latency that is 5% lower than that of S2GH OST [13], 14.5% lower than that of DRL [19], and 18.4% lower than that of SEN ATE [30] for the various communications which can be observed in Fig. 3. This occurs as a result of the introduction of delay during the process of route selection and mining. Similar observations may be made for all 500 nodes by looking at Table 5, which is formatted as follows,
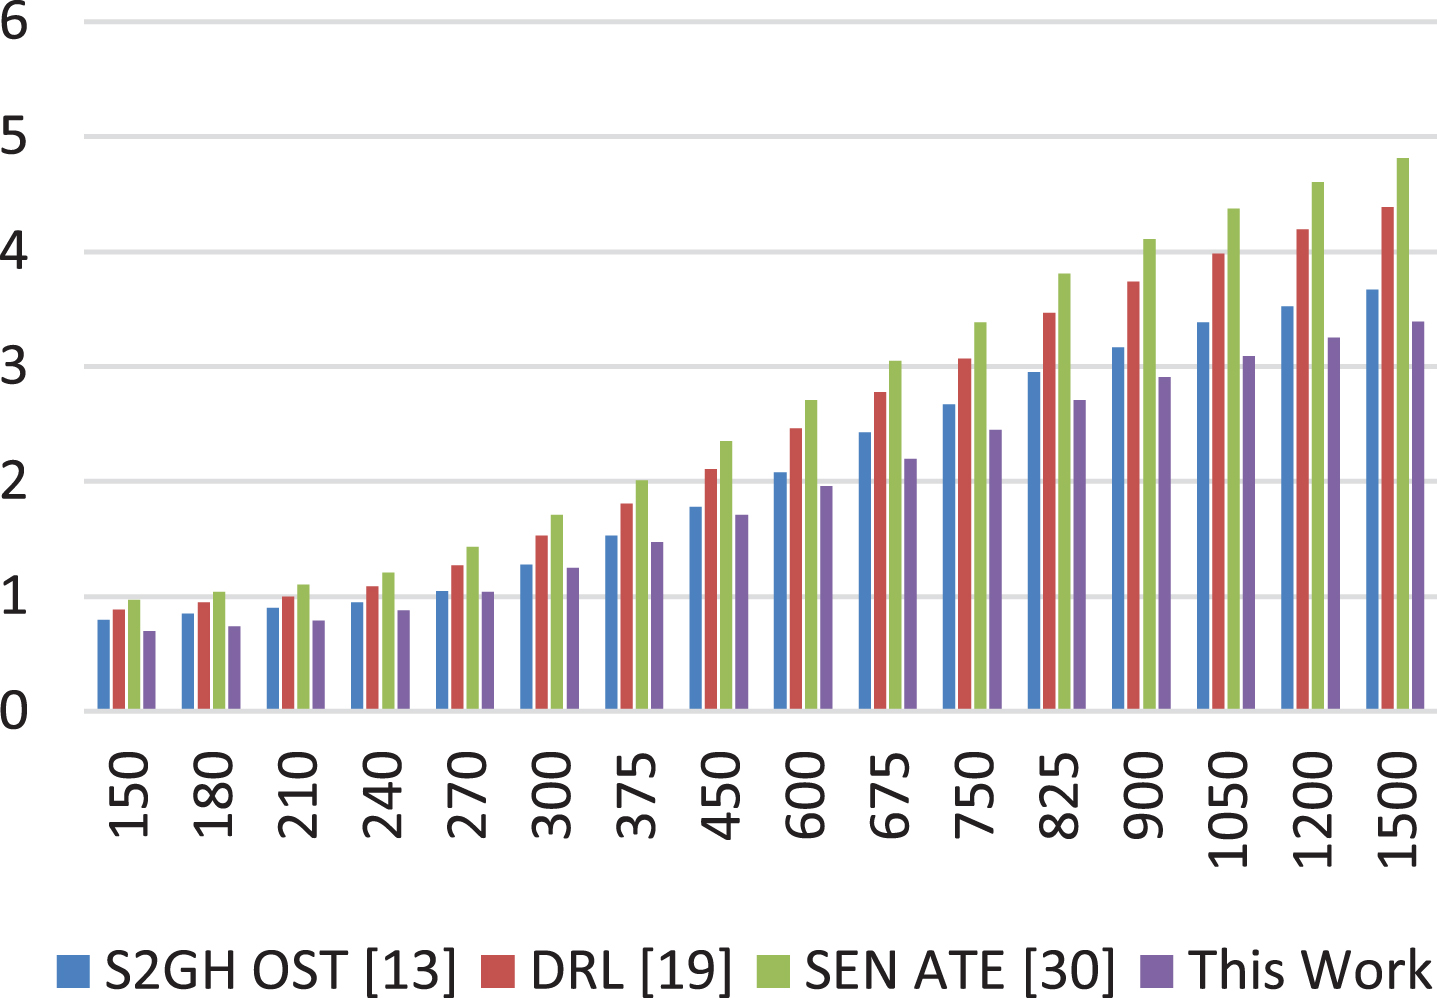
Delay needed for communication between 100 nodes.
Delay needed for communication between 500 nodes
The results of this evaluation on a moderate number of nodes show that the proposed model exhibits a delay that is 4.5% lower than S2GH OST [13], 12.5% lower than DRL [19], and 15.4% lower than SEN ATE [30] across a variety of communications. These results can be seen by comparing the proposed model to these other models. This is as a result of the introduction of delay throughout the route selection and mining process, which enables better scalability performance to be maintained. Similar observations may be made for 1000 nodes by looking at Table 6, which is formatted as follows,
Delay needed for communication between 1000 nodes
The results of this test on a wide number of nodes demonstrate that the suggested model exhibits 6.5% less delay than S2GH OST [13], 8.3% less delay than DRL [19], and 8.5% less delay than SEN ATE [30] when it comes to the various communications. This is as a result of the introduction of delay throughout the route selection and mining process, which enables better scalability performance to be maintained. The following observations on the energy consumption (EC) performance of 100 nodes are based on a similar technique and can be seen in Table 7.
Energy consumed while communicating between 100 nodes
The results of this evaluation on a smaller network size show that the proposed model showcases 10.5% lower energy consumption than S2GH OST [13], 16.3% lower energy consumption than DRL [19], and 12.5% lower energy consumption than SEN ATE [30] under different communications as shown in Fig. 4. These results are based on the fact that the proposed model consumes 10.5% less energy than S2GH OST [13]. This is because of the integration of residual energy as well as temporal energy consumption levels throughout the route selection and mining process, which enables better scalability performance to be maintained. On the basis of a comparable approach, the following can be noticed about the energy consumption performance of 500 nodes from Table 8,
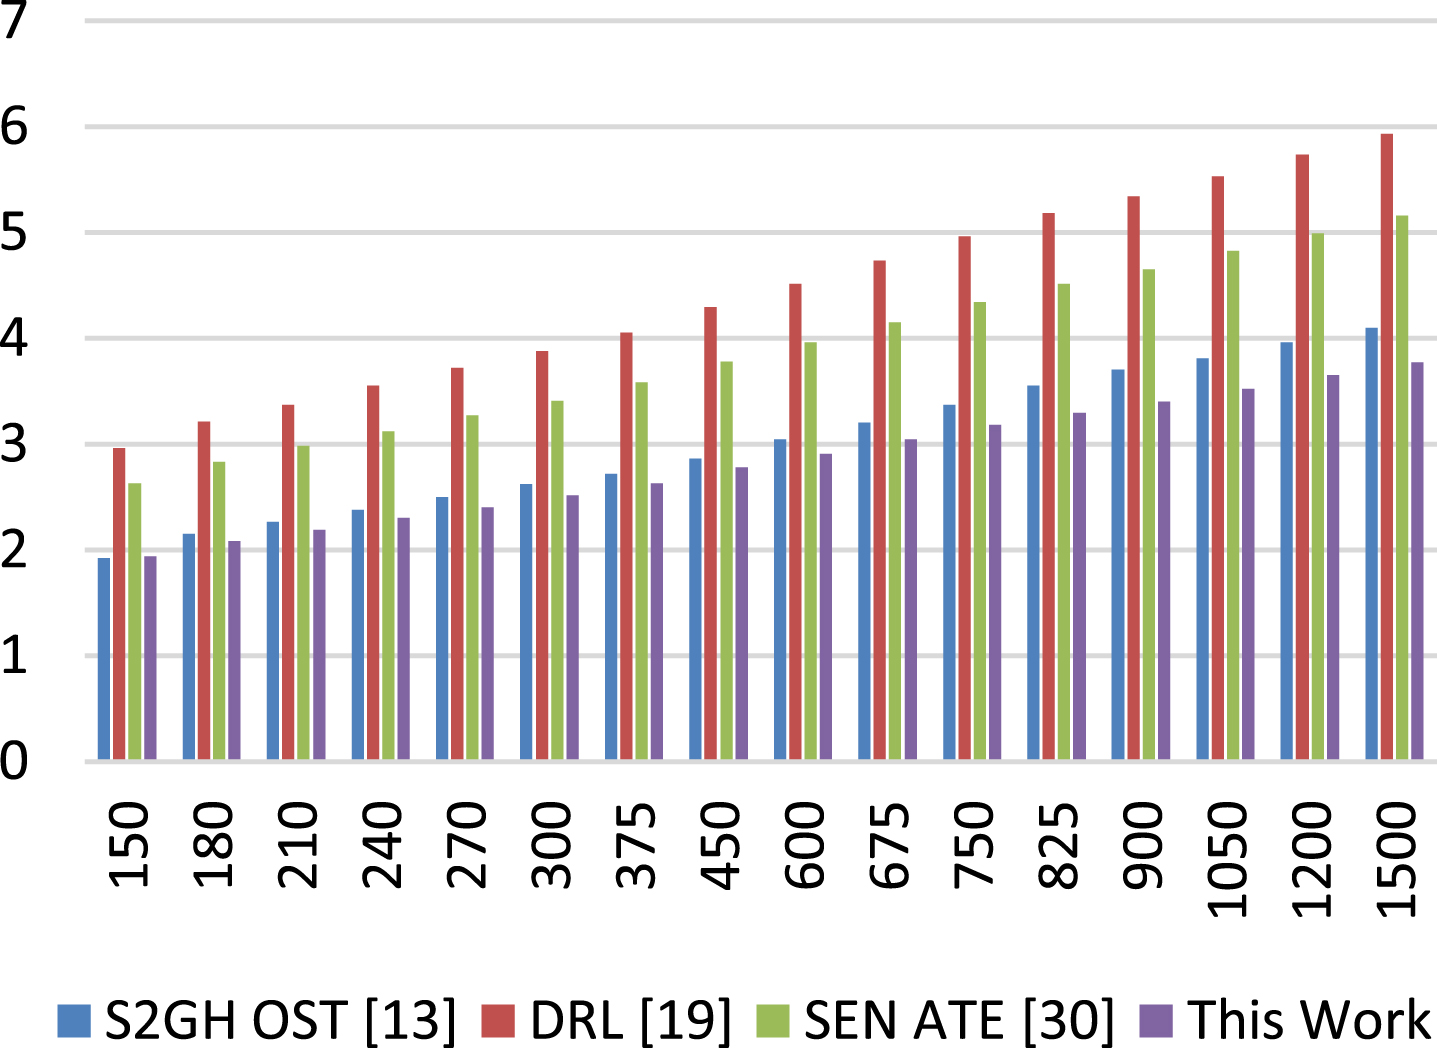
Energy consumed while communicating between 100 nodes.
Energy consumed while communicating between 500 nodes.
On the basis of this evaluation on a moderate network size, it can be seen that the proposed model exhibits 15.3% lower energy consumption than S2GH OST [13], 19.5% lower energy consumption than DRL [19], and 18.4% lower energy consumption than SEN ATE [30] under different communications. These results are based on the fact that the proposed model consumes less energy than S2GH OST [13], DRL [19], and SEN ATE [30]. This is because of the integration of residual energy as well as temporal energy consumption levels throughout the route selection and mining process, which enables better scalability performance to be maintained. On the basis of a comparable approach, the following may be seen about the energy consumption performance of 1000 nodes, which can be found in Table 9,
Energy consumed while communicating between 1000 nodes
The results of this evaluation on a large network size show that the proposed model exhibits 14.5% lower energy consumption than S2GH OST [13], 18.3% lower energy consumption than DRL [19], and 16.5% lower energy consumption than SEN ATE [30] under various communications. These results can be seen by observing that the proposed model consumes 14.5% less energy than S2GH OST [13]. This is because of the integration of residual energy as well as temporal energy consumption levels throughout the route selection and mining process, which enables better scalability performance to be maintained. The following may be noted for the average throughput performance for 100, 500, and 1000 nodes by consulting Table 10, which is based on a similar strategy under different scenarios,
Throughput obtained while communicating between different nodes
On the basis of this evaluation on small, medium, and large network sizes, it can be seen that the proposed model demonstrates 19.5% better throughput than S2GH OST [13], 19.8% better throughput than DRL [19], and 8.5% better throughput than SEN ATE [30] under various communications as shown in Fig. 5. These results are achieved by comparing the proposed model to S2GH OST [13], DRL [19], and SEN ATE [30]. This is because the temporal throughput levels have been included into the route selection and mining process, which has allowed for improved scalability performance to be maintained. The following is an analysis of the average Packet Delivery Ratio (PDR) performance for 100, 500, and 1000 nodes that is based on a similar method and can be found in Table 11,
Throughput obtained while communicating between different nodes.
Throughput obtained while communicating between different nodes
On the basis of this evaluation on small, medium, and large network sizes, it can be seen that the proposed model exhibits 6.5% better PDR than S2GH OST [13], 8.5% better PDR than DRL [19], and 5.9% better PDR than SEN ATE [30] under various communications as shown in Fig. 6. These results can be seen when comparing the proposed model to S2GH OST [13], DRL [19], and SEN ATE [30], respectively. This is because temporal PDR levels are included into the route selection and mining process. As a result, better levels of scalability performance are maintained. These assessments are expanded upon for a variety of different kinds of assaults and are summarized in the next portion of this article under real-time attack scenarios.
PDR obtained while communicating between different nodes.
For the purpose of implementing a greater level of security, the model makes use of sidechains. This enables the network to defend itself against a variety of attack types, such as Sybil, DDoS, MITM, Grey Hole, and so on. In this part, the number of attacker nodes was changed from 0.5 percent to 10 percent, and the quality-of-service performance was analyzed for a variety of attack methods. This performance was compared with S2GH OST [13], DRL [19], and SEN ATE [30], which facilitates in detection of performance increase when compared with other models. [13, 19], and [30] On the basis of this method, the delay in communication during a Sybil assault relative to looking at Table 12, you can see the following about the Number of Attacking Nodes (NAN),
Average end-to-end delay for security models (WH Attack)
Average end-to-end delay for security models (WH Attack)
The results of this assessment reveal that the suggested model has minimal delay levels in comparison to the S2GH OST [13], DRL [19], and SEN ATE [30] models. This can be seen by looking at the results of the evaluation. However, in the case of our deployment, the delay demonstrates a continuous trend, which makes it relevant for attack scenarios. This delay should rise during assaults; however, this does not happen. Similar findings were made for the MITM, and DDoS attack types based on the information in Table 13, as follows,
Delay needed for communication under different attacks
The results of this evaluation show that the proposed model exhibits lower delay levels when compared with the S2GH OST [13], DRL [19], and SEN ATE [30] models even when subjected to DDoS and MITM attack types. This observation is based on the fact that the proposed model showcases lower delay levels. This is as a result of the use of blockchain as well as sidechain models during the development of the underlying network for various use cases. Similar findings were observed with regard to the usage of energy under the Sybil, DDoS, and MITM attack types, as shown in Table 14 as follows,
Energy consumed during communication under different attacks
Based on this assessment, it can be shown that the suggested model has a reduced energy consumption when compared with S2GH OST [13], DRL [19], and SEN ATE [30] models even when subjected to Sybil, DDoS, and MITM attack types. This is something that can be noticed. This is as a result of the use of blockchain as well as sidechain models during the development of the underlying network for various use cases. Similar findings were observed with regard to throughput under Sybil, DDoS, and MITM attack types, as shown in Table 15, as follows,
Throughput of communication under different attacks
Based on the results of this assessment, it has been determined that the suggested model demonstrates a greater throughput in comparison to S2GH OST [13], DRL [19], and SEN ATE [30] models even when subjected to Sybil, DDoS, and MITM attack types. This is as a result of the use of blockchain as well as sidechain models during the development of the underlying network for various use cases. Similar findings were found for PDR under the Sybil, DDoS, and MITM attack types using Table 16, as is seen in the following tabulation sets,
PDR of communication under different attacks
In light of the results of this assessment, it is clear to see that the suggested model demonstrates a higher PDR in contrast to the S2GH OST [13], DRL [19], and SEN ATE [30] models even when subjected to Sybil, DDoS, and MITM attack types. This is as a result of the use of dynamic sidechain models during the deployment of the underlying network for a variety of use cases. These assessments are expanded for a variety of faults in the network, as can be shown in the next section, and the results may be examined for different scenarios.
Additionally, temporal characteristics are accounted for inside the model during the discovery of various route configurations. Because of this, the model is exceptionally adept at minimizing errors across a wide variety of network configurations. In this part, we analyze the performance of the model when subjected to a variety of node failures and compare it to the results obtained by the S2GH OST [13], DRL [19], and SEN ATE [30] models. In order to test this performance, a simulation of the network was run with 40% of its nodes failing, and the QoS performance of the network was calculated with regard to its latency, energy, throughput, and PDR levels. On the basis of this method, the transmission latency for various numbers of faults (NF) may be shown in the Table 17 as follows,
Communication delay needed under different fault conditions
Communication delay needed under different fault conditions
Based on this evaluation, it can be seen that the proposed model outperforms S2GH OST [13] by 19.5%, DRL [19] by 24.5%, and SEN ATE [30] by 28.5% in terms of communication delay. This enables it to be useful for a wide variety of real-time applications because it reduces the amount of time that it takes for information to be transmitted. Similar assessments are carried out with regard to the use of energy, and the results may be seen in Table 18 as follows,
Communication energy needed under different fault conditions
As a result of this evaluation, it is possible to see that the proposed model outperforms S2GH OST [13] by 16.5%, DRL [19] by 12.4%, and SEN ATE [30] by 18.5% in terms of energy consumption. This enables it to be utilized for a wide variety of real-time applications, which is a significant advantage. Comparable assessments are carried out with regard to the communication throughput, and the results may be shown in Table 19 as follows,
Communication throughput obtained under different fault conditions
On the basis of this study, it can be shown that the suggested model exceeds S2GH OST [13] by 30.2%, DRL [19] by 8.5%, and SEN ATE [30] by 19.5% in terms of throughput performance. As a result, it is applicable to a broad range of real-time applications, which is why it was developed. Evaluations of a like kind are carried out for the communication PDR, and the results may be shown in Table 20 as follows,
Communication PDR under different fault conditions
As a result of this study, it is possible to see that the suggested model exceeds S2GH OST [13] by 15.2%, DRL [19] by 23.5%, and SEN ATE [30] by 18.5% in terms of PDR performance. This enables it to be used for a broad range of real-time applications, which expands its potential uses. As a result, the fundamental FATMLPGS model enhances the quality of service (QoS) performance, attack resistance, and fault mitigation across a variety of node and network configurations. As a result of these improvements, it is applicable to a broad range of different real-time network deployment use cases.
In order to test the performance, a simulation of the network was run with 40% of its nodes failing, and the QoS performance of the network was calculated with regard to its delay, energy, throughput, and PDR levels. On the basis of this method, the transmission delay, under various types of security attacks is shown in the Table 21 as follows,
Communication delay recorded under different types of attack
Communication delay recorded under different types of attack
The results of this study shown in Fig. 7. proposed that the model exhibits lower delay levels when compared with the PB [13], TSF [19], and THS [30] models even when subjected to Sybil, eclipse, DDos routing, race and Parity & multisig parity attack.
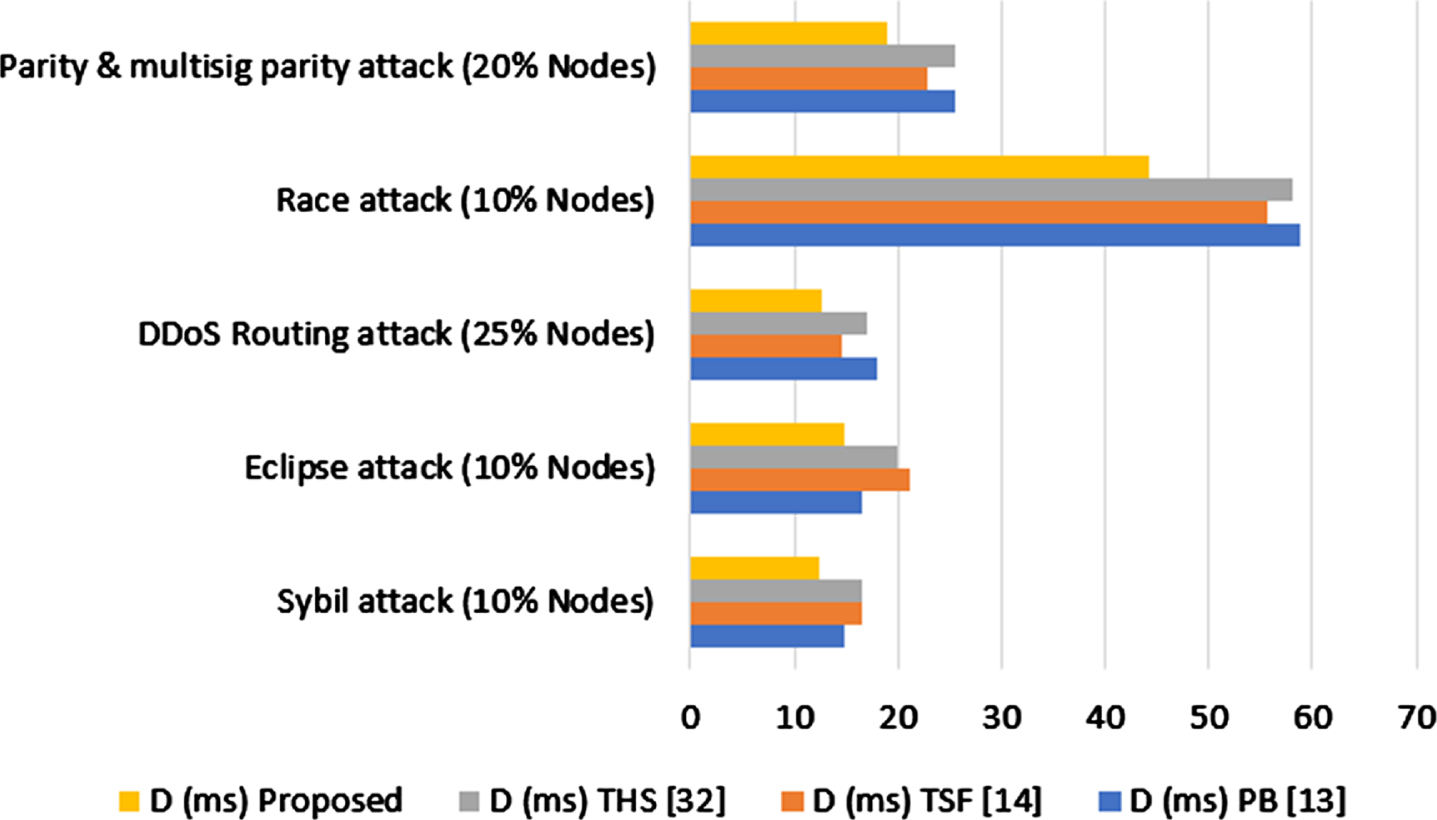
Delay among different types of security attacks.
Similar assessments are carried out with regard to the energy consumption under different types of security attack, and the results may be seen in Table 22 as follows.
Energy consumption under different types of attack
The results of this study shown in Fig. 8 proposed that the model exhibits lower energy levels when compared with the PB [13], TSF [19], and THS [30] models even when subjected to Sybil, eclipse, DDos routing, race and Parity & multisig parity attack.
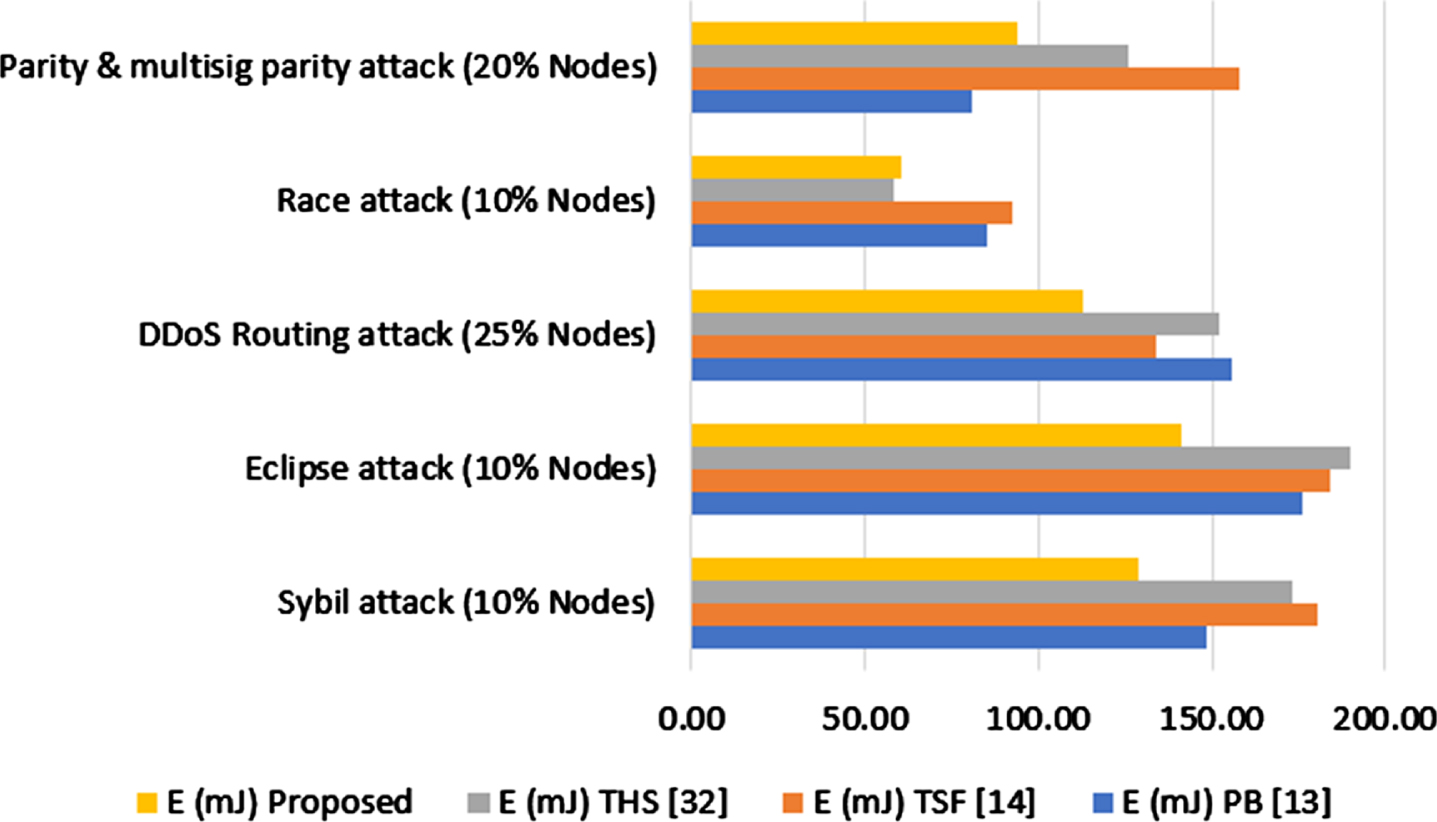
Energy Consumption under different types of security attacks.
Similar assessments are carried out with regard to the throughput under different types of security attack, and the results may be seen in Table 23 as follows.
Throughput under different types of attack
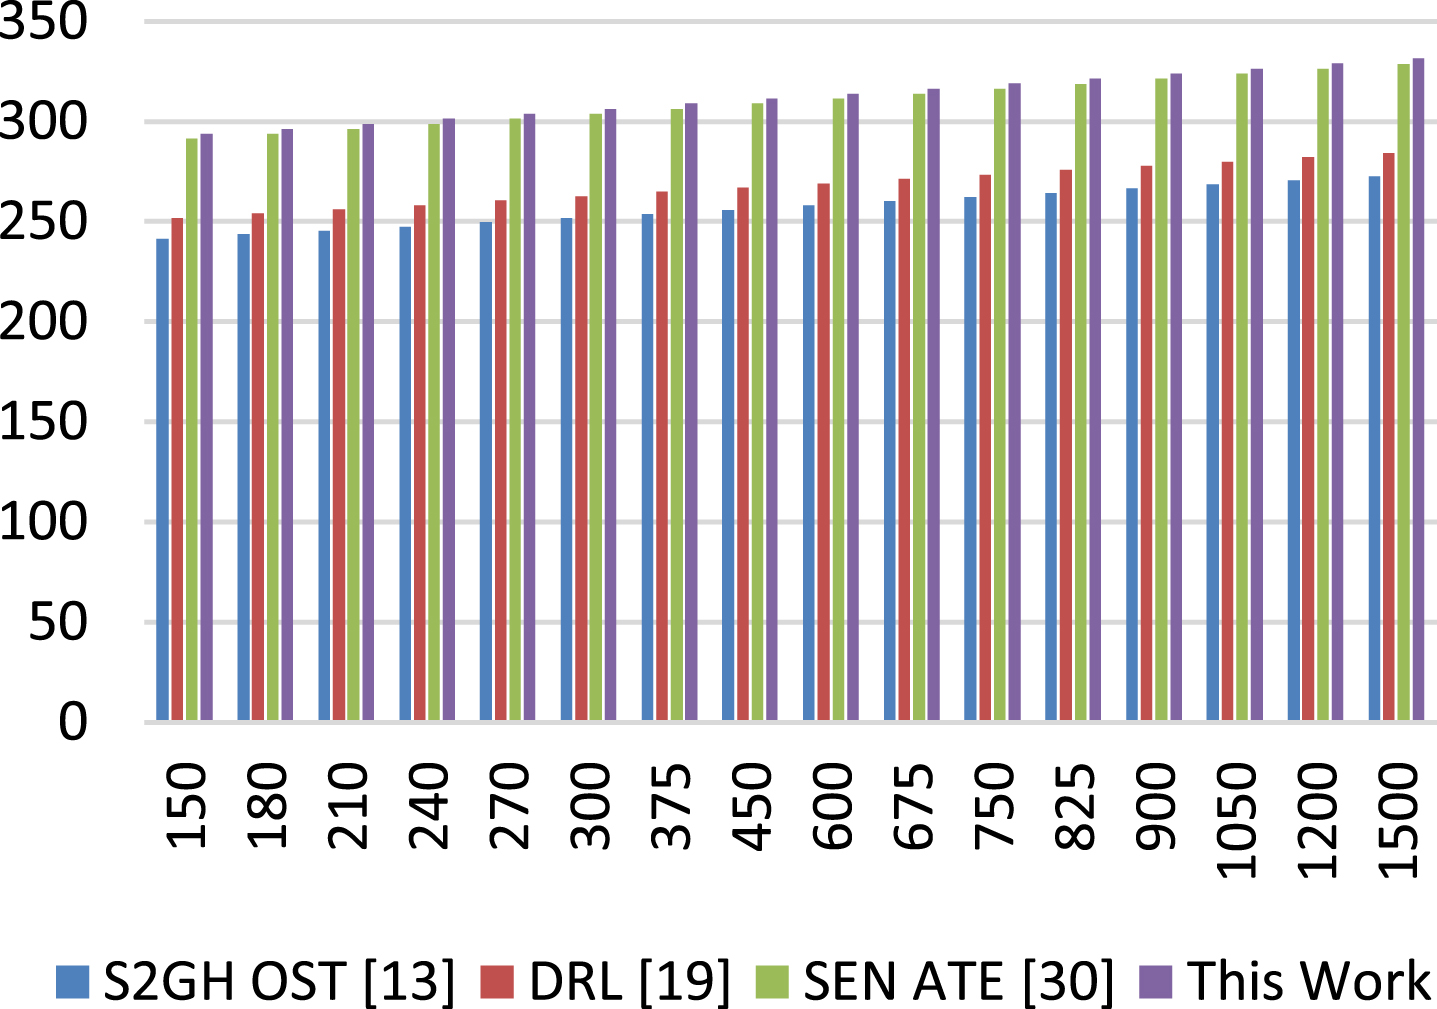
The results of this study shown in Fig. 9 proposed that the model exhibits higher throughput levels when compared with the PB [13], TSF [19], and THS [30] models even when subjected to Sybil, eclipse, DDos routing, race and Parity & multisig parity attack.
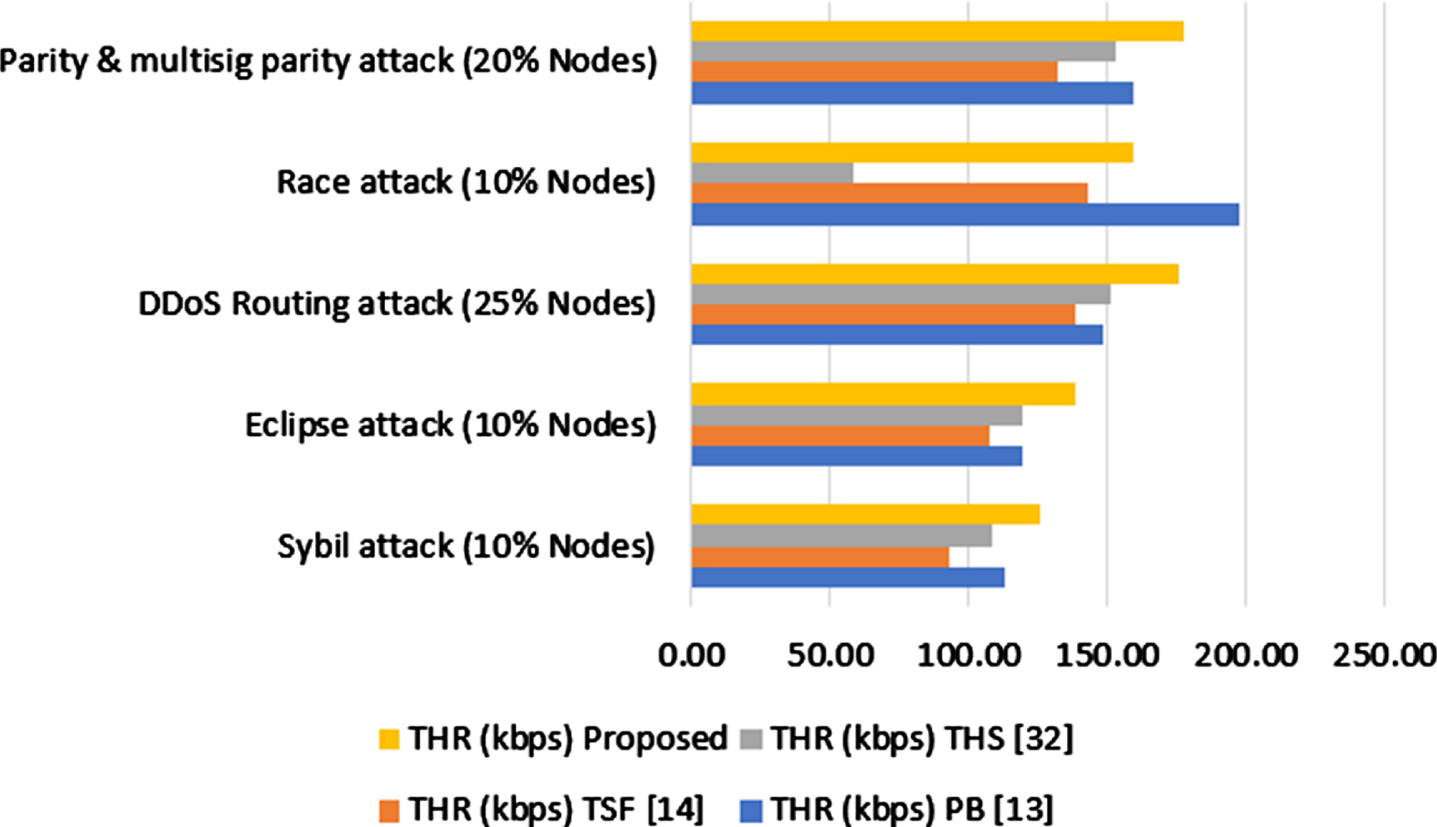
Throughput under different types of security attacks.
Similar assessments are carried out with regard to the PDR under different types of security attack, and the results may be seen in Table 24 as follows.
PDR under different types of attack
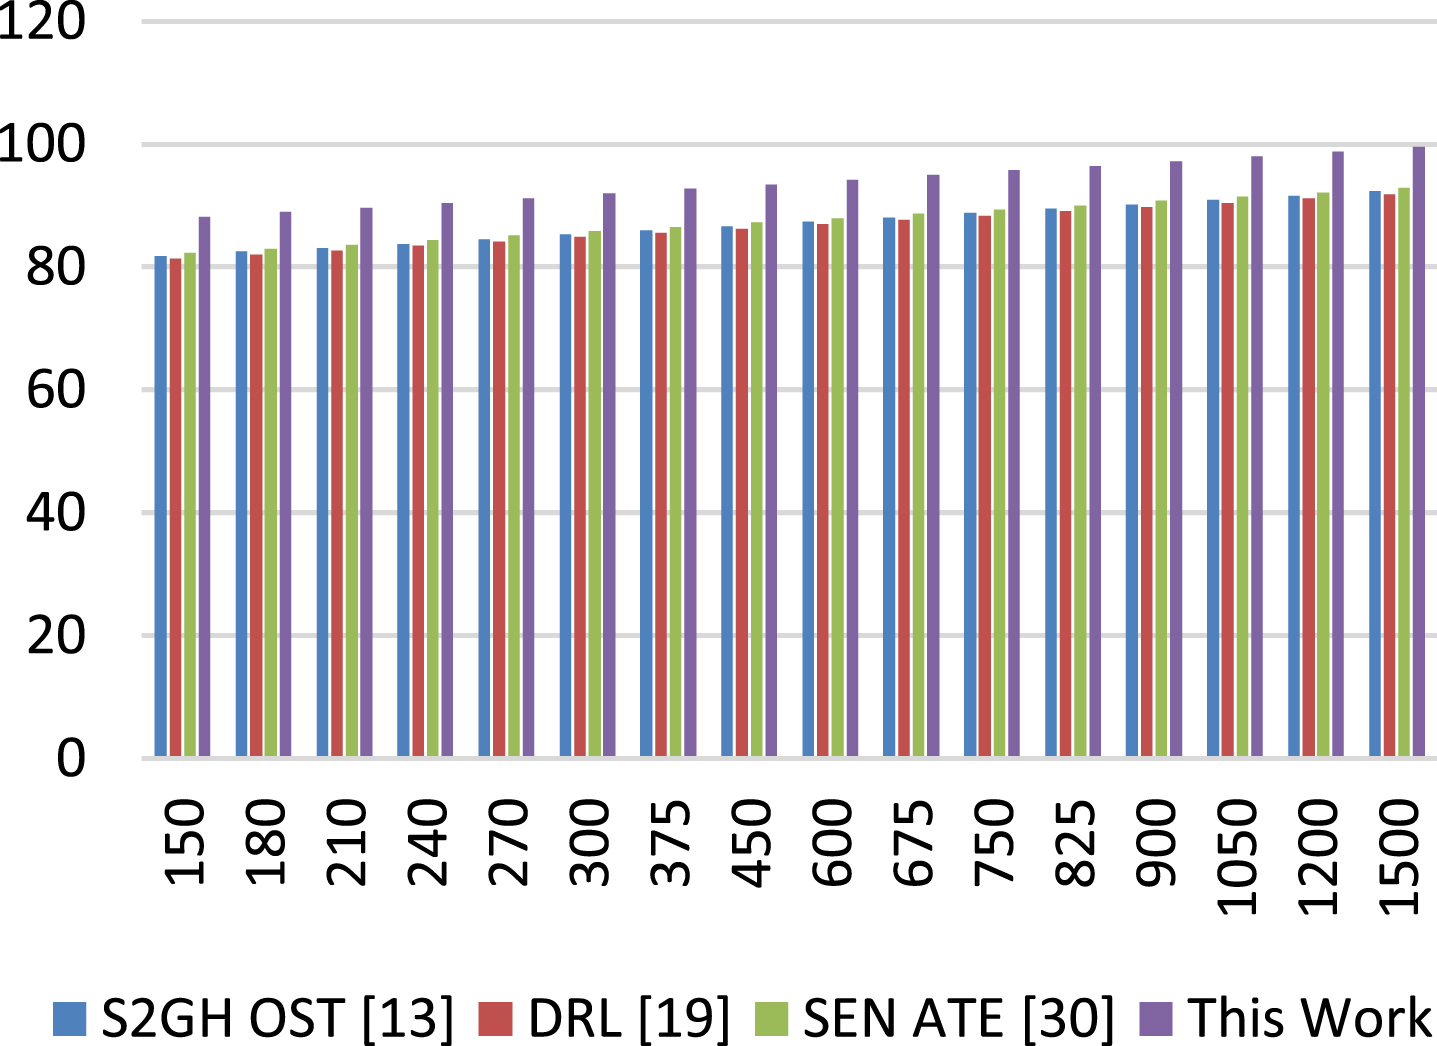
The results of this study shown in Fig. 10 proposed that the model exhibits higher PDR levels when compared with the PB [13], TSF [19], and THS [30] models even when subjected to Sybil, eclipse, DDos routing, race and Parity & multisig parity attack.

PDR under different types of security attacks.
The suggested model first utilizes a GWO based dense learning method to predict node configurations & sidechaining configurations for QoS & security aware performance. The model makes use of a lightweight genetic algorithm (GA) model, which supports in estimate of reconfiguration choices using correlation-based matching approaches. This is done so that the complexity of training may be reduced. This approach also helps in estimating fault-free pathways throughout the routing process, which is one of the many reasons why it is very beneficial for deploying real-time network infrastructure. The model will eventually include a Q-Learning strategy, which will help improve its performance by gradually upgrading its route and routing settings. This will be accomplished. When compared with other models, it was found that the suggested model had superior quality of service performance, stronger attack mitigation performance, and improved fault tolerance. It was discovered that the proposed model exhibited 5% less delay than S2GH OST [13], 14.5% less delay than DRL [19], and 18.4% less delay than SEN ATE [30]. Additionally, it exhibited 10.5% less energy consumption than S2GH OST [13], 16.3% less energy consumption than DRL [19], and 12.5% less energy consumption than SEN ATE [30]. Additionally, it exhibited 19.5% more throughput than S2GH OST [13], 19.8% more throughput This is because temporal PDR levels are included into the route selection and mining process. As a result, better levels of scalability performance are maintained. It can also be noticed that suggested model highlights reduced latency, low energy consumption, greater throughput, and higher PDR levels when compared with S2GH OST [13], DRL [19], and SEN ATE [30] models. However, in the case of our deployment, the delay demonstrates a continuous trend, which makes it relevant for attack scenarios. This delay should rise during assaults; however, this does not happen. The proposed model is also observed to have better fault tolerance performance, and it outperforms S2GH OST [13] by 19.5%, DRL [19] by 24.5%, and SEN ATE [30] by 28.5% in terms of communication delay, it also outperforms S2GH OST [13] by 16.5%, DRL [19] by 12.4%, and SEN ATE [30] by 18.5% in terms of energy consumption, while it outperforms S2GH OST [13] by 30.2%, DRL [19] by 8.5%, and SEN ATE [30] by 19.5% in terms of throughput performance, it also outperforms S2GH OST [13] by 15.2%, DRL [19] by 23.5%, and SEN ATE [30] by 18.5% in terms of PDR performance which makes it useful for a wide variety of real-time applications. As a result, the fundamental FATMLPGS model enhances the quality of service (QoS) performance, attack resistance, and fault mitigation across a variety of node and network configurations. As a result of these improvements, it is applicable to a broad range of different real-time network deployment situations. In the future, researchers will be able to improve the performance of this model by integrating reinforcement learning models with a modest level of complexity. They may also enhance model’s performance by integration of Convolutional Neural Networks (CNN), LSTM & GRU Models, which will aid in pre-emptive actions for higher performance under varied attack & fault levels.
Declarations
Ethics approval and consent to participate
While preparing this manuscript, it does not report on or involve the use of any animal or human data or tissue. Thus it is not applicable in this section.
Consent for publication
The manuscript does not contain data from any individual person. Hence it is not applicable in this Section.
Availability of data and materials
The datasets used and/or analyzed during the current study are available from the corresponding author on reasonable request.
Competing interests
The authors declare that they have no competing interests.
Funding
There is no funding Support from the third party.
Authors’ contributions
While preparing this manuscript Ashutosh Kumar Choudhary has done the simulation and analysis work while Surendra Rahamatkar has done result and analysis part.