
Abstract
The fuzzy c-mean (FCM) clustering algorithm is a typical algorithm using Euclidean distance for data clustering and it is also one of the most popular fuzzy clustering algorithms. However, FCM does not perform well in noisy environments due to its possible constraints. To improve the clustering accuracy of item varieties, an improved fuzzy c-mean (IFCM) clustering algorithm is proposed in this paper. IFCM uses the Euclidean distance function as a new distance measure which can give small weights to noisy data and large weights to compact data. FCM, possibilistic C-means (PCM) clustering, possibilistic fuzzy C-means (PFCM) clustering and IFCM are run to compare their clustering effects on several data samples. The clustering accuracies of IFCM in five datasets IRIS, IRIS3D, IRIS2D, Wine, Meat and Apple achieve 92.7%, 92.0%, 90.7%, 81.5%, 94.2% and 88.0% respectively, which are the highest among the four algorithms. The final simulation results show that IFCM has better robustness, higher clustering accuracy and better clustering centers, and it can successfully cluster item varieties.
Introduction
As a significant branch of pattern recognition [1], the basic idea of cluster analysis is to divide data into several classes based on the properties of each other and the data should be as similar as possible in the same cluster and as different as possible in other clusters [2]. However, in practical problems, events are often accompanied by ambiguity and there are usually no clear boundaries between things. So fuzzy clustering can more effectively reflect the objective world and it is extensively applied in many scientific studies such as image recognition [3–6], machine vision [7–9] and text recognition [10–12].
The fuzzy clustering algorithm uses the distance measure function to calculate the distances from each sample data point to the clustering centers, so as to divide the sample data point into different clusters. Therefore, selecting a suitable distance measure function to apply to the fuzzy clustering algorithm can greatly improve the clustering performance of the algorithm.
However, considering the large amount of data on the network, the traditional fuzzy clustering algorithm cannot always present the classification results with high accuracy. To improve the clustering accuracy of data samples, in this study, an improved FCM clustering (IFCM) algorithm is proposed. IFCM replaces the Euclidean distance in the original algorithm with a Euclidean distance function. The Euclidean distance function can give small weights to noisy data and large weights to compact data so as to successfully restrain the interference of noisy data and achieve better clustering results. We carried out clustering tests on a few datasets and proved that the IFCM clustering algorithm can effectively classify data with high accuracy.
The remaining sections of this paper are organized as follows. A literature review of the formation and development of fuzzy clustering is provided in Section 2. Section 3 briefly introduces some clustering algorithms. In section 4, the IFCM clustering algorithm is proposed. Section 5 carries out clustering experiments and describes the results. Finally, we make a summary and put forward further research in section 5.
Literature review
In 1966, Bellman, Kalaba and Zadeh first introduced the concept of fuzzy sets into the clustering algorithms [13]. In 1970, Ruspini first systematically proposed the fuzzy clustering algorithm based on minimizing a fuzzy objective function [14]. In 1987, Bezdek introduced the concept of the weighted index in membership degree and proved the convergence of fuzzy C-means (FCM) clustering [15], and thus the FCM algorithm has developed rapidly. However, FCM has a disadvantage which is its sensitivity to noisy data. To overcome this shortcoming of FCM, Krishnapuram and Keller abandoned the probability constraints of FCM and constructed the possibilistic C-means (PCM) clustering [16]. PCM can cluster data containing noisy points or outliers, but PCM requires suitable initial cluster centers. Otherwise, it will lead to consistent clusters. In 2005, Pal et al. put forward possibilistic fuzzy C-means (PFCM) clustering based on the respective advantages of the FCM and PCM [17]. Unfortunately, the PFCM can not always maintain excellent clustering performance, especially when the cluster size varies.
The distance measurement in the FCM algorithm is usually measured by Euclidean distance. When the sample space is within three dimensions, the Euclidean distance is the real distance from the sample points to the cluster centers. However, when feature similarity is high, using Euclidean distance will magnify the effect of these features and lead to the reduction of clustering efficiency [18]. As a result, scholars have replaced the Euclidean distance in traditional FCM with different distance metrics, resulting in some improved algorithms [19–22]. In 2020, Gosain et al. attempted to use the Minkowski distance to solve the deficiency of FCM. They introduced an improved fuzzy possibilistic C-means (IFPCM) algorithm and applied this distance to FCM as well and demonstrated that the Minkowski distance remained effective coverage for convex data and multidimensional datasets [23]. IFPCM is robust to noisy and missing values and has fewer iteration numbers when processing data samples. In 2021, Zhao et al. proposed a general FCM clustering algorithm based on contraction mapping (cGFCM) which could be applied to the more general cases of using the Minkowski metric as the similarity measure [24]. The results showed that cGFCM could produce the highest accuracy and F-score compared with the other clustering algorithms. In 2022, Gao et al. designed an adaptive elastic distance based on membership and applied it to elastic fuzzy C-means (EFCM) to better identify intrinsic cluster structures. The adaptive elastic distance is like an elastic net that adaptively finds reliable points [25].
Related work
In this section, we briefly introduce FCM, PCM and
PFCM algorithms for comparison in this paper.
FCM clustering
Given an unlabeled data set X ={ x1, x2, …, x
n
} ⊂R
P
, FCM divides X into c (1 < c < n) fuzzy subsets by minimizing the following objective function:
PCM relaxes the normalization condition of fuzzy membership degree and specifies t
ik
∈ [0, 1], which solves the problem of FCM algorithm sensitivity to noise. In FCM, u
ik
represents the fuzzy membership degree of sample x
k
to the cluster center v
i
, while t
ik
generated by PCM represents the typical value of sample x
k
to the cluster center v
i
. Given an unlabeled data set X = { x1, x2, …, x
n
} ⊂ R
P
, the objective function of PCM is shown as follows:
Where T = [t
ik
] c×n is the typical value matrix. The typical value t
ik
is between 0 and 1. w (1 < w < ∞) is the weight index. γ
i
is the penalty parameter:
Here, K is usually chosen to be 1. γ i is generally obtained by using the training results of FCM when setting the initial value of PCM algorithm.
The minimum values of parameters t
ik
and v
i
of Equation (4) are calculated by gradient method, and the iterative formulas of t
ik
and v
i
are as follows:
PFCM combines PCM and FCM to better identify data clusters by generating fuzzy membership and typical values, so it has a better clustering effect than them. Given an unlabeled data set X ={ x1, x2, …, x n } ⊂R P , the objective function of PFCM is shown as follows:
Where U = [u
ik
] c×n and T = [t
ik
] c×n respectively represent the fuzzy membership matrix and typical value matrix. The fuzzy membership u
ik
and typical value t
ik
are between 0 and 1. The fuzzy weight indexes m, w > 1 and coefficients a, b > 0. γ
i
is the penalty parameter of Equation (5) and calculated by running FCM. The fuzzy membership u
ik
, typical value t
ik
and cluster centers v
i
can be described as follows by minimizing the objective function:
A new distance metric
The traditional FCM usually uses Euclidean distance, but its clustering effect is poor in a noisy environment. In this section, we define a Euclidean distance function d (x, y) that gives less weight to noisy data and more weight to normal data, making the mean value more robust.
Where ρ (ρ > 0) is a coefficient and we know that one distance metric d (x, y) should satisfy the following three conditions [26]:
To make the proof easier, we set
Thus d (x, y) ⩽ d (x, z) + d (z, y), Equation (15) is verified and we can claim that the Euclidean distance function is a metric.
The Euclidean distance in FCM objective function is replaced by the functional form of Euclidean distance. Given an unlabeled data set X = {x1, x2, …, x
n
} ⊂R
P
, the objective function of IFCM is as follows:
Where V = {v1, v2, …, v
c
} is the cluster center matrix; v
i
is the value of the ith cluster center. U = [u
ik
] c×n is the fuzzy membership value matrix where u
ik
is the membership value of data x
k
belonging to the cluster center v
i
. c is the number of clusters, and n is the number of clustered data. m (1 < m < ∞) is the weight index. The coefficient ρ in Equation (12) is replaced by the covariance of the samples σ2.
The Lagrangian equation of Equation (17) is constructed.
Take the partial derivative with respect to α:
Solving Equation (20) can obtain the following equation:
Take the partial derivative with respect to u ik :
Solution of Equation (22) can obtain the following equation:
Using the Equation (21), we can get the following equation:
Solution of Equation (24) can obtain the equation about
Putting Equation (25) into Equation (23), we can get the formula of u
ik
:
Take the partial derivative with respect to v i :
Simplifying Equation (27) can obtain the following equation:
Based on Equation (19), we can get the formula of v
i
:
The specific algorithm steps of IFCM are described as follows:
Initialization
(1) Fix m and c, n > c > 1, + ∞ > m > 1;
(2) Set the initial value of the cycle r = 1, the maximum number of cycles rmax and the iteration threshold ɛ (ɛ > 0);
(3) Select the initial cluster centers V(0).
Repeat
Step 1:Update membership value U(r) by Equation (26).
Step 2:Update cluster centers V(r) by Equation (29).
Until (∥ V(r) - V(r-1) ∥ < ɛ) or r > rmax, the iteration comes to an end; otherwise r = r + 1, and return to Step 1.
In this section, we run FCM, PCM, PFCM and IFCM on two different datasets: an artificial dataset and some real datasets. The advantages of IFCM are verified by comparison from four aspects: clustering accuracy, cluster centers, iteration times and computing time.
Experimental environment
All algorithms are run under the environment shown in Table 1. We firstly set the iteration threshold ɛ = 0.00001 and the maximum iteration number γmax = 100.
Experiment environment
Experiment environment
X12 data set
X12 is an artificial two-dimensional dataset [17]. It has twelve data points including ten normal data points and two noisy data points (x6 and x12). The normal data points form two diamonds on either side of the y-axis and the noisy points have the same distance from the centers of the two classes. The coordinate diagram of X12 is shown in Fig. 1.
Set m = 2.0, w = 2.0, a = 1.0, b = 1.0, and the initialization cluster centers are [17]:
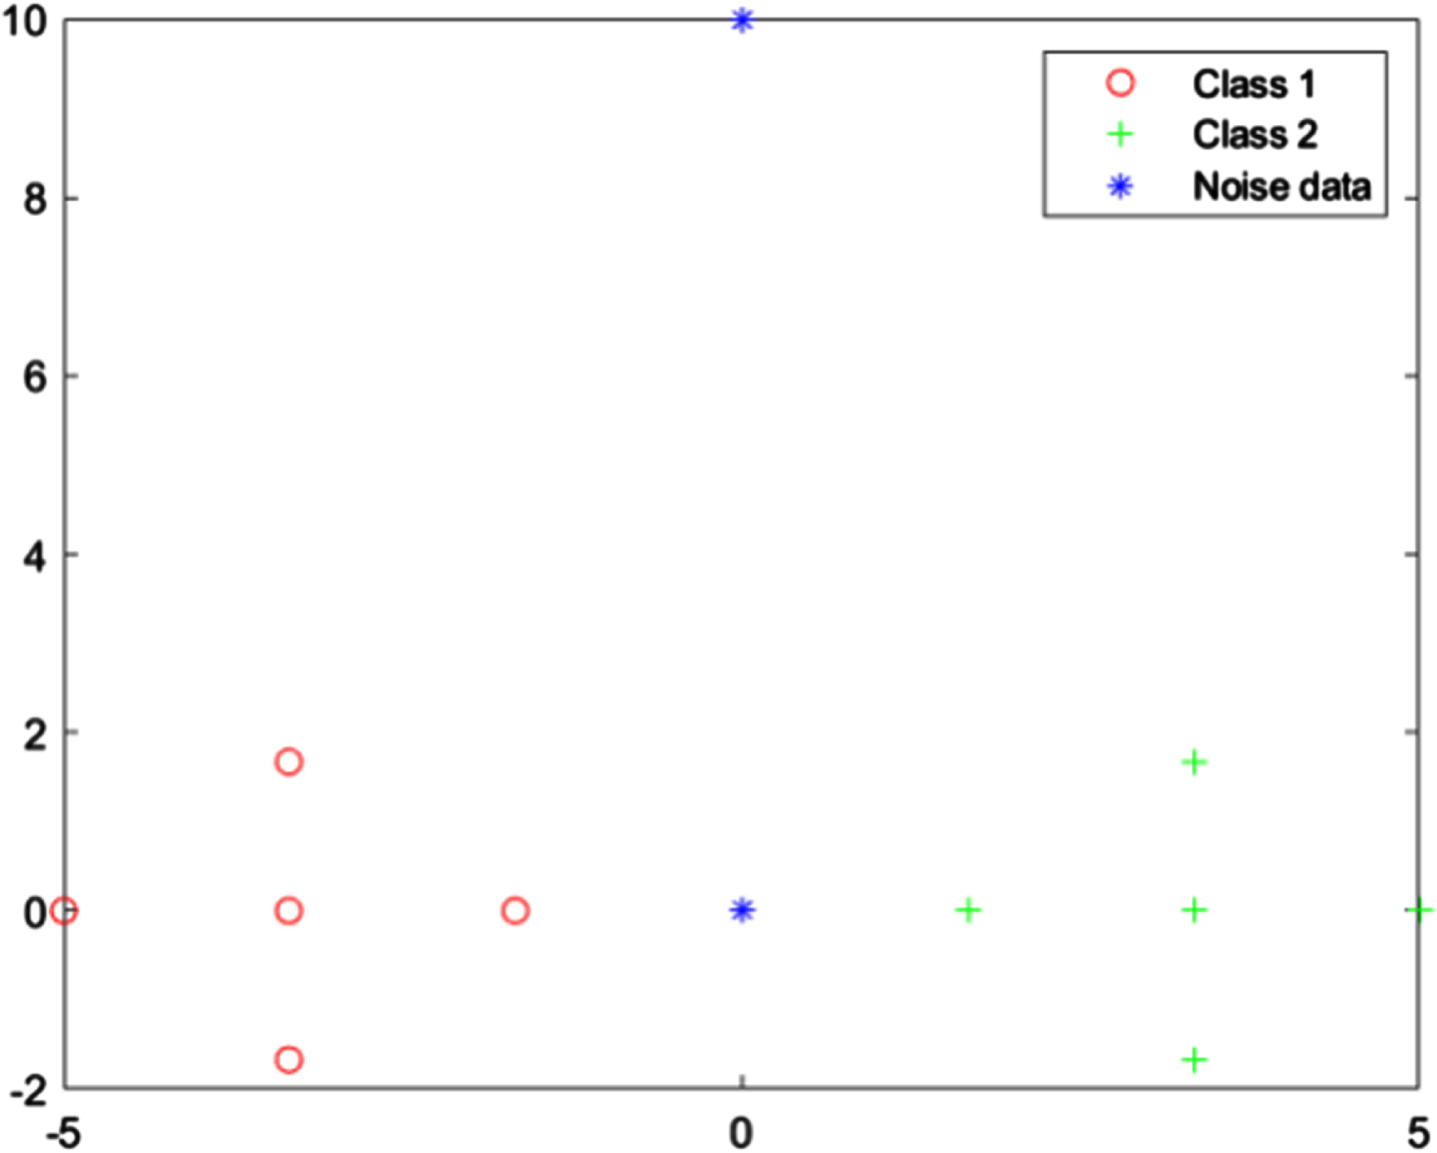
The distribution of data points in X12.
Table 2 shows the fuzzy membership values of FCM and IFCM. IFCM doesn’t release the restriction
The fuzzy membership values of FCM and IFCM on X12 data set
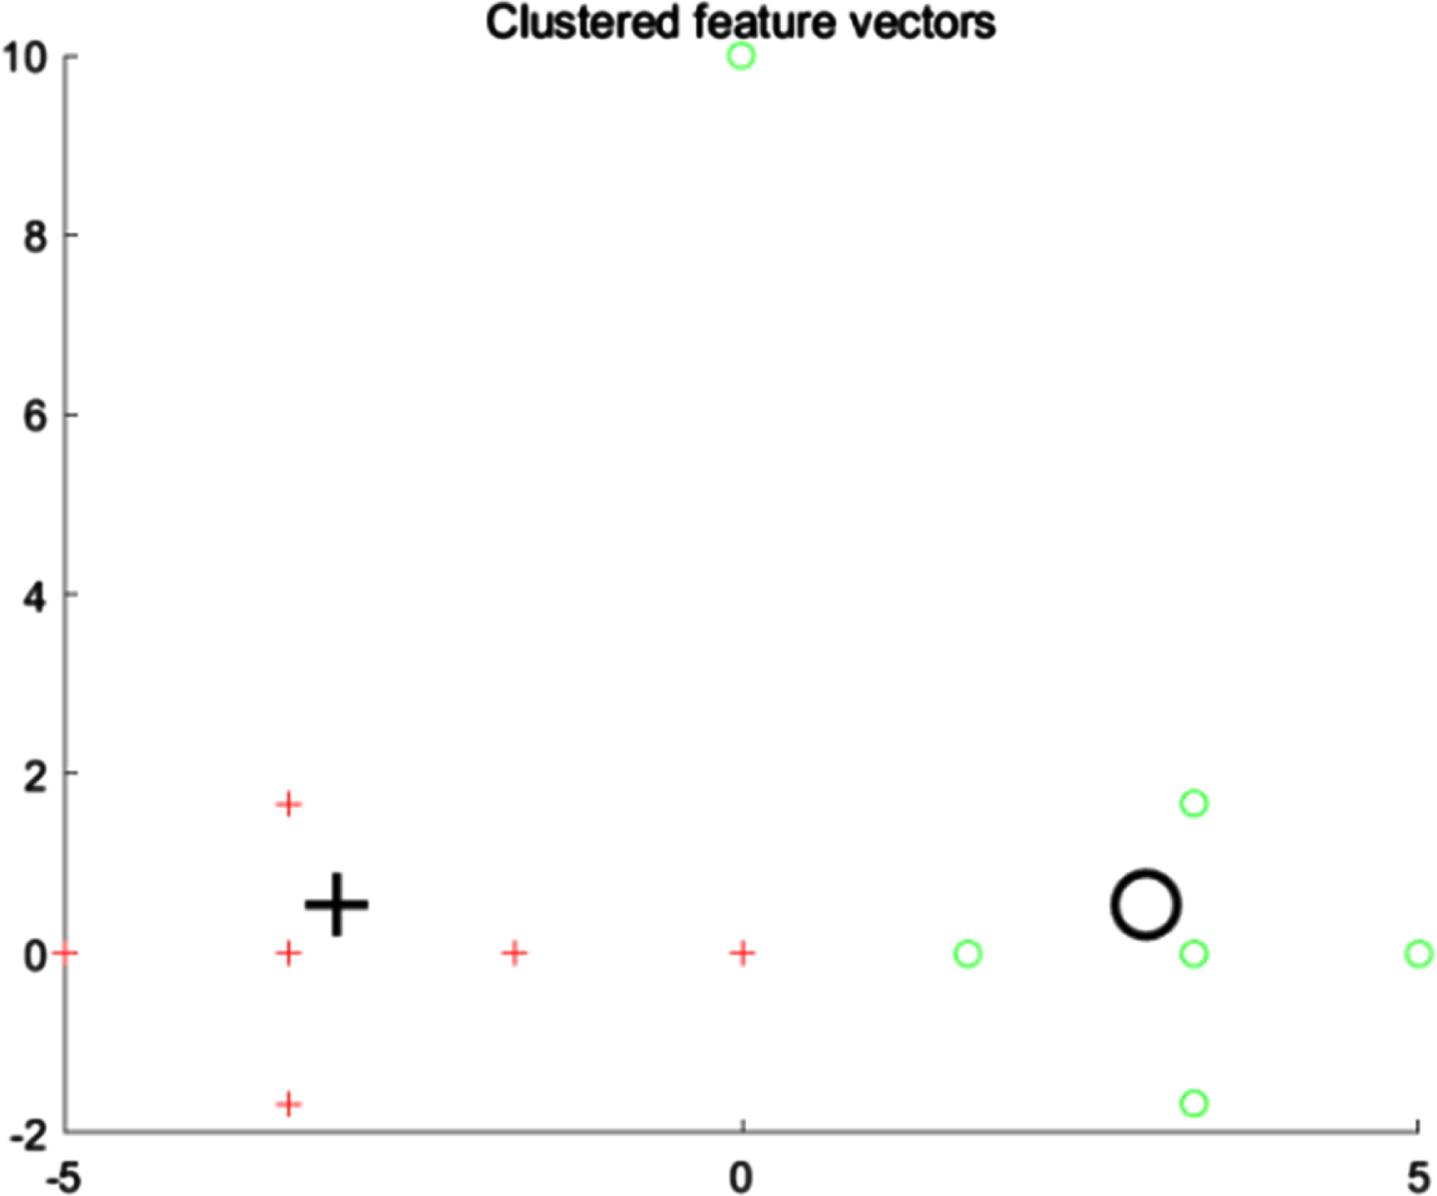
Cluster centers of FCM on X12 data set.
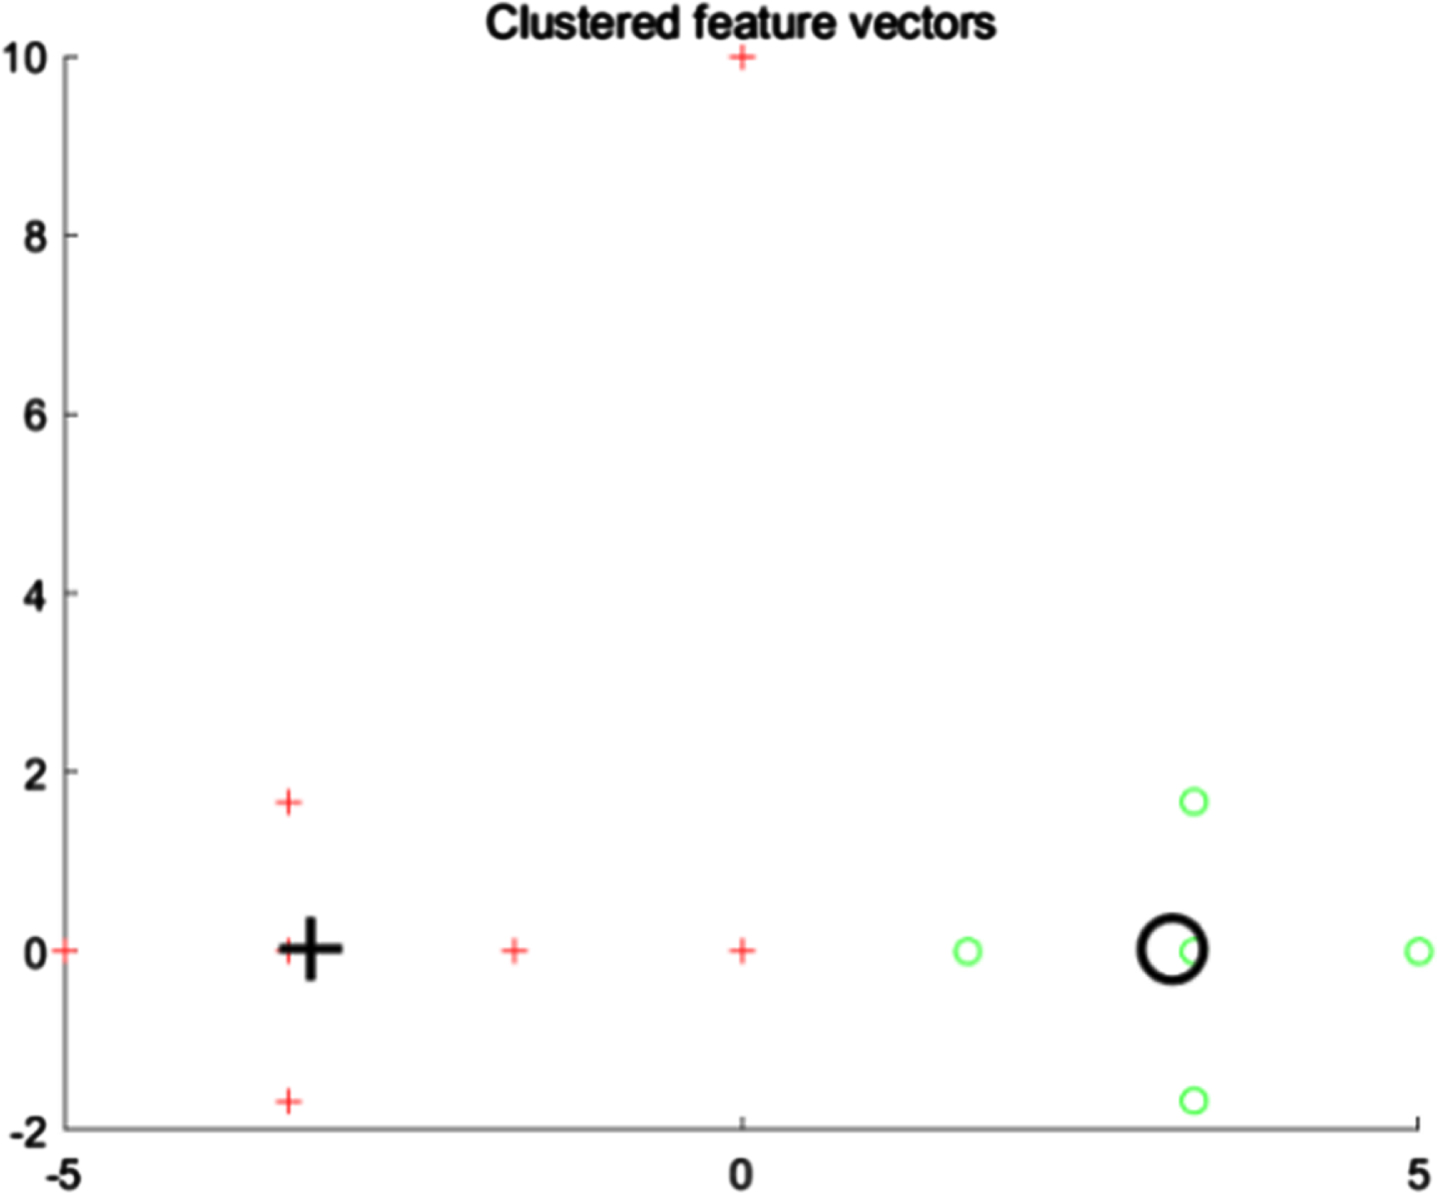
Cluster centers of IFCM on X12 data set.
Table 3 shows the cluster centers obtained by clustering X12 with FCM, PCM, PFCM and IFCM. And the real cluster centers of the X12 dataset are:
The cluster centers from FCM, PCM, PFCM and IFCM on X12 data set
The results of the three cluster algorithms are compared by calculating the distances between the three final cluster centers and the real cluster centers using the following formula [17]:
Where the mark ‘*’ represents FCM, PCM, PFCM and IFCM. The calculation results: E FCM = 0.4141, E PCM = 1.4165, E PFCM = 0.3897, E IFCM = 0.0260. Obviously, the smaller E* means the cluster centers are closer to the real cluster centers, so IFCM has the best cluster centers and PCM has the worst ones.
We change the weight index m to prove that IFCM has a better clustering effect on the noisy data. The terminal cluster centers and their distances from the real cluster centers are shown in Table 4. We can see that IFCM always has a smaller distance than FCM, PCM and the PFCM in all cases. As m increases, the distance becomes smaller and smaller which means that the cluster centers become better and better.
The cluster centers of IFCM and distances with different values of m on X12 data set
X20 is a dataset containing two clusters (9 data points per cluster) and two noisy points (x19 and x20). The data points of the two clusters form a rectangle with the same shape distributed on both sides of the y-axis. The two noise points are located on the y-axis and x19 is further away from them. The coordinate distribution of X20 is shown in Fig. 4.
Set m = 2.0, w = 2.0, a = 1.0, b = 1.0, and the initialization cluster centers are:
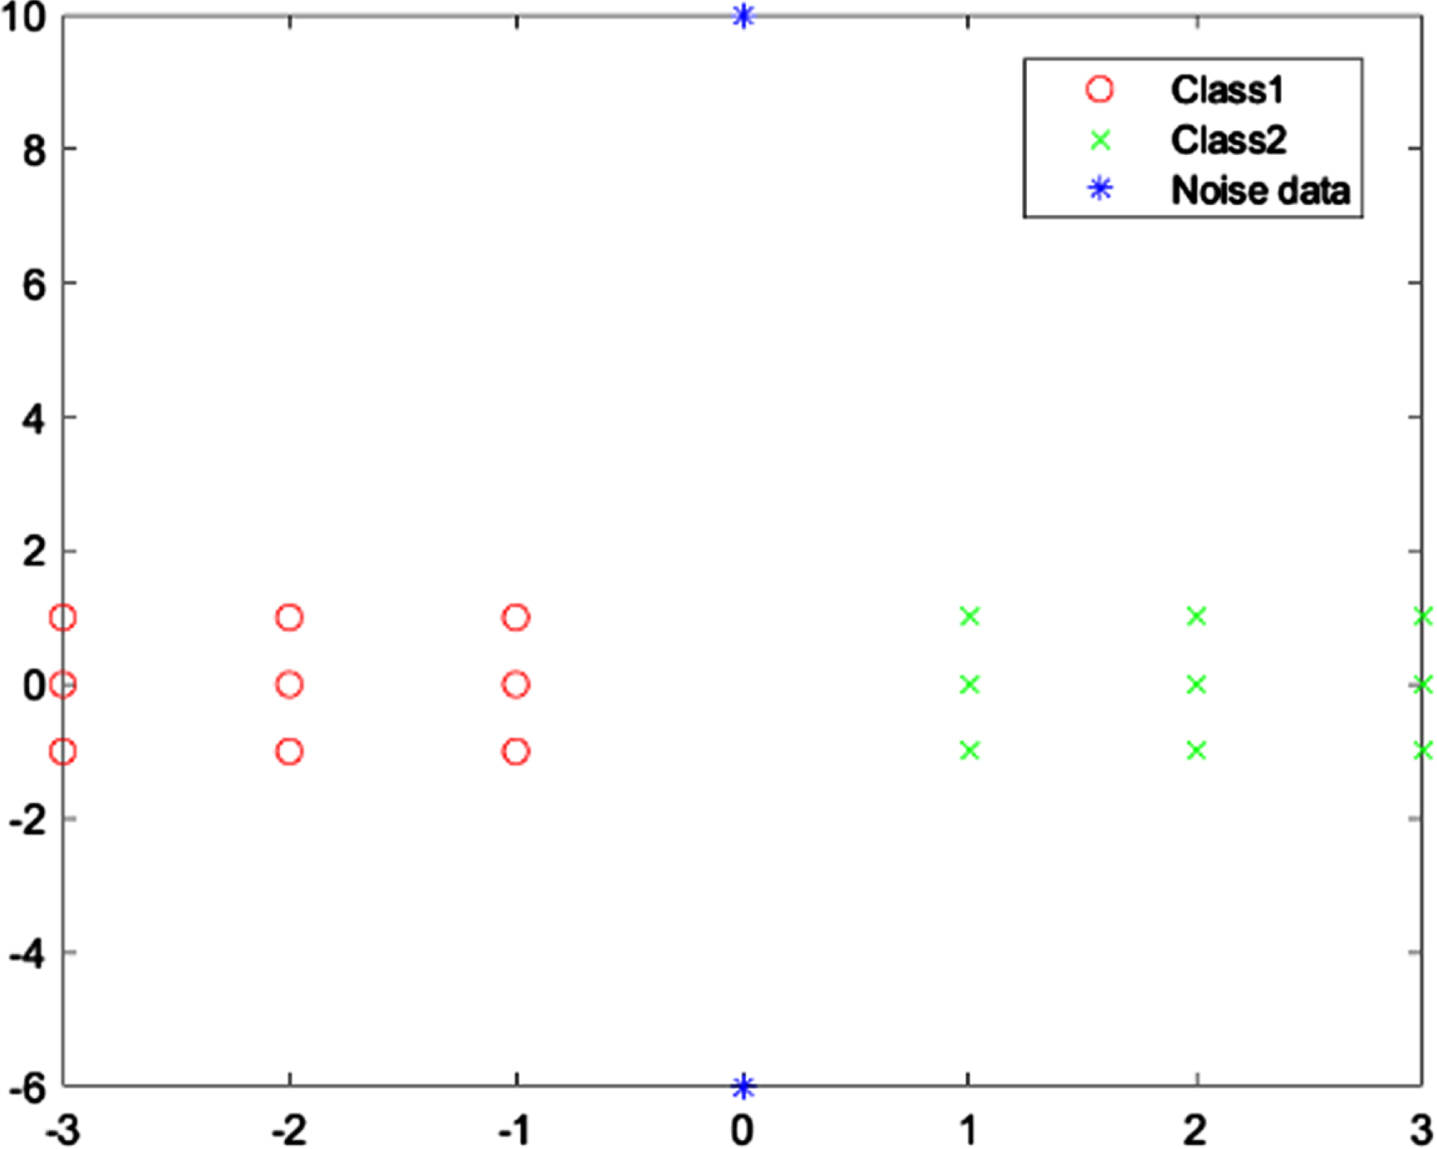
The distribution of data points in X20.
Table 5 shows the fuzzy membership values obtained by running FCM and IFCM on the X20 dataset. Although the IFCM has fewer fuzzy membership value for the data points in a cluster than FCM, it gives the highest membership value of 1 for the cluster centers (x5 and x14). So, the final cluster centers of IFCM are closer to the real centers. Figure 5 and Fig. 6 respectively show the cluster centers of FCM and IFCM on the X20 dataset. The final cluster centers generated by FCM, PCM, PFCM and IFCM are shown in Table 6.
The fuzzy membership values of FCM and IFCM on X20 data set
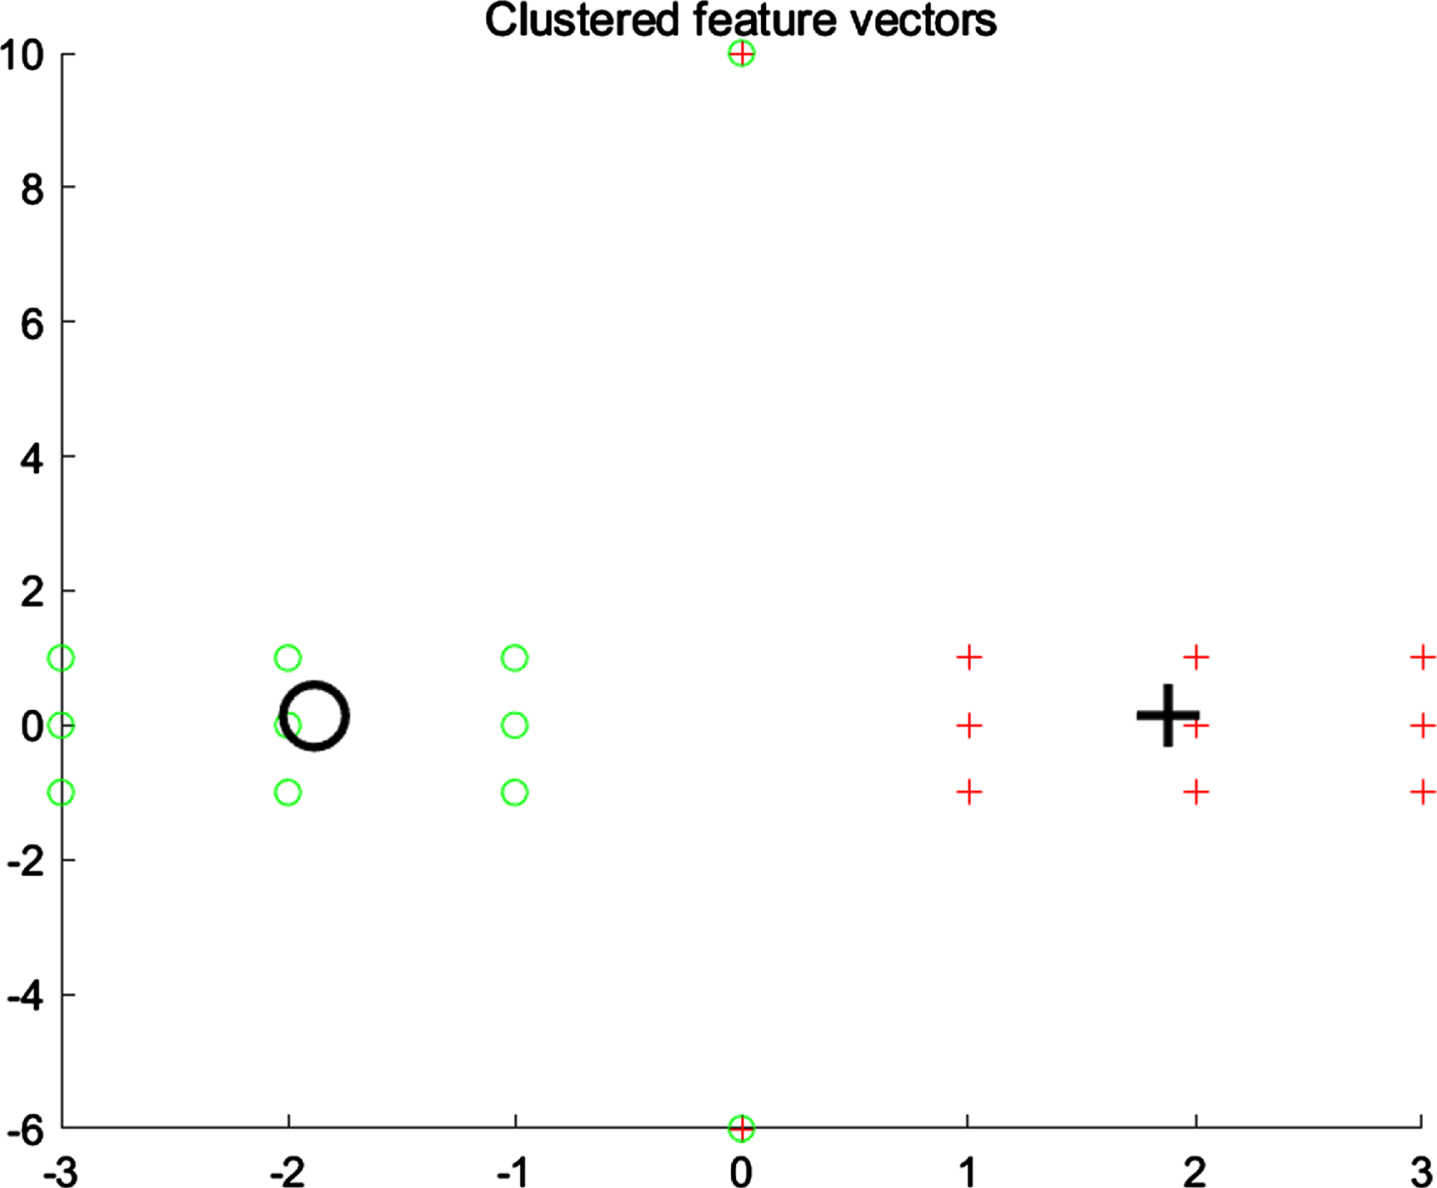
Cluster centers of FCM on X20 data set.
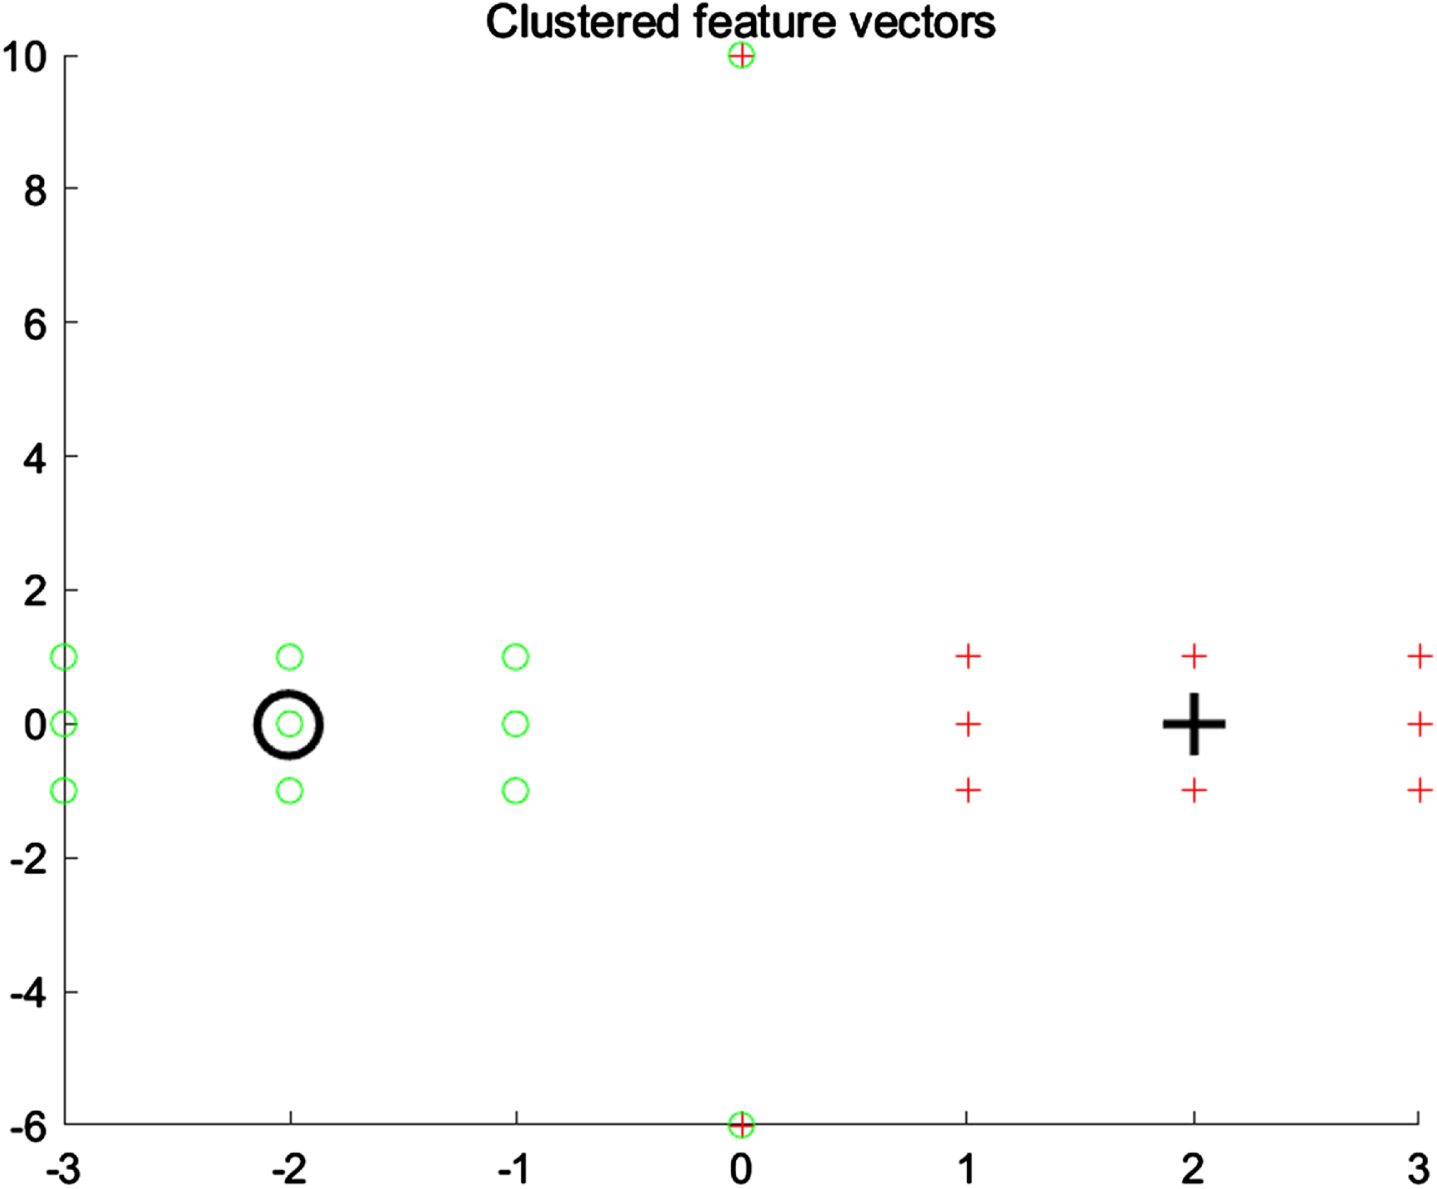
Cluster centers of IFCM on X20 data set.
The cluster centers from FCM, PCM, PFCM and IFCM on X20 data set
The real cluster centers of the X20 dataset are:
Equation (32) is applied to calculate the distance from the terminal cluster centers of FCM, PCM, PFCM and IFCM to the real cluster centers of the X20 dataset. By calculating, the distances of FCM, PCM, PFCM, IFCM respectively are 0.0392, 28800, 0.2450 and 0.0002, so E IFCM < E FCM < E PFCM < E PCM . This indicates that IFCM is the least affected by noisy data points and its cluster centers are closer to the true centers.
To prove that IFCM has a better clustering effect on the X20 data, the weight index m is also changed. Table 7 shows the terminal cluster centers and their distances from the real cluster centers with different values of m. Although the distances of the IFCM on X20 do not decrease with the increase of m as it does on X12, its maximum value of 0.0020 is still smaller than the other three algorithms.
The cluster centers of IFCM and distances with different values of m on X20 data set
Data introduction
(1) The IRIS dataset [27] has 150 data samples divided equally into three categories (Setosa, Versicolour and Virginica) with four attributes: calyx Length, width and petal length, width. (2) The Wine dataset has three categories of 59, 71 and 48 data samples respectively [28]. The total phenol data for attribute 7 and the proanthocyanins data for attributes 10 are selected for clustering analysis. (3) The spectra of Meat data are collected using Monitir Fourier transform infrared (FTIR) spectrometer system and all spectra are in the region of 1000∼1800 cm- 1 [29, 30]. The dataset contains FTIR spectral data of three different kinds of fresh meat including chicken, pork and turkey and each kind of meat has 40 samples. (4) The apple data set has four different varieties (Fuji, Huaniu, Gala and Huangjiao) with spectra ranging from 10000 to 4000 cm- 1 [31]. To reduce the error, the average value of the data collected three times is used as the final experimental data. The collected apple dataset is 1557 dimensions. The detailed properties of the four datasets are shown in Table 8.
The detailed properties of four datasets
The detailed properties of four datasets
First of all, we make the experiments by running FCM, PCM, PFCM and IFCM on the IRIS dataset. The coefficients are set as a = 4, b = 3. The initial cluster centers are:
Because PCM is susceptible to the initial cluster centers, we choose the final cluster centers obtained by running the FCM as the initial cluster centers of PCM. Table 9 shows the misclassification numbers from FCM, PCM, PFCM and IFCM on the IRIS data-set. The weight index m and w are changed to observe more situations. From Table 9, we can see that although PCM has appropriate initial cluster centers, it still leads to a consistent cluster, with the misclassification numbers from its typical value (T) remaining at 100. When m = 2, the fuzzy membership (U) from IFCM has the maximum misclassification numbers. And when mincreases to 2.5, its misclassification numbers reach the minimum value of 11, but the numbers of IFCM stabilize at 12 with m increasing again. By calculating, the clustering accuracies of IFCM are between 90% and 92.67% higher than those of FCM, PCM and PFCM.
The numbers of misclassification from FCM, PCM, PFCM and IFCM on IRIS data
Secondly, we use principal component analysis (PCA) [32] to reduce the dimensionality of the IRIS dataset to three. The scores plot of PC1, PC2 and PC3 are shown in Fig. 7. The first principal component (PC1), the second principal component (PC2) and the third principal component (PC3) account for 92.46%, 5.30% and 1.71% of the variance respectively. We run FCM, PCM, PFCM and IFCM on the IRIS-3D dataset. The coefficients are set as a = 5, b = 4. The initial cluster centers are:
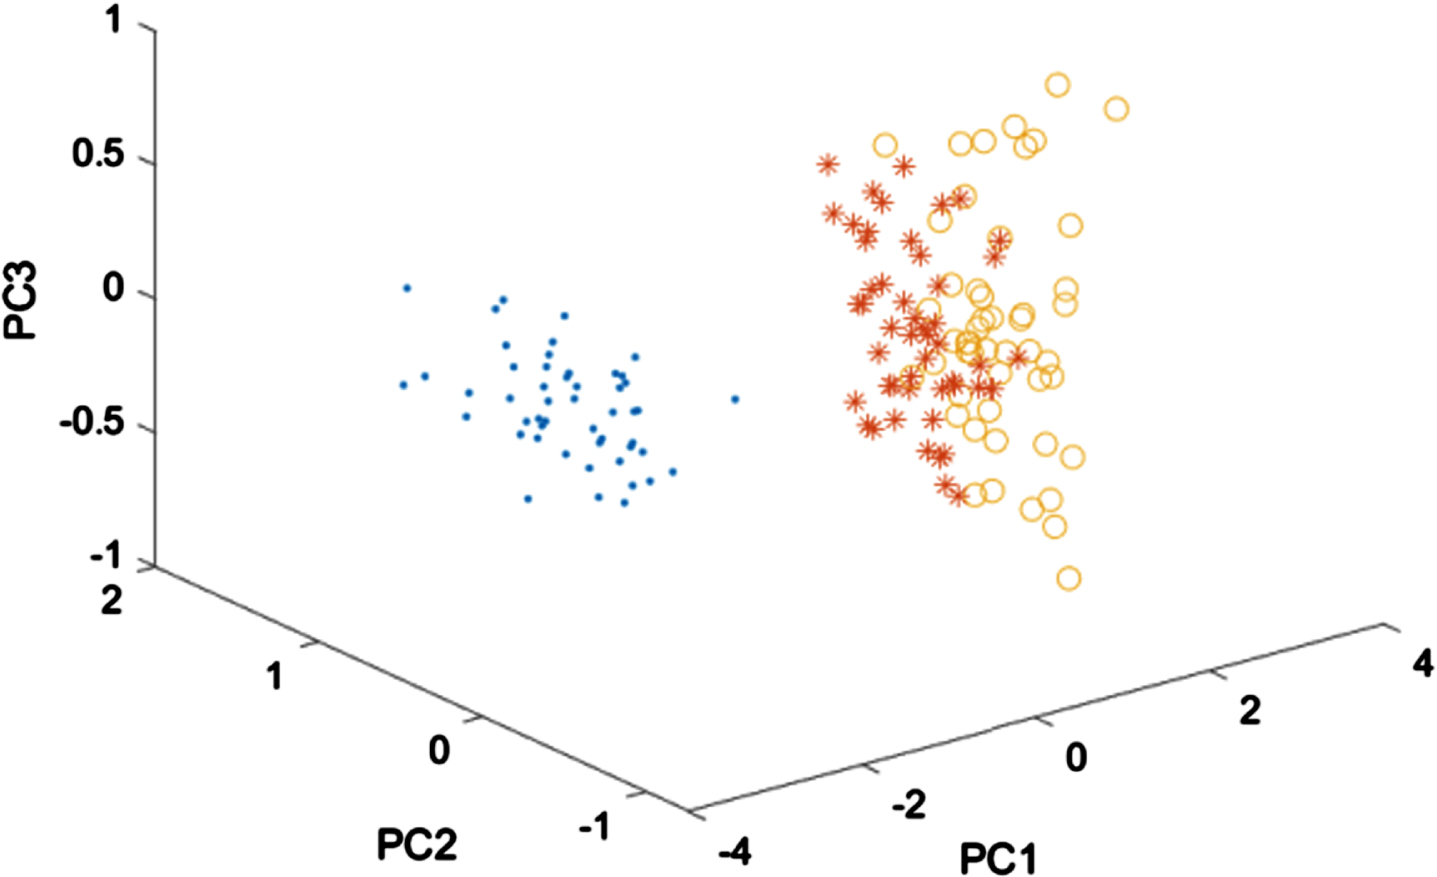
The scores plot of PC1, PC2 and PC3.
Also, the initial cluster centers of PCM are the terminal cluster centers by running FCM. The misclassification numbers from FCM, PCM, PFCM and IFCM are shown in Table 10. Table 10 shows that the misclassification numbers from IFCM are less than FCM, PCM and PFCM. For PCM, its clustering accuracy performance is still poor and the misclassification numbers of typical value (T) are 49 only when m = 3.5 and m = 4, but in other cases they are still 100 the same as on the IRIS dataset. The misclassification numbers from FCM range from 14 to 16 and become smaller and then larger with the increase of m. When m = 2 the numbers of misclassification of fuzzy membership (U) from IFCM are 14 while with the increase of m the numbers can remain at 12, so the classification accuracies of IFCM range from 90.67% to 92%.
The numbers of misclassification from FCM, PCM, PFCM and IFCM on IRIS-3D data
Thirdly, the IRIS dataset is reduced to two-dimensional data by PCA. FCM, PCM, PFCM and IFCM are performing on the IRIS-2D dataset. The coefficients are set as a = 5, b = 1. The initial cluster centers are:
The initial cluster centers of PCM are the final cluster centers running by FCM. Table 11 shows the misclassification numbers of FCM, PCM, PFCM and IFCM on the IRIS-2D dataset. The misclassification numbers of the fuzzy membership values (U) from FCM are 17 when m = 2 or m = 2.5 and in other cases the numbers are 15. PCM performs better on this dataset than on the IRIS and IRIS3D datasets, but it still has the most misclassification numbers of the four algorithms. The misclassification numbers of PFCM are 15 in most cases, and 16 or 17 in a few cases. The misclassification numbers of IFCM decrease from 16 to 14 and remain constant as m = 2increases. The clustering accuracy of IFCM ranges from 89.3% to 90.7%, which is higher compared to the FCM, PCM and PFCM.
The numbers of misclassification from FCM, PCM, PFCM and IFCM on IRIS-2D data
Fourthly, we perform the experiments by running FCM, PCM, PFCM and IFCM on the Wine dataset. The coefficients are set as a = 1, b = 1. The initial cluster centers are:
The initial cluster centers of PCM are the final cluster centers running by FCM. The misclassification numbers from FCM, PCM, PFCM and IFCM are shown in Table 12. For Wine data, none of the four algorithms show excellent clustering performance. The numbers of misclassification of fuzzy membership (U) from FCM are around 37. The misclassification numbers of PFCM vary greatly in different cases. IFCM still has the best clustering accuracy, and its misclassification numbers decrease as m increases.
The numbers of misclassification from FCM, PCM, PFCM and IFCM on Wine data
Fifthly, we conduct the experiments on the Meat dataset by operating FCM, PCM, PECM and IFCM. The raw data has 448 dimensions, so in order to show a better effect we use PCA to reduce the dimension to13. The coefficients are set as a = 3, b = 1. The initial cluster centers are:
The initial cluster centers of PCM are the final cluster centers of FCM. The misclassification numbers of the four algorithms are shown in Table 13. PCM does not cause problems with cluster consistency only when m = 2, and in other cases its clustering performance is still poor with an error rate of even 100%. Interestingly, the fuzzy membership values (U) from FCM and IFCM are unchanged regardless of changes in the weight index m, and they are stable at 11 and 7 respectively. The PFCM has wide range of misclassification numbers, from a maximum value of 16 to a minimum value of 9. The accuracy of IFCM is 94.17%, so IFCM has the highest clustering accuracy among the four algorithms.
The numbers of misclassification from FCM, PCM, PFCM and IFCM on Meat data
Finally, we perform the experiments on the Apple dataset by running FCM, PCM and IFCM. First, we preprocess the infrared spectral data of apple samples using multivariate scattering correction (MSC). To achieve a better clustering effect, the apple dataset is reduced to 4 dimensions by PCA. And then we use linear discriminant analysis (LDA) [33] to exact the discrimination information from the compressed apple dataset. The optimal number of eigenvectors is usually the number of cluster centers minus one, so there are c - 1 =3 feature vectors, i.e., DV1, DV2 and DV3. The scores plot of DV1, DV2 and DV3 are shown in Fig. 8. The coefficients are set as a = 4, b = 2. The initial cluster centers can be set as:
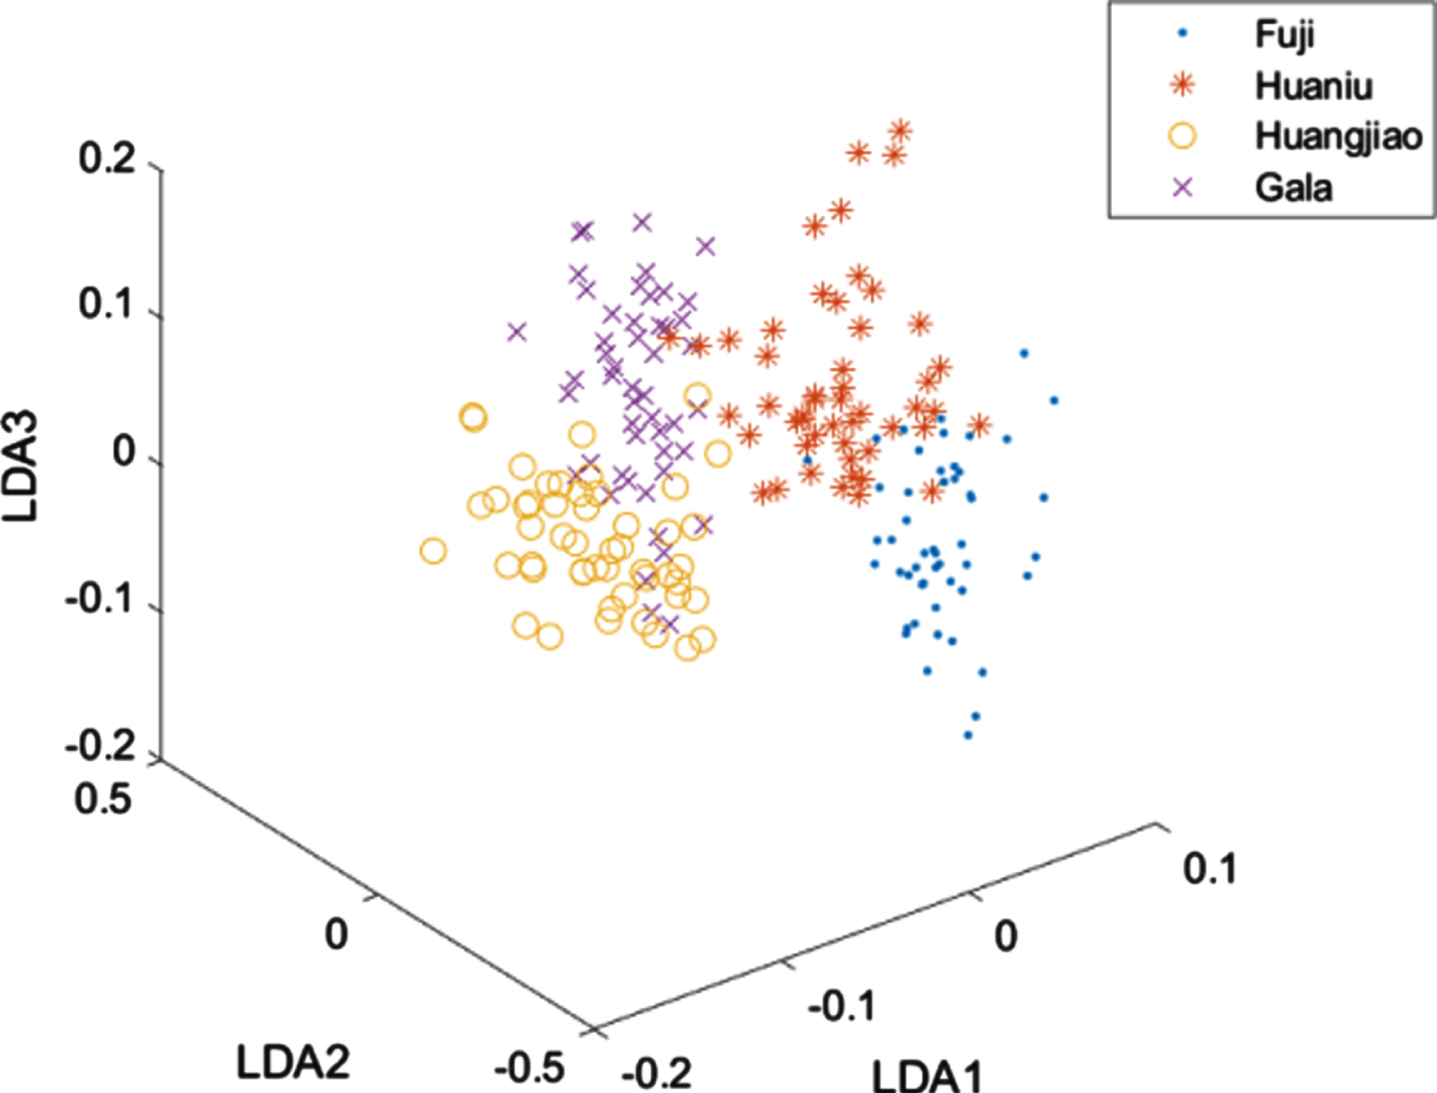
The scores plot of DV1, DV2 and DV3.
The initial cluster centers of PCM are the final cluster centers of FCM. Table 14 shows misclassification numbers from four algorithms. For this dataset, PCM still has a poor clustering effect and for the other three algorithms they also produce more misclassification numbers. The membership value (U) from FCM has the maximum misclassification numbers under the condition m = 3.5 and m = 4. In the same case, the misclassification numbers of the fuzzy membership values (U) and typical values (T) from PFCM even exceed 100. The misclassification numbers generated by the fuzzy membership values (U) from IFCM decrease to 24 and then increase to 30 with the increase of m, and it has the highest clustering accuracies that range from 85% to 88%.
The numbers of misclassification from FCM, PCM, PFCM and IFCM on Apple data
In this section, we evaluate the final cluster centers of the four algorithms by comparing the distances from the terminal cluster centers generated by FCM, PCM, PFCM and IFCM to the true cluster centers. The criterion is that the smaller distance, the better the cluster centers. The mean values of each group of sample data are taken as the real cluster centers. The true cluster centers of IRIS, IRIS-3D, IRIS-2D, Wine, Meat and Apple are shown in Equation (41), Equation (42), Equation (43), Equation (44), Equation (45) and Equation (46), respectively. We set the coefficients a = 1, b = 1, indexes m = 2, w = 2 and iteration threshold ɛ = 0.00001.
We use Equation (32) to calculate the distances, V T and V* respectively represent the real cluster centers and the final cluster centers. Table 15 shows the distances of FCM, PCM, PFCM, and IFCM. For IRIS we can see that E IFCM < E PFCM < E FCM < E PCM , this means the terminal cluster centers of IFCM are better than FCM, PCM and PFCM. The IFCM does not perform well on the IRIS-3D dataset and Meat dataset which produces final cluster centers with larger distances to the real cluster centers than the other three algorithms. The FCM has a minimum distance of 0.1418 on the IRIS-3D dataset, and the PFCM has the best performance with a distance of only 0.00031 on the Meat dataset. The distance of IFCM is 0.0119 and satisfies E IFCM < E PFCM < E FCM < E PCM on the IRIS-2D dataset. For the Apple dataset, the distance of IFCM is only smaller than FCM and 0.0114 larger than the distance of PFCM 0.6879. The distance of IFCM on the Wine dataset is 19.9186, which is smaller than that of FCM, but only slightly larger than that of PCM and PFCM. In summary, the IFCM does not perform as well as PCM and PFCM on IRIS-3d, Wine, Meat and Apple datasets. However, compared with the original algorithm FCM, the final clustering centers of IFCM are closest to the real clustering center on IRIS, Iris-2D, Wine and Apple datasets.
The distances of FCM, PCM, PFCM and IFCM
In this section, we investigate the convergence of FCM, PCM, PFCM and IFCM by comparing the iteration numbers. We set the coefficients a = 1, b = 1, indexes m = 2, w = 2 and iteration threshold ɛ = 0.00001. FCM, PCM, PFCM and IFCM algorithms are executed in the above six datasets and the iteration numbers are shown in Table 16. IFCM has the most iteration numbers while FCM, PCM and PFCM respectively have 28, 39 and 32 iteration numbers on the IRIS dataset. On the IRIS-3D, Wine and IRIS-2D datasets, the IFCM reaches the convergence state faster than PCM, but slower than FCM and PFCM. FCM has the same iteration numbers on the IRIS-3D, IRIS-2D and Meat datasets. IFCM needs 81 iterations to reach convergence state and the iteration numbers are more than that of FCM (32 iterations), PCM (74 iterations) and PFCM (60 iterations) on the Apple dataset.
The iteration numbers of FCM, PCM, PFCM and IFCM
The iteration numbers of FCM, PCM, PFCM and IFCM
In this section, we run all fuzzy clustering algorithms again in different cases to illustrate the computing time. We set the iteration threshold ɛ = 0 . 00001 and the maximum iteration number γmax = 100. The computing time of four algorithms on the six datasets is shown in Table 17. PFCM requires the most computing time because it has to calculate both the fuzzy membership values and the fuzzy typical values. Since the initial clustering centers of PCM need to be obtained by running FCM, it takes more time to compute than FCM. Compared to the FCM, the IFCM has a more complicated distance formula so IFCM spends more time than FCM.
The running time(s) of FCM, PCM, PFCM and IFCM on six data
The running time(s) of FCM, PCM, PFCM and IFCM on six data
This paper presented an improved FCM algorithm (IFCM) based on the Euclidean distance function. The new distance measure improved the robustness of the original algorithm (FCM) by giving less weights to noisy points and more weights to normal data points. By running on two artificial datasets, it could be seen that IFCM showed better clustering performance when faced with data with noisy points compared to the original FCM. The clustering accuracy, cluster centers, number of iterations and computing time of the IFCM algorithm were explored on six real datasets (IRIS, IRIS-3D, IRIS-2D, Wine, Meat and Apple). The results showed that IFCM had higher clustering accuracy and smaller cluster distance than other algorithms. Compared with PCM and PFCM, IFCM spent less clustering time and had a better clustering result. In addition, we changed the weight index to observe the clustering results and IFCM still has the best clustering result. In conclusion, IFCM is better than FCM, PCM and PFCM. In the next work, we will focus on the selection of the weight index m to obtain better clustering results and try to apply this distance measure to other clustering algorithms such as PCM and PFCM mentioned in this paper to improve their clustering performance.
Footnotes
Acknowledgments
This research was financially supported by Undergraduate Scientific Research Project of Jiangsu University (20AB0020), Anhui Province Scientific Research Planning Project (2022AH040), Talent Program of Chuzhou Polytechnic (YG2019026 and YG2019024) and Key Science Research Project of Chuzhou Polytechnic (YJZ-2020-12).
Conflict of interest
The authors declare no conflict of interest.
Data availability statement
The data that support the findings of this study are available from the corresponding author upon reasonable request.