
Abstract
Autism Spectrum Disorder (ASD) is a complicated neurodevelopment disorder that is becoming more common day by day around the world. The literature that uses machine learning (ML) and deep learning (DL) approaches gained interest due to their ability to increase the accuracy of diagnosing disorders and reduce the physician’s workload. These artificial intelligence-based applications can learn and detect patterns automatically through the collection of data. ML approaches are used in various applications where the traditional algorithms have failed to obtain better results. The major advantage of the ML algorithm is its ability to produce consistent and better performance predictions with the help of non-linear and complex relationships among the features. In this paper, deep learning with a meta-heuristic (MH) approach is proposed to perform the feature extraction and feature selection processes. The proposed feature selection phase has two sub-phases, such as DL-based feature extraction and MH-based feature selection. The effective convolutional neural network (CNN) model is implemented to extract the core features that will learn the relevant data representation in a lower-dimensional space. The hybrid meta-heuristic algorithm called Seagull-Elephant Herding Optimization Algorithm (SEHOA) is used to select the most relevant and important features from the CNN extracted features. Autism disorder patients are identified using long-term short-term memory as a classifier. This will detect the ASD using the fMRI image dataset ABIDE (Autism Brain Imaging Data Exchange) and obtain promising results. There are five evaluation metrics such as accuracy, precision, recall, f1-score, and area under the curve (AUC) used. The validated results show that the proposed model performed better, with an accuracy of 98.6%.
Keywords
Introduction
The disability’s in-person development, which differs from normal human behavior, is considered an autism spectrum disorder. The main cause of this disorder is due to neurological problems in the brain. Some studies declare this to be a genetic disease. Slow attention to certain activities differs from that of normal people, as does social communication. Autistic people have different perceptual abilities and socialisation with others. Some people develop this symptom in childhood, which is difficult to identify. The severity of autism is unique to each person. It varies from low intelligence to high intelligence. Also, behaviour is adjustable or exceeds limits. Due to the unique nature of the disorder, it is difficult to predict ASD [1, 2]. According to a recent WHO estimate, one in every 100 children has ASD.
ASD prediction research materials use various different advanced neuro imaging data for analysis. The tools include structural and functional magnetic resonance imaging (fMRI), positron emission tomography (PET), electroencephalography (EEG), novel protocols, and magnetoencephalography (MEG). Among task-oriented and resting-state fMRI, fMRI contains a large amount of data. Machine learning is considered a field of perfect data learning frameworks where data prediction and classification are perfectly done. During the last decade, different technologies have been used to classify ASD and typical controls. The majority of researchers use machine learning techniques to test the algorithm’s efficiency. Other brain diseases like depression, schizophrenia, and Alzheimer’s disease are also predicted using machine learning techniques. Advancements in data lead to exploration using deep learning algorithms. Massive data processing is easily done by deep learning. Recently, optimization has been improved using metaheuristic approaches.
As of now, ASD is not easy to predict. On the other hand, if we have the technology to predict early, then it is more welcome. This motivates many researchers to identify autonomous learning techniques to predict ASD [3]. Feature selection is the first preprocessing model for very high-dimensional data. Machine learning problems prefer feature selection for improving efficiency [4, 5]. Also, feature selection helps to remove the noise and make this data easier to understand. Basically, feature selection is performed by using filter and wrapper methods. Recently, optimization subsets were used with wrapper techniques to improve the selection efficiency. Nature-inspired algorithms use optimal subsets in the search process and find the optimal solution. The large space problem requires nature-inspired techniques to search the global features in the selection process with fewer samples.
Nature-inspired algorithms work by imitating the behaviour of certain optimization models like ant colonies, bee colonies, seagulls, elephant herding, etc. This emerging model helps in feature classification using optimization algorithms. Major applications, like the diagnosis of challenging diseases with bio-inspired techniques, can provide the optimal solution. Further, to improve optimization quality, deep learning is suggested with meta-heuristic performance. A convolutional neural network with metaheuristic optimization techniques is standalone and capable of outperforming other networks.
This paper’s main contribution is as follows: This paper proposed a novel approach to selecting the most important features from the complex input data of fMRI images for ASD detection. The most relevant and important features are selected using the proposed novel method called the CNN-SEHOA approach. CNN was used to extract features from the input data in this case.Using the extracted features, the relevant and most important features are selected using a hybrid MH approach called the seagull-elephant herding optimization algorithm (SEHOA). A deep learning algorithm called LSTM has been used for classification. The proposed feature selection-based classification system is evaluated using the fMRI (functional magnetic resonance imaging) images from the ABIDE dataset. The proposed ASD prediction model is evaluated and compared with the existing approaches, and the results show that the proposed model gives promising results in ASD prediction.
Survey on deep learning classifier with feature selection
Survey on deep learning classifier with feature selection
This section discusses previous autism prediction research works and evaluates the performance of the current research works. The auditory hypersensitivity data is used to predict the level of autism using computer-aided diagnosis techniques [1]. ASD prediction using the fMRI dataset [2] uses brain atlases for accurate disorder identification. The deep neural network is trained with atlases, and the input feature is classified as ASD-affected or not. The accuracy of the prediction is 88%, which is not much higher. Even though its accuracy is low, its AUC was 96%. It proves that deep learning is an intelligent platform where predictions happen based on a well-learned platform. An fMRI dataset with a minimum spanning tree is used to detect autism in patients [3]. Here, feature selection is done using fMRI. Ensemble techniques are competitive research models where the most competitive algorithms are tested by maximum voting. Here, the population graph is used first to retrieve the features [4]. There are also some technologies introduced by researchers to support and guide autistic children [5]. The speech-based multi-modal system is used to set up environments like virtual reality. The augmented model [6] is used for interaction with autistic children.
The convolutional neural network (CNN) with separate channel (SC) attention is used to detect and classify ASD in the early stages. CNN takes more time to train on the data. A separate channel helps the CNN model discriminate between ADHD and healthy controls. The brain region is composed of temporal features, which are used by CNN. Secondly, the dependent feature on temporal is adopted by the attention network [7]. CNN identifies the autism-related features in an effective way. A filter and wrapper technique for feature selection is considered a flat feature selection model for handling huge datasets. The evolutionary technique is used to optimise the final feature [8]. The grey wolf optimizer optimises in terms of selecting prey with high accuracy.
The study of machine learning performance in predicting ASD [16] among 433 children in the age group of 3 yrs.–6 yrs. was conducted. Nave Bayes, decision trees, logistic regression, and generalised linear models are computed. The decision tree performs better than other ML techniques. The main issue here is that it can only work with small datasets. Overfitting problems are common in small datasets. This can be overcome by using an optimizer that performs better on overfitting problems. In the prediction of ASD, the biomarker of brain image [17] plays an essential role. The data on functional connectivity is computed using machine learning pipelines. The functional connectivity matrix helps develop a classification model and predicts ASD. A brief study on various AI techniques used in the prediction of ASD is reviewed [18]. In this regard, AI techniques such as CNN, logistic regression, SVM, and others excel across a wide range of datasets. Machine learning makes predictions with all possible learning abilities. ASD patients’ eyes are tracked as a biomarker for autism prediction. The scanned eye tracking is learned by ML, and classification of testing data is performed [19]. When compared to other biomarkers, it aids in disease prediction. The ML performance is improved by using optimizers like an ant colony, a particle swarm, a gorilla optimizer, etc. In this research, we focused on improving ML performance by using a seagull–elephant herding optimizer.
Proposed materials and methods
The overview of the proposed ASD model is sthe preparedhown in Fig. 1. In the data preparation stage, the fMRI image data are prepared for processing witnetwork,rain network as discussed in section 3.2, which will create the functional connectithatvector which is used for feature extraction and cltor that is used for feature extraction and classification. on process. This model consists of three phases. First, the features from theprepared input data are extracted using CNN. Then, the dataset is divided into training and testing datasets. Second, the relevant and most important features are selected using a hybrid MH model called SEHOA. In the third phase, using the selected feature subset, an LSTM classifier is used to predict the ASD of the patients, and the accuracy of the results is analysed using the evaluation metrics.
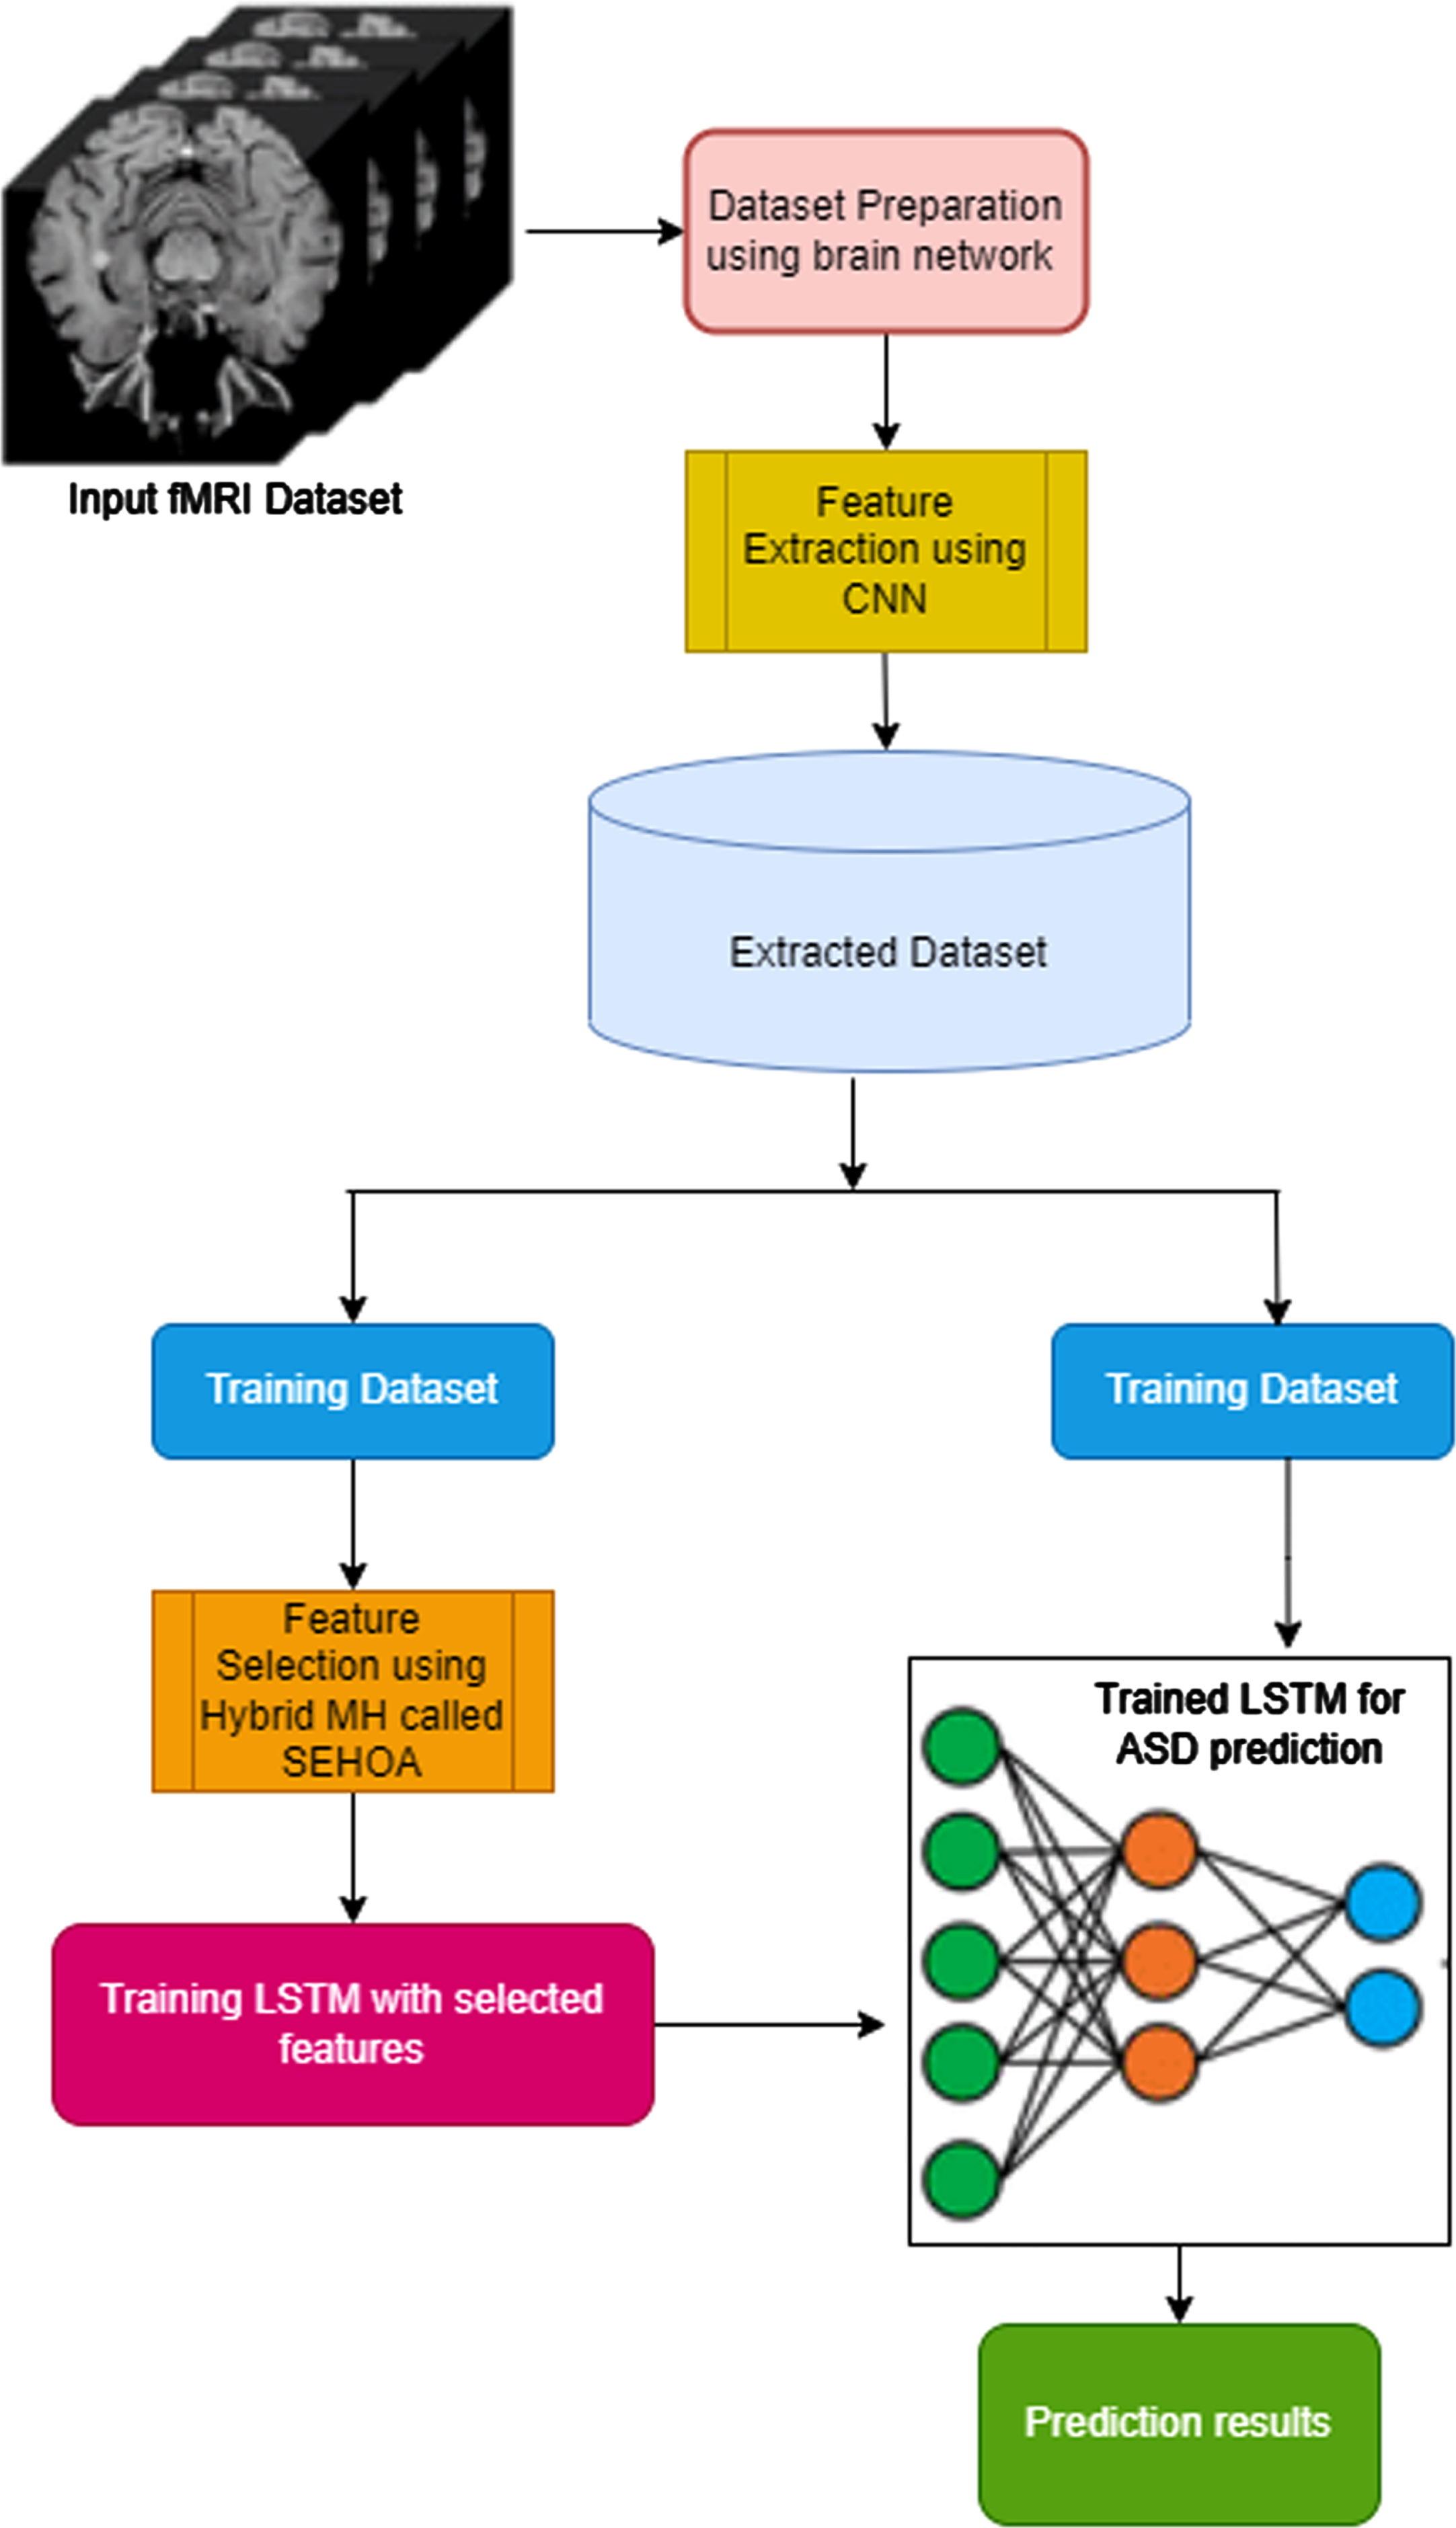
Proposed ASD prediction model.
In this study, the ABIDE dataset was used for our analysis [20]. It includes fMRI brain images, structural MRI, and phenotypic information. This data is collected from 17 institutions and made available to the researchers for their scientific research. The Autism Brain Imaging Data Exchange (ABIDE) scheme has collected structural and functional brain scan data across laboratories all over the country in order to aid scientists in a greater understanding of the neurological foundations of autism. The ABIDE 1 dataset contains 1120 people, of whom 545 have ASD and 580 are healthy standards (ages 7–64 years, median 14.7 years across groups). ABIDE II has 19 organisations, including 10 chartered organisations and 7 current recruits, who’ve already given 1120 records on 525 individuals with ASD and 598 without (in the age range of 5–64 years).
Data preparation –brain network
The network consists of edges and nodes, and creating the brain network using the functional MR data is complex and difficult to process because of the intricate edges and nodes [21]. If the edges and nodes are not properly identified, then the network study becomes complex to analyze. The two most common methods to describe the network are the voxel-based method [22] and the ROI-based method [23]. In the voxel-based method, each voxel present in the MRI data is declared a node, and the connections between the nodes are determined as edges. The ROI parcellation method splits the human brain into various ROIs, and these ROIs are declared as nodes. The connection between ROIs is endpoints. ROIs correspond to various anatomical brain parts called the hippocampus, fissure, perirhinal, and pons. The cortex separated from the anatomical atlas is considered an anatomical feature and is widely used in neuroimaging studies. In this paper, multi-scale functional brain parcels are used, which are created using the bootstrap method of a stable cluster named BASC [24]. The scales are selected based on the STEPS method [25]. The scale is set at 123 for this study. The connection between the two nodes is declared as an edge. The edge between ROI pairs is weighted using the Pearson correlation coefficient denoted in Equation (1).
Where, x and y –time series, l –length, x i and y i –ith component of time series and x m , y m –mean value of time series x and y. In this paper, preprocessed ABIDE 1 dataset [26] is used for analysis.
In the feature extraction phase, the feature vector from the data preparation stage is used. The convolutional neural network is the most widely used feature extractor in a variety of applications, which include image and text classification, speech recognition, and so on [27, 28]. In this study, the architecture shown in Fig. 2 is used for feature extraction.

Presented CNN structure for feature extraction.
The block conv1 –1*3 @ 64 denotes the convolution layer with a filter size of 64, and each filter has a 1*3 size with an astride size of 1. The input data is one-dimensional. The major building blocks are the convolution layer, fully connected layer, pooling layer, and activation function. Based on the constructed data, CNN learns complex feature representations. The convolution operation was used to learn the activation map from the input data. This simple CNN structure-based feature extraction improves the classification accuracy. The best-trained model, based on its performance on test data, is used to extract the features for the feature selection process. In Fig. 2, the convolution is followed by the rectified linear unit (ReLU) [29] denoted in Equation (2) to avoid the propagation of the negative and small values. The pooling layer is used to reduce the dimensionality of the input data X.
Dropout layers are used to reduce complexity and avoid overfitting [30].The regularization rate for this dropout layer is 0.5, which can cause some neurons to drop during training. The convolution operation on input data Xl-1 of the previous layer is declared in Equation (3).
Where w and b –weight and bias of lth layer respectively ad and Xl –output. The extracted features from the last pooling layer are given as input to the fully connected (FC) layer. The layers FC1, FC2, and FC3 are used for feature extraction [31]. FC4 is used for output using the softmax activation function. Since CNN is the regularization method, batch normalization (BN) is used to normalize the features given to FC4. The extracted feature vector from layer FC3 is of size 1*64, which is given as input to the feature selection process. This will boost the classification performance with improved accuracy.
In this section, the most relevant and important features are selected using the hybrid SEHOA model that combines Elephant Herding Optimization [32] and the Seagull optimization algorithm [33]. The traditional EHO will not use the required data for its future searches, and the traditional SOA approach has large-scale constraints for industrial applications. Still, the computational complexity of these algorithms is an issue for solving optimization problems. This will motivate us to combine both algorithms, which will give better results with improved convergence speed.
Basically, the elephants lived in a social group called clans, and each clan stayed with its matriarch, which is the female leader elephant. The mature male elephant is kept apart from the other elephants. The population of the elephant is randomly produced and splits into various clans based on its fitness value. The standard EHO has three significant rules, as follows: The population of the elephant is comprised of various clans, with a fixed number of male and female elephants in each and every clan. Individually, some male elephants live far from the clan. The elephants lived with the female leader of each clan.
Updating the clan
This operator is used to update the clan individually. the matriarch (m) influences each element’s position in the clan h for the updating process. Seagull optimization function has been used for clan updating process which is denoted in Equation (4)
Where, Sb- seagull search agent Sl location towards the best fit agent called Sbest.Sl - current position of search agent, t –current iteration and b –behavior which is the randomized number to balance the exploration and exploitation. The best fit elephant updation is obtained from the Equation (5)
Where, η –clan centre with the range [0,1], the new individual is expressed from the information gathered by all the elephants in the clan h, Sc,h - clan h centre denoted in Equation (6)
Where d = 1 ⩽ D ⩽ d denotes the total number of dimensions in D, gh - number of elephants and Sh,k,d - dth dimension of the individual Sh,k.
The male elephants, which are now grown, are starting to live separately. This operator is determined once the separating process is over. Based on the hybrid SEHOA, the search ability is enhanced, and the elephant’s worst fitness in separating operators for each generation is defined from the Equation (7)
Where, Smin- single elephant minimum bound position, Sworst - worst individual elephant of clan h which is replaced using the Equation (8). The workflow of SEHOA is shown in Fig. 3.
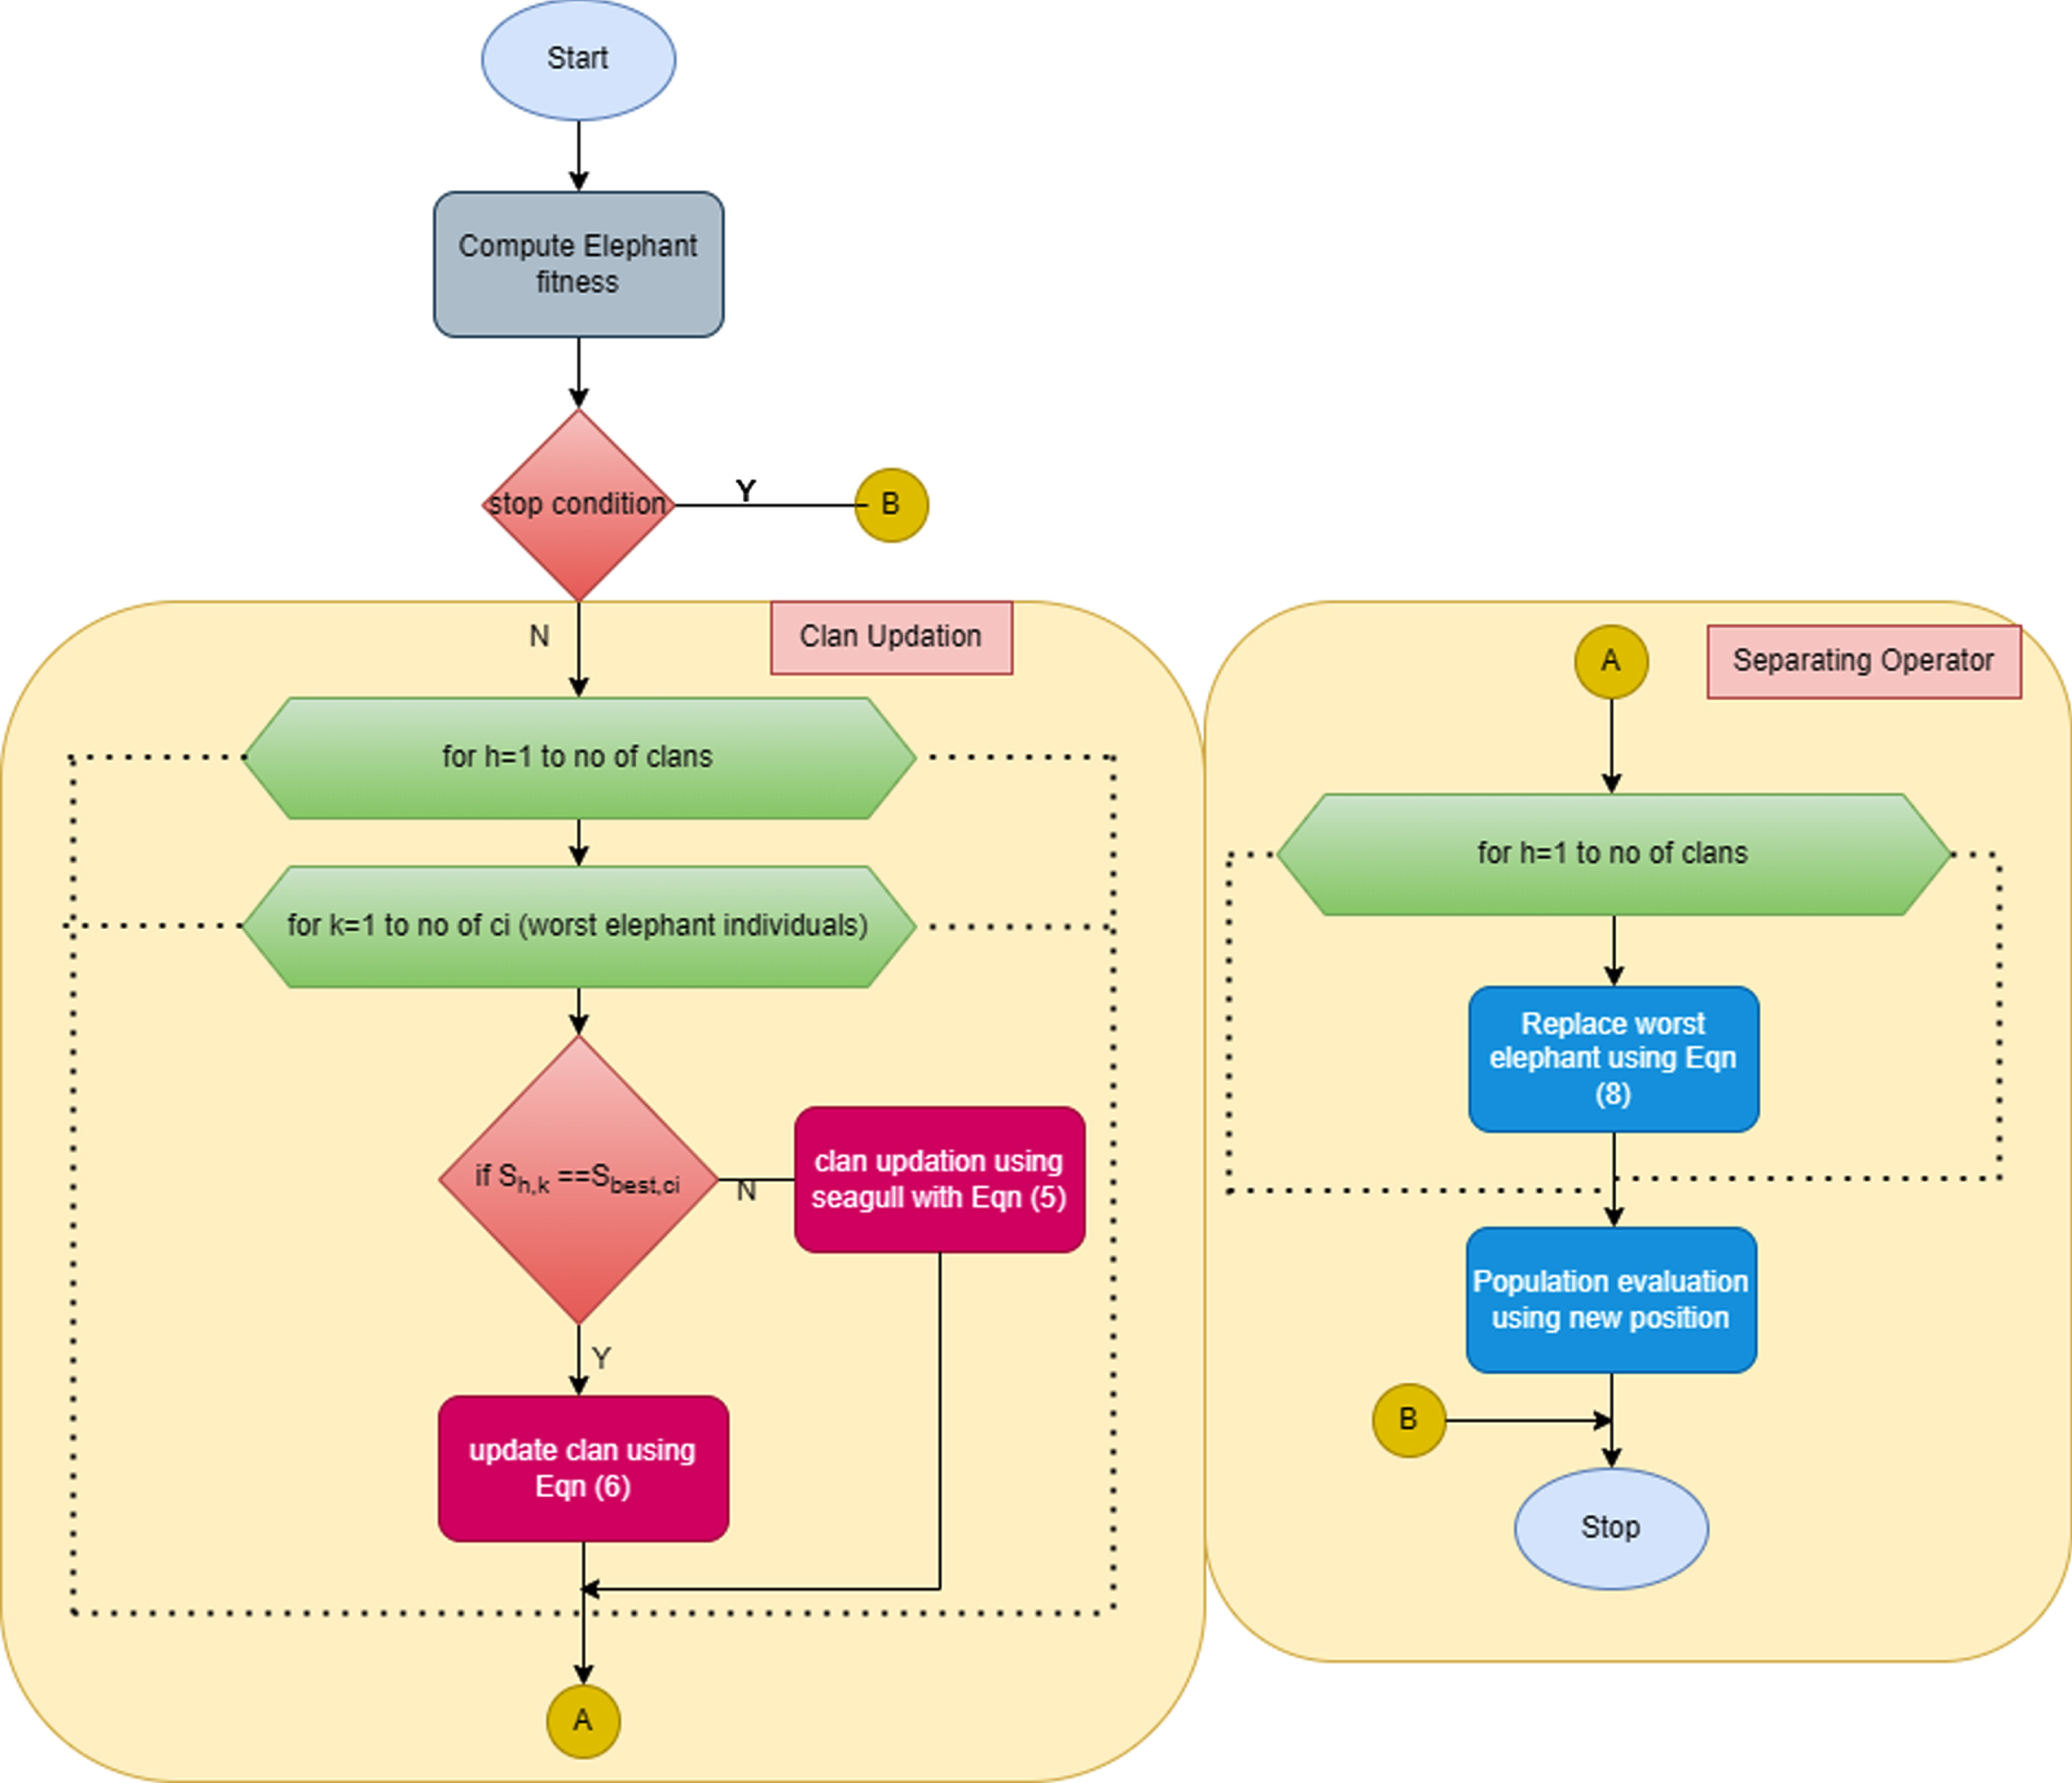
Workflow of hybrid SEHOA algorithm.
LSTM is a special kind of recurrent neural network that learns from long-term dependencies. It was developed in the mid-1990s and is now widely used for classification. The standard LSTM consists of four gates: input gate I, forget gate F, control gate C, and memory cell output gate O [34]. Figure 4 depicts the architecture of a standard LSTM. The model inputs are the previous cell state called ht - 1, the current input vector Xt, and the bias b. The model output is the Ct, which represents the memory content and current cell state ht. The network data are influenced by the four gates, and forget gate F has a range of values from 0 to 1, which indicates how much data is ignored from the previous memory cell. The value closest to 0 means a new time stamp, and values closer to 1 mean a previous time stamp.

LSTM structure.
Based on Fig. 4, the mathematical model of LSTM classification is denoted in Equations (13)
The next sigmoid function is used to decide the information need to update. The candidate value list is created and combined the two operations.
The new memory cell status is computed using Equation (12)
Finally, the output of the system ht is calculated using Equation (13)
Confusion matrix
The effectiveness of the proposed CNN-SEHOA-based feature selection with LSTM is evaluated using the ABIDE 1 dataset. The training and testing datasets have been incorporated into a 10-fold cross-validation process, with eight folds for training data and two folds for testing data. The proposed model is implemented using the Python Sklearn library. Area under the curve (AUC), accuracy, sensitivity, specificity, and f1-score measures are used for statistical analysis of the confusion metrics shown in Table 4.
Proposed model metrics results
Proposed model metrics results
The specificity is the ratio between actual negatives predicted as negative. It is also known as true negative rate as shown in Equation (14)
The sensitivity or recall is detecting the true positives in the model which is major factor to identify the actual patients with heart disease. It is computed using the Equation (15)
Precision is the ratio between true positive and all the positives denoted in Equation (16)
Accuracy is the ratio between overall correct predictions to the total number of predictions as denoted in Equation (17)
F1- score is the mean between precision and recall as in Equation (18)
ROC is a graph that is used to show the performance measures of accuracy, sensitivity, and specificity. It has two parameters: the true positive rate and the false positive rate.
True positive rate (TPR)
It is also known as “sensitivity,” so TPR is calculated by the probability of actual positive relay nodes using:
It is used to evaluate the ratio between correctly identified numbers of relay nodes to wrongly identified relay nodes using:
Based on the results of Table 3, the evaluation metrics results of the proposed model are shown in Table 4.
Confusion matrix results of proposed model
The proposed model is evaluated and compared with various classifiers such as Convolution neural network (CNN), Random Forest (RF), Support vector machine (SVM) and Deep neural network (DNN). The evaluated results are shown in Fig. 5.
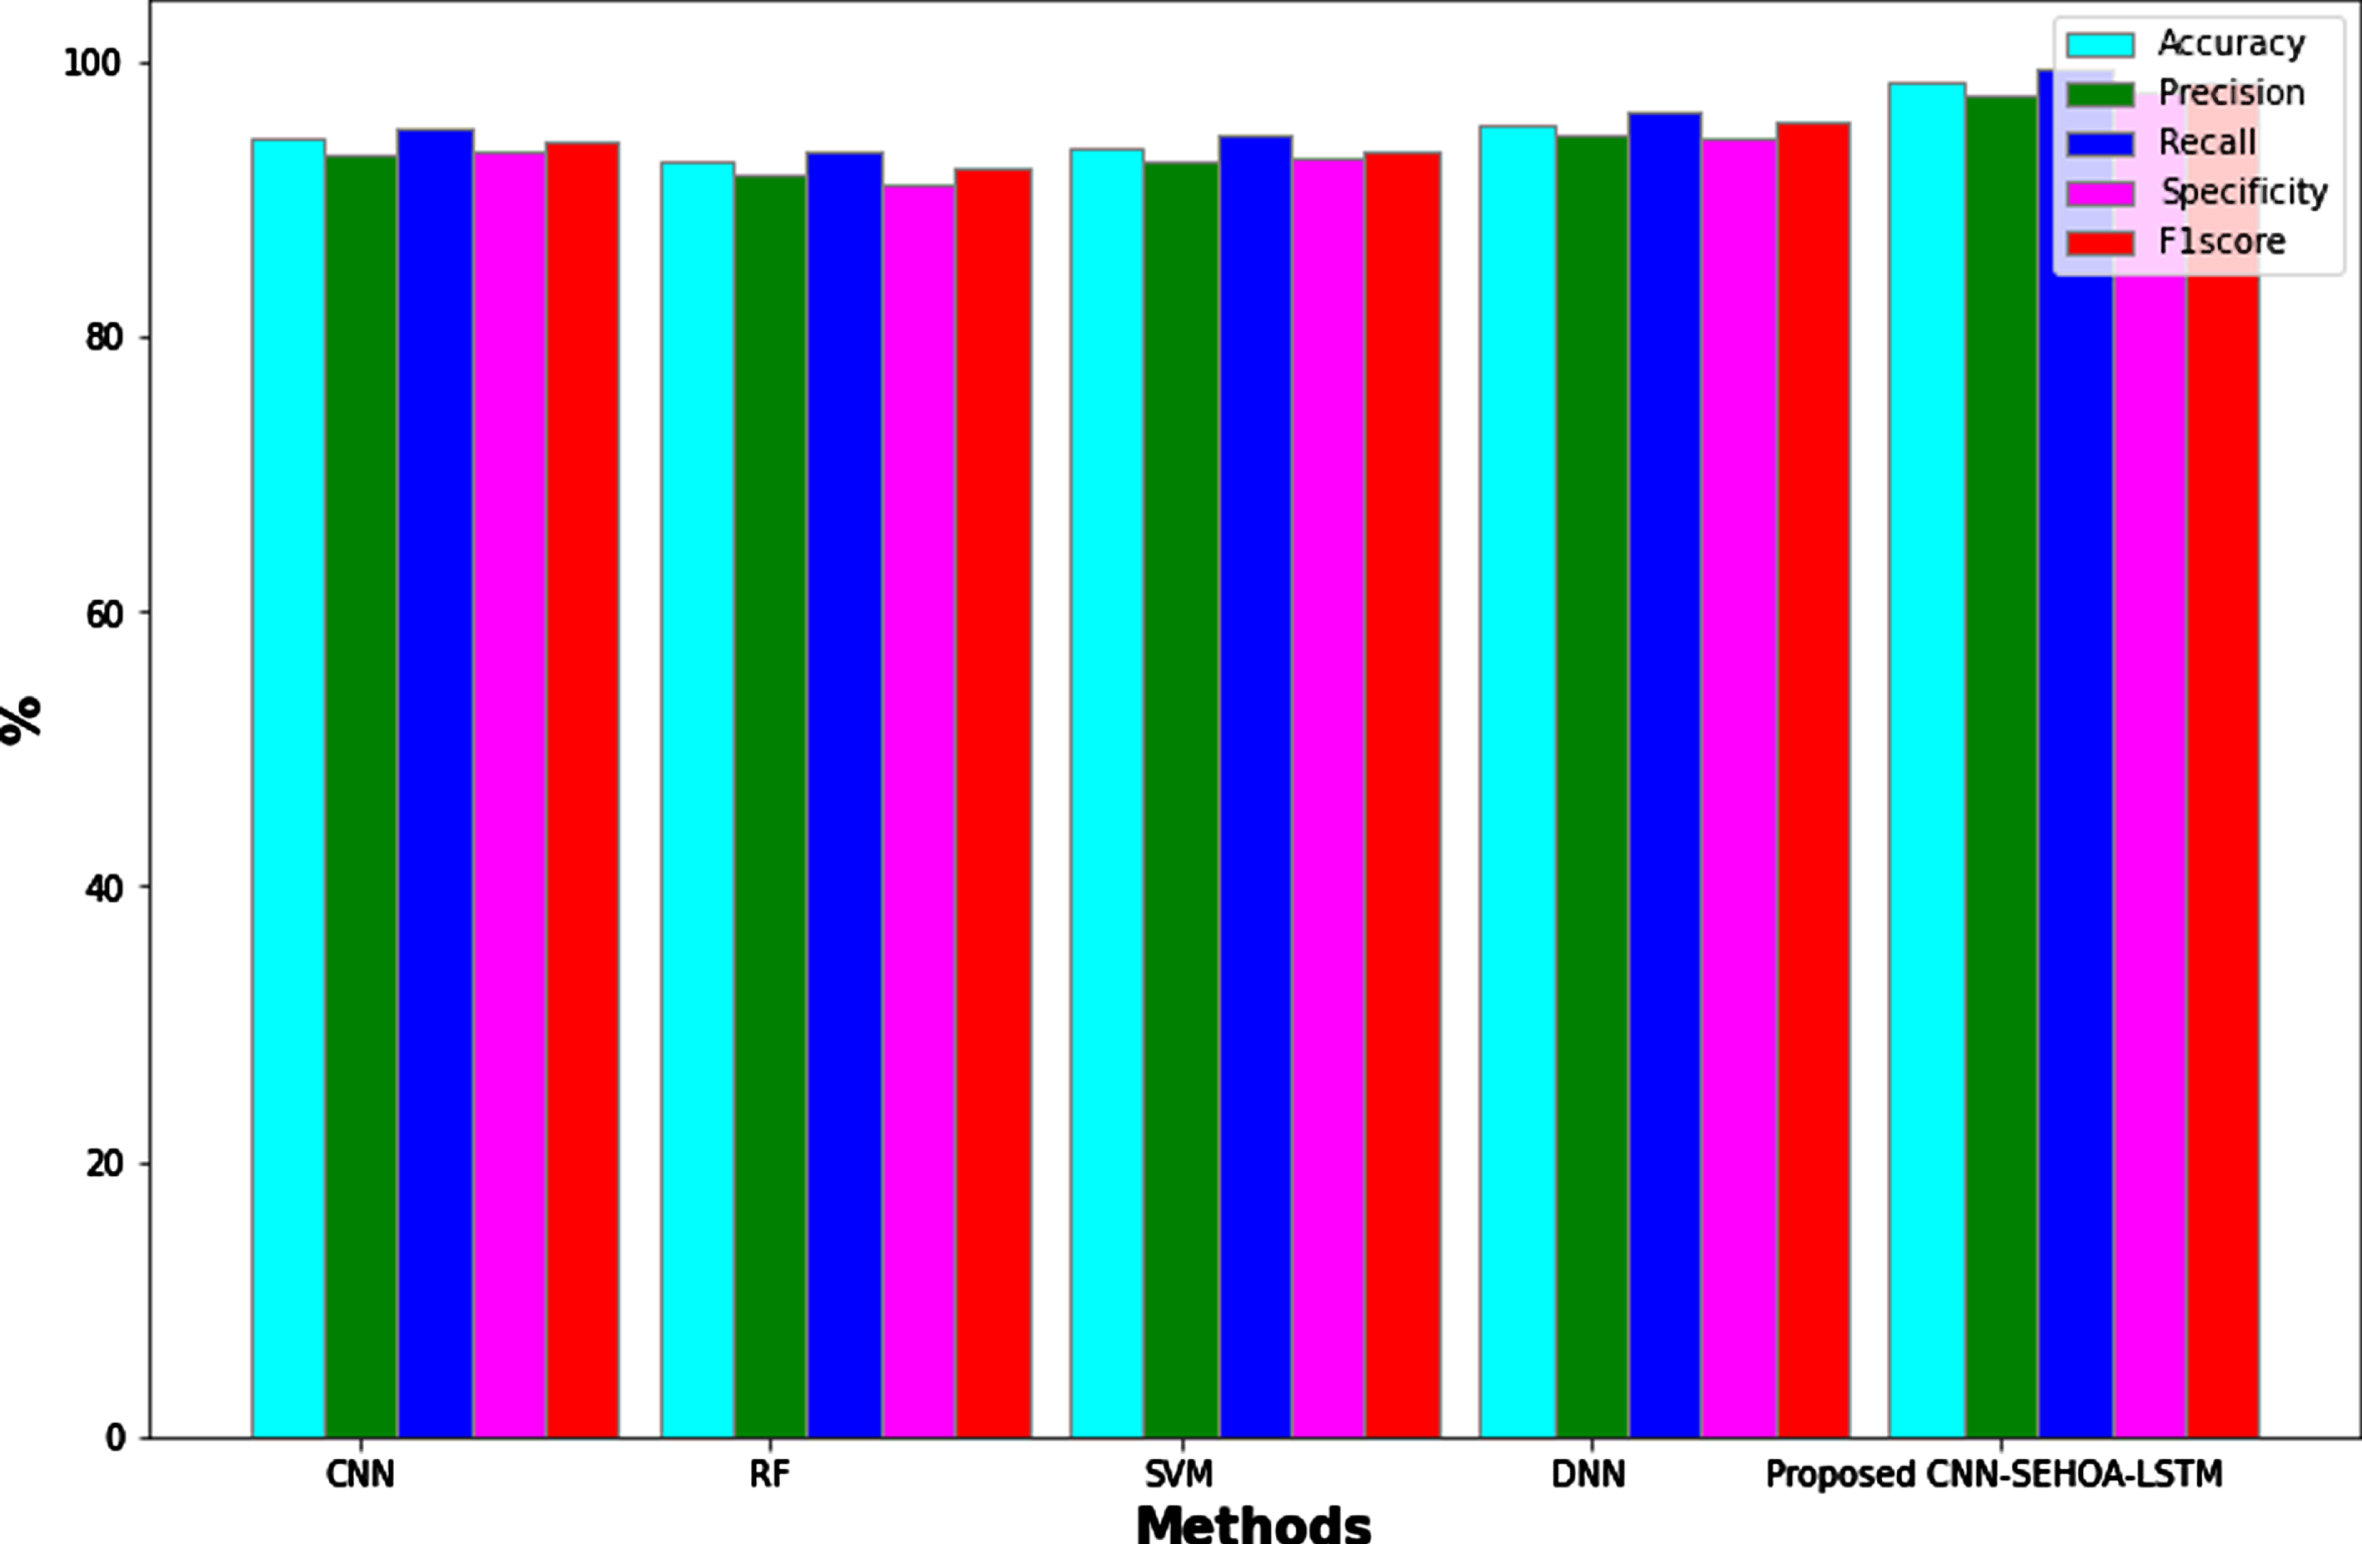
Comparative analysis results of proposed vs existing models.
Compared to the existing classifiers such as CNN, RF, SVM, and DNN, the proposed model’s performance is superior and efficient, with an accuracy of 98.6%, precision of 97.5%, recall of 99.6%, specificity of 97.8%, and F1-score of 98.5%. Various other classifiers such as CNN secured the accuracy, precision, recall, specificity, and F1-score of 94.5%, 93.2%, 95.3%, 93.4%, and 94.3%, respectively. RF secured 92.8%, 91.7%, 93.5%, 91%, and 92.2%, respectively. SVM received 93.7%, 92.8%, 94.8%, 92.9%, and 93.4% sequentially, while DNN received 95.4%, 94.6%, 96.3%, 94.5%, and 95.6. The ROC of proposed vs. existing approaches is shown in Fig. 6. Compared to the existing approaches, the proposed feature extraction, feature selection, and classification system secured a ROC value of 0.989.
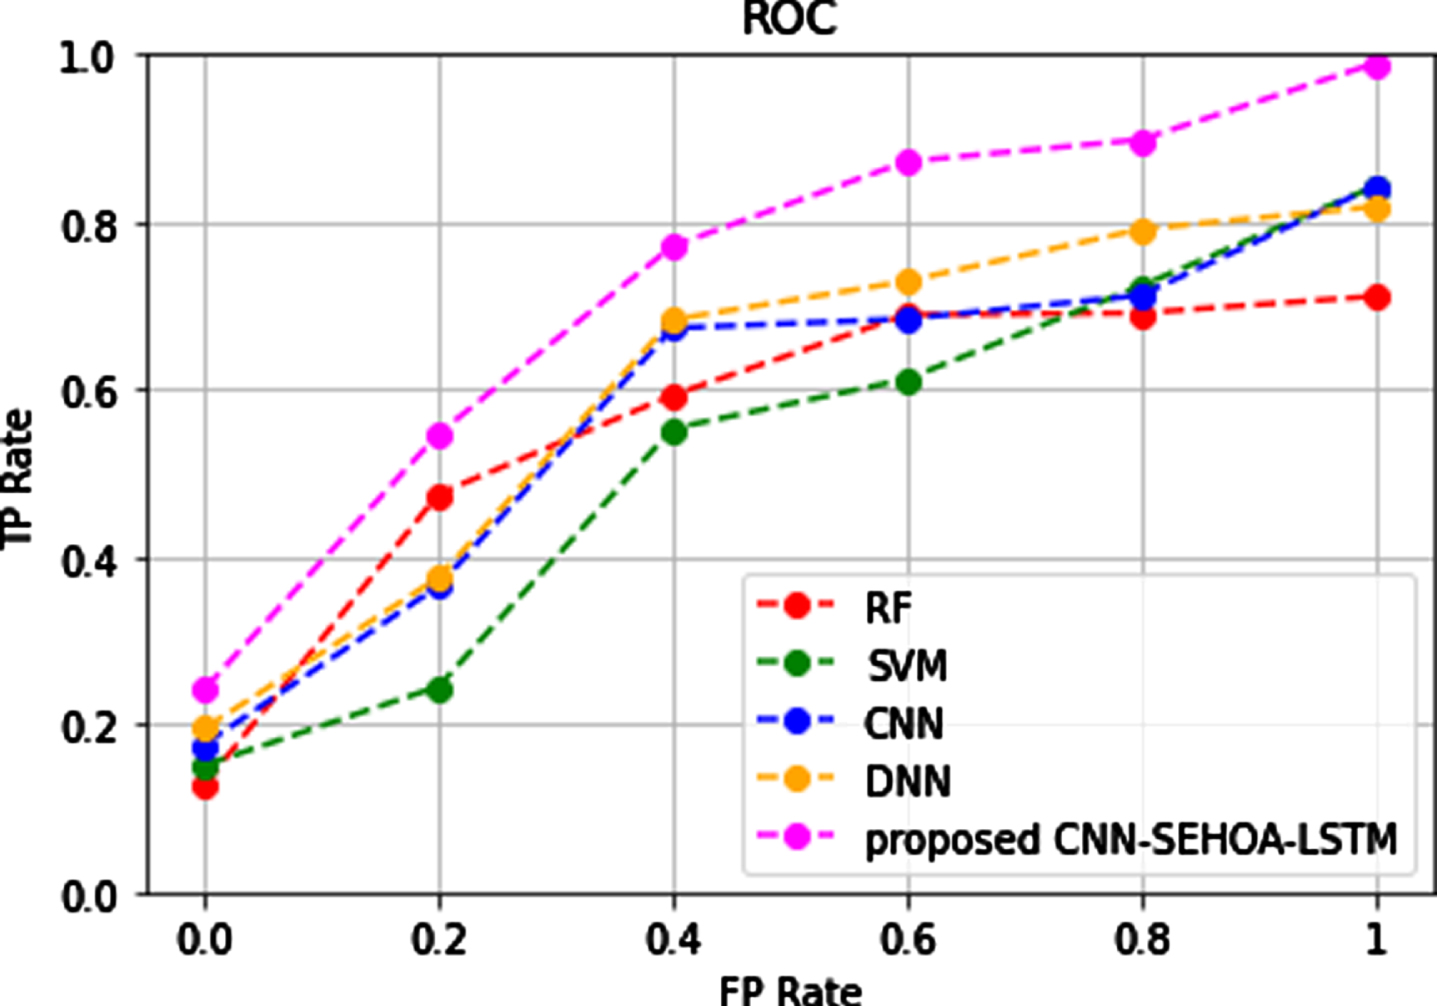
ROC comparison.
The proposed model is evaluated in terms of error rate and execution time. These evaluated results are shown in Table 5. In comparison to other approaches, the proposed models achieved the lowest error rate in predicting ASD patients. In terms of execution time, the proposed model took longer than other approaches due to the execution of the feature extraction, feature selection, and classification phases. Hence, the proposed feature selection with classification system is efficient, robust, and effective for the prediction of ASD.
Error rate and time comparison of proposed vs existing approaches
Some of the previous ASD prediction systems using ML and meta-heuristic-based feature selection approaches are compared with the proposed meta-heuristic-based feature selection and deep learning-based classification models. The evaluated results are listed in Table 6.
Comparison of previous Meta heuristic feature selection-based ASD prediction systems
Hence, the evaluation and comparison results prove the efficiency of the proposed model in the prediction of ASD with increased accuracy, ROC, and reduced error.
This paper developed an ASD prediction model using an enhanced feature selection process that includes CNN-based feature extraction and hybrid SEHOA-based feature selection approaches. The efficiency of the model is based on this proposed feature selection model and is classified using LSTM. Using the ABIDE 1 dataset, the proposed feature selection-based ASD model is evaluated in terms of accuracy, recall, precision, specificity, and the f1-score. Compared to the existing approaches such as CNN, RF, SVM, and DNN, the proposed model is superior, with an accuracy of 98.6% and ROC of 0.9. The proposed model performs better when screening for ASD and predicts ASD patients with a lower error rate. The proposed model takes longer to execute than other approaches due to the use of a meta-heuristic-based deep learning model. In the future, the proposed model will be implemented with larger datasets, and a user-friendly web-based application will be developed so that individual users can use the application to predict the onset of autism spectrum disorder as early as possible.