
Abstract
The anomaly detection research of drive end bearings (DEBs) is of great significance to the safe and reliable operation of hoist. This paper proposes an anomaly detection method of DEBs based on the linear weighted sum combines with the belief rule base. First, in order to improve the accuracy of anomaly detection, the time-domain features and frequency-domain features are integrated by linear weighted sum (LWS) respectively. Then, belief rule base (BRB) method is provided for anomaly detection using fused features. Meanwhile, the covariance matrix adaption evolution strategy (CMA-ES) is utilized to optimize the parameters of belief rule base model. Finally, the validity of the proposed method is verified by the vibration data, which are acquired from the condition monitoring system of hoist in body-in-white (BIW) welding production line. The proposed method achieves a high detection accuracy. It is proved that the proposed method is suitable for anomaly detection of DEBs in the actual BIW welding production line.
Introduction
Drive end bearings (DEBs) are important parts of motors of the hoist in body-in-white (BIW) welding production line [1]. Take the DEB as object, the real-time vibration data can be obtained in the condition monitoring system. Figure 1 demonstrates the condition monitoring system of DEBs of the hoist. In the early degradation stage, the anomaly detection of DEBs is of great significant to providing an early maintenance plan for the hoist.
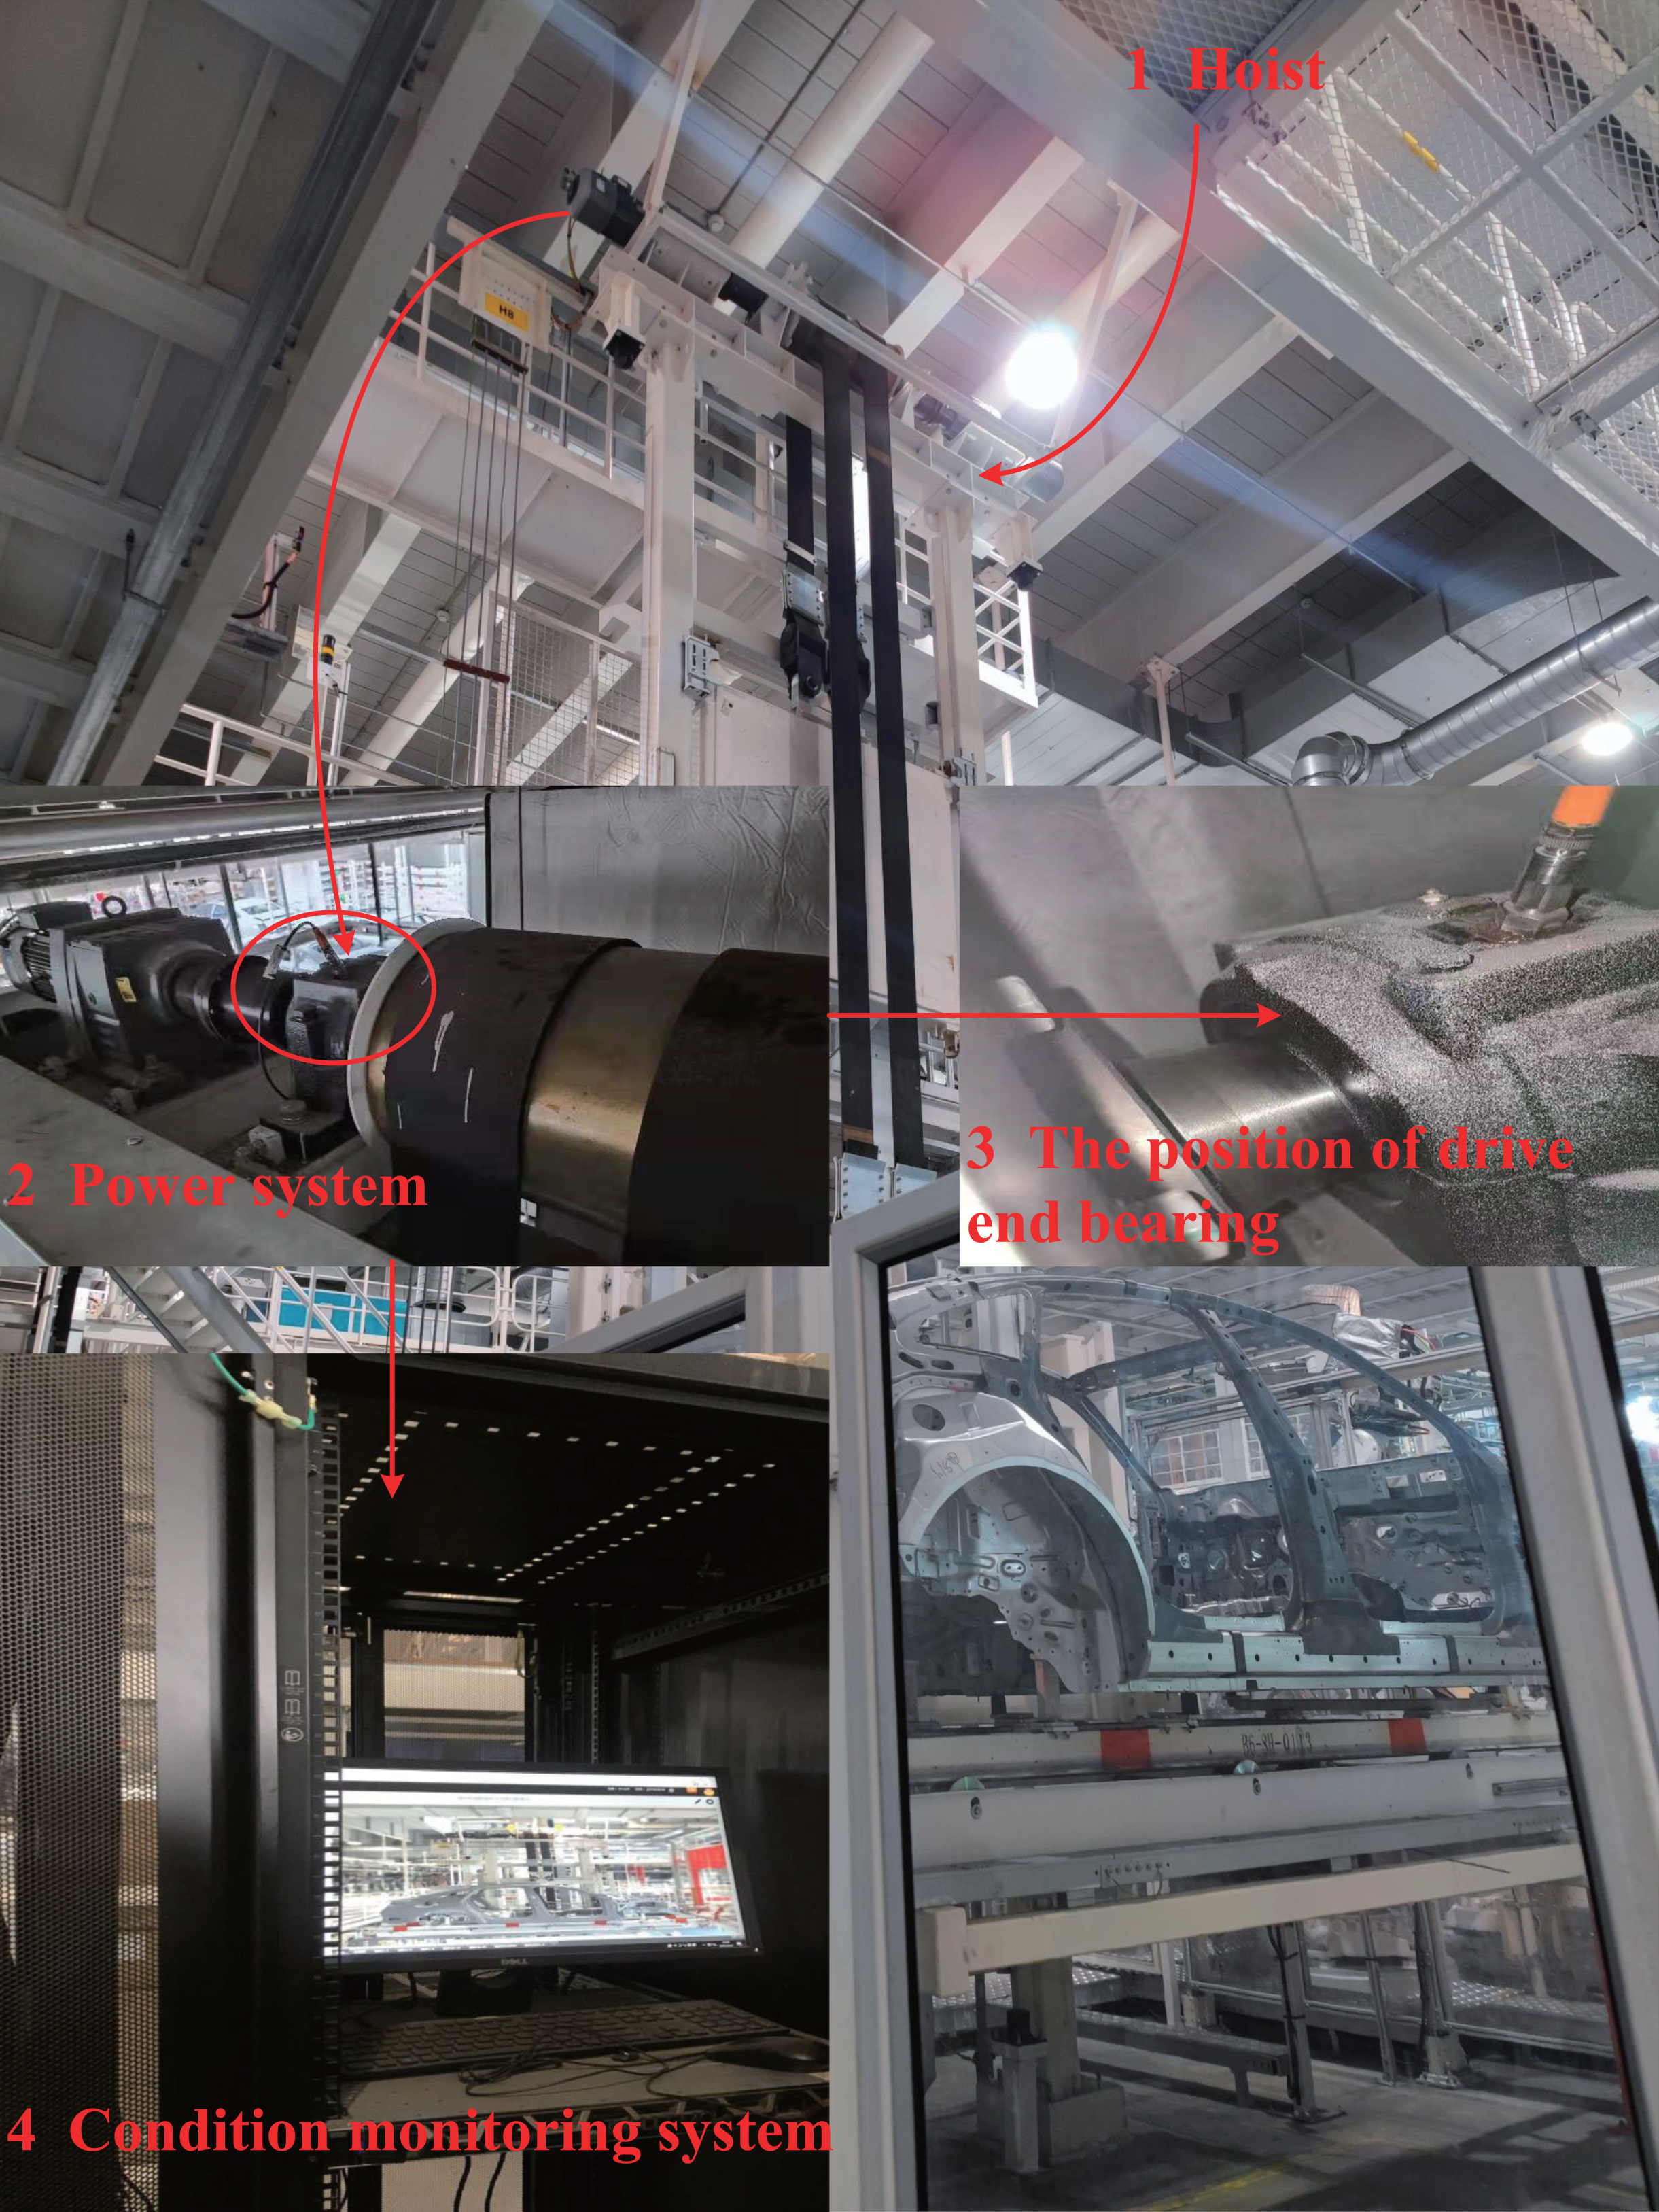
The condition monitoring system in the BIW welding production line.
Anomaly detection methods can be divided into three aspects, statistical approaches [2], neural networks [3] and deep learning approaches [4]. As a conclusion, the anomaly detection tasks can be dealing with classification-based methods. Nowadays, classification problem researches for bearings based on machine learning (ML) methods have been attached attentions. For example, Josue et al. [5] considered both acoustic and vibration data for bearing fault detection. In their work, three different supervised ML methods were proposed for faults classification, and an accuracy above 96.6% was achieved in all methods. Vos et al. [6] designed a new architecture called two-step long-short-term memory (LSTM) plus one-class support vector machine (SVM). In details, the problem of gradual increase of the random component of the bearing signal caused by faults was solved, and the detection and separation of abnormal signals were achieved. Deep learning methods also play an important role in anomaly detection. Huang et al. [7] presented an innovative deep-learning based model which named memory residual regression AE (MRRAE), and the model owned a good recognition performance. Kamat et al. [8] proposed hybrid autoencoders (AE) –LSTM framework for fault detection, which enhanced faults classification accuracy. According to above literatures, some achievements have been made in the intelligent anomaly classification and impurities of signals reduction. Much of the current research has focused on separating anomalies from the large amount of operational signal data. However, little attention has been paid to classifying anomalies for degrees with their sizes and their impact on system operation. In actual BIW welding line, the sample data will be marked according to the degree of abnormality based on the engineer’s experience and results of experimental sample analysis. There are challenges in the intelligent anomaly detection model establishment. How to combine with expert knowledge to achieve intelligent multi-classification of the health status of DEBs needs to be studied.
The belief rule base (BRB) is regarded as an intelligent expert system which combines with expert knowledge [9]. The ability of BRB is to build nonlinear models and to handle both qualitative information and quantitative knowledge [10]. Recently, many extended applications of the BRB fault diagnosis model have been applied in different areas. Cheng et al. [11] considered two disturbance factors that affect the observed data in engineering practice, which were converted to the static reliability and dynamic reliability of the attributes in the BRB. And a discount method was developed based on Dempster-Shafer (D-S) theory for a more accurate diagnosis of BRB. Jia et al. [12] integrated interval-valued neurotrophic sets (IVNSs), BRB and D-S evidence reasoning methods into a fault detection method, then an accurate detection consequence was obtained. In literature [13], a deep slow feature analysis and belief rule base method (DSFA-BRB) was developed for incipient fault detection of high-speed trains. At present, for BRB and its application research, scholars are devoted to changing the BRB model structure or studying the type and number of input model features, and the ultimate goal is to improve fault diagnosis and detection accuracy.
To improve the working efficiency of the BRB model, multisensory fusion technologies have been paid much attention in recent years. Multisensory fusion methods have been wildly applied in fault diagnosis and other fields [14-16]. Multisensory fusion for fault diagnosis has been divided into three strategy levels: data-level fusion [17,18, 17,18], feature-level fusion [19,20, 19,20], and decision-level fusion [21,22, 21,22]. In the area of feature-level fusion problem research, statistical approaches are widely applied for feature fusion. For example, in literature [23], the time-domain and frequency-domain features of the flame oscillation signals were fused by principal component analysis (PCA), and a neural network model was established to identify the fuel type. Wang et al [24] delivered kernel principal component analysis (KPCA) to fuse the features of force and vibration signals. By retaining the principal components, although the effect of dimensionality reduction was achieved, some important information were lost. Moreover, the uninterpretable problem of the output results was caused by the feature fusion of different attributes. Nowadays, deep learning approaches have been applied in feature fusion. Fan et al. [25] proposed a CNN-based multi-feature fusion method. Specifically, the magnetic signal was pre-processed, and features were put into the one-dimensional convolutional neural network (CNN) model to identify whether the anomaly signal exists or not. Furthermore, Wang et al [26] took advantage of an improved CNN method to improve fault diagnosis accuracy, and the method was effective for weak fault signals detection. However, the problem of detecting features containing multiple anomalous attributes was not considered. Chen et al. [27] proposed multiscale feature fusion method based on the residual network, and the consequences improved the detection accuracy of multiple types of surveillance video anomalies. But the residual network method belongs to image processing techniques and not deals with signal processing. As well, similar studies of feature fusion based on deep learning methods can be found in literature [28,29, 28,29]. In summary, past studies have focused on feature fusion to improve anomaly detection accuracy and weak anomalies mining. However, due to the IF-THEN expert rules and reasoning mechanism of the BRB model, the challenge for multisensory feature fusion methods applied to the BRB is the interpretability of input fused features.
The weighted sum method has been applied to fault detection technologies recently. For instance, Ke et al. [30] delivered hierarchical weighted permutation entropy (HWPE), which contributed to describing the complexity of fuel pressure signals. Song et al. [31] proposed the weighted-kurtosis variational-mode decomposition and an improved frequency-weighted energy operator (IFWEO). As a low-speed bearing-fault diagnosis method, the IFWEO method was able to effectively reduce the effects of noise. According to the structure of weighted sum method, complete information of the data is retained. The weighted sum method aims at fusing physical quantities of the same attribute.
In order to deal with issues mentioned above for anomaly detection of DEBs in the BIW welding production line, a new hybrid anomaly detection method is proposed in this work. The details of an improved BRB method are shown as followings. First, the linear weighted sum (LWS) method is used for time-domain and frequency-domain features fusion respectively. The weight values contribute to reflecting which DEB affects the power system more serious. Then, the fused features are put into the BRB model for training. Meanwhile, the covariance matrix adaption evolution strategy (CMA-ES) is delivered to optimize the parameters of BRB model. Finally, the anomaly detection results of DEBs are realized by the improved BRB method. The contribution of this work is that an improved BRB method is proposed for accurate anomaly detection of DEBs in the actual BIW welding production line.
The contribution of this work is that, in order to break through limitations of current anomaly detection methods that cannot deal with multi-objective classification tasks, an improved BRB anomaly detection method is proposed. To improve the accuracy of detection, LWS method is applied for feature fusion of the same physical meaning, and the outputs are interpretable. The accuracy of detection result of proposed method is higher than the normal BRB method and compared methods. The remainder of this paper is organized as follows. In Section 2, some preliminary concepts are presented. The proposed improved BRB method is described in Section 3. Experimental validation is performed to evaluate the proposed method in Section 4. Section 5 draws the conclusions and future work.
Linear weighted sum method
Assume that there are parameters
The weight coefficients are important factors for evaluating the quality of the fusion result. Normally, it is not wise to rely on empirical knowledge to determine the value merely. In this paper, the entropy weight method is applied for the weight coefficients calculation. The details of the entropy weight method are shown in Algorithm 1. The steps of the entropy weight method are proposed as
n-the number of items,
m-the number of parameters for each item,
p0-initial values of the weight coefficients,
x ij -parameters, i = 1, . . . , m, j = 1, . . . , n.
p ij -updated values of the weight coefficients, j = 1, 2, . . , n.
1: Normalize x ij into the range [0, 1].
2: Set the p0 values as |1, 1, . . . , 1|1×n.
3:
4:
5:
6:
7:
8:
9: d j = 1 - E j .
10:
11:
12:
13:
The BRB was developed on the basis of D-S evidence theory, decision theory, fuzzy theory and traditional IF-THEN rule base. It has the ability to model data with fuzzy uncertainty, incompleteness or probabilistic uncertainty and non-linear characteristics. The k th rule of the BRB is represented as
The confidence rule base is a knowledge expression framework. When a certain set of fault feature quantities is input, it can be combined with multiple rules in the confidence rule base to infer the fault diagnosis result, which is realized by an inference algorithm. The evidence reasoning (ER) algorithm is proposed to solve above tasks. Dempster’s rule used in the algorithm to synthesize the evidence after preprocessing, which not only satisfies the commutative law and the associative law, but also keeps the specificity of the evidence unchanged. The specific steps are as follows:
1) Activation weight calculation
2) ER rules (Eq. (4) to Eq. (6))
The output of the BRB can be achieved by merging multiple rules with ER rules as
Finally, the expected utility is obtained of S (x), and y represents the health status of the object
In the BRB-based model, the initial parameters of the model are given by experts, which are subjective, resulting in the inaccuracy of the anomaly detection model. In order to improve the accuracy of detection results, the initial BRB needs to be optimized in order to minimize the error between the actual output and the initial BRB output. The covariance matrix adaption evolution strategy (CMA-ES) algorithm [32,33, 32,33] is used to optimize the BRB parameter vectors. The constraints of BRB parameter vector
The objective function is:
This section describes the improved BRB method for anomaly detection of the DEBs. Figure 2 illustrates the flow chart of the proposed method. The implementations of the proposed method include four steps.
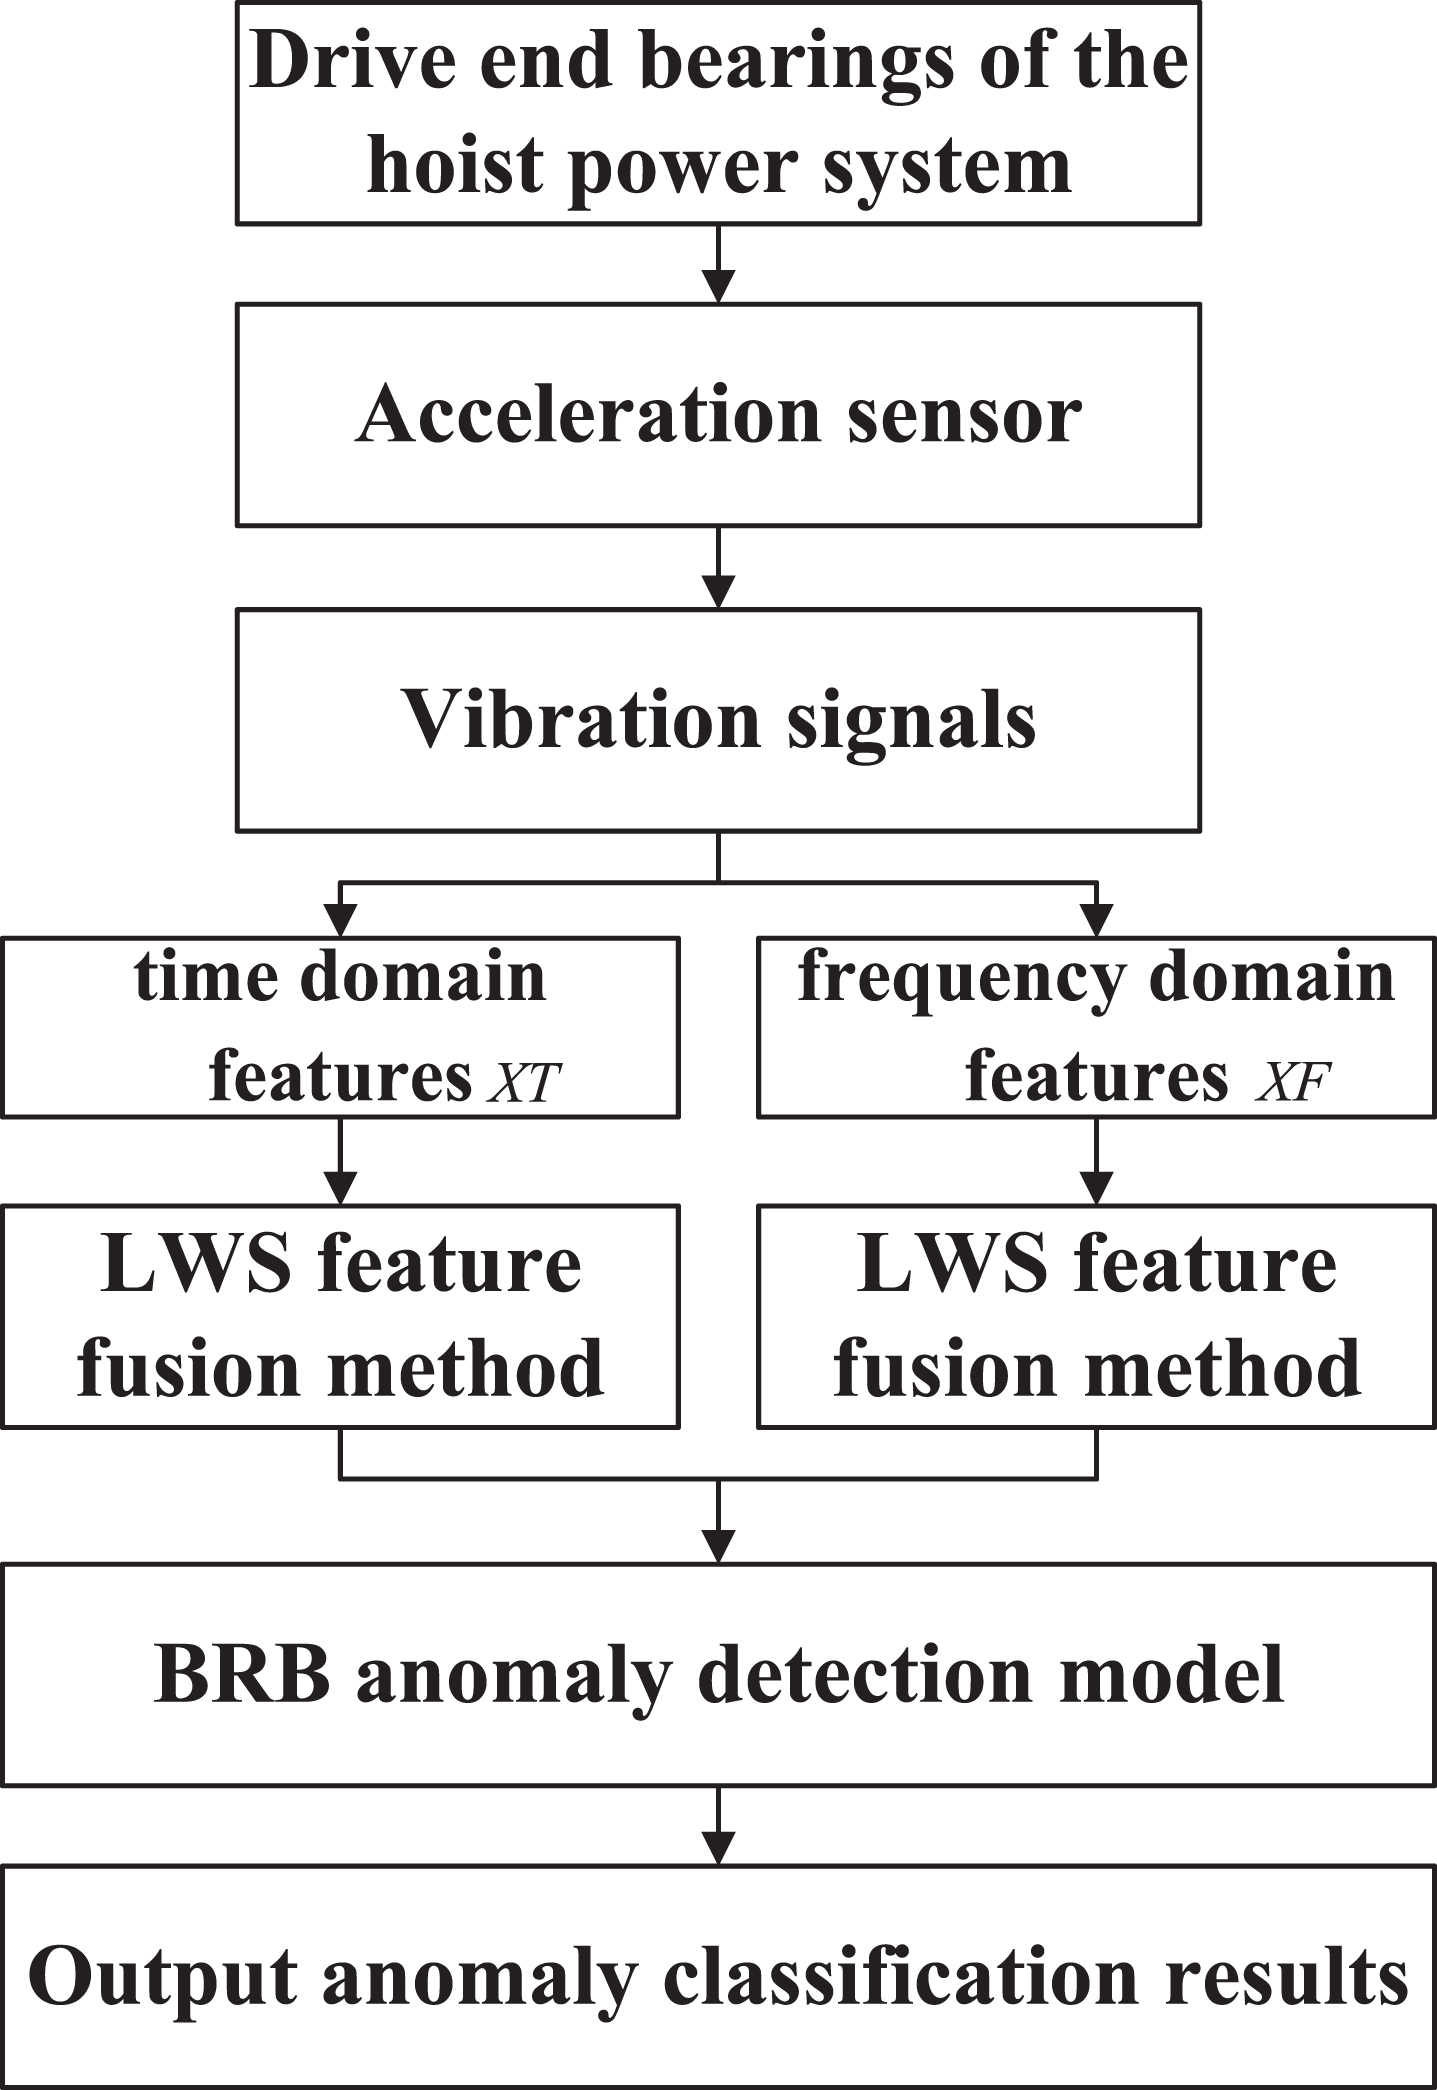
The flow chart of proposed method.
In this paper, in order to deal with the anomaly detection issue of DEBs of the real BIW line, and the improved BRB method is delivered. The vibration signals of DEBs of motors are taken into account for evaluating the hoist power system performance. As known, the vibration data are collected by the acceleration sensors. In this section, assume the number of sensors is n, the relevant numbers of time-domain and frequency-domain characters are m, and the time domain features are defined as
First, time-domain and frequency-domain features should be considered respectively. Inspired by formula (1), the results of LWS fusion technology can be described as
Then, put the fused features η T and η T into the BRB model, and the anomaly detection is realized for hoister power system. Finally, refer to the Eq. (2) - Eq. (11), the output reference values y i of fault types are put forward.
In order to evaluate the performance of the proposed improved BRB anomaly detection method, the real case study of BIW welding production line is conducted in this work. Figure 3 illustrates detailed process of the proposed DEB anomaly detection method.
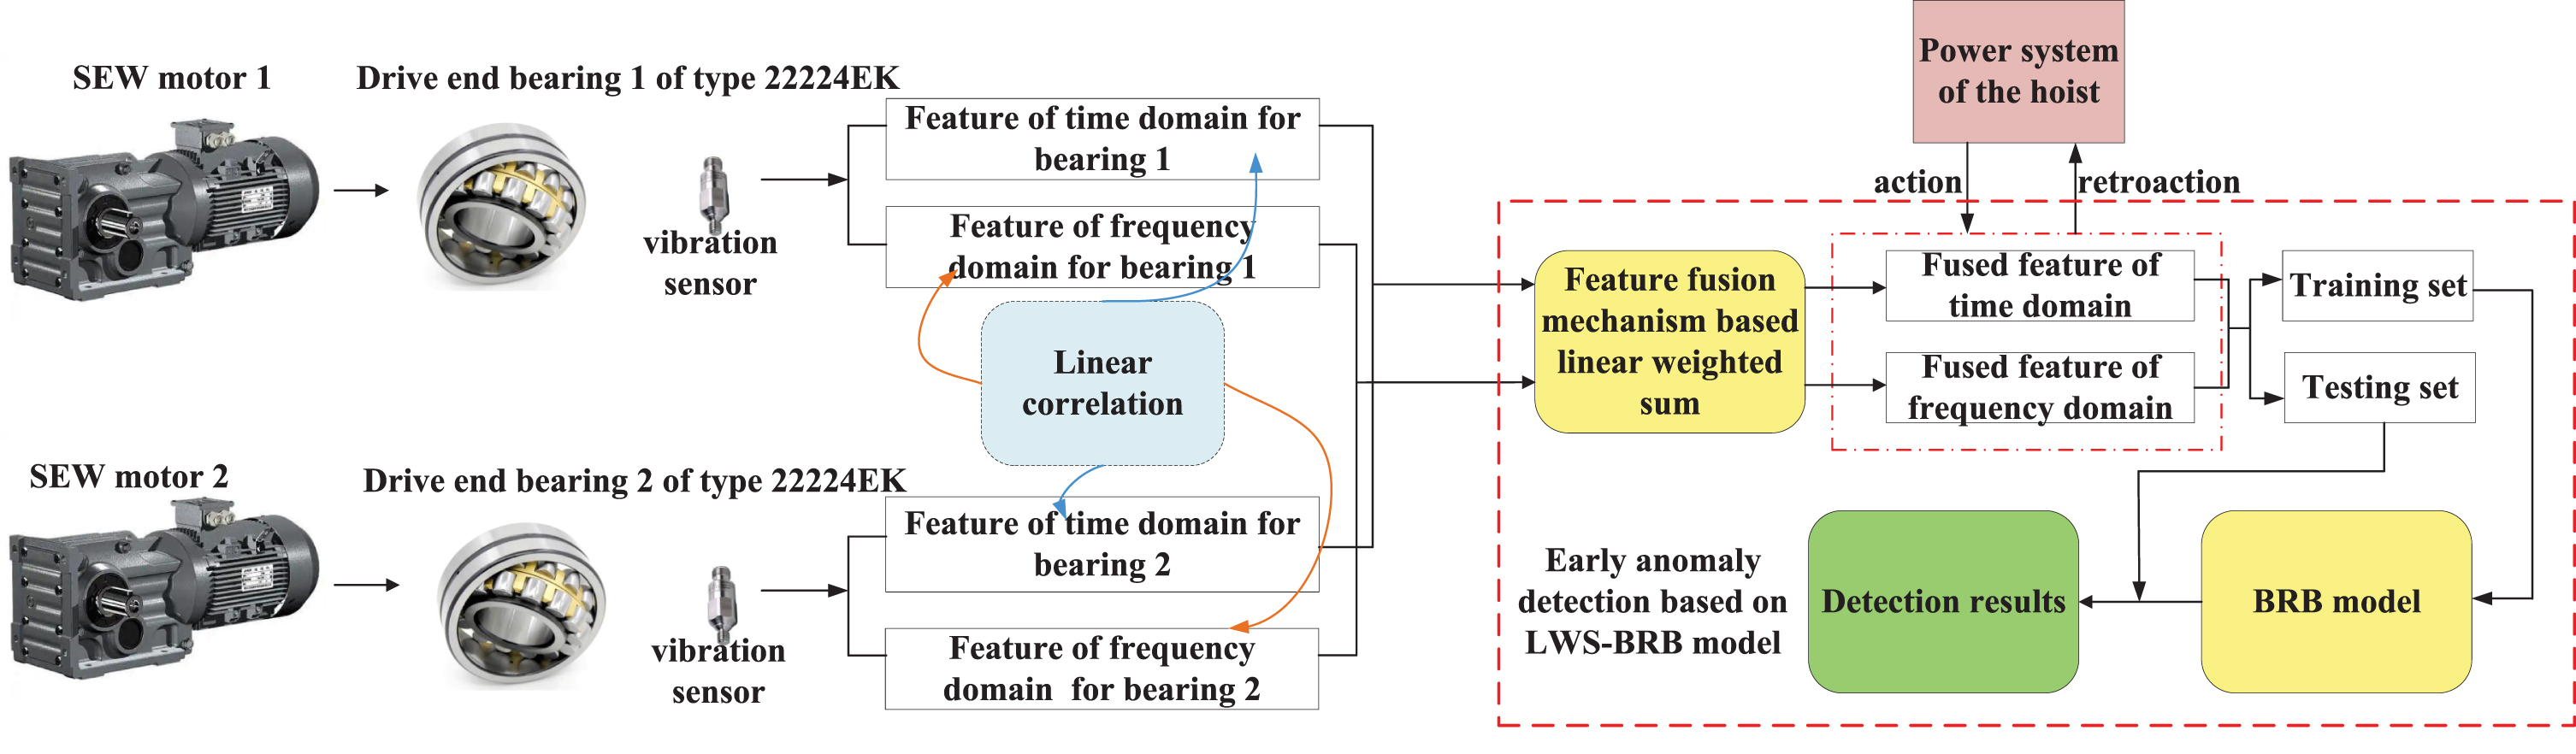
Overview of the proposed method for the DEBs.
In this case, the vibration dataset acquired from the monitoring system of the BIW welding production line are used to evaluate the proposed method. Figure 4 is delivered to illustrate the feature acquisition form in the BIW welding production line. Be learned from the Fig. 4, the vibration analysis module is used for data preprocessing of acquired vibration data. According to feature extraction from the vibration analysis module which set up by engineers, the specific extracted features are time-domain peak (TDP) and frequency-domain peak (FDP). TDP is calculated as the integration of time domain signals x (t), integral range is 1 second. FDP is calculated as the integration of frequency domain signals x (f), integral range is 10-1000Hz.
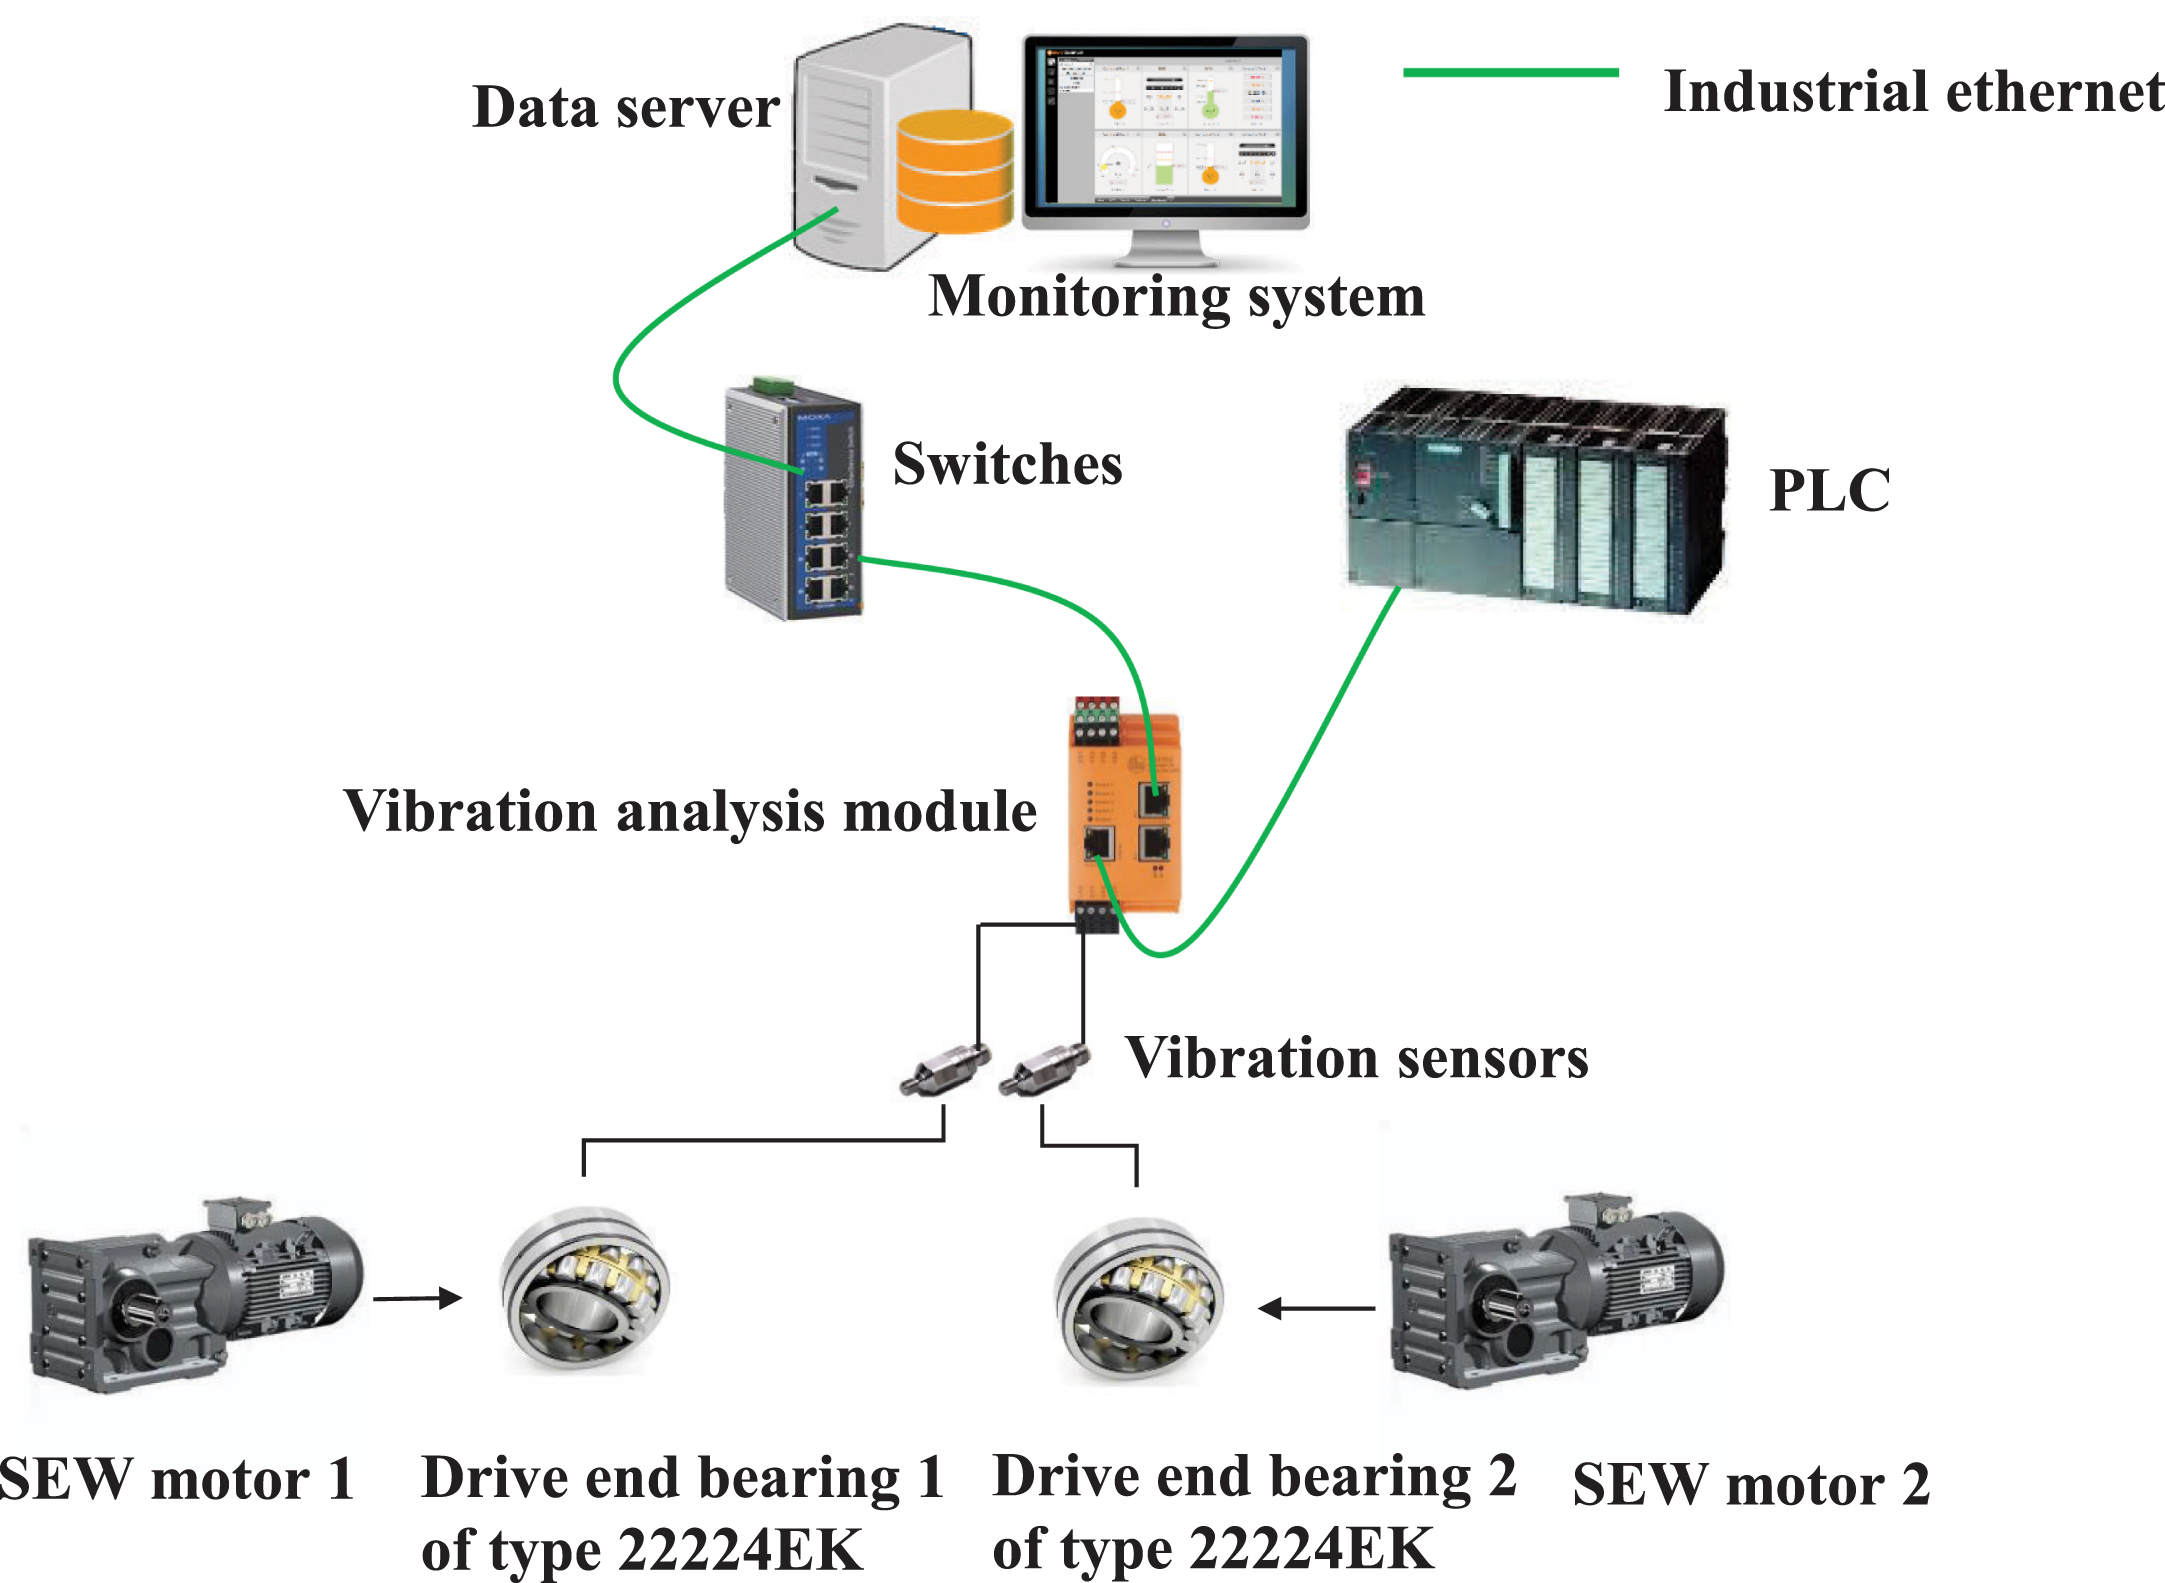
Vibration features acquisition form.
The type of the drive motor is R97 DRN112M4 22RPM BE5 HR TH/ES7C/M1-270-3 i=65.21, the brand is SEW. The type of the DEB is 22224EK, the brand is SKF. As the result of confidentiality, the specific types of sensors and vibration analysis modules are not convenient to provide in this section. The sampling frequency is set to samples per time, and sampling interval is set to 1 second.
The extracted TDPs and FDPs of DEB 1 and DEB 2 are shown in Fig. 5. The monitoring time range is from December 25, 2019 to June 4, 2021. The description of total original samples is shown inTable 1.

The energy values of TDPs and FDPs of DEBs.
Description of the original extracted samples
Inspired of the practical engineering experiences of the BIW welding production line, the anomaly types of TDP and FDP of the DEB are classified into healthy stage, unhealthy stage and abnormal stage. And they are shown in Table 2. It should be noted that, the classification of healthy, unhealthy and abnormal data is determined by the engineers in the field, in other words, the sample data we obtain is labeled data that has been tagged. Furthermore, the unhealthy data set represents under-lubricated bearings and poor drive-side coupling alignment. Abnormal data set represents excessive load, abnormal reduction gear. However, the actual working environment is complex, and the number of sensors is limited. Consequently, the analysis can only be performed from the bearing components, which has limitations and cannot achieve accurate fault attribute assignment. The anomaly types D are displayed in the Table 3, which are contributed to the improved BRB method. Three referential points are chosen for D, healthy, unhealthy and anomaly, which are described as
Threshold values of the TDP and FDP energies of the DEB
The referential points and values of D
The 90 samples of TDPs and FDPs are carried out from the DEB 1 and DEB 2 for experiments, which contain 30 healthy samples, 30 unhealthy samples and 30 anomaly samples. And the description of experimental samples is shown in Table 4.
Description of the experimental samples
Acquired from the data of REBs (December 25, 2019 to June 4, 2021), the total numbers of anomalies of TDPs and FDPs for DEBs are delivered in Table 5 respectively. As shown in Table 5, the total numbers of abnormal TDP data of the DEB 1 are far more than DEB 2, the total numbers of abnormal FDP data of the DEB 1 are similar with DEB 2. According to the Table 6, the consequences of weight coefficients of DEB 1 and DEB 2 are identical with the results of the Table 5.
The total abnormal data numbers of DEBs
The total abnormal data numbers of DEBs
The weight coefficient α j calculation results
According to the Eq. (9) and (10), the fusion consequences η T and η F have been calculated. In addition, features of the same attribute of different anomaly stages are integrated by LWS method, and the threshold values of the Table 1 are not changed.
The referential points and values of D have been set integrally. In this section, referential points and values of change rate A of fused TDP and FDP features are put forward in Table 7. The change rate A
i
includes zero (Z), medium (M) and large (L), which are describes as
The referential points and values of A1 and A2
According to the above reference values, an anomaly detection BRB expert system for DEBs is established. The BRB contains 9 initial confidence rules, and θ k and D j are assumed to be 1, and the initial BRB model is obtained. After that, the initial BRB model is optimized by training samples, and the updated BRB is tested by testing samples.
In this section, 70 percents of the total samples are selected as training set, and the rest of the sample is selected as testing set. The root mean square error (RMSE) is proposed to evaluate the classification accuracy of anomaly detection using updated BRB model. The RMSE calculation process is shown as
The anomaly detection result of proposed method is shown in Fig. 6, and the RMSE value is 0.034. The result indicates that the improved BRB model can fit the abnormal states accurately, and detection results own small errors with actual running states of the hoist.

The anomaly detection result of proposed method.
First, the independent anomaly detection results of DEB1 and DEB2 based on the normal BRB method are proposed in Figs. 7 and 8. And the comparison results are shown in Fig. 9, which demonstrates improved BRB method gains more accurate performance with the operating state of the hoist power system. The RMSE values comparison results are shown in Table 8.

The anomaly detection result of DEB 1.

The anomaly detection result of DEB 2.
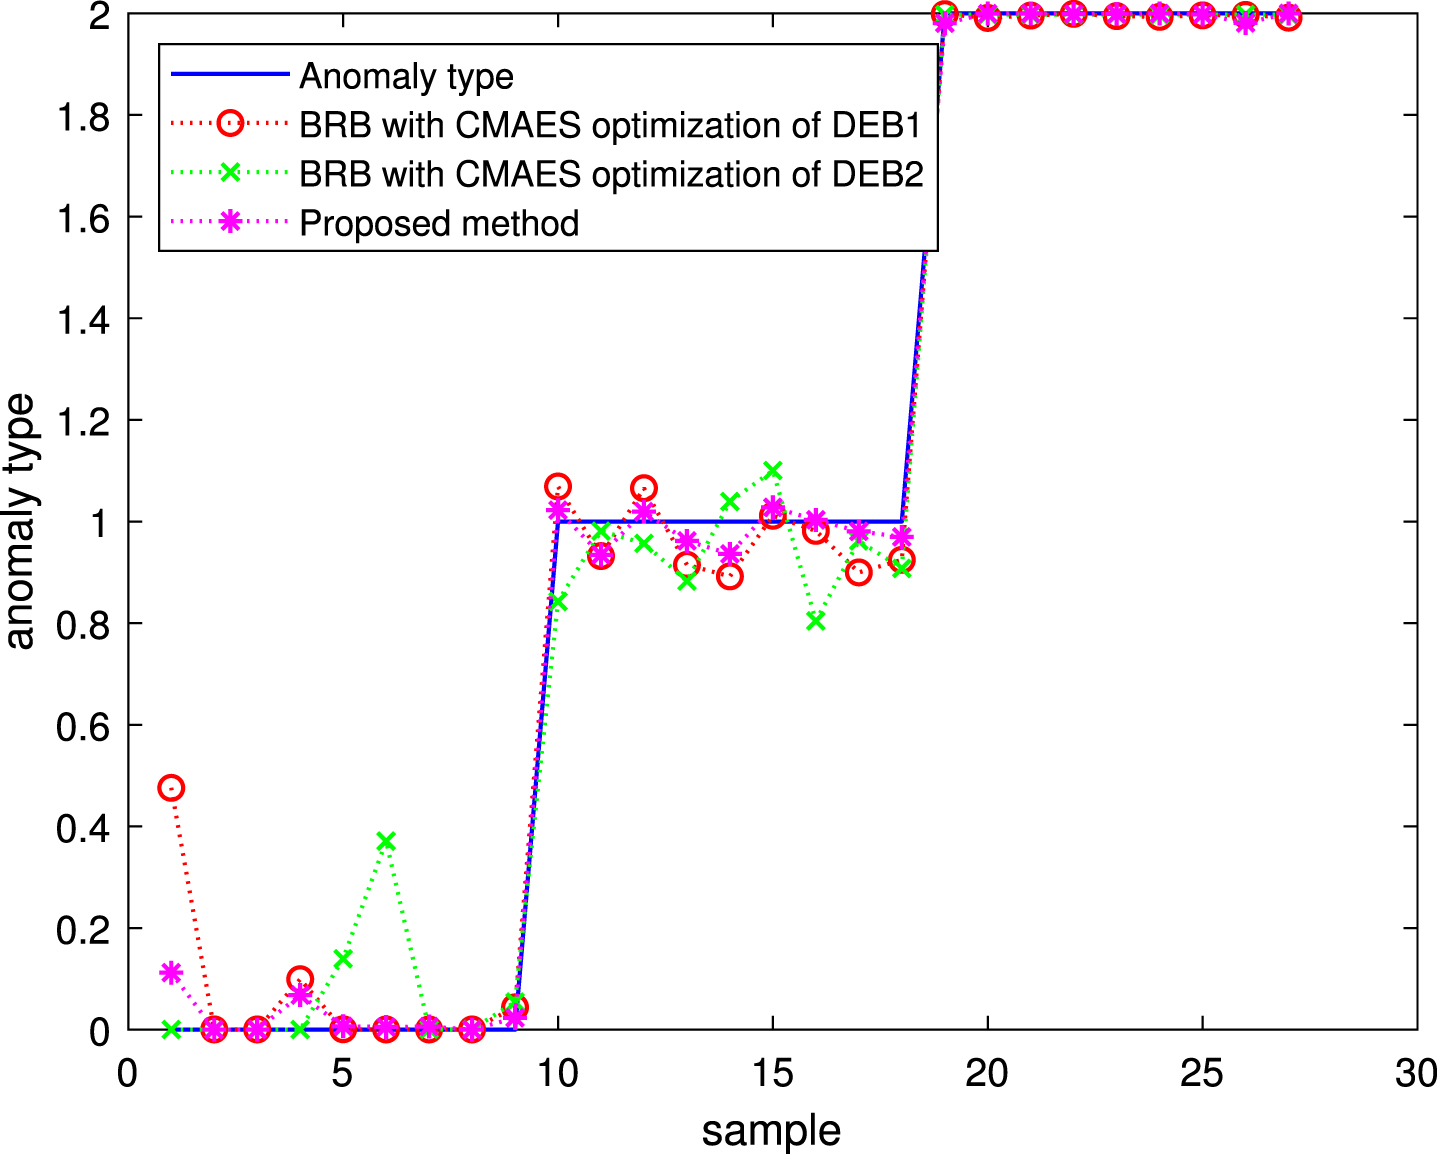
The comparison results between the improved BRB and normal BRB detection methods.
The RMSE comparison results
Then, the fivefold cross-validation is conducted to evaluate the robustness of the proposed method. Other detection methods based on neural network are selected for comparative experiments to further illustrate the advanced property of the proposed LWS-BRB in this paper. Specifically, the radial basis function (RBF) neural network [34], back propagation (BP) neural network [35] are put forward for comparison. It should be mentioned that, in order to reflect the advanced nature of the LWS fusion method, the data utilized by the compared methods are original dataset. In this paper, the data of DEB1 is used for the implementation of comparison method and the exhibition of effects. The software working environment is MATAB, and the toolboxes of RBF and BP classifiers are used in this section. The details of parameters setting of RBF and BP are shown in Table 9 and Table 10.
The parameters setting of RBF
The parameters setting of BP
Figure 10 demonstrates the results of fold 1 to fold 5 cross-validation. In details, the samples are randomly divided into five parts, and one of the them is chosen as the testing set for each fold cross-validation, while the remaining four parts are regarded as the training sets. In different fold cross-validation, the RBF and BP networks are put forward for comparing with the proposed method.

Three different methods using testing datasets in fivefold cross-validation given by (a) sample 1 is selected as testing data, (b) sample 2 is selected as testing data, (c) sample 3 is selected as testing data, (d) sample 4 is selected as testing data, (e) sample 5 is selected as testing data.
According to Equation (16), the RMSE values are calculated of different methods, then the consequences are provided in Fig. 11. The RMSE results illustrate that a higher accuracy of classification is gained with the proposed method in this paper.

Different RMSE values in fivefold cross-validation.
Deep learning methods have been widely applied in the area of fault detection and diagnosis [36-38]. To further discuss the effectiveness of the proposed method, two deep learning methods are added for comparison in this paper. In details, bidirectional long-short-term memory (Bi-LSTM) neural network [39] and gates recurrent neural (GRU) [40] network are put forward in this section. First of all, the criteria for evaluating the merits of algorithms need to be standardized. In this paper, the merit of the improved BRB is evaluated by the magnitude of the RMSE value. In other words, the better performance of model is gained with the smaller RMSE value. However, in the deep learning-based fault diagnosis methods or popular diagnosis methods, merits of the models are often tested by values in percentage forms. In this section, we shall define a new unified criterion for comparing deep learning methods with the proposed method. We use absolute error E to evaluate the performance of model, and the E can be defined as
Then, E is limited by the threshold ω. If the value of E exceeds the threshold ω, it is considered a classification error and the fault is not detected. Conversely, if the value of E does not exceed the threshold ω, and the classification is considered correct and the fault is detected successfully. In this paper, the threshold ω is set as 0.05. Suppose we use ’error=0’ for successful classification and ’error=1’ for failed classification, a new unified criterion is defined as
The parameter settings of the Bi-LSTM and GRU are shown in Table 11 and Table 12. The parameter settings shown in the table are applied into the fivefold cross-validation tests. Since the total sample size has not been changed, the model parameters are set to a constant value. If the number of the training set is changed, the iterations are slightly adjusted merely. To ensure the fairness of the experiments, the model parameters are obtained at the minimum errors of results.
The parameters setting of Bi-LSTM
The parameters setting of GRU
Then, the results of comparisons are shown in Fig. 12. The BP network and RBF network methods are compared with other methods using the new unified criterion of Equations (17) and (18). As shown in the figure, the proposed method gains the highest accuracy in fivefold cross-validation tests.

Different accuracy of methods in fivefold cross-validation.
An improved BRB-based anomaly detection method for DEBs has been proposed. Most of the current anomaly detection methods use binary classification methods, which cannot deal with the multi-level classification problem of multi-attribute anomaly samples. Moreover, in practical engineering, most of them use manual tagging to multi-level classification of multi-attribute anomaly samples, which is prone to the problem of omission. To address the above problems, the LWS method has been proposed to fuse the features based on the time-domain and frequency-domain features (TDPs and FDPs) respectively. The formed fused features have been put into the BRB model containing the ER mechanism to achieve anomaly detection of the DEB. The effectiveness of the proposed method has been verified by the real historical data provided by the hoist condition monitoring system of the actual BIW welding line. Take 70% of the total data as the training set, the proposed method performs better compared with the normal BRB method with CMA-ES optimization. Fivefold cross-validation has been taken into account for comparison tests. And the proposed method has been verified with a higher accuracy compared to BP neural network, RBF neural network, Bi-LSTM neural network and GRU network. It has been verified that the improved BRB method is suitable for DEB anomaly detection in the BIW welding line.
In the future work, the following two aspects are mainly focused on. On the one hand, the more complex electromechanical equipment of the BIW welding production line will be explored for researching on multisensory fusion problems. On the other hand, dealing with issues of interpretable anomaly detection, the weight assignment method of the LWS algorithm will be extended to design a more efficient fault detectionmethod.
Footnotes
Acknowledgments
This work was supported in part by the National Natural Science Foundation of China under Grant 61973046, U22A2045, and the Science and Technology Department of Jilin Province under Grant 20200301038RQ, and the Major Science and Technology Projects of Jilin Province and Changchun City under Grant 20210301033GX.