
Abstract
Microaneurysms, tiny, circular red dots that occur in retinal fundus images, are one of the earliest symptoms of diabetic retinopathy. Because microaneurysms are small and delicate, detecting them can be difficult. Their small size and cunning character make automatic detection of them difficult. In this study, a novel encoder-decoder network is proposed to segment the MAs automatically and accurately. The encoder part mainly consists of three parts: a low-level feature extraction module composed of a dense connectivity block (Dense Block), a High-resolution Block (HR Block), and an Atrous Spatial Pyramid Pooling (ASPP) module, of which the latter two modules are used to extract high-level information. Therefore, the network is named a Multi-Level Features based Deep Convolutional Neural Network (MF-DCNN). The proposed decoder takes advantage of the multi-scale features from the encoder to predict MA regions. Compared with the existing methods on three datasets, it is proved that the proposed method is better than the current excellent methods in the segmentation results of the normal and abnormal fundus. In the case of fewer network parameters, MF-DCNN achieves better prediction performance on intersection over union (IoU), dice similarity coefficient (DSC), and other evaluation metrics. MF-DCNN is lightweight and able to use multi-scale features to predict MA regions. It can be used to automatically segment the MA and assist in computer-aided diagnosis.
Introduction
Diabetes is a well-known chronic condition that has been linked to an alarming increase in the number of deaths worldwide [1]. The negative impact of diabetes can be observed in the retina of the eyes, which can lead to significant vision loss at later stages of the disease. Diabetic Retinopathy (DR) is a condition in which the eyes are harmed as a result of diabetes. The presence of high levels of sugar in the blood vessels of the retina causes this worrying disease [2]. As a result, it is critical to detect DR at an early stage of the disease in order to save the patient’s life. Retinal fundus images play an important role in the auxiliary diagnosis of related eye diseases such as glaucoma, diabetic retinopathy, and maculopathy[3]. The optic disc is the entry point for major blood vessels[4, 5], which appears as a round or oval region on color retinal images with a clear boundary [6, 7]. In the diagnosis and evaluation of diseases, the accurate segmentation of the MA regions requires high standards. If the MA is segmented manually, the segmentation results will be subjectively affected and manual segmentation is also time-consuming [8]. There- fore, it is desirable to develop artificial intelligence algorithms to improve the accuracy and efficiency of MA region segmentation.
In the past, researchers have developed many algorithms for automatic MA segmentation. According to whether these algorithms have a deep neural network or not, they can be divided into methods based on traditional machine learning and methods based on deep learning. A variety of methods based on traditional machine learning mainly locate the position of the MA according to the fundus features [9, 10], and then extract the features of the MA to segment it, such as Super-pixel Classification [11], Hough transform [12] and Otsu threshold method [13]. However, these methods are sensitive to image brightness, texture, and fundus morphology. During the segmentation process, the high contrast of retinal blood vessels or the deformed shape caused by lesions will adversely affect the results [14]. Some algorithms choose to use morphological methods to remove blood vessels, and then use machine learning algorithms to segment the MAs. For instance, Sarathi et al. [15] proposed a region-growing technique based on an adaptive threshold for disc segmentation. Gopi et al. [16] combined Principal Component Analysis (PCA) and Markov Random Field (MRF) for segmentation. Dharmawan et al. [17] improved filter algorithm to detect OD boundary candidates, and finally applied the Hough transform and B-spline approximation to determine the OD. Although these algorithms have made great progress, their poor generalization ability and insufficient accuracy hinder their further application.
In recent years, the development of Deep Convolutional Neural Networks (DCNNs) in medical image analysis, such as Fully Convolutional Networks (FCN) [18], U-Net [19], and DeepLabv3+ [20], brought exciting prospects for medical image segmentation. DCNNs have been widely used in organ segmentation [21], disease detection [22], dis- ease classification [23], and other related fields [24]. For OD segmentation, researchers applied DCNNs to produce a pixel-level probability map and predicted OD and optic cup boundaries [25]. Fu et al. [26] proposed a multi-label deep network named M-Net, which adopted polar coordinate transformation as a preprocessing method to improve the contrast of image edges. Qin et al. [27] improved FCN with the inception module to get more features. Wang et al. [28] proposed a coarse-to-fine deep learning framework and applied an overlapping strategy to identify the disc regions.
Although the above innovative deep learning methods have made effective progress in OD segmentation, due to the fact that the segmentation model does not extract richer global feature information in the feature extraction process, there is a big gap in the effect of boundary segmentation between different algorithms [35]. Using only the final output features of the encoder may lead to ignoring the advantages of the original features, and eventually lead to the omission of a large amount of global semantic information in image prediction, thus weakening the segmentation performance of the network. In addition, high model complexity and a large number of parameters are also the development trend of the segmentation model, which makes it difficult for neural networks to converge and train. To overcome the above limitations, this paper proposes a novel deep learning framework to automatically segment the OD regions. The proposed model extracts rich features using fewer network layers and parameters and fuses multi-scale feature information in the decoder for segmentation.
A novel deep learning framework based on the encoder-decoder structure is proposed, which has fewer network parameters than other existing high-efficiency convolution networks, and it can be applied to automatically segment the MA regions of retinal fundus images. An encoder composed of Dense Block, HR Block, and ASPP module is designed. The encoder has three output paths, which output feature maps of different scales respectively. The combination of high-level and low-level features enables the network to have richer feature information. Three different scale features of the encoder outputs can directly participate in the decoding process via skip connection. The decoder sequentially fuses multi-scale semantic features to recover resolution and predict regions of interest. It can make full use of rich spatial information and low-level semantic information. The proposed method is applied to IDRiD, ROC and e-ophtha-MA datasets, and the results show that MF-DCNN has strong segmentation performance. The experiments and ablation study results show that This proposed method is superior to the above methods in MA segmentation.
The structure of this paper is as follows. Chapter 2 summarizes the current algorithms of MA automatic recognition and puts forward the existing problems. Chapter 3 describes the specific process of the proposed method. Chapter 4 makes a comparison between the results of the proposed method and the advanced algorithms. Chapter 5 discusses the proposed methods and concludes the work of this paper.
Related work
The purpose of the segmentation of retinal vessels is to locate and identify the vascular structure in the fundus image. In recent decades, with the continuous improvement of computer performance, more and more algorithms are applied to retinal vessel segmentation. Because of the difference in learning mode, it can be divided into deep learning methods and rule-based learning methods [20]. Rule-based methods usually employ matched filtering, mathematical morphology, vessel tracking, or model-based techniques [21]. Matched filtering technology uses the characteristics of the blood vessel itself to simulate the contour of the blood vessel by maximizing the filter response. The method of mathematical morphology mainly considers the internal shape of the image without considering the intensity of the pixel, which means that it ignores the details of the image content. Finally, the model-based method is mainly divided into the contour model and the deformation model [22]. The retinal vessels have the characteristics of excessive branches and intersections, which makes the vascular contour model more complex. However, the deformation model usually only considers the edge information of the image and ignores other features, which leads to the low accuracy of the final segmentation.
Retinal vessel segmentation is an essential step for the analysis of different pathologies. In recent days, different algorithms like filter-based techniques, classifier-based machine learning algorithms, and network-based deep learning models are developed to segment the blood vessels for the detection of retinal diseases. Sushil Kumar Saroj et al. [12] proposed a Fr
Palanivel et al. [26] used multi-fractal characterization to reduce the noise of blood vessel images and proposed a segmentation method to enhance blood vessels.. Feng et al. [28] explored the cross-connected convolutional neural network (CcNet) and applied it to the task of blood vessel segmentation to improve the segmentation accuracy. In the CcNet, its cross-connection mode can automatically and effectively learn the multi-level features between the primary path and the secondary path. Yan et al. [29] proposed a new loss function for the retinal vessel segmentation task, namely segment-level loss. Using segment-level loss together with pixel-level loss can balance the importance of thin vessels and thick vessel in loss calculation. Yan et al. [30] proposed a convolutional neural network structure with three stages. Firstly, thick blood vessels and thin blood vessels were segmented respectively, and then the results were fused effectively. Through the separation and segmentation of thin and thick blood vessels, better distinguishing features can be obtained, thereby minimizing the negative impact of the imbalance. In the blood vessel fusion part, the final segmentation result is further refined by improving the consistency of the total thickness of blood vessels and distinguishing non-blood vessel pixels. To sum up, for the task of MA segmentation, the research based on deep learning has achieved some good results, but it is still possible to obtain more accurate results because it plays a key role in the early diagnosis of certain diseases. Therefore, it is very valuable and challenging to propose a more accurate algorithm for this task. This study is committed to building a more efficient neural network structure to complete the automatic segmentation of microaneurysms.
PROPOSED MA detection and segmentation SYSTEM
Segmentation of blood vessels in retinal images based on deep learning has achieved some good results, but it is still possible to obtain more accurate segmentation because it plays a key role in the early diagnosis of several diseases related to the eye.. Therefore, it is very valuable and challenging to propose a more accurate algorithm for this task. This study is committed to building a more efficient neural network structure to complete the automatic segmentation of blood vessels in retinal images.
Preprocessing
For a color fundus image, there are three channels of red, green, and blue, among which the value of the green channel can best represent the characteristics of MA compared with the value of red and blue [31]. Therefore, the green channel is the focus of the proposed method. Due to the influence of equipment, environment and other factors, random noise and shadows can be generated in the image. In order to eliminate the impact of these factors and make MAs more obvious, it is necessary to process the original image. In this work, the preprocessing stage consists of two stages such as image normalization and orientation.
Image normalization
Let I (x,y) shows the grey-level value at image division (x,y), M and VAR signify the calculated mean and variance of I (x,y) respectively and N(x,y) denotes the normalized grey-level value at the image element (x,y). The process for normalization algorithm implementation is defined below.
Image orientation
The mean square orientation estimation algorithm formulated by (Tam et al. 2005) is used to estimate the orientation of MA’s. The initial step in this algorithm is the block size (w×w) (25×25) that is positioned at the center of the image element i,j in the normalized image of microaneurysms. For each image throughout this block reckon, for every pixel location Gaussian gradient i(x,y) and j(x,y) and unit area gradient magnitudes in x and y direction are calculated.
MA Segmentation using Deep CNN
The Convolutional Neural Networks (CNNs) are the go-to machine learning algorithms to conduct DR-related tasks. The CNNs can perform automatic feature extraction as well as classification, which outperform traditional machine learning approaches. Since the CNNs are end-to end learning networks, it is essential that the input data (e.g. image datasets) is in high quality and quantity. Image processing is a must in order to achieve high-performing results. While the prior literature discussed the various type of image processing methods adopted in DR-related tasks, there are a few limiting factors about image pixels. Pixels are the results of the discrete acquisition and representation of images. They do not represent any semantic entities. In addition, there are a lot of pixels even at moderate resolution. The computation cost is significantly high which makes optimization tasks in pixel-level intractable. Furthermore, redundancies are present in images due to its rigid pixel grid. The proposed deep learning method for MA automatic segmentation is mainly based on the encoder-decoder structure [20], the overview of the developed network, as shown in Fig. 1. The encoder adopts Dense Blocks [36] to extract multi-scale low-level features. HR Block [37] replaces deep convolution neural network as the backbone feature extraction network to extract high-level features. There are only sixteen convolutional layers for HR Block, which effectively reduces the network parameters. ASPP module is adopted to enrich the high-level semantic information by atrous convolution and image pooling. To make full use of the multi-scale feature information, the feature map output by the encoder is up-sampled and fused with the output of the Dense block to gradually restore the resolution. Finally, a 1×1 convolution layer is applied to predict the MA region.

Overview of the developed network for segmenting the MA regions.The encoder consists of a pair of Dense Block and HR Block and an ASPP module. The decoder fuses the encoder output of three different scale feature maps to predict MA regions.
At present, most deep learning methods adopt serial connection, and the proposal of residual network makes the network very in-depth [38]. However, this scaling requires cumbersome manual adjustment, which usually pro- duces sub-optimal performance. And the total parameters of the network are very large, which makes model training difficult. High resolution network (HR-Net) may solve this problem. It is a parallel network structure, as shown in Fig. 2. First, the net starts with high-resolution feature mapping, gradually add high-resolution to low-resolution sub-networks, and connect multi-resolution sub-networks in the parallel network [37]. In the whole process, HR Net performs multi-scale fusion by repeatedly exchanging information on the parallel multi-resolution sub-network through the exchange unit. The exchange unit can receive information from other parallel sub-networks at the same stage. Each stage has one more branch than the previous stage. The new branch is the result of the fusion stride convolution of all feature maps in the previous stage. The resolution is half that of the previous stage, and the number of channels is twice that of the previous stage.
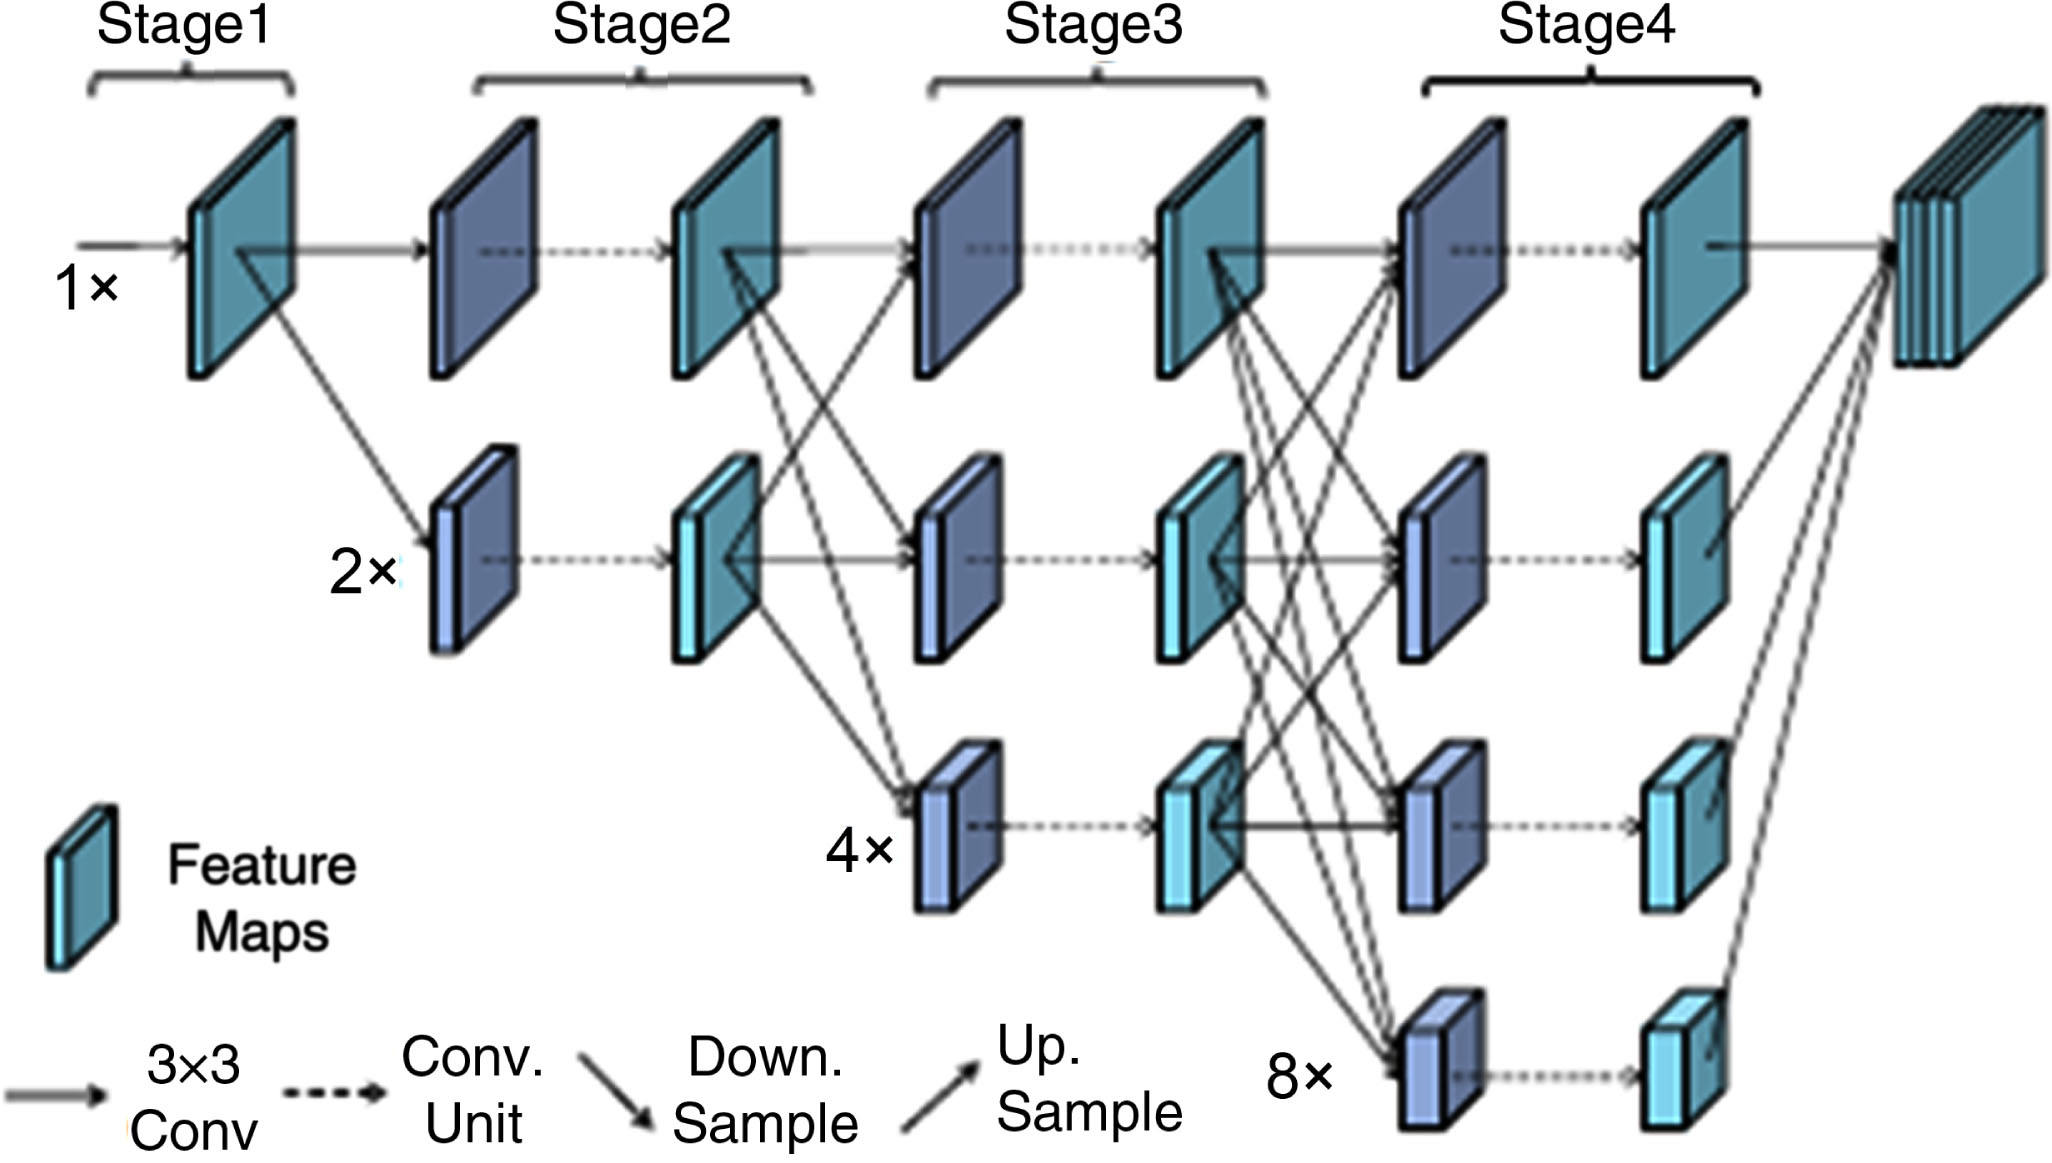
The structure of HR Block with four stages.
The input feature maps are Ix – Is, the output feature maps are Ox – Os, each output can be written as per Equation (1):
The inputs of Equation (1) must all have the same widths and resolutions. When the exchange unit between stages calls for a change in resolution, Equation (2)’s definition of an extra out map is required:
Where x, s, k represent the resolution, the functiona (Oi, k) takes Ox from resolution x to k by upsampling or downsampling, if x = k, a(,) is a regular connection.
Based on HR-Net, the HR Block of the proposed framework for high-level features extraction consists of four stages, as shown in Fig. 2. Each convolution unit consists of four same convolutional layers and each layer contains of a 3X3 convolutions kernel, a batch normalization (BN) and a rectified linear unit (ReLU) activation. Downsampling adopts a 3X3 convolution layer with a stride of 2 to reduce the scale of the original input. Upsampling applies the nearest neighbor interpolation algorithm to restore the resolution. After the application of these operations, the outputs of the below three branches are upsampled to change their resolutions the same as the first branch and then concatenated together to the input of the ASPP module.
The atrous spatial pyramid pooling module can extract features from various aspects by combing atrous convolution and pooling [20]. It can effectively capture multi-scale information and solve the semantic information loss caused by the pooling layer. When an atrous convolution filter W is applied to a two-dimensional feature map, X, the output is calculated according to Equation (3):
Where x represents each location pixel, r is the atrous rate, and k is the convolution filter size. Adjusting rate r can modify the size of the receptive field, the atrous rate is a variable parameter equivalent to adding r-1 zero filters between two consecutive filters, so the value of rate r determines the stride of the convolution filter. When the rate r is 1, it is a standard convolution filter.
The proposed framework adopts the same ASPP module as DeepLabv3+ [20]. As Fig. 3 (a) shows, the first part includes a 1X1 convolution branch and three 3X3 atrous convolution branches. The atrous rates are 6, 12, and 18, respectively. Each convolution layer has 256 filters and a BN layer. The second part applies global average pooling to extract image-level features and restores resolution by bilinear interpolation, as shown in the Fig. 3 (b). Finally, all the convolution branches of the ASPP module are concatenated together and fed into a 1X1 convolution layer with 256 filters. This operation is applied to reduce the parameters of high-dimensional features and improve the expression ability of the module. The output of the ASPP module is called high-level features.

Details of the ASPP module.
Dense Net [36] proposed an excellent dense connectivity pattern. Each layer in the same Dense Block combines all the preceding layers through a concatenating operation. The structure of Dense Net is mainly composed of Dense Blocks and Transition layers. In Dense Block, each layer receives feature maps of all previous layers, so each layer has direct access to the gradients from the loss function and to the original input features. This connection method greatly enriches the features inside the block. The dense connectivity can be written as follows:
Where [χ0, χ1, . . . . . . , χl-1] refers to the concatenation of the feature maps produced in layers 0,..., l-1, Hl represents the non-Linear transformation, which includes a BN layer, ReLU activation and Convolution layer. The Transition layer converts the output of each Dense BLock. A Transition layer is composed of a BN layer, a ReLU activation, a 1X1 Convolution layer and a 2X2 AvgPooling layer. These operations can compress the size of feature maps and reduce the dimension of channels.
In order to increase the richness of low-level features and save computational resources, a pair of serial Dense Blocks is employed to be the low-level feature extraction module, as shown in Fig. 4. It is at the input of the entire network. The input of the module is the original image, and the output is fed into the HR Block. Each Dense Block in this paper contains six 3X3 convolution layers for feature interaction. After the input image is processed by first Dense Block, the output is copied into two paths. The feature maps of a path is sent to transition layer, and another path is connected to the input of the decoder as low-level features. After the transition layer, a 2X2 average pooling layer reduces the height and width of the image by half. Thus, the low-level feature resolution of the output of the second block is reduced to a quarter compared to the original image.
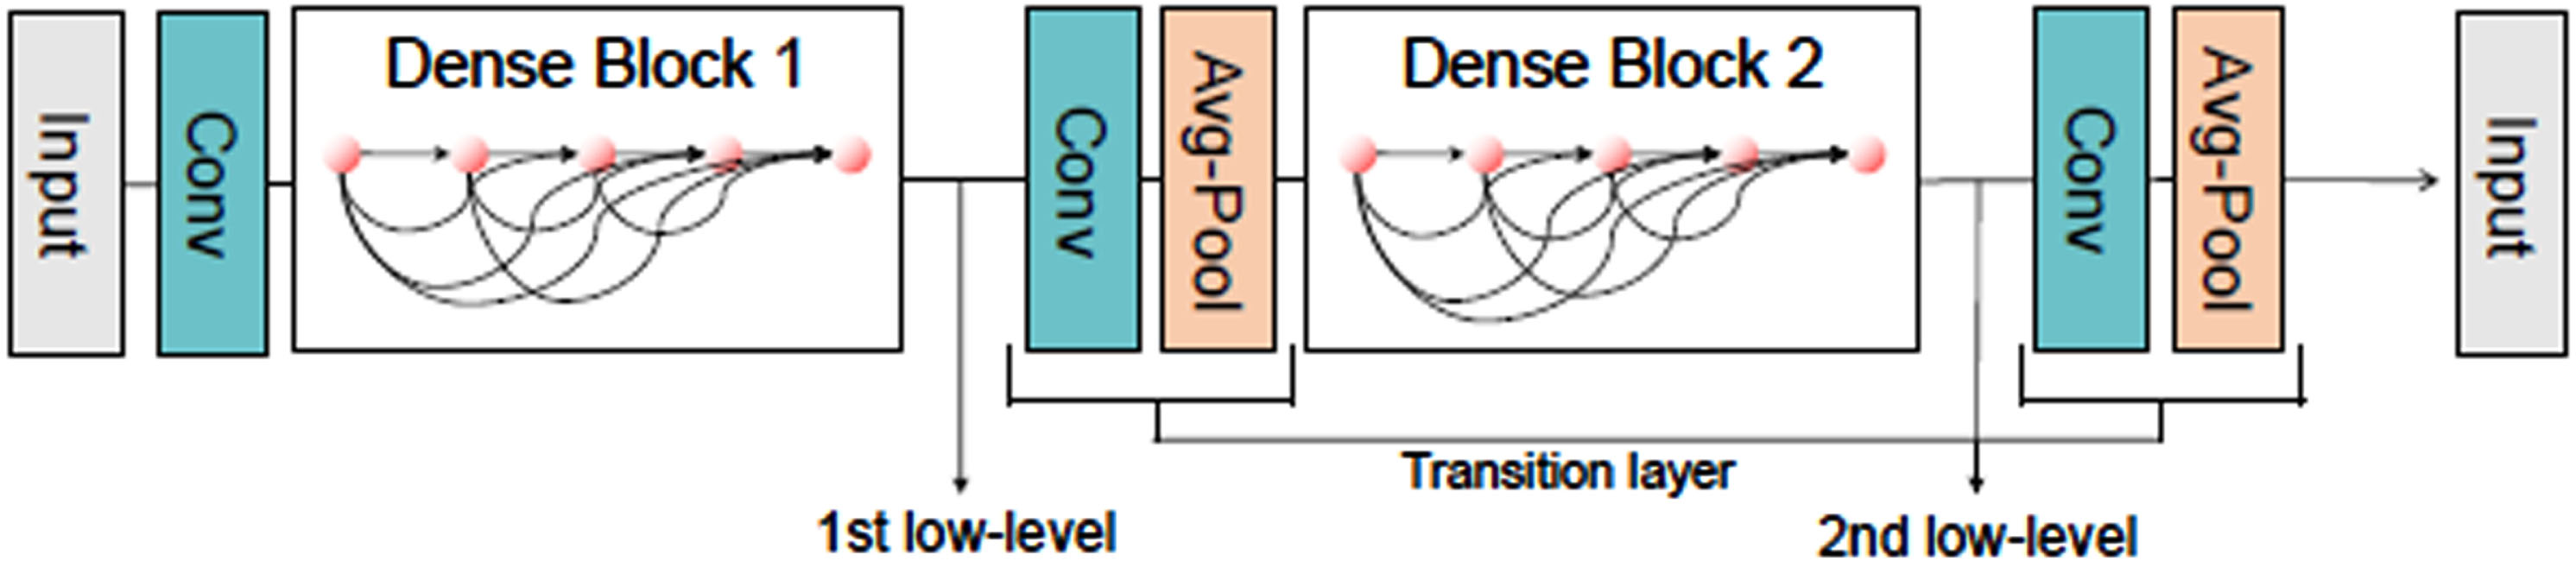
The illustration of Low-level feature extraction module. It contains a pair of dense connectivity blocks, the features output by the first block are named 1st low-level, and similarly the features of the second block are named 2nd low-level.
The decoder part is adopted to combine the semantic information from the encoder to gradually recover the resolution and predict the OD regions. In this paper, an efficient decoder is developed that fuses multi-scale features via skip connections to improve prediction performance. Compared with method [20] and method [39], this decoding process incorporates more low-level features and is able to preserve more semantic information and global location details. The following is the specific process of the decoder shown in Fig. 5.
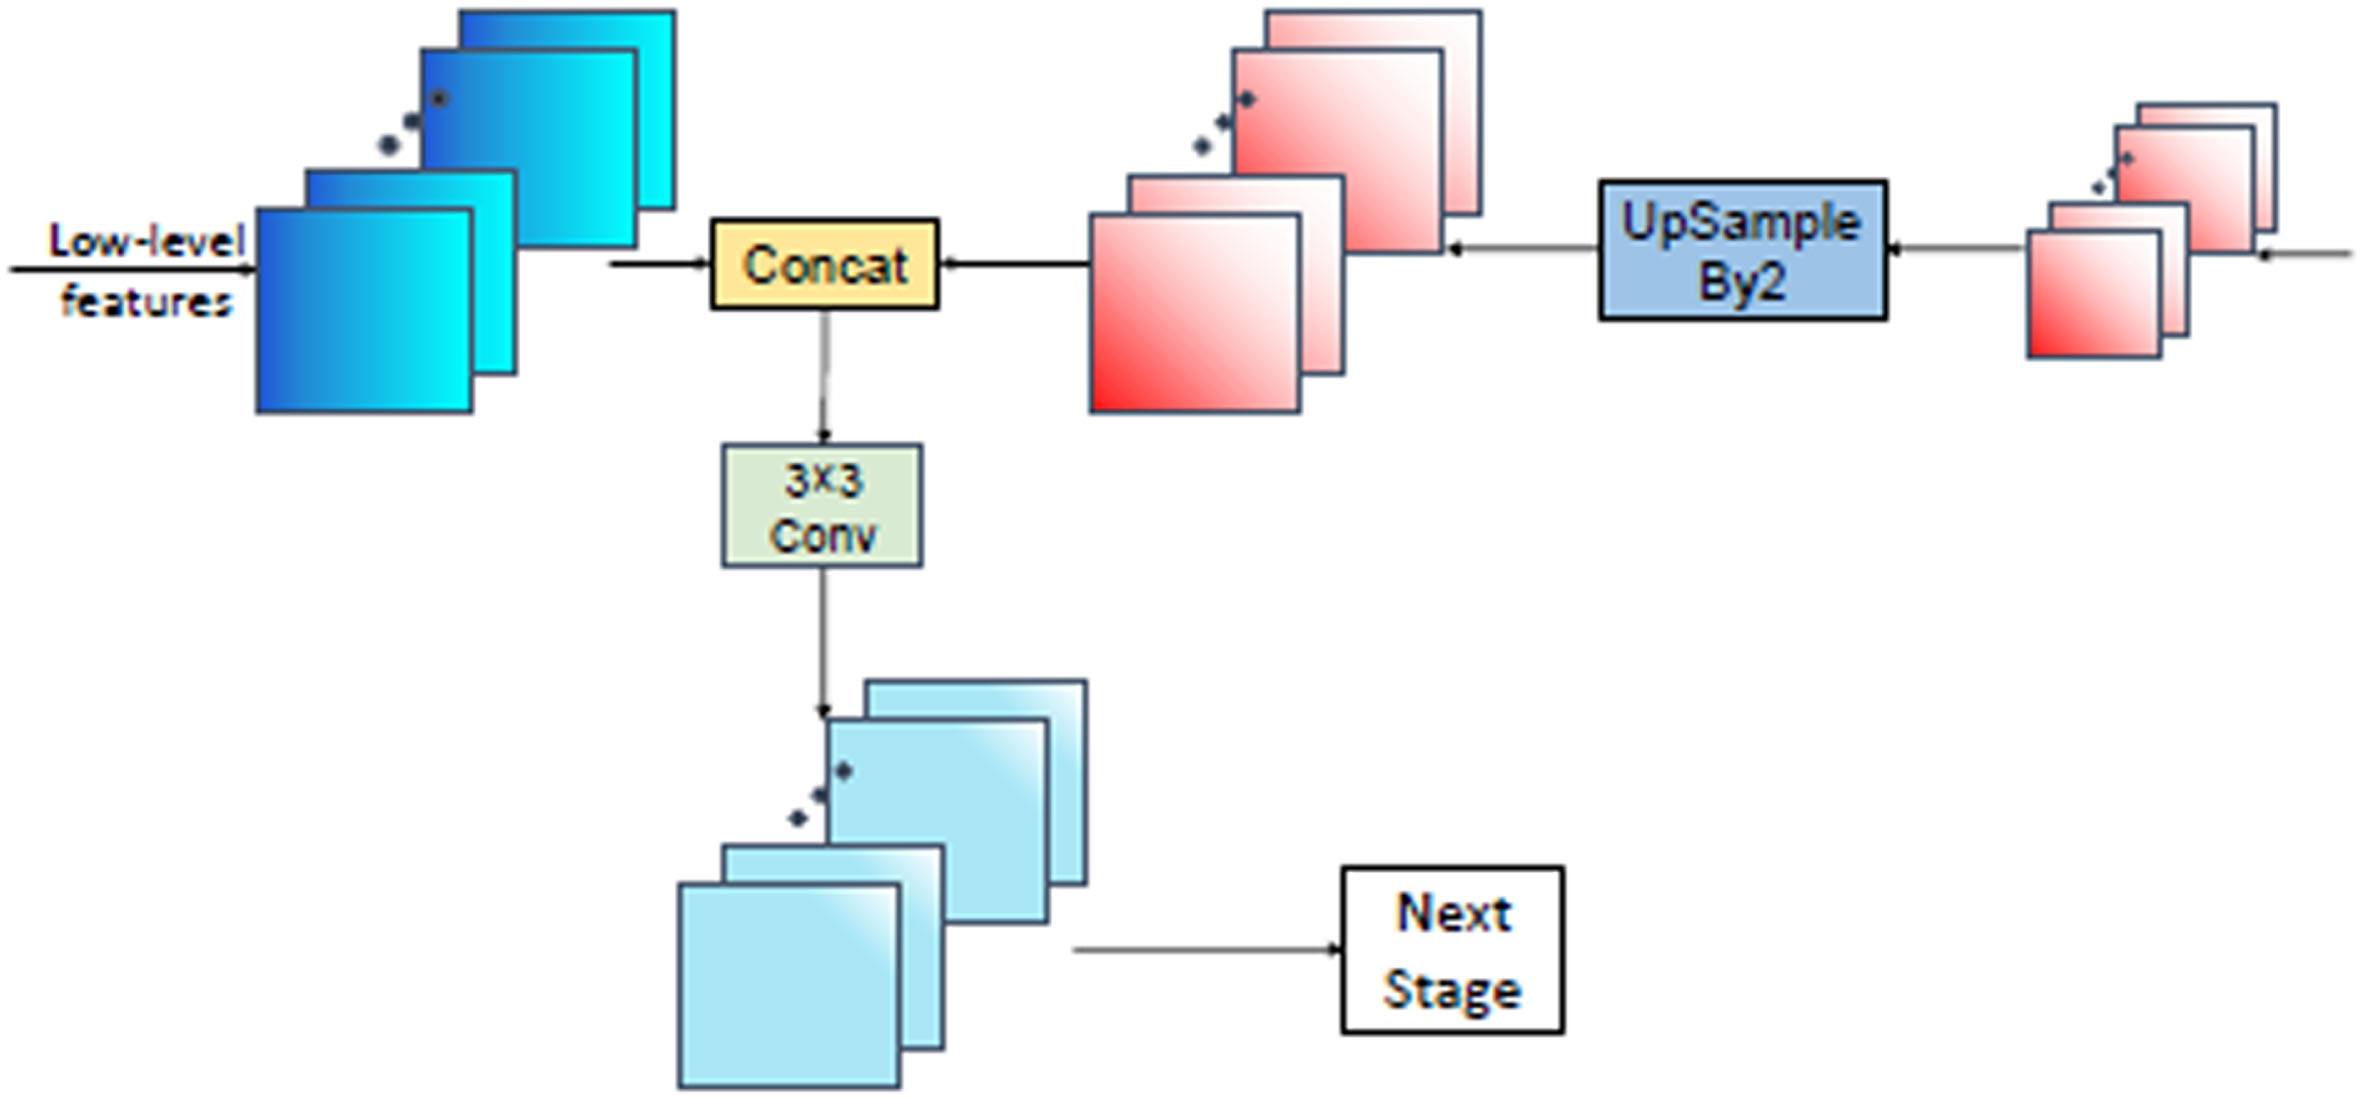
The decoding process of the proposed network.
For the input image, the encoder is used for multi-scale feature extraction. The low-level features from the first and second dense blocks are denoted as
Note that H and W are the height and width of the input image, d represents the dimension of feature channels. Between interpolation and deconvolution, bilinear interpolation is chosen as the upsampling method for the decoder. During decoding, the resolution of F3 is restored by upsampling to 2-fold to as follows:
Then, the feature mapsF2 and F3 are fused by concatenation and 3×3 convolution operations, which can be written as follows:
Repeating the content of formulas (5) and (6), the result is denoted by Fc2 ∈ RH×W×dc2. For the fusion result, a 3 × 3 convolution layer is utilized to reduce the dimension of the Fc2 channel. The final a 1 × 1 convolution predicts the OD regions, which can be written as follows:
Dataset preparation
In this research work, the three different public available Data set such as IDRiD data set, ROC data set and e-ophtha-MA data set is used for MA detection and Segmentation. In this study, the microaneurysm part of the IDRiD dataset [6] was used as the original dataset. The IDRiD images were acquired using a Kowa VX-10 alpha digital fundus camera (Nanded, Maharashtra, India) with a 50-degree field of view (FOV), and all are centred near the macula. The fundus images have a resolution of 4288×2848, and the images are in JPEG format. The dataset used here consists of 81 images for MA detection and contains a corresponding binary MA label map for each image.
The Retinopathy Online Challenge dataset (ROC dataset) contains 100 images split into 50 training images and 50 test images. Ground truths are only available for the training set. The test set ground truths are not public since the contest organizers used those to evaluate submissions [7].
The e-ophtha is collected by E.Decencière and made of two sub databases called e-ophtha-MA (Microaneurysms) and e-ophtha-EX (Exudates). E-ophtha-MA comprises 148 fundus images with microaneurysms or small hemorrhages, which are manually annotated by ophthalmology experts. In this paper, 74 fundus images are used as training set and the remaining 74 fundus images as test set. The sample image Data set is given in Fig. 6.
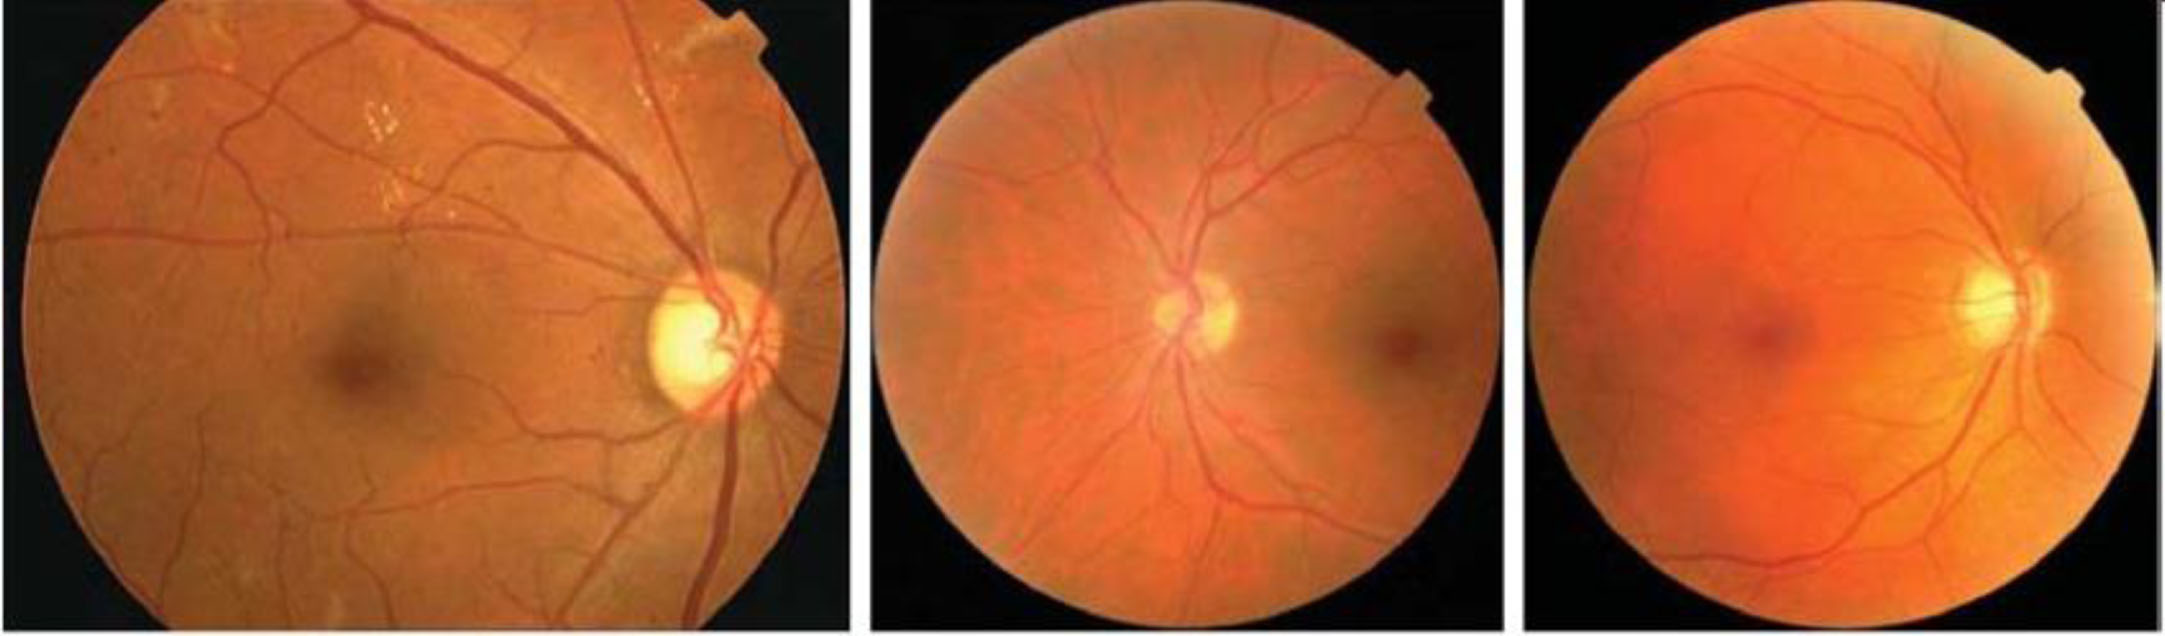
Sample retinal fundus images.
Various performance evaluation metrics have been used in the literature. However, evaluation metrics that aim to evaluate model performance on multi-class imbalanced datasets were a lack in the literature. Two effective evaluation metrics that evaluate the performance of the state-of-the-art pre-trained networks using imbalanced datasets were used. In this paper, to achieve high learning effect, 70% and 30% of the dataset are used for training and test, respectively. Besides, precision, recall, accuracy, and F1-score are used to evaluate the performance: The IoU and the DSC are commonly used to indicate the overall performance of medical image segmentation. In addition, sensitivity (Se), specificity (Sp), precision (Pr) and accuracy (Acc) were also calculated as evaluation indicators. All of the above metrics range from 0 to 1.0, the larger the metrics value, the better the segmentation results [43]. The specific description of the metrics is as per Equation (8):
The PyTorch framework and Python 4.0 were used for all of the studies (PyTorch, 2022). The TorchVision library in PyTorch was used to train the cutting-edge pre-trained models. Graphical processing unit (GPU) NVIDIA RTX3070 was used to speed up the research. A batch size of 16 was taken into consideration for all datasets in each experiment. The nature of both datasets is skewed. All of the photos included in the train datasets were therefore subjected to a variety of data augmentation methods. A regularization method known as data augmentation helps deep learning models perform better overall. The process of data augmentation has been automated in some cases.
Results and discussion
Performance of proposed MF-DCNN
For the fair comparison and evaluation, the images applied in the training set are different from the test set. Experiments are conducted on three public datasets. Ablation studies are performed with IDRiD dataset and ROC dataset datasets to analyze the components of the proposed MF-DCNN. The segmentation performance is mainly evaluated by calculating the scores of the evaluation metrics. When designing the network architecture, the number of network parameters also needs to be considered. Lightweight is conducive to the convergence of neural network and reduce the consumption of computing resources. The parameter quantity of the different DCNN and the proposed method is given in Table 1.
The differences of the U-Net, CE-Net, DeepLabv3+ and the proposed MF-DCNN, M is short for Million
The differences of the U-Net, CE-Net, DeepLabv3+ and the proposed MF-DCNN, M is short for Million
The segmentation performance of the proposed MF-DCNN and other networks on the IDRiD dataset is shown in Table 2. In Table 2, the segmentation of MF-DCNN is better than the SegNet [40], DeeplabV3+ [42] and UNet [25]. Compared with the existing available methods on the MESSIDOR dataset, segmentation metrics results demonstrate that the proposed model achieves the best performance on all evaluation metrics. The segmentation results of MA in IDRiD data set is given in Fig. 7. We compare proposed method with other popular models, including ResNet [27], DenseNet [28],Ce-Net [29],U-Net [19], DeepLabv3+ [20] and SeNet [38],. The layers number is not totally consistent because of the network architecture design.
Performance comparison of the proposed MF-DCNN and other DCNN methods on IDRiD dataset
Performance comparison of the proposed MF-DCNN and other DCNN methods on IDRiD dataset

MA segmentation results for four examples (E1, E2 from the IDRiD dataset and I1, I2 from the IDRiD dataset). The first row shows the color fundus images, the second row shows the ground truth, and the third row shows the segmentation results of proposed method.
Table 3 lists the segmentation outcomes for the various techniques using the E-Ophtha dataset. The suggested model receives ratings of 96.23, 97.67, 98.34, and 98.78 on the IoU, Dice, accuracy, and sensitivity evaluation measures. The model with the greatest scores is MF-DCNN.. On the E-Ophtha dataset, the segmentation results of MF-DCNN generally beat those of other methods by a significant margin, particularly the IoU and the DSC scores. The MA detection results of proposed method in E-Ophtha dataset is given in Fig. 8.
Performance comparison of the proposed MF-DCNN and the state-of-the-art methods on ROC dataset
Performance comparison of the proposed MF-DCNN and the state-of-the-art methods on ROC dataset

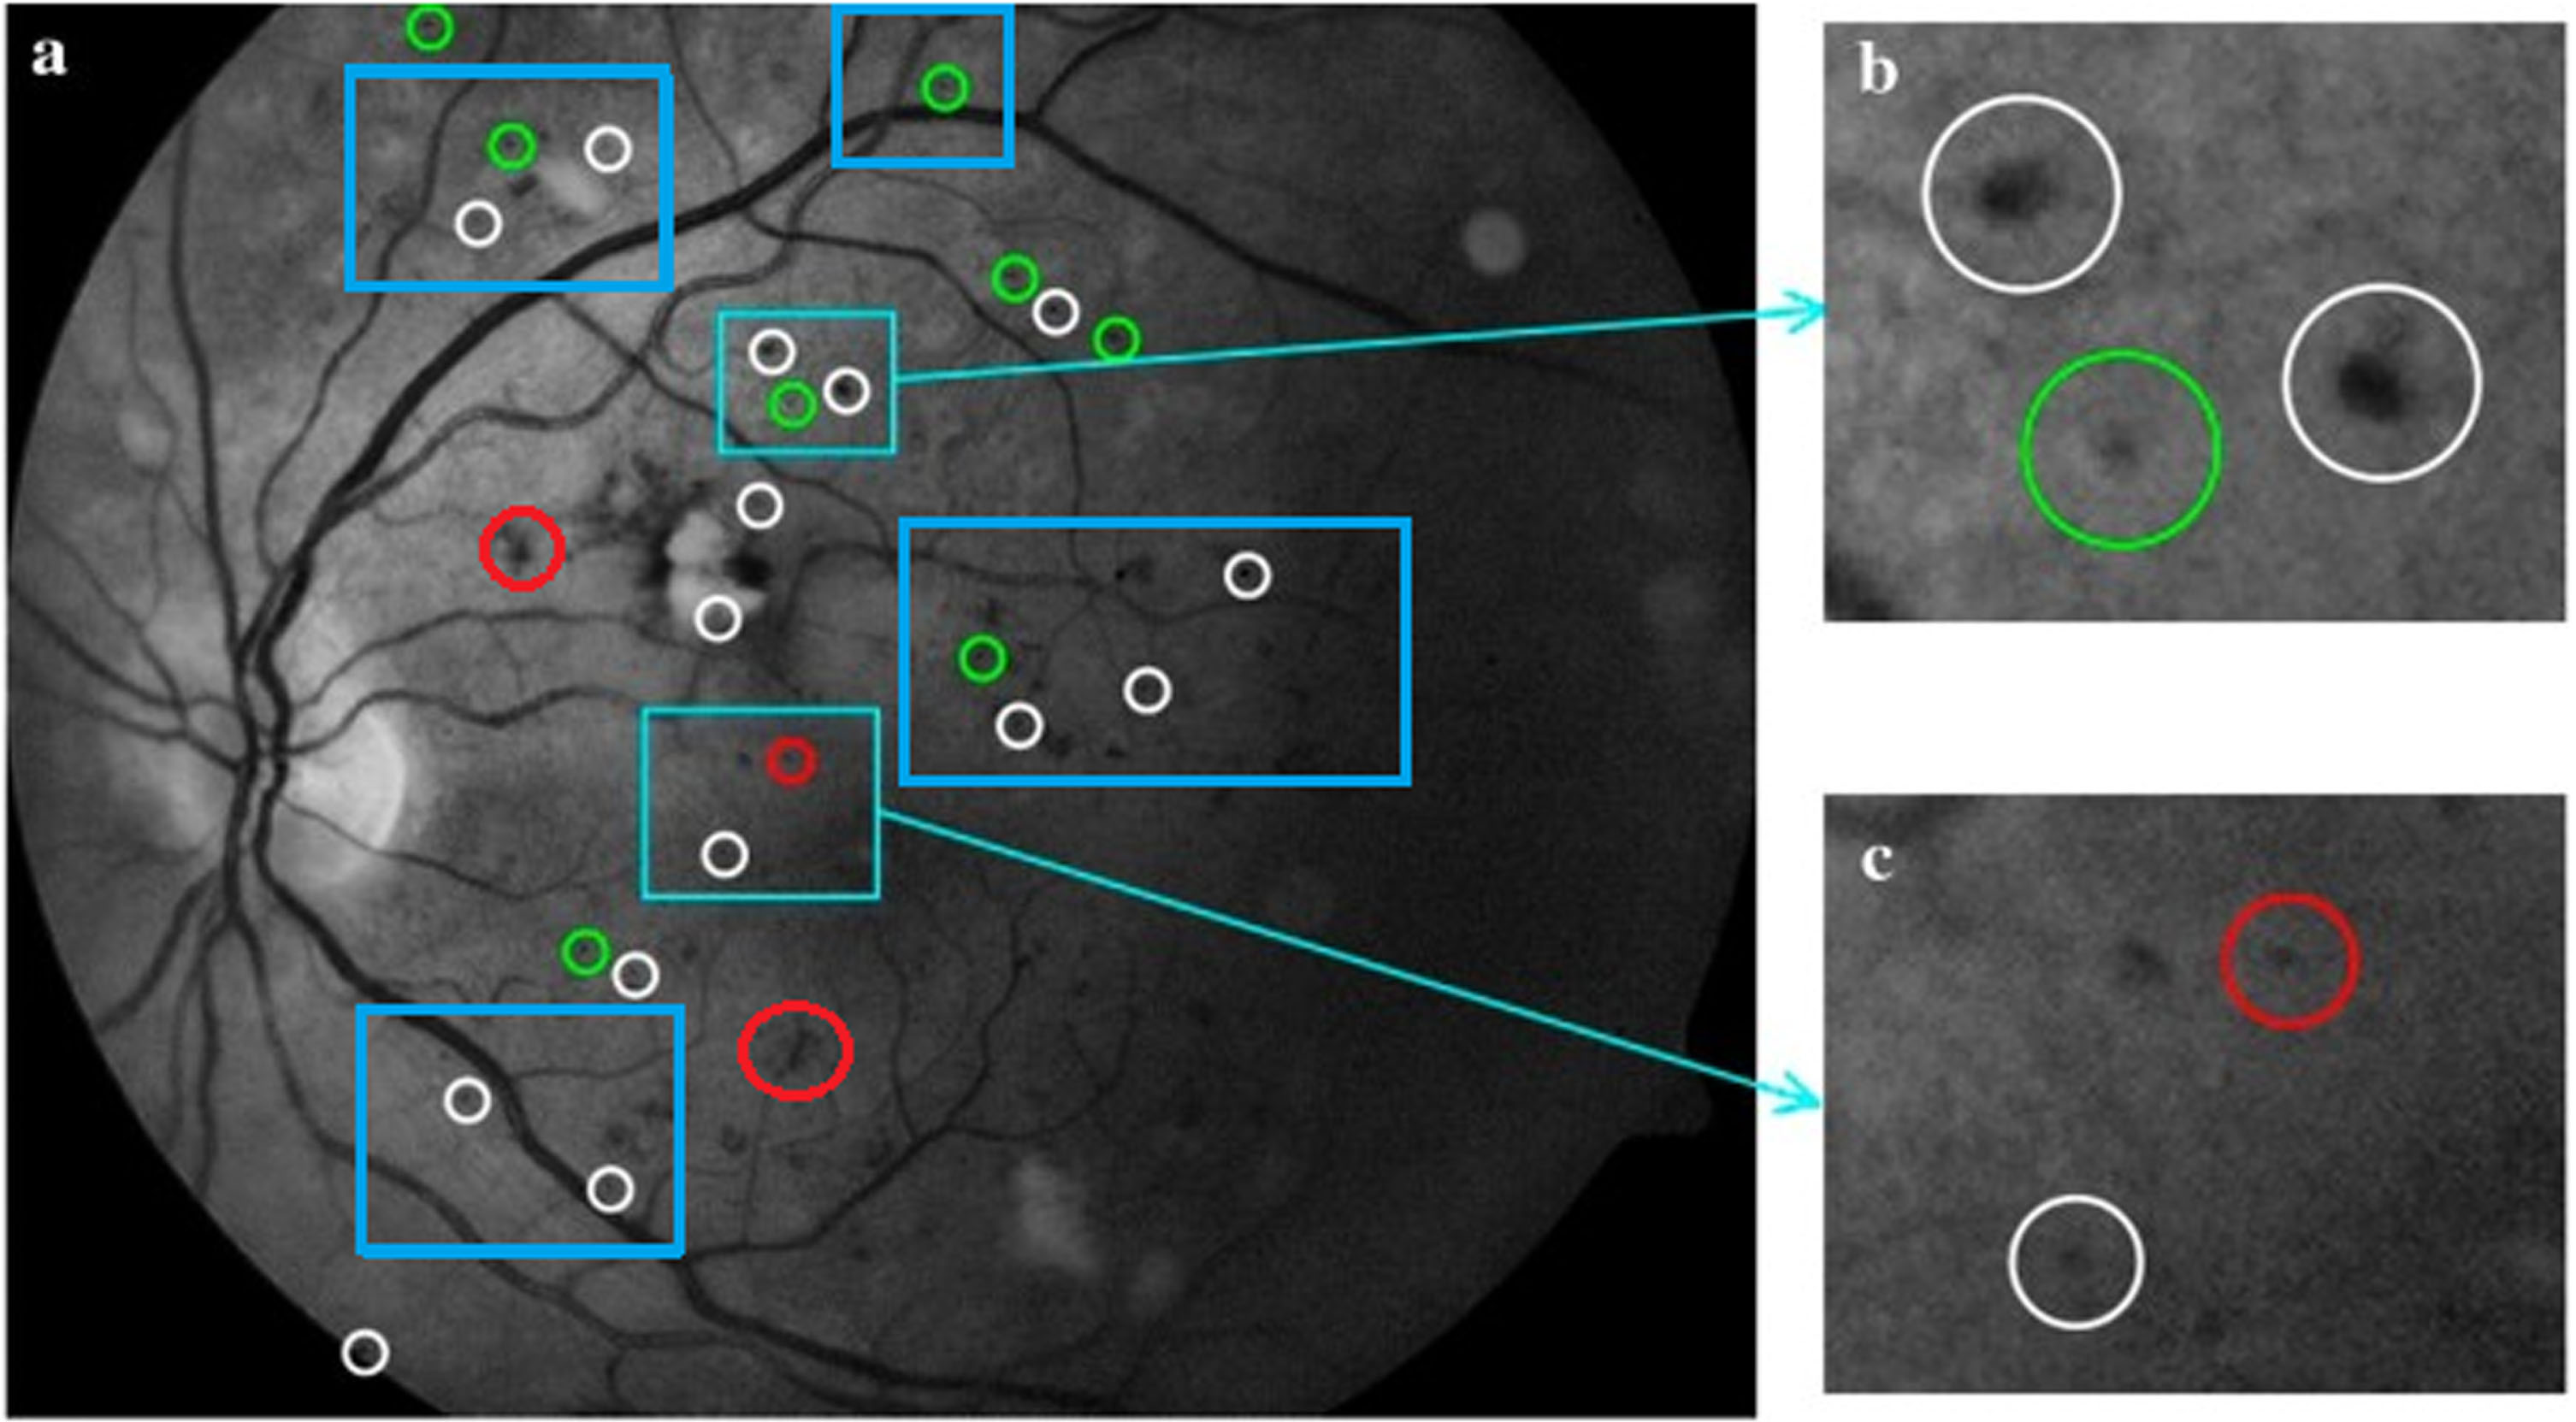
Examples of lesion detection results for E-Ophtha dataset. The IoU threshold is set to 0.5. True positives are green circled, false positives are yellow circled and false negatives are red circled.
The aspect ratio of each image was maintained as it was scaled to 256×256. By flipping and mirroring the photos, the training set’s original 400 images were increased to 500. Table 4 provides a summary of the performance comparisons. Five professionals manually marked the ground truth and compared the prediction findings. The final evaluation metrics were the IoU and DSC scores. The segmentation results presented above demonstrate the competitive performance of MF-DCNN in comparison to other cutting-edge techniques. The results of MA detection using the ROC data set are shown in Fig. 9.
Performance comparison of the proposed MF-DCNN and the state-of-the-art methods on the ROC dataset using the metrics of IoU, and DSC, respectively
Performance comparison of the proposed MF-DCNN and the state-of-the-art methods on the
Two examples of segmented microaneurysms in a fundus image using the proposed method. Green is for true positives, red is for false positives, and cyan is for false negatives (a) Example 1, (b) Example 2.
We will incorporate the attention modules discussed in the preceding part into the MF-DCNN network in this section. Table 5 presents the experimental outcomes. The experimental findings reveal that not all of these attention modules are beneficial for enhancing the segmentation accuracy of retinal vascular images, despite the fact that they have obtained state-of-the-art outcomes in many computer vision tasks. The accuracy of segmentation suffers after utilizing the DA module. EA had the most notable improvements in F1, ACC, and without the attention module when compared to SA, SE, and AUC.
Compares the performance of different attention modules
Compares the performance of different attention modules
The MA detection results from the E-Ophtha database are shown in Fig. 10a according to different levels of confidence. The analysis in Fig. 9b is provided at a 75% confidence level. Some FPs fall into the group of labels with a confidence level lower than 75%, as seen in Fig. 10, using a standard of ground truth confidence of 75%. For instance, the two FPs in Fig. 10b have a 50% confidence level. (shown in Fig. 10a).
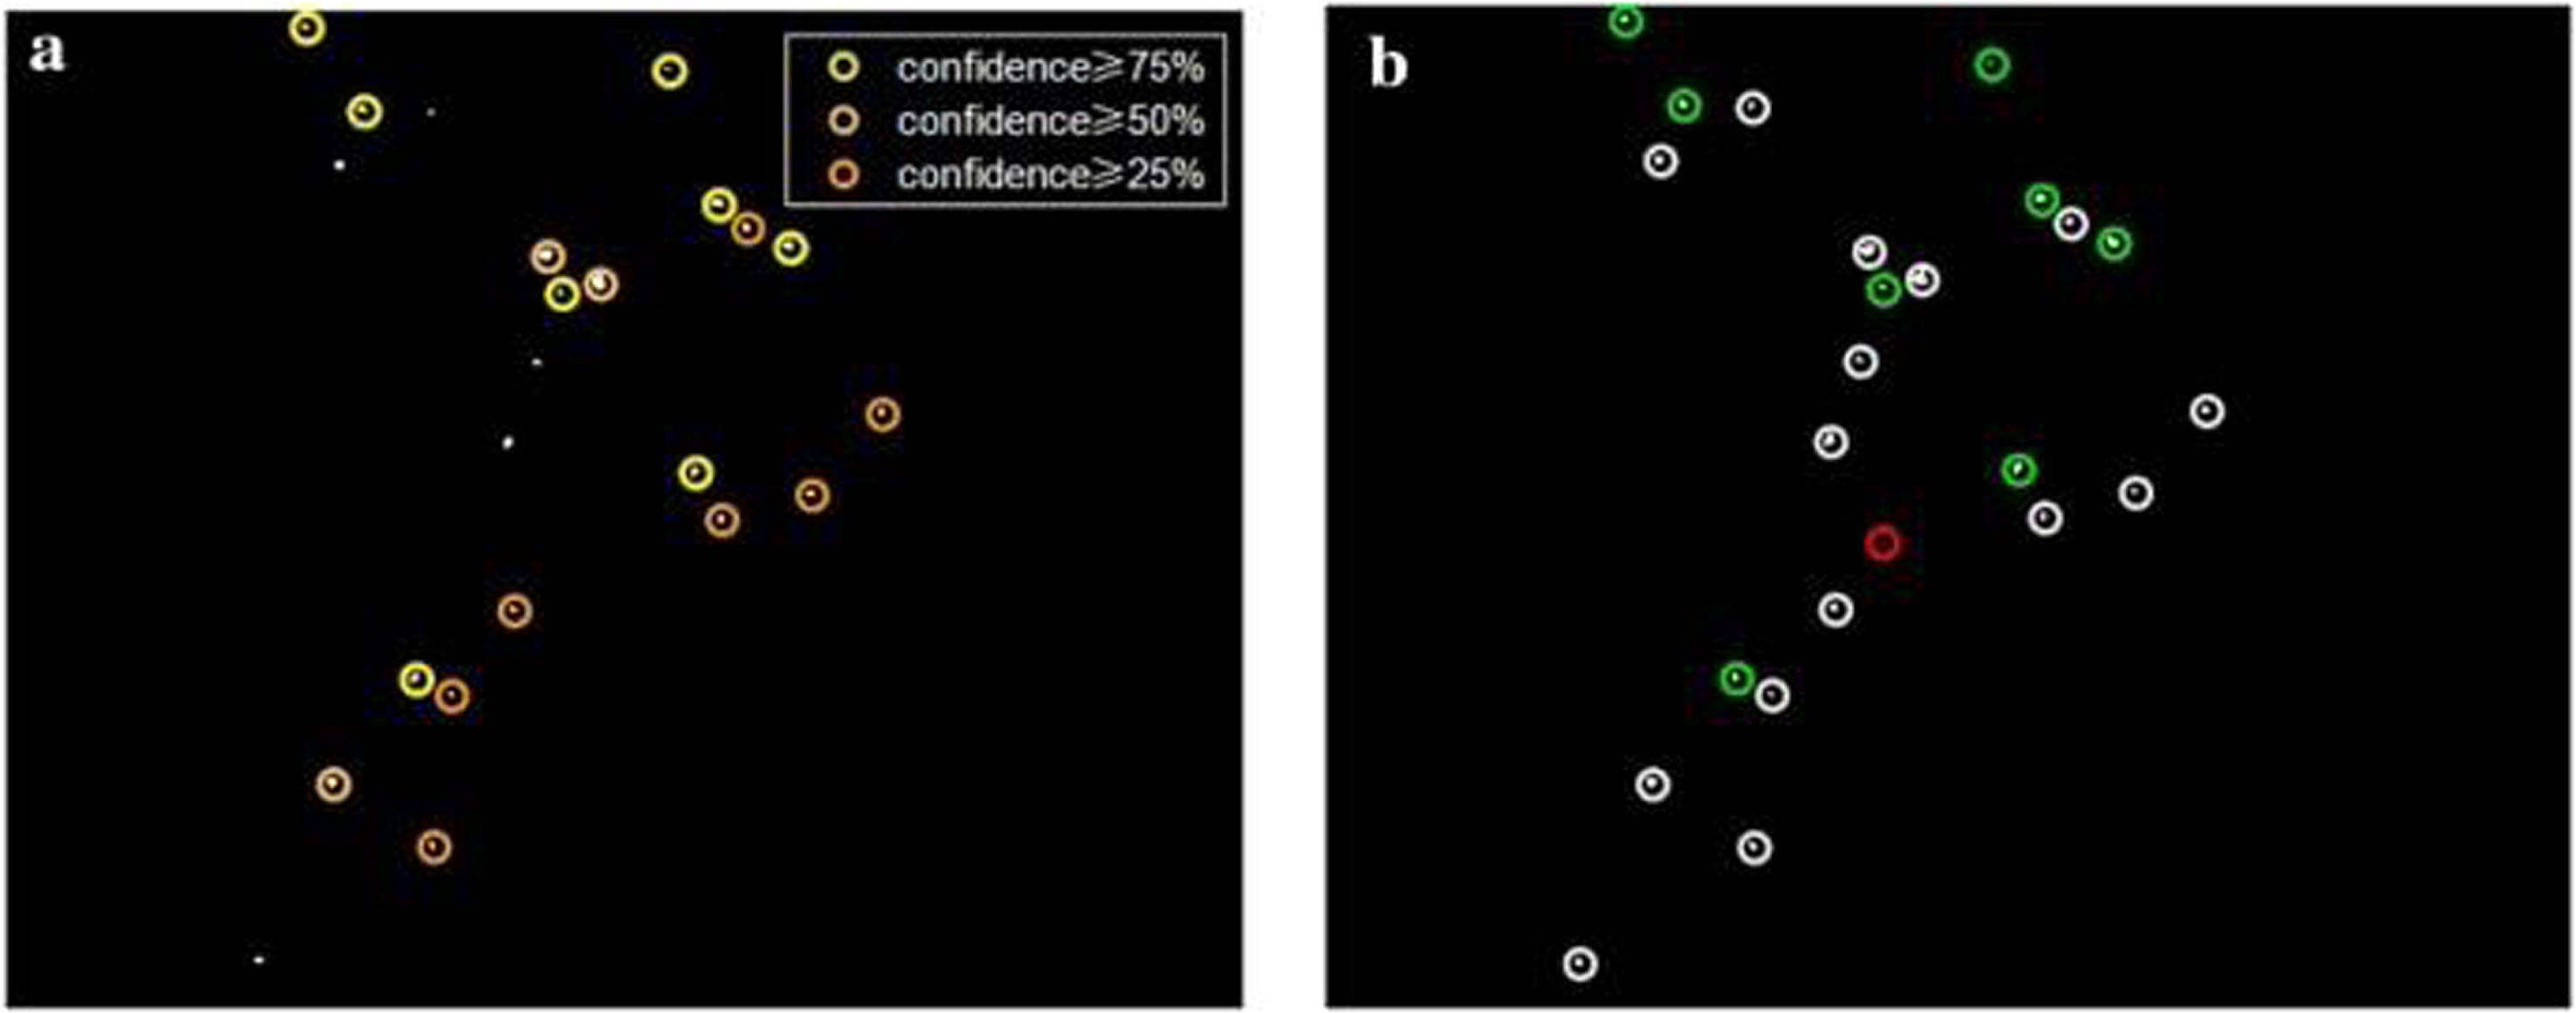
Analysis of MA detection findings compared to the E-Ophtha database’s ground truth.
Similarly, to show the effectiveness of HR block and Dense block, the ablation study is also performed on the proposed MF-DCNN to verify the performance improvement function. The ablation experimental of the proposed model on the
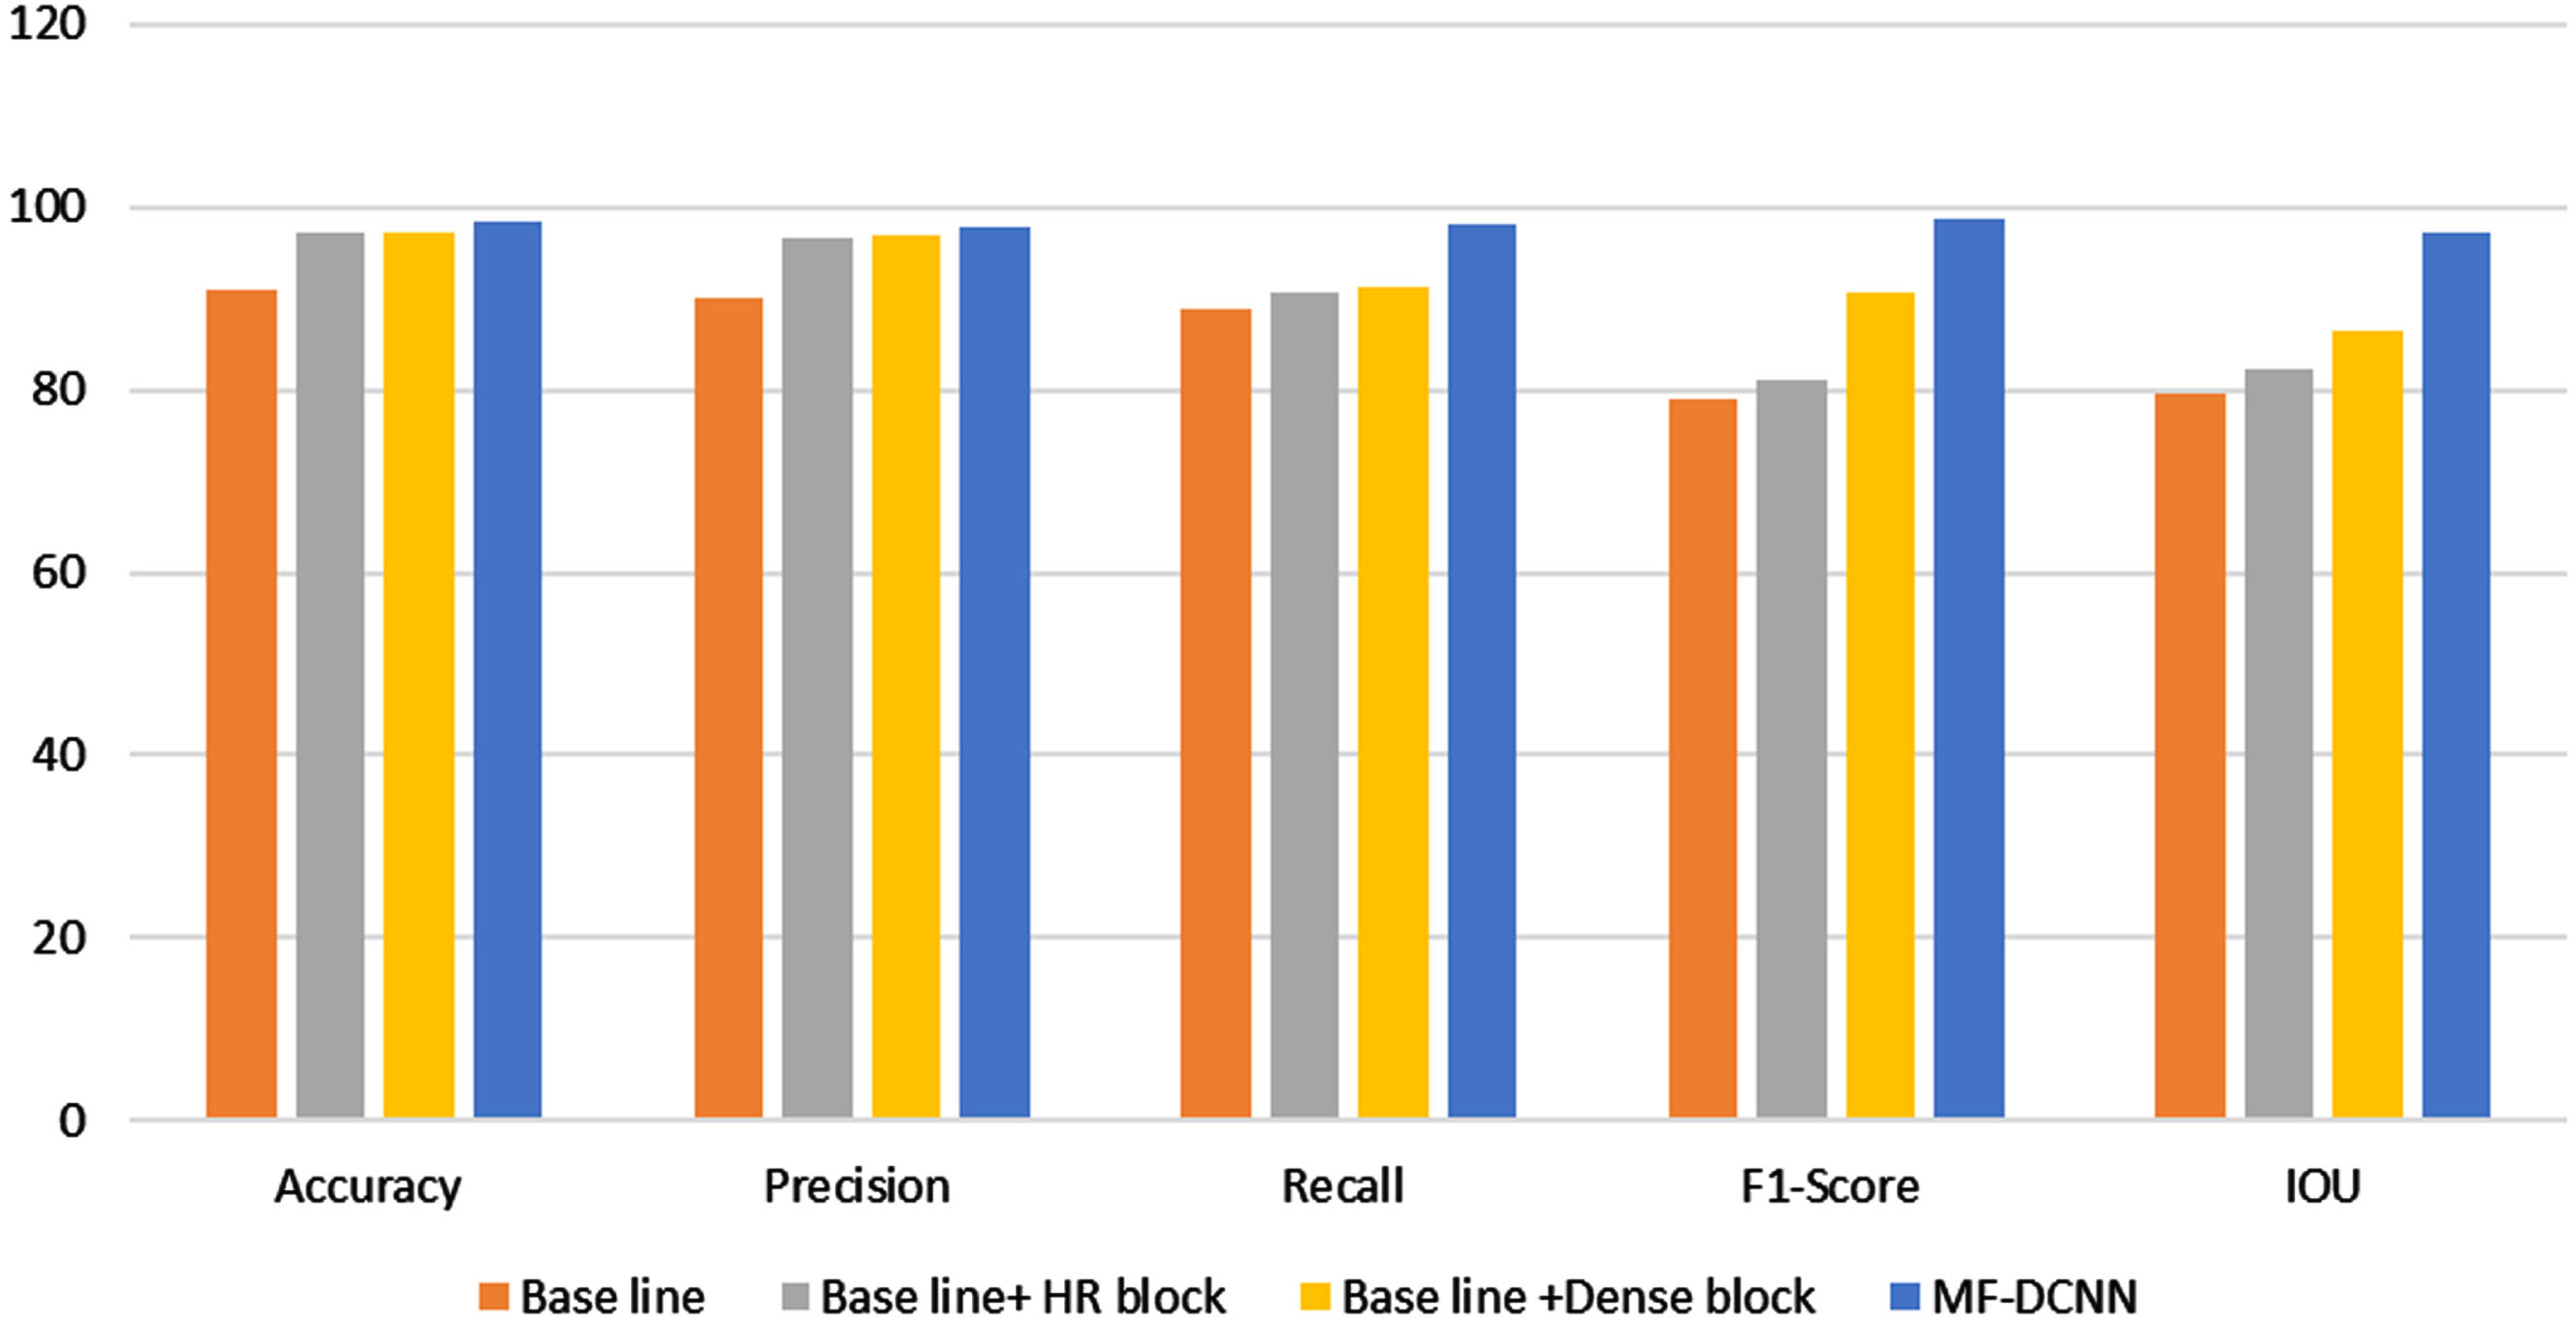
Ablation Experiment results of the proposed method.
This section presents a comprehensive comparison of the proposed MF-DCNN method with the existing state-of-the-art methods using the
Compares the performance of the proposed method with different state-of-the-art methods
Compares the performance of the proposed method with different state-of-the-art methods
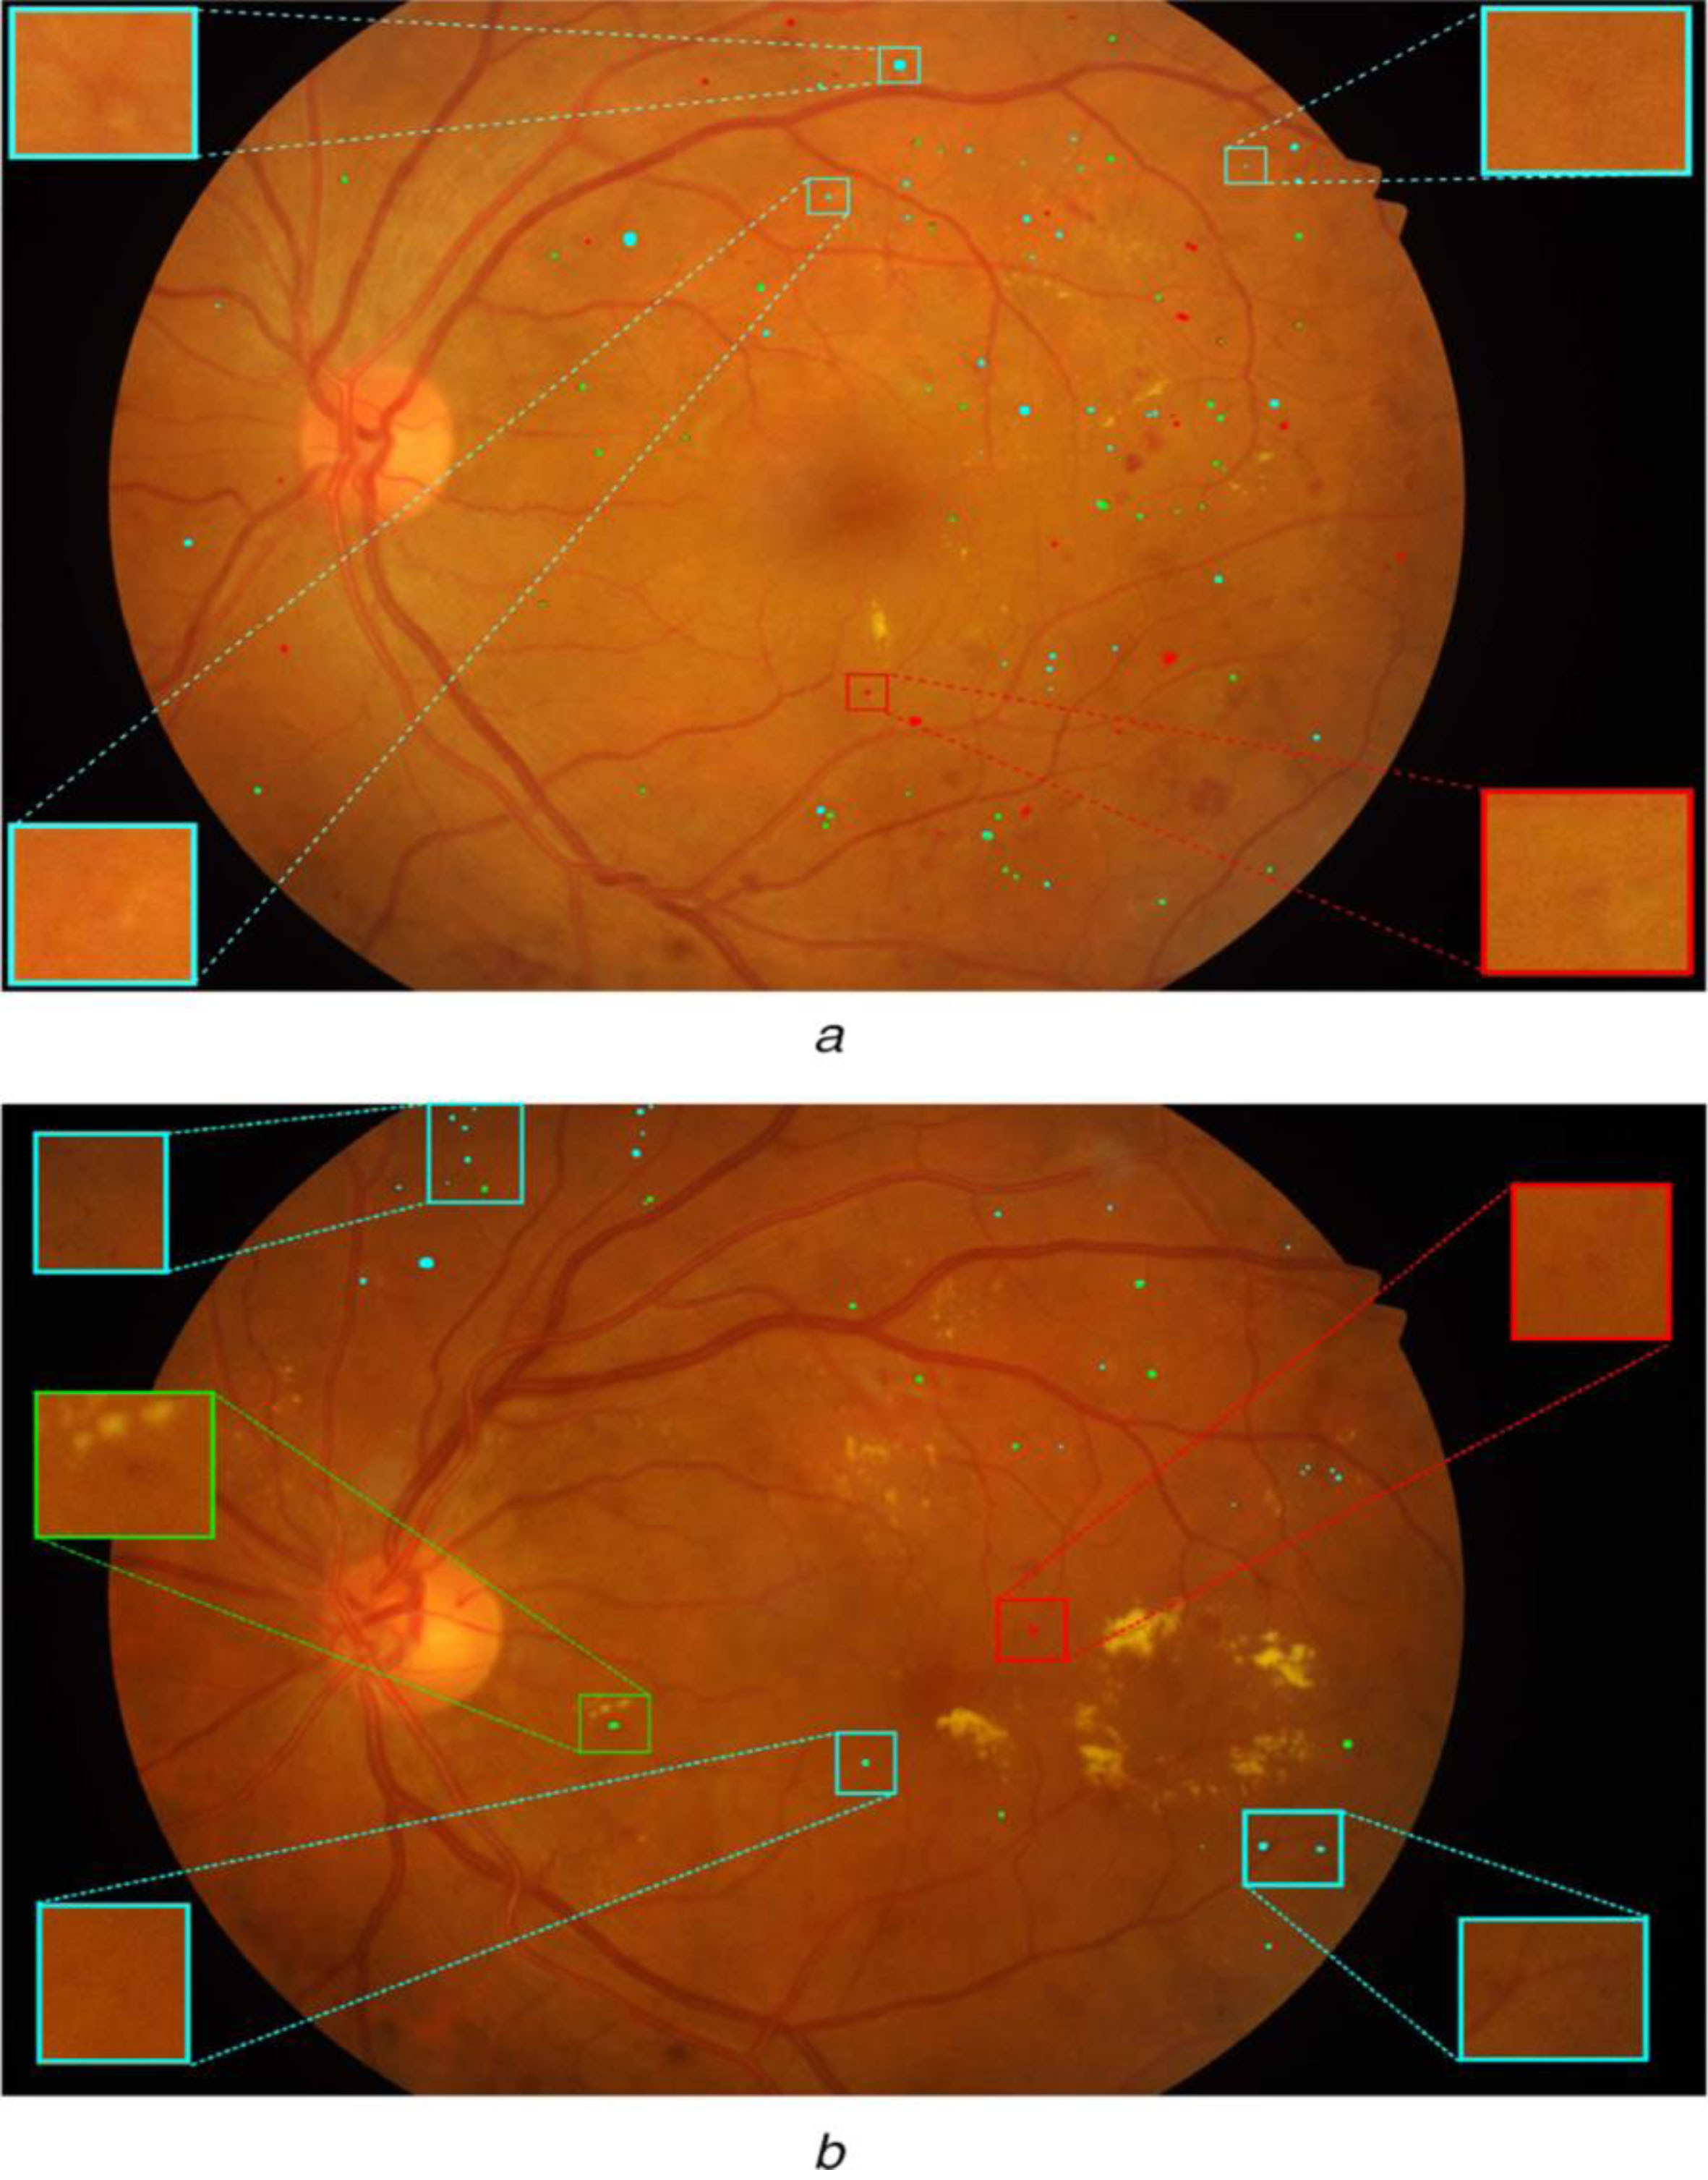
Lesion-level examination of findings from the E-Ophtha MA database’s MA detection. Results of MA identification are displayed in column (a), with red circles denoting FNs, white circles denoting FPs, green circles denoting TPs, and columns (b) and (c) showing instances of TP and FN, respectively.
Diabetic retinopathy disease contains lesions (e.g. exudates, hemorrhages, and microaneurysms) that are minute to the naked eye. Determining the lesions at the pixel level poses a challenge as each pixel does not reflect any semantic entities. Furthermore, the computational cost of inspecting each pixel is expensive because the number of pixels is high even at low resolution. In this research work, we proposed an MF-DCNN for pixel-wise segmentation of MA in retinal images. Faced with limited context representation ability, a dense attention block is proposed to acquire strong contexts. Aimed at the insufficient feature processing, a triple-attention (TA) block is presented to better extract the relationship between pixels and get more detailed information. Meanwhile, a multi-scale context fusion (MCF) is proposed for context enhancement to acquire the multi-scale contexts. In particular, we extensively evaluate the proposed method on two challenging datasets... The MF-DCNN model used MA segmentation as a showcase application due to its importance in analyzing various eye-related diseases such as Diabetic retinopathy and Glaucoma. The ablation experiment results of the proposed MF-DCNN on the E-Ophtha MA dataset have better demonstrated the effectiveness of proposed each network block, and it also proves the rationality and validity of the network configuration of the proposed MF-DCNN. In summary, combined with the above quantitative and qualitative analysis in three different Datasets such as IDRiD, ROC, and E-Ophtha, the proposed MF-DCNN network can not only accurately detect MA regions with different shapes and sizes, but also extract accurate boundaries of regions. Meanwhile, the proposed MF-DCNN also obtains a promising segmentation performance compared to other deep learning methods.
Footnotes
Ethical compliance
Not applicable.
Acknowledgments
This work was not supported from funding Agencies.
Conflict of interests
The authors declare that they have no conflict of interest.
Data availability statement
In this article, the different normal and abnormal images are collected from publicly available Dataset.
Data sharing not applicable to this article as no datasets were generated or analyzed during the current study.