
Abstract
Accurate SARS-CoV-2 screening is made possible by automated Computer-Aided Diagnosis (CAD) which reduces the stress on healthcare systems. Since Severe Acute Respiratory Syndrome Coronavirus 2 (SARS-CoV-2) is highly contagious, the transition chain can be broken through an early diagnosis by clinical knowledge and Artificial Intelligence (AI). Manual findings are time and labor-intensive. Even if Reverse Transcription-Polymerase Chain Reaction (RT-PCR) delivers quick findings, Chest X-ray (CXR) imaging is still a more trustworthy tool for disease classification and assessment. Several studies have been conducted using Deep Learning (DL) algorithms for COVID-19 detection. One of the biggest challenges in modernizing healthcare is extracting useful data from high-dimensional, heterogeneous, and complex biological data. Intending to introduce an automated COVID-19 diagnosis model, this paper develops a proficient optimization model that enhances the classification performance with better accuracy. The input images are initially pre-processed with an image filtering approach for noise removal and data augmentation to extend the dataset. Secondly, the images are segmented via U-Net and are given to classification using the Fused U-Net Convolutional Neural Network (FUCNN) model. Here, the performance of U-Net is enhanced through the modified Moth Flame Optimization (MFO) algorithm named Chaotic System-based MFO (CSMFO) by optimizing the weights of U-Net. The significance of the implemented model is confirmed over a comparative evaluation with the state-of-the-art models. Specifically, the proposed CSMFO-FUCNN attained 98.45% of accuracy, 98.63% of sensitivity, 98.98% of specificity, and 98.98% of precision.
Keywords
Introduction
The zoonotic diseases induced by the transmission of pathogens from animals to people are infectious, and the coronavirus is generally a zoonotic virus as well as a Ribonucleic Acid (RNA) virus of the family Coronaviridae [1]. It is a group of viruses that are contagious through respiration. Because of the crown-shaped spikes on its outer layer, the virus is known as a coronavirus [2]. A type of illness called COVID-19 causes respiratory problems in people. In Wuhan, China, in December 2019, an unidentified species transmitted the novel coronavirus (COVID-19), which had its origins in bats. [3]. This virus may affect people who have high temperatures, cough, sore throats, fatigue, muscle pains, throat pain, breathing difficulties, etc. On January 30, 2020, the World Health Organization (WHO) designated COVID-19 as a Public Health Emergency of International Concern, and on March 11, 2020, it was identified as a global pandemic [4, 5]. The four genera of SARS-CoV-2 strains are alpha, beta, gamma, and delta. While gamma and delta were descended from birds and peccary gene provision, alpha, and beta were descended from bats. Civet cats and camels serve as carriers for SARS as well as the Middle East Respiratory Syndrome (MERS) [6]. The most common symptom associated with the COVID-19 illness is pneumonia which appears to be the most frequent sign of contamination along with other major indications like fever, cold, body ache, coughing, sore throat, and epistaxis. RT-PCR and gene sequencing of respiratory or blood samples are the primary screening techniques for COVID-19. The use of RT-PCR on throat swab samples, which has a reported positive rate of 30 to 60 percent, may infect a significant number of healthy people even if the infected individuals themselves have not been diagnosed [7, 8]. Chest CT is one method that may be used to diagnose Covid-19. Visual indices that are associated with COVID-19 can be seen on X-ray images. According to the investigations, CXR revealed multilobar involvement as well as opacities in the peripheral airways. Radiography and radiology photographs may sometimes be used to diagnose sickness more rapidly [9].
Since COVID-19 is a pandemic and highly contagious, early diagnosis is necessary. For this reason, the efficacy of AI is employed in disease detection. Later, the researchers focused on CAD, which became the major research area in the medical field as well as clinical prognostics [10]. CNN has recently achieved improvements in object recognition, semantic segmentation, as well as picture classification in image processing. Furthermore, CNN in recent studies provides an optimum solution for COVID-19 classification [11]. Effective object recognition from medical images could save clinicians a lot of time, give accurate quantitative evaluations, and hasten the diagnosis process [12]. Detection of sparsely distributed things from large-scale data, however, remains a challenging task. From a DL standpoint, grouping applications by input data type will make it easier for readers to comprehend typical research frameworks [13, 14]. Although these DL algorithms appeared to be accurate, fresh data from several hospitals revealed that they were ineffective. Because of how these DL systems gather data, according to previous research, it’s nearly impossible to learn false shortcuts [15, 16]. Due to the coronavirus’s explosive global expansion, researchers have faced several difficulties in creating and putting into use CAD methods to detect and forecast sickness. The availability of datasets, changes to the architectural design of DL networks, and hardware improvements are the biggest barriers to coronavirus diagnosis. A large portion of the dataset is used for binary class or multiclass [17]. It is accepted that the categorization for COVID-19 diagnosis is incredibly unbalanced. The performance of a trained model may be biased as a result of the skewness of the dataset. Due to the challenge of obtaining sufficient high-quality photos, especially in the early phases of the pandemic [18]. To solve the issues, the competence of DL-assisted CAD algorithms attracted the focus of researchers. Table 1 summarizes the recent research surveys in COVID-19 detection and classification using AI algorithms. However, the studies exposed the challenges, future, and opportunities of AI algorithms support in COVID-19 classification. Though AI supports COVID-19 diagnosis and yields more precise findings than RT-PCR, CAD-assisted AI in COVID-19 handling is still in its infancy and needs to be improved in terms of data secrecy, accuracy, computational complexity, and so on.
Recent Research and Advancements in COVID-19 Detection and Classification using Various AI Algorithms
Recent Research and Advancements in COVID-19 Detection and Classification using Various AI Algorithms
However, DL algorithms exposed impressive methods for extracting high-dimensional features from medical images [19]. First of all, this prevents the need to continuously describe how text or images are fed into a CNN. Second, programs that use the same kind of input data share a lot of characteristics [20]. For image synthesis tasks, CNN’s U-Net encoder and decoder are made to perform better. The pooling layers are replaced by the stride and fractional strides of convolution in the decoder, which enables the model to obtain its up-sampling and down-sampling during training [21]. Additionally, batch normalization is applied to the encoder and decoder during the training phase in order to address issues with poor initialization. As a result, the aforementioned enhancements to U-Net reduce the current instability of training a standard CNN [22]. With these efficiencies in Unet and CNN, this paper aims to introduce a novel U-Net and CNN fusion algorithm to enhance disease classification accuracy. The main contribution of this context is given as follows. In order to develop an automated and precise COVID-19 diagnosis, a novel fusion algorithm is introduced using CNN and Unet. The input images from multiple datasets are first gathered and subjected to an image filtering approach namely the Weiner filter to remove any noises, and then data augmentation is used to solve the over-fitting and imbalanced data. Now, image segmentation is applied to the augmented images using U-Net. The U-Net technique is utilized for extracting and segmenting the important features. In addition, the U-Net architecture is fused with CNN to classify the images, and the weights of U-Net and CNN have been tuned to improve accuracy performance via the CSMFO algorithm. To confirm the competence of the suggested method, a comparative evaluation is conducted using the classed results by means of accuracy, sensitivity, specificity, and precision.
The rest of this article is ordered as follows. Section II represents a brief description of the recent COVID-19 disease classification algorithms and their features. The proposed architecture of the novel COVID-19 disease classification is explained in Section III. Section IV deals with the DL and optimization concepts. Further, Section V gives the obtained results and their experimentation details. Finally, Section VI concludes the paper.
Related works
In 2021, Sharmila, and Florinabel [25] developed a COVID-19 classification model using Deep Convolutional Generative Adversarial Network (GAN)-CNN (DCGAN-CNN). Here, the CXR images were classified through 8 convolutional layers, 4 max-pooling layers, as well as 2 Fully Connected (FC) layers. In this research, synthetic images were produced to the extent the data used and extracted the deep features. From the investigation results, it revealed competitive performance over AlexNet and GoogLeNet). In 2021, Dan Nguyen et al. [26] trained 9 CNN-based models for COVID-19 disease classification via 3-D Computed Tomography (CT) images. The data for classification was gathered from various countries containing COVID-19+ and negative people. Herein, 72%, 8%, and 20% of data have been used for training, validating, as well as testing the data. The efficacy was recorded via accuracy and Area Under Curve (AUC). For accuracy, 97% to 98% performance was attained. Similarly, for AUC, 82% to 87% performance was achieved. In 2022, A. Chaddad et al. [27] established a CNN with Gaussian Mixture Model (GMM) named (GMM-CNN) strategy to encode the features of COVID-19 disease classification. CT and CXR images were employed for experimentation. Besides, the Random Forest (RF) model was employed for classification. The performance was accessed via accuracy and Receiver Operator Characteristics (ROC). In comparison with traditional CNN, GMM-CNN attained improved performance. In 2020, S. Sakib et al. [28] established a COVID-19 disease diagnosis model through DL-based Chest Radiograph Classification (DL-CRC). The dataset contained CXR of normal, pneumonia, and COVID-19+ patients’ data. Besides, Data Augmentation of Radiograph Images (DARI) and GAN strategies were employed to create synthetic data for training as well as testing the proposed DL-CRC technique. The empirical study exposed the efficiency of the DL-CRC model by outrunning the conventional CNN-based models. In 2021, A. Castiglione et al. [29] introduced a COVID-19 classification scheme through an optimized CNN named ADECO-CNN model. However, CT images were employed for classification and compared with various CNN-based models to validate the performance of ADECO-CNN. From the experimentation, the implemented ADECO-CNN model accomplished 99% of accuracy. In 2022, Pir Masoom Shah et al. [30] developed a COVID-19 disease detection model via CNN with Gated Recurrent Unit (GRU) methods. Here, CXR images were used with normal, pneumonia, and COVID-19+ people’s data. CNN was employed for feature extraction and GRU was utilized to classify the data. The experimental study exposed the performance by 96% of precision and 95% of F1-score. In 2021, A. Abbas et al. [31] developed a Self-Supervised Super Sample Decomposition for Transfer Learning (4S-DT) framework for COVID-19 disease detection via CXR images. Through the use of a downstream learning method and a Class-Decomposition (CD) layer for streamlining the data’s local structure, 4S-DT aided in enhancing the resilience of knowledge transformation. Through experimentation, the 4S-DT model proved its efficiency by obtaining 99% of accuracy. In 2021, El-Sayed M. El-Kenawy et al. [32] developed a COVID-19 disease classification framework using an Advanced Squirrel Search Optimization Algorithm (ASSOA) with a Multi-layer Perceptron (MLP) named ASSOA+MLP model. Initially, the data augmentation and feature learning processes were carried out by CNN. ASSOA was employed for selecting the significant features and optimizing the weights of MLP. MLP was used to classify the CXR images. The investigation validated the ASSOA+MLP model through a comparative study and achieved 99% accuracy.
Review
From the literature, it is clear that plenty of research has been done on COVID-19 disease classification using various DL algorithms.
In contrast to CT and MRI, the most popular radiological diagnostic imaging is CXR since it is less expensive, takes less time to process, and exposes patients to less radiation. It is critical to rapidly isolate suspected individuals during pandemics like the recent one so that they can receive the appropriate care. Controlling epidemics also requires quick diagnosis of these patients. Additionally, confirmatory laboratory tests may be used in conjunction with AI-based illness classification. Similarly, implementing AI-based quick and time-saving solutions to help with prognosis and evaluation of recovering/follow-up patients may be a great idea. Researchers have recently undertaken attempts to create COVID-19 classification or identification systems based on CXR/CT images, each with a particular set of capabilities. However, in order to create more dependable and accurate classification models, the studies have certain fundamental flaws that must be addressed. To name a few shortcomings, only a small number of studies have used CXR/CT pictures (in various classes) from vastly varied lung diseases. The process facilitates categorization (for DL algorithms), but at the same time, it is biased since normal vs. infected (with high severity) groups’ lungs differ in pixels. On the other hand, only a few research have used augmentation approaches with a small number of augmentation types to raise the sizes of the datasets and to generalize the models. The AI-based models trained on fewer pictures run the risk of overfitting in the classification models since there are only a limited number of CXR/CT images available for COVID-19. Lack of these sorts of selection criteria may result in models being trained incorrectly and performing poorly in practical applications. Based on the prior literature, there were variations in overall performance, and the classification tasks for COVID-19 differed in terms of factors linked to the accuracy of findings. Previous research has only addressed ways to speed up classification processes, increase accuracy, or even just improve performance. Additionally, there are changes between earlier literature’s categorization approaches, stages, and processes. The implemented DL algorithms exposed competitive performance over the standard DL concepts. However, computational complexities, overfitting, high computational time, imbalanced data, too many processing steps, noisy data, limited data in datasets, difficulties in acquiring proper datasets, and poor understanding of the DL algorithms restrict the COVID-19 disease classification framework to be implemented in a real-world scenario. Intending to overwhelm the previous complexities, the researchers develop novel DL concepts yet, complexities in computation exist. Even though DL algorithms aid disease detection and classification, coping with real-time scenarios is difficult. However, the performance of the proposed CSMFO-FUCNN model on different datasets disproves any claim that they were overfitting. Some of the features and challenges of the existing methods are briefly described in
A Novel COVID-19 Disease Classification Framework
Proposed Architecture
Figure 1 depicts the block diagram of the implemented design for the COVID-19 disease classification model. Initially, the input images from the dataset have been collected and have undergone an image filtering technique called the Weiner filter to remove any noises. Generally, the Wiener filter can be described as an MSE-optimal stationary linear filter for images with additional noise and blur. It is necessary to assume that the signal and noise processes are 2nd-order stationery in order to calculate the Wiener filter (in the random process sense). Then, data augmentation is employed like random scaling, random resize, and random rotation to enlarge the dataset so as to cope with the imbalanced data. Now, the augmented images are subjected to segmentation using standard U-Net.

Block Diagram of Implemented Design for COVID-19 Disease Classification Model.
Usually, U-Net is a semantic segmentation method that was first presented for segmenting medical images. This DL segmentation model dates back to the beginning and efficiently works with CNN, key features are extracted and segmented using the U-Net approach. The segmented photos are given to FUCNN for categorization. Additionally, the CSMFO method has been used to fine-tune the weights of the FUCNN to increase accuracy performance. Using the findings from the classification, a comparison study is done to assess the efficacy of the implemented algorithm through measures like accuracy, sensitivity, specificity, and precision.
Generally, an ideal low pass and nonlinear filter is the Wiener filter [33]. Now, the input image I is given to the Weiner filter. The Weiner filter is crucial for a number of applications, including image processing, medical imaging, echo cancellation, signal restoration, and linear prediction to reduce the average squared distance among the desired pixel and the filter output. It is frequently used because of its efficiency and simplicity. Also, image restoration as well as lowering the Mean Square Error (MSE) number are the primary goals of the Weiner filter. This follows the classical method of least squares in order to decrease the MSE. It is regarded as simple since it computes a set of ideal filter weights that lower the incoming signal’s noise level using a system of linear equations. To determine these weights and give a precise estimate of the undistorted deterministic signal under Gaussian noise, it calculates cross-correlation and covariance matrices of noisy signals. A set of ideal filter weights is chosen by first estimating the noise statistics. A signal deterministic component is then calculated by processing a fresh input signal with the best filter weights and noise characteristics. In situations when the noise distribution is Gaussian, this approach performs well. Additionally, its execution only needs a small number of computing steps, which are processed relatively quickly. Specifically, Wiener filters possess the ability to concurrently decrease blur and eliminate noise in an image. The initial phase of the projected approach involves running a noisy, blurry image through a Wiener filter and constructing a filter. The Wiener filter W in the Fourier domain is implemented as shown in Equation (1).
Dividing Equation (1) by P
i
alters its behavior as shown in Equation (2).
Herein, H indicates the degradation function, D* specifies the degradation function’s complex conjugate, and G signifies the power spectral density of noise, where
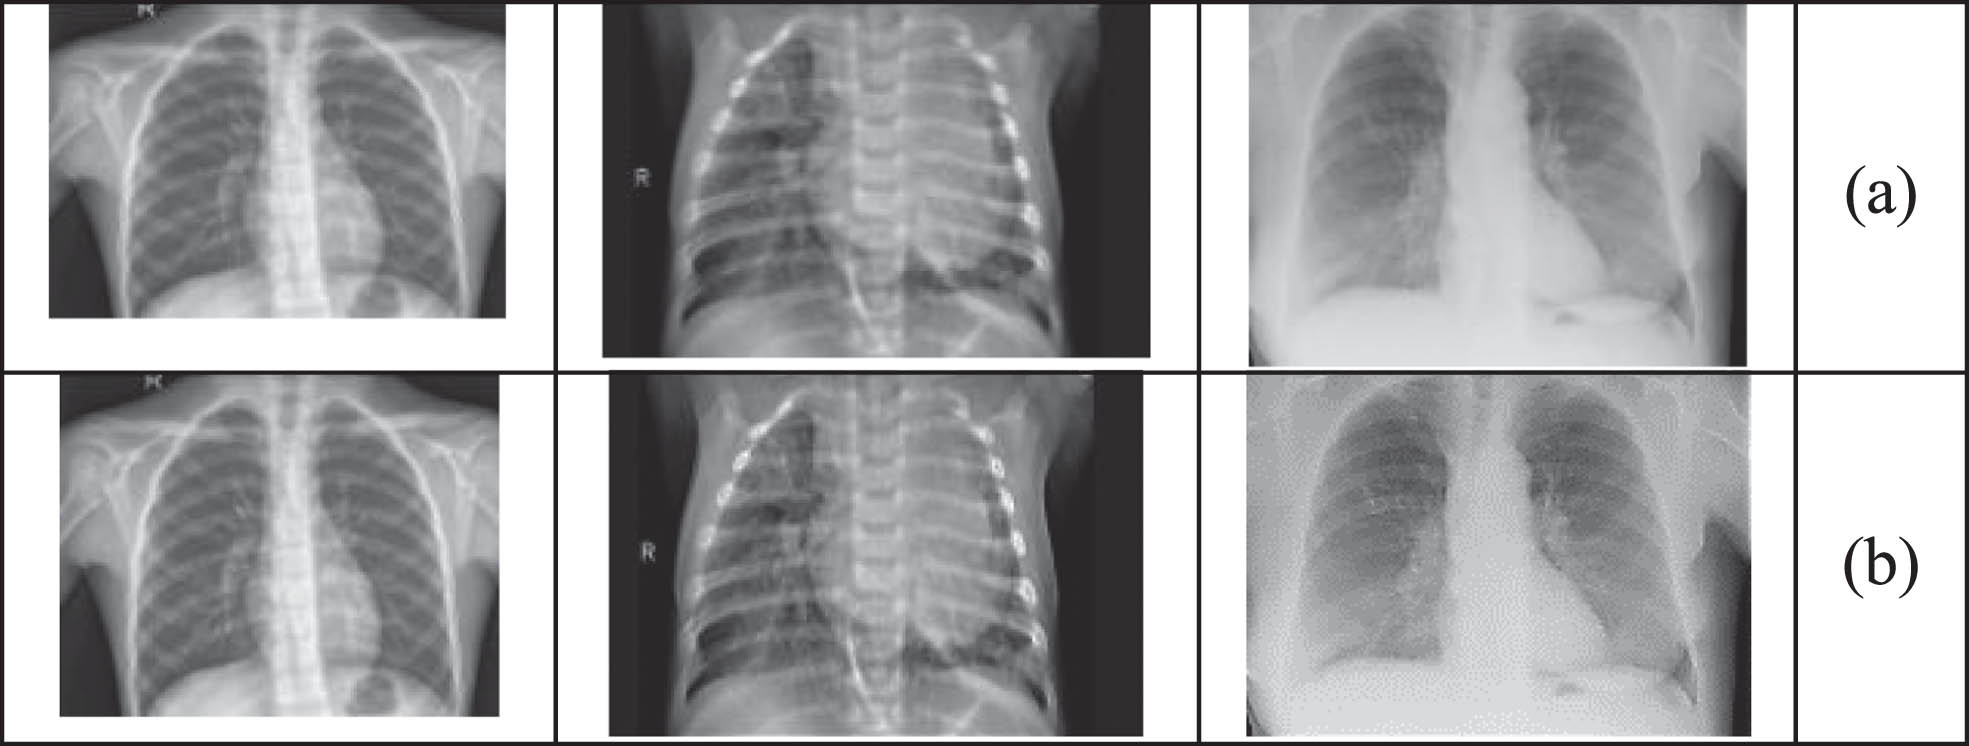
Sample Images displaying (a) Original Chest X-ray Images of Normal People, Pneumonia, and COVID-19+, and (b) Improved Images of Chest X-ray Images of Normal People, Pneumonia, and COVID-19+ using Weiner Filter.
Here, the filtered image I W is given as input. The normal images are augmented to improve training performance by techniques like cropping, rotation, and scaling. Specifically, when the dataset is insufficient and to enlarge the size of the training and testing data. Here, one full-size image is flipped vertically, rotated left and right, and cropped using the image-editing techniques, and increasing the training dataset’s size is not what was originally intended. Figure 3 shows sample images that have been augmented to enlarge the dataset. Now, the training and testing data size has been enlarged so as to attain improved classification accuracy. The output images such as the original image I0, vertically flipper image I v , left rotated image I l , right-rotated image I r , and cropped image I c are subjected to U-net segmentation.
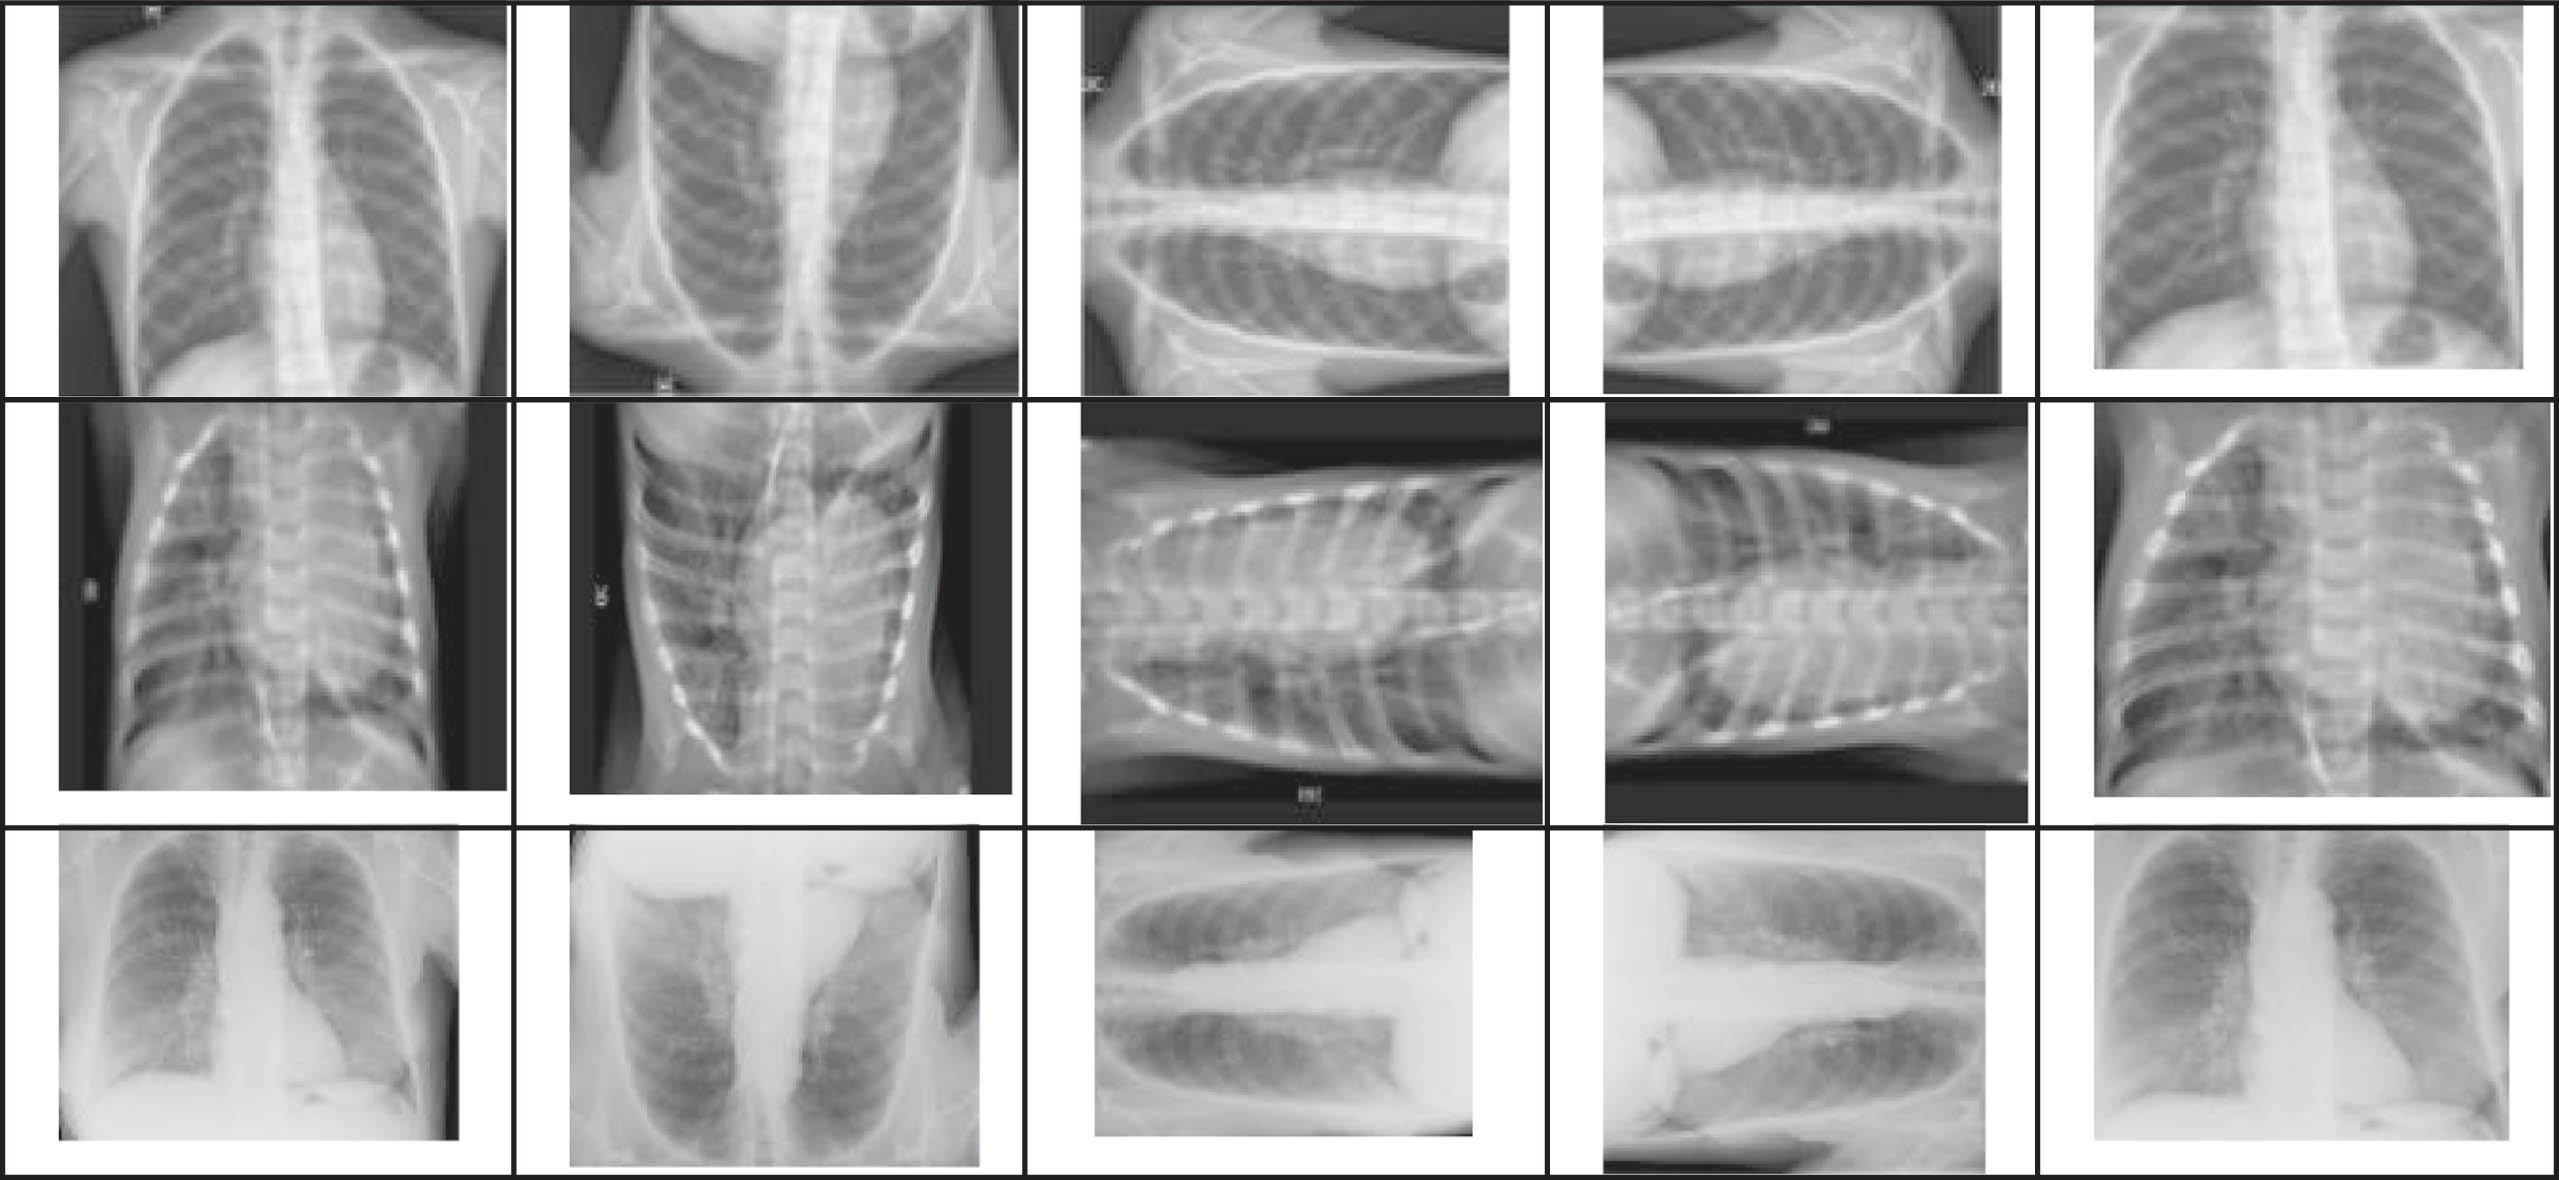
Sample Images displaying (a) Original Chest X-ray Image, Pneumonia, and COVID-19+, (b) Vertically Flipped Images, (c) Rotate –900, (d) Rotate +900, and (e) Cropped Image.
U-Net Image Segmentation
The implemented architecture of COVID-19 disease classification is discussed. The input image (I
o
(n) , I
v
(n) , I
l
(n) , I
r
(n) , I
c
(n)) is given as input for U-Net segmentation. Here, the images are initially normalized. Generally, U-Net [34, 35] is a modified variant of fully CNN that can function effectively even with small datasets. The U-Net is built with an encoder-decoder architecture, where the encoder is in charge of input features and only takes into account the most important ones, while the decoder is in charge of learning the features from the encoder and producing better results for the actual input or desired result. Two important U-Net parts, the contracting and expansive paths, are situated on the left and right sides and compute down- and up-sampling, respectively. Plotting initial weights from a Gaussian distribution with a standard deviation of
Here, v signifies the categories count, u
x
(v) represents the feature channel v’s activation value, in which the pixel is in y, (y ∈ ϑ). The notion ϑ refers to the true label set of the pixel. The energy function is expressed in Equation (4), with the goal of cross-entropy C
E
being to penalize the nonconformity of ρq(y) (y) and q at every point.
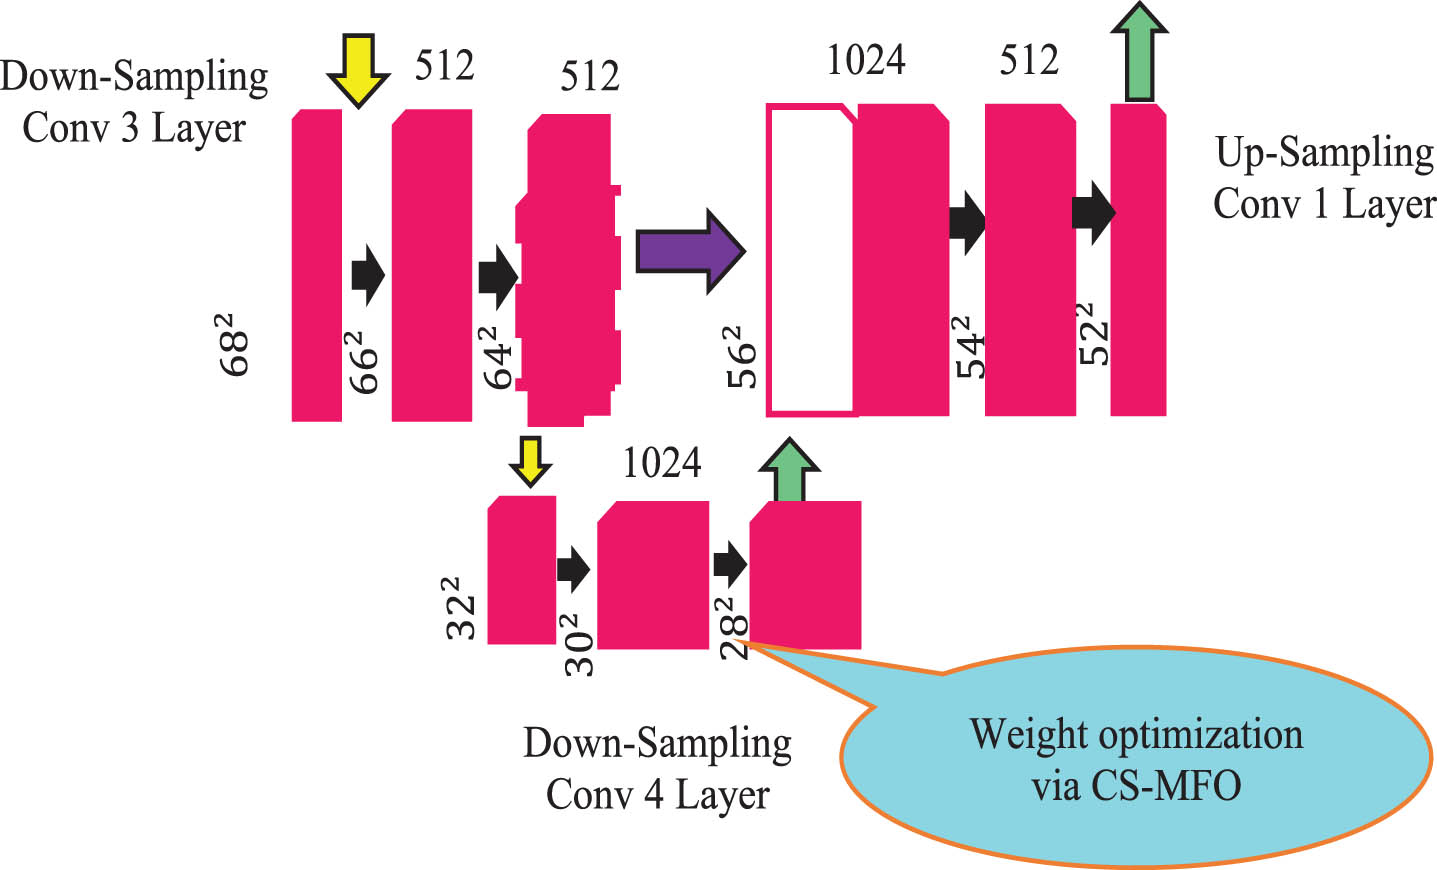
The notation, q : ϑ→ { 1, …, v } states every pixel’s true label, ω : ϑ → Z indicates the pixel training’s weight map, and ρq(y) (y) points out the probability of the softmax function. Table 3 shows the parametric description of the FUCNN employed for segmentation and classification. The weight ω of the standard U-Net design and weight W of CNN is now optimized with CSMFO. The graphical depiction of FUCNN optimization utilizing the CSMFO Model is shown in Fig. 4. The fundamental design of U-Net for 32 × 32 pixel resolution is shown in Fig. 5.
Graphical Depiction of U-Net Optimization utilizing CSMFO Model.

Fundamental Design of U-Net for 32 × 32 Pixel.
Generally, the MFO algorithm was inspired by how moths navigate [36]. The moth population is expressed as provided in Equation (5), where m denotes the number of moths and r denotes dimensions. According to Eq, the fitness values for moths are kept in an array (6).
Here, Equation (7) defines the flames of a moth, and Equation (8) shows the fitness of flames.
The three-tuple representation of the global optimal in MFO is shown in Equation (9), where A and B are the parameters used to form the moth population and their corresponding fitness values, T is the termination procedure, and it returns either true or false.
The transverse orientation of moths is a key inspiration for MFO, and this model is realized by updating the moths with their corresponding flames as shown in Equation (10), where
The distance
According to Equation (13), as the iteration count rises, the moths with better flames are taken into account for further processing and the rest are ignored. Here,
The conventional MFO is effective at tackling discrete optimization issues as well as complex issues. However, the performance is constrained by difficulties in achieving the best convergence and problems with local optima. By substituting a chaotic system-based update function for the logarithmic spiral of moths provided in (11), the classic MFO is modified with the intention of overwhelming the problems and attempting to resolve the imprecise COVID-19 disease classification systems. The enhanced moths’ update is defined by Equation (14), where
This improvement made the traditional MFO perform well and helps to achieve better accuracy performance and is thus named CSMFO. Algorithm 1 summarizes the proposed algorithm of the CSMFO model.
The major aim of this paper is to improve the accuracy of COVID-19 disease classification. For this reason, the excellence of MFO is utilized and tuned via chaotic system concepts. Algorithm 2 defines the fitness estimation of moth population
U-Net exposes Fully Convolutional Network (FCN) computational properties because it has a distinct Neural Network (NN) architecture. Even while U-Net offers noteworthy performance, there is always room for enhancement in terms of the accuracy of the results in the field of image processing. With the goal of improving accuracy for COVID-19 disease classification, the final convolution layer of U-Net’s weight parameter ωis improved using the CSMFO model. The contraction process specifically carries out down-sampling, which encodes the input data and omits irrelevant features. It thus narrows the feature space and significantly trains the network. Here, the down-conv4 layer’s weight parameter is tuned with a constant ρ to achieve noteworthy performance, where ρ = 0.5. The solution encoding of CSMFO is shown in Fig. 6, where ω is the weight parameter of U-Net, and W denotes CNN’s weight.

Solution Encoding of Proposed COVID-19 Disease Classification using CSMFO.
Figure 7 represents the segmented CXR images using the proposed CSMFO-FUCNN model. Figure 8 signifies the flowchart of the proposed CSMFO.
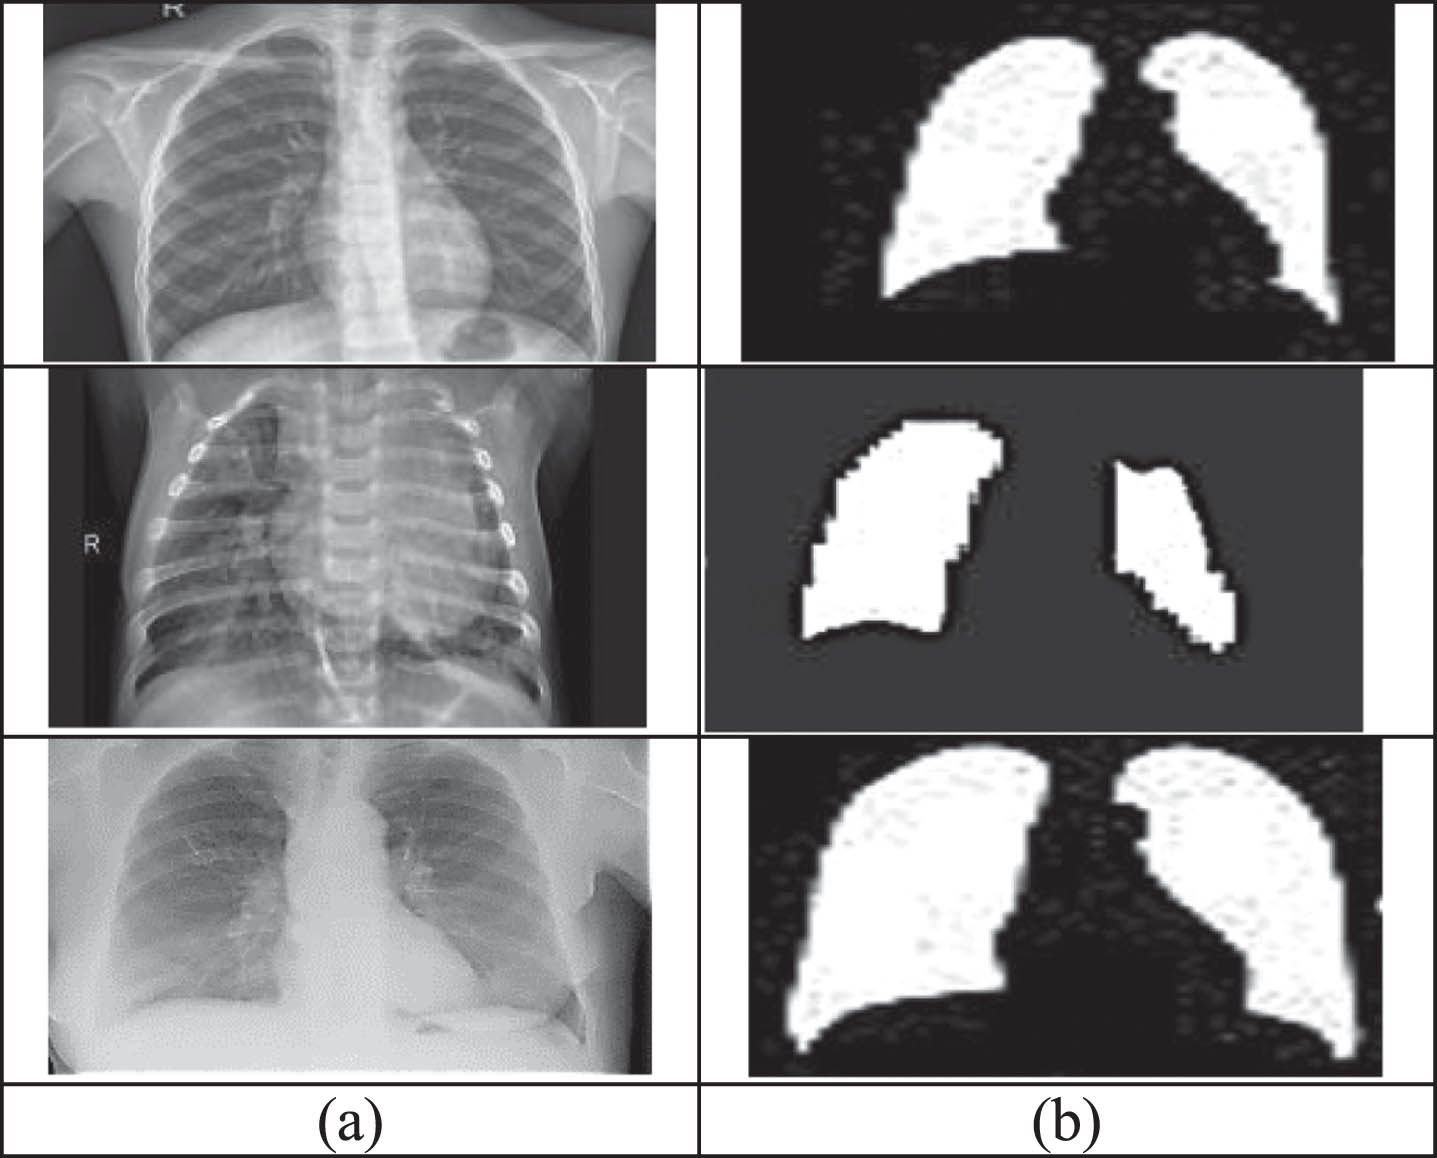
Sample Images displaying (a) CXR Images of Normal People, Pneumonia, and COVID-19+, and (b) Segmented Images of CXR Images of Normal People, Pneumonia, and COVID-19+ using using Proposed CSMFO-FUCNN.

Flow chart of Proposed CSMFO for COVID-19 Disease Classification.
Simulation Setup
The suggested COVID-19 disease classification system via the modified U-net and CNN approach was implemented in MATLAB on Intel® core i7 processor 1065G7@3.9 GHz, 32 GB RAM, 64-bit operating system. Here, CXR/CT Dataset was employed for classification which is available in the link COVID-19 Radiography Database | Kaggle and ieee8023/covid-chestxray-dataset: We are building an open database of COVID-19 cases with chest X-ray or CT images. (github.com) [Access date: 27-10-2022]. The efficiency and novelty of the implemented model were recorded via the simulation results. Here, the evaluation was implemented through various performance parameters such as accuracy, sensitivity, specificity, and precision. In addition to this, a comparative study is carried out to assess the performance of the suggested model over several traditional methods such as K-Nearest Neighbor (KNN) [37], Deep belief Network (DBN) with hosted Cuckoo optimization Algorithm (COA) [38], CNN with Bayesian optimization (BO) [39], and CNN-Multi-Objective Emperor Penguin Optimizer (CNN-MOEPO) [40].
Algorithmic analysis
The implemented COVID-19 disease classification scheme via the modified U-Net model is described in this section. The important features were retrieved using the U-Net methodology and classified using the suggested method. Figure 9 displays the performance of the proposed model concerning the convergence graph of the implemented CSMFO and other conventional models such as the Whale Optimization Algorithm [41], Grey Wolf Optimization [42], Duffing Equation-based Tuna Swarm Optimized Resnet 101 (DETS-Optimized Resnet 101) [43], Euler-Lagrangian Equation-Assisted WOA-DCNN (EEA-WOA-DCNN) [44], and conventional MFO in Fig. 9(a). Here, the proposed CSMFO attained 7.89%, 6.14%, 4.56%, 1.01%, and 3.11% better than WOA-FUCNN, GWO-FUCNN, MFO-FUCNN, DETS-Resnet 101, and EEA-WOA-DCNN respectively for accuracy performance. similarly, Fig. 9(b) shows the Receiver Operating Characteristic (ROC) curve in which the Area Under Curve (AUC) is 0.931. Figure 9(c) represents the accuracy and loss curves of the proposed model. In the initial epochs, the proposed model shows minimum accuracy and at the end of the computation, the accuracy is considerably increased and attained 98.45%. correspondingly, the loss is high in the beginning and at the end, the proposed model becomes stable with minimized error. Moreover, Fig. 10 displays the performance evaluation of the suggested CSMFO-FUCNN for COVID-19 disease classification over other conventional models by varying the training percentage. The accuracy of proposed CSMFO-FUCNN attained improved performance over other models which is 8.52% better than KNN, 4.67% better than COA-DBN, 5.33% improved than BO-CNN, 3.38% improved than CNN-MOEPO, 1.94% better than DETS-Resnet 101, and 2.11% better than EEA-WOA-DCNN for 70% of training data in Fig. 10(a). Figure 10(b) depicts the sensitivity performance of the proposed CSMFO-FUCNN which is 6.88%, 5.66%, 5.68%, 4.03%, 2.02%, and 2.88% better than KNN, COA-DBN, BO-CNN, CNN-MOEPO, DETS-Resnet 101, and EEA-WOA-DCNN, respectively for 30% of training data. For 50% of training data, the proposed CSMFO-FUCNN accomplished 8.12% better than KNN, 4.67% better than COA-DBN, 5.33% improved than BO-CNN, 3.02% improved than CNN-MOEPO, 1.45% better than DETS-Resnet 101, and 2.01% better than EEA-WOA-DCNN for specificity in Fig. 10(c). Finally, Fig. 10(d) demonstrates the precision results of the proposed CSMFO-FUCNN for 80% of training data which reached 7.98%, 4.14%, 5.32%, 2.98%, 0.98%, and 1.56% better than KNN, COA-DBN, BO-CNN, CNN-MOEPO, DETS-Resnet 101, and EEA-WOA-DCNN, respectively. From the experimentation, it is evident that the proposed CSMFO- FUCNN attained promising results and outperformed the existing models.

Performance indicating (a) Convergence Graph of Proposed CSMFO for COVID-19 Disease Classification over other Traditional Models concerning Accuracy, (b) ROC Plot, and (c) Accuracy and Loss of proposed CSMFO-FUCNN Model.

Performance Evaluation of Proposed CSMFO-FUCNN for COVID-19 Disease Classification over other Conventional Models by means of (a) Accuracy, (b) Sensitivity, (c) Specificity, and (d) Precision.
Table 2 summarizes the performance evaluation of the proposed CSMFO-FUCNN concerning training percentages like 30%, 50%, 70%, and 80% respectively, and varying epochs of DL algorithms such as 30, 50, 60, and 70 respectively. For 30 epochs of accuracy, the proposed CSMFO-FUCNN accomplished 65.47%, 76.89, 81.62, and 88.85% for 30%, 50%, 70%, and 80% of training data respectively. For 70% training data, the suggested method’s accuracy for epoch = 50, 60, and 70, are 88.27, 95.74, and 97.78 respectively, while its accuracy for Epoch = 70 is better at 97.78 %. For 80% of training data, the sensitivity of the proposed technique at epoch 80 is 9.76%, and 5.58% better than at epochs 30, and 50 respectively. Similar to this, when epoch 70, the proposed approach has a high specificity of 98.98% which is 1023%, and 5.81% improved than epochs 30, and 50 respectively. For 80% of training data and epoch 70, the proposed CSMFO-FUCNN reached its highest precision performance of 98.98%. This investigation helps to identify the efficacy of the proposed DL algorithm CSMFO-FUCNN and proves its significance in COVID-19 disease classification.
Features And Challenges Of COVID-19 Disease Classification Strategy Using Various DL Methods
Parametric Description of Developed FUCNN Model
Performance Evaluation of Proposed CSMFO- FUCNN concerning Training Percentage
Performance Evaluation of Proposed CSMFO- FUCNN concerning Training Percentage
The implemented COVID-19 disease classification scheme using CXR/CT images with CSMFO-FUCNN attained enhanced accuracy performance. Prompt identification of COVID-19 patients can assist in maximizing the use of the resources that are already available, including skilled human resources, for all the supporting measures needed for confirmed patients. The proposed model has shown that automated DL-based intelligent CXR categorization offers untapped promise for this unmet requirement. Similarly, implementing DL-based quick and time-saving solutions to help with prognosis and evaluation of recovering/follow-up patients may be a great idea. Nevertheless, in order to create a more dependable and accurate classification model, this study has certain fundamental flaws that must be addressed. The process facilitates categorization for DL algorithms, but it also introduces bias because of the disparities in lung capacity between children and adults. Instead of using unhealthy vs. normal or any other criterion, it is likely that fresh, unknown photographs belonging to a certain age group will be automatically allocated to a class of images that have images comparable to that age group. The AI-based models trained on fewer pictures run the risk of overfitting in the classification models since there are only a limited amount of CXR images available for COVID-19. However, the performance of our model on different datasets disproves any claim that they were overfitting. In the future, the model training will be improved even further by including a huge number of photos to create classification models that are more reliable and scalable. The amount of CXR data for COVID-19 is growing quickly, thus it is possible to update the classification models and improve their accuracy and usefulness in real-time settings.
This paper introduced a novel Dl algorithm for the COVID-19 disease classification model named CSMFO-FUCNN. Initially, the input images I from the dataset were collected and underwent an image filtering technique called the Weiner filter to remove any noises and produce filtered images I W . Besides, data augmentation was utilized to enlarge the dataset size as (I o (n) , I v (n) , I l (n) , I r (n) , I c (n)) so as to enhance the classification performance. Now, the augmented photos were subjected to segmentation by U-Net. The key features were extracted and segmented using the U-Net approach. The segmented images were given to optimized FUCNN for categorization. The CSMFO method has also been used to adjust the U-Net weights ω and CNN weight W to increase accuracy performance. Using the findings from the classification, a comparison analysis was done to measure the efficacy of the developed scheme concerning accuracy, sensitivity, specificity, and precision. The convergence of proposed CSMFO attained 7.89%, 6.14%, 4.56%, 1.01%, and 3.11% better than WOA-FUCNN, GWO-FUCNN, MFO-FUCNN, DETS-Resnet 101, and EEA-WOA-DCNN respectively for accuracy performance. The accuracy of the proposed CSMFO-FUCNN attained improved performance over other models which was 8.52% better than KNN, 4.67% better than COA-DBN, 5.33% improved than BO-CNN, 3.38% improved than CNN-MOEPO, 1.94% better than DETS-Resnet 101, and 2.11% better than EEA-WOA-DCNN for 70% of training data. For 70% of training data, the suggested method’s accuracy for epoch = 50, and 70 are 88.27, and 95.74, respectively, while its accuracy reached the highest performance at epoch = 80 which was better at 97.78 %. From the accomplished results, the proposed CSMFO-FUCNN model proved its efficacy and significance in COVID-19 disease classification. In the future, DL algorithms will be used for data augmentation to avoid specific dataset enlargement procedures. Also, the model training will be improved even further by including a large number of images in order to create classification models that are more consistent and scalable.