
Abstract
Attribute reduction for incomplete data is a hot topic in rough set theory (RST). A fuzzy probabilistic information system (FPIS) combines of fuzzy relations that satisfy the probability distribution about objects, which can be regarded as an information system (IS) with fuzzy relations. This paper studies attribute reduction in an FPIS. Based on the available information of objects on an ISVIS, the probability distribution formula of objects is first defined. Then, an FPIS can be induced by an ISVIS. Next, attribute reduction in a FPIS is proposed similar to an IS. Moreover, information granulation and information entropy in an FPIS is defined, and the corresponding algorithms are constructed. Finally, the effectiveness of the constructed algorithms is verified by k-means clustering, Friedman test and Nemenyi test.
The appendix of symbols
An object set
An attribute set
[0,1]
The family of all subsets of U
Fuzzy probabilistic approximation space (FPA-space)
Fuzzy probabilistic information system (FPIS)
Information system
Incomplete set-valued information system
The family of all fuzzy sets on U
The cardinality of F
The family of all fuzzy relations on U
The subfamily of all finite subsets of IU×U
Upper-information granulation of
Lower-information granulation of
Information granulation of
Upper-information entropy of
Lower-information entropy of
Information entropy of
Introduction
Research background and related works
Rough set theory (RST), an extremely important data analysis tool brought forward by Pawlak [33]. As a basic uncertainty management method, RST has the advantage of being directly applied to raw data, thus it has a wide range of applications. Al-Shami et al. [1, 2] put forward maximal rough neighborhoods and introduced an improvement of rough sets’ accuracy measure using containment neighborhoods. El-Bably et al. [18, 19] considered soft β-rough sets with application to determine COVID-19 and studied medical diagnosis for the problem of Chikungunya disease using soft rough sets. Al-Shami et al. [8] brough up approximation operators and accuracy measures of rough sets from an infra-topology view. Abu-Gdairi et al. [16] presented two different views for generalized rough sets. Al-Shami et al. [5] proposed rough sets models inspired by supra-topology structures. Nawar et al. [32] proposed θ β-ideal approximation spaces. Hosny et al. [22–24] advanced novel approaches of generalized rough approximation spaces inspired by maximal neighbourhoods and ideals, gave rough approximation spaces via maximal union neighborhoods and ideals, and proposed rough set models in a more general manner. Al-Shami et al. [7] raised improvement of approximation spaces using maximal left neighborhoods and ideals. Al-Shami et al. [3, 4] presented topological approach to generate new rough set models, and gave improvement of the approximations and accuracy measure of a rough set using somewhere dense sets.
An information system (IS) expresses relationships between objects and attributes through a data table, in which the rows of the data table correspond to the objects studied, and the columns represent the attributes of the objects. When the information value in a data table is a set, this data are called set-valued data. Some scholars have studied set-valued data from different research perspectives. For instance, Leung et al. [28] proposed minimum feature set selection method for a set-valued IS; Yao [47] investigated upper and lower approximations for a set-valued IS; Couso et al. [11] found the rationality of a set-valued IS from the perspective of statistics; Huang et al. [25] analyzed set-valued through probability distribution and obtained a probability set-valued IS; Xie et al. [45] researched uncertainty measures for an interval-valued IS; Qian et al. [34] studied feature selection for a set-valued ordered IS; Liu et al. [31] gave an attribute reduction method for a set-valued decision IS base on dominance relations; Chen et al. [15] obtained a feature selection method for a set-valued IS from the view of tolerance relations.
If there are missing information values in a data, this data is also called an incomplete data, which is an important data in statistical analysis. As a kind of data in practical application, the information value of set-valued data is missing in some practical situations, which may lead to the loss of some key information. This kind of set-valued data containing missing or unknown values is also called an ISVIS, which is a type of incomplete data. Some scholars have paid attention to an ISVIS. Xie et al. [46] studied the information structure and the uncertainty measure of an incomplete probability set-valued IS through the distance between the values of two information functions; Chen et al. [13] researched some tools for uncertainty of an incomplete set-valued IS.
Attribute reduction, as an extremely important technology of data processing in machine learning, can not only effectively reduce redundant attributes, but also reduce the complexity of big data computing. Many researchers have studied attribute reduction for different data. For instance, Song et al. [39] obtained attribute reduction method for a set-valued decision IS; Tang et al. [41] explored attribute reduction in a set-valued decision IS; Wang et al. [43] brought up an iterative reduction algorithm according to variable distance parameter; Qian et al. [35] obtained an algorithm for attribute reduction according to RST; Cornelis et al. [14] proposed a general concept for a fuzzy decision reduct; Giang et al. [21] presented an algorithm for attribute reduction in dynamic decision table; Chen et al. [10] applied fuzzy kernel alignment to attribute reduction for heterogeneous data; Li et al. [9] investigated a acceleration strategy for attribute reduction algorithms; Li et al. [29 analyzed some existing reduction methods; Wang et al. 44] defined some uncertainty measures, and designed an algorithm for attribute reduction. El-Bably et al. [17] gave a topological reduction for predicting of a lung cancer disease based on generalized rough sets.
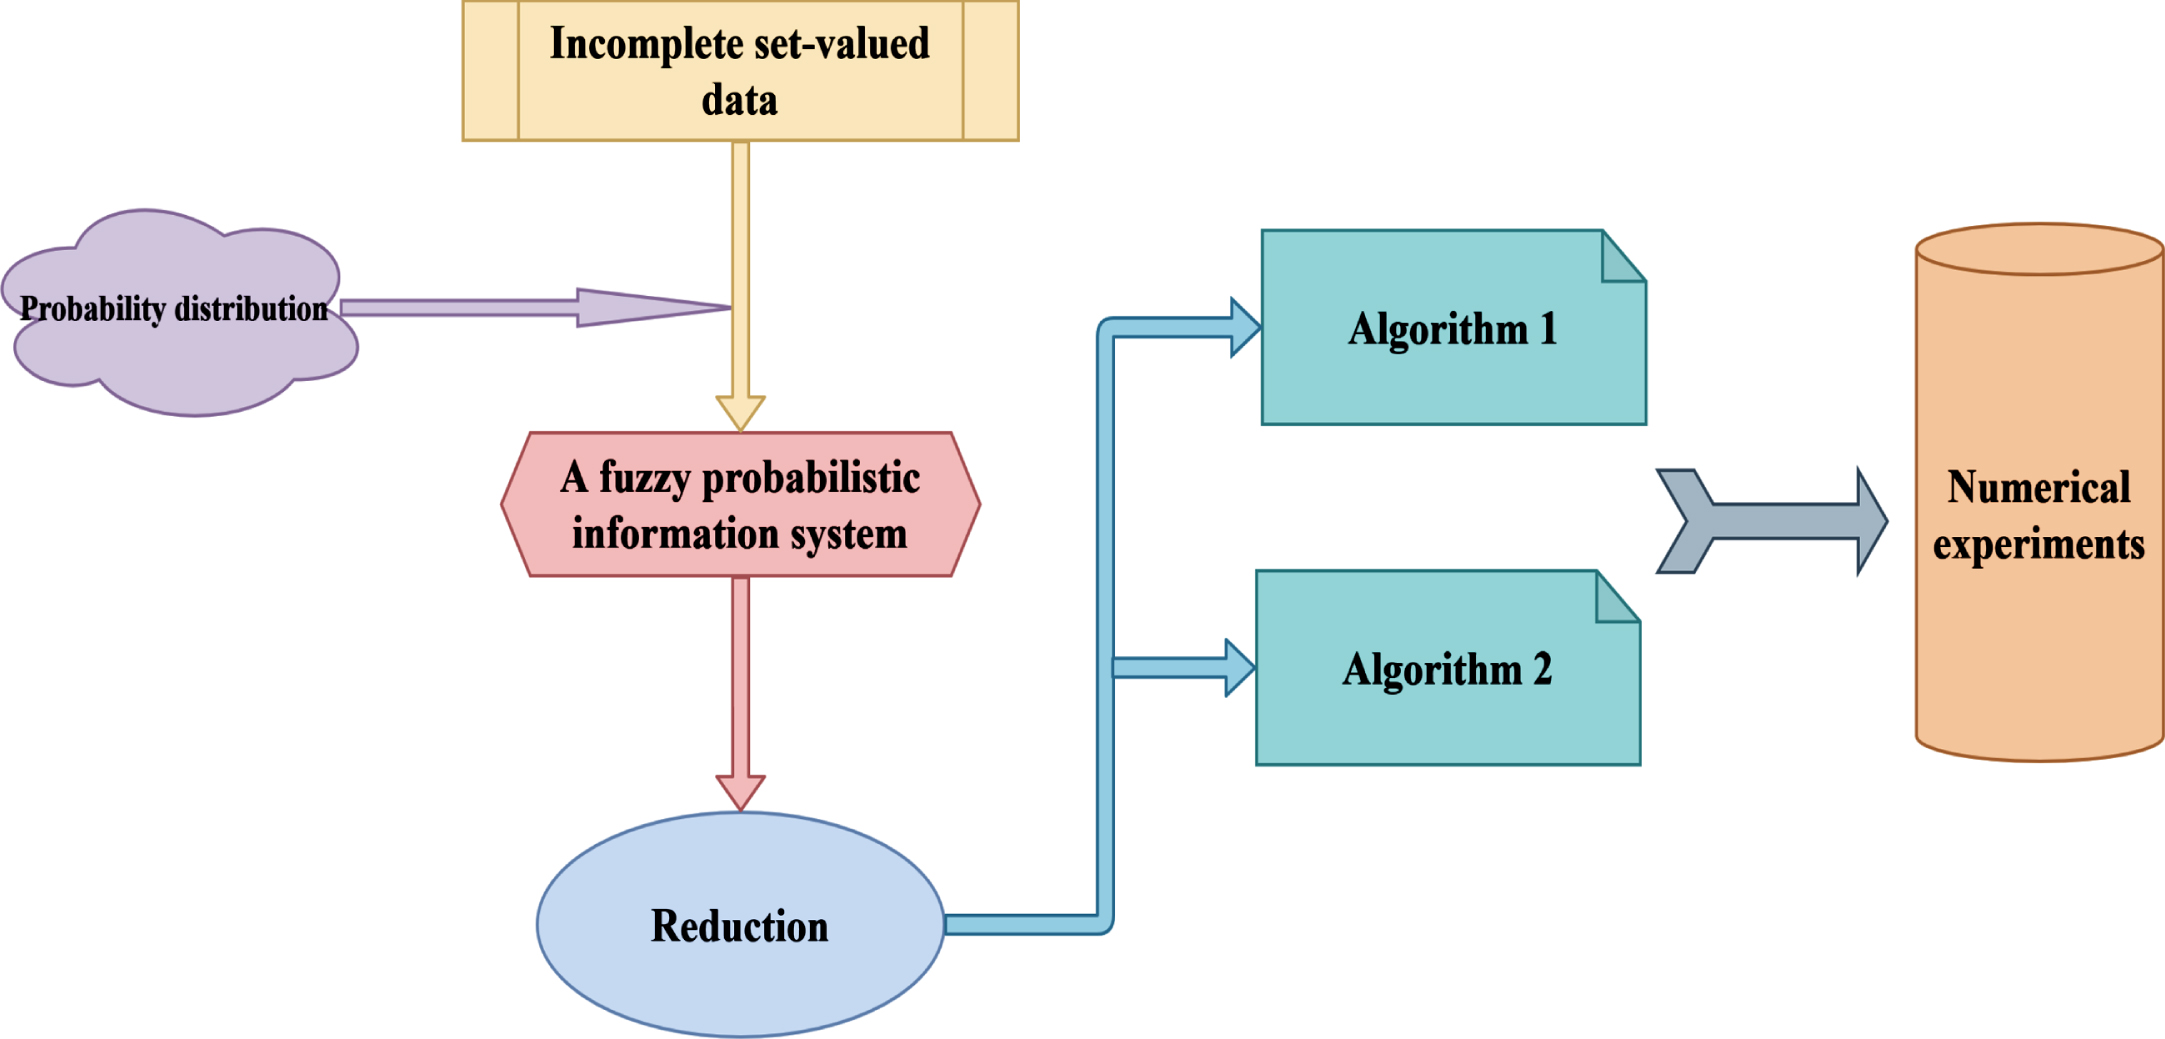
The work flow of this paper.
A fuzzy probabilistic information system (FPIS) [26, 30, 48] can be thought of as an IS composed of fuzzy relations in probabilistic circumstances. Incomplete set-valued data contains missing values. In this case, they contain different amounts of available information, so objects have an uneven distribution of available information. The available information is regarded as the probability distribution of the objects, and the fuzzy relation is generated by each attribute of an ISVIS. Thus, an ISVIS can induces an FPIS.
Based on the above research motivation, the major contributions are summarized as follows.
(1) We find the fact that the available information in an ISVIS is regarded as the probability distribution of objects, and define the fuzzy relation generated by each attribute of an ISVIS by using the similarity degree between two information values;
(2) We introduce the FPIS induced by an ISVIS, and propose attribute reduction in an FPIS similar to an IS;
(3) We define information granulation and information entropy in an FPIS, and give two reduction algorithms of an ISVIS based on them. In check to see the rationality of the proposed algorithms, we carry out k-means clustering, Friedman test and Nemenyi test.
Organization
The rest of this paper is structured as follows. In Section 2, we review some concepts for fuzzy relations and FPISs. In Section 3, we obtain an FPIS through an ISVIS. In Section 4, we study the reduction problem of an ISVIS based on an FPIS. In Section 5, we verify the effectiveness of the proposed algorithms through experimental analysis. In Section 6, we make a summary of this paper.
Preliminaries
Firstly, some basic concepts of an ISVIS and fuzzy probabilistic approximation spaces are briefly introduced.
In this section, we recall some basic concepts of fuzzy relations and fuzzy probabilistic information systems.
In paper, I shows [0, 1], U indicates a finite set.
Put
Recall that F is a fuzzy set whenever F is a function defined by F : U → I.
For a ∈ I,
In this article, I U shows the collection of fuzzy sets on U.
Given F ∈ I
U
. Then
If R is a fuzzy set in U × U, then R is called a fuzzy relation on U.
In this article, IU×U denotes the collection of all fuzzy relations on U, and [IU×U] <ω denotes the subfamily of all finite subsets of IU×U.
Given R ∈ IU×U. Then R is represented by the following matrix:
Suppose R ∈ IU×U. For any x ∈ U, then two fuzzy information granule of x with respect to R are defined as follows:
Clearly, [x] R (y) , [x] R ∈ I U .
Then
If
In this section, we define the similarity degree between two information values in an incomplete set-valued information system (ISVIS) and introduce the FPIS induced by an ISVIS.
Let (U, A) be an IS. If there is a ∈ A such that * ∈ V
a
, here * means a null or unknown value, then (U, A) is called an incomplete information system (IIS). For each a ∈ A, denote
Suppose that (U, A) is an IIS. Then (U, A) is referred to as an ISVIS, if for any a ∈ A and x ∈ U, a (x) is a set.
An ISVDIS (U, A)
Then
Let (U, A) be an ISVIS. For a
k
∈ A and x
i
, x
j
∈ U, define
r (a k (x i ) , a k (x j )) means the similarity degree between a k (x i ) and a k (x j ).
Denote
Suppose
(U, R
a
k
, P) is a FPA-space.
In this section, based on the FPIS induced by an ISVIS, we propose attribute reduction in an FPIS similar to an IS.
The FPIS induced by an ISVIS is actually an IS with fuzzy relations on the universe which satisfies probability distribution. We can reduce an FPIS by deleting irrelevant or unimportant fuzzy relations. Thus, attribute reduction in an ISVIS is realized.
(1) B is called a coordinate of A, if
(2) a ∈ B is said to be independent in A, if
(3) B is referred to as an independent of A, if for any a ∈ B, a is independent in B.
(4) B is referred to as a reduct of A, if B is both coordinate and independent.
In this paper, the family of all coordination subsets (resp., all reducts) of A is denoted by co (A) (resp., red (A)).
In this section, we define information granulation and information entropy in an FPIS and give two reduction algorithms of an ISVIS based on them.
(1) Upper-information granulation of
(2) Lower-information granulation of
(3) Information granulation of
(1) Upper-information entropy of
(2) Lower-information entropy of
(3) Information entropy of
The following shows the application of these two measures to attribute reduction in an ISVIS.
(1) B ∈ co (A);
(2)
(3)
(2)
∀ i, j, let
Then
Note that
Hence
So ∀ i, j, k
ij
= r
ij
. This implies that
(1)
(3)
□
(1) B ∈ red (A);
(2)
(3)
Therefore, both information entropy and information granulation can be used to reflect the classification ability of fuzzy relations and measure the importance of fuzzy relations generated by attributes in an ISVIS, so as to realize attribute reduction in an ISVIS. Next, we consider information entropy and information granulation to construct attribute reduction algorithms.
1:
2:
3: Compute
4:
5: pick
6:
7: Let
8: Let
9: Compute
10:
11: Compute
12:
13:
14: B ← B - {a};
15:
16: break;
17:
18:
19: Return one reduct B.
For Algorithm 1, m and n are the number of attributes and the number of samples, respectively. Meanwhile, the time complexity and space complexity of steps 1-6 are both O (mn2). Steps 10-18 require a time complexity of m. Thus, the overall time complexity of Algorithm 1 is O (mn2 + m). Because the space can be reused, the total space complexity of the two algorithms is O (mn2).
1: Let
2:
3:
4: Compute
5:
6: Pick
7:
8: Let
9: Compute
10:
11: Compute
12: Pick R
i
, make
13:
14:
15: B ← B ∪ {b};
16:
17: break;
18:
19:
20: Return one reduct B.
For Algorithm 2, m and n are the number of attributes and the number of samples, respectively. Meanwhile, the time complexity and space complexity of steps 2-7 are both O (mn2). For Algorithm 2, steps 10-19 require a time complexity of (m2 + m)/2. Thus, the overall time complexity of Algorithm 2 is O (mn2 + m2 + m). Because the space can be reused, the total space complexity of the two algorithms is O (mn2).
In this section, we mainly apply the proposed algorithms to attribute reduction in an ISVIS. In addition, we compare three existing data reduction algorithms with the proposed algorithms, and analyze the size and clustering effect of these five algorithms.
We select 8 data from the UCI database to test the performance of the proposed algorithms, as showed in Table 2. We preprocess the data as follows: first, we randomly delete 20% of the information value on complete data, so incomplete data is regarded as incomplete data. Then, the missing values under each attribute in the incomplete data are transformed into all possible sets under the attribute. Then, each information value is regarded as a set, and 10% of all information values are deleted randomly, so these data become an ISVIS.
Eight datasets from UCI
Eight datasets from UCI
Experiments are conducted on 8 incomplete set-valued data in Table 2 through Algorithm 1 and Algorithm 2. In addition, in order to evaluate the performance of the proposed algorithms and the existing algorithms, we consider comparing our algorithms with the other three algorithms, which are the representative attribute selection algorithm based on fuzzy rough set (FSRS) [38], (FRSM) [16] and the representative attribute selection algorithm based on dominance relationship (DRM) [31]. Next, we give the reduction results of five algorithms in Tables 3, 4, and give the size of the reduction set in Table 5.
The reducts of Algorithm 1 and Algorithm 2
The reducts of three comparative algorithms
The reducts size of the five algorithms
The reduction results for each data are shown in Tables 3, 4. In the Tables 3, 4, for each dataset, the reduct obtained by each algorithm is represented by the sequence number of its attributes, for example, “1-4” means selecting the first attribute to the fourth. It can be seen from Table 5 that FSRS has the least number of attributes among the five algorithms, and the average number of attributes obtained by FSRS in the eight datasets is 4.6. The size of the reduct selected by Algorithm 1 is smaller than FRSM and DRM in all datasets. The size of the reduct selected by Algorithm 2 is smaller than FRSM and DRM in most datasets. In general, FRSM has the most selected attributes, followed by DRM, Algorithm 1 has the second smallest reduct average size, and Algorithm 2 has the third.
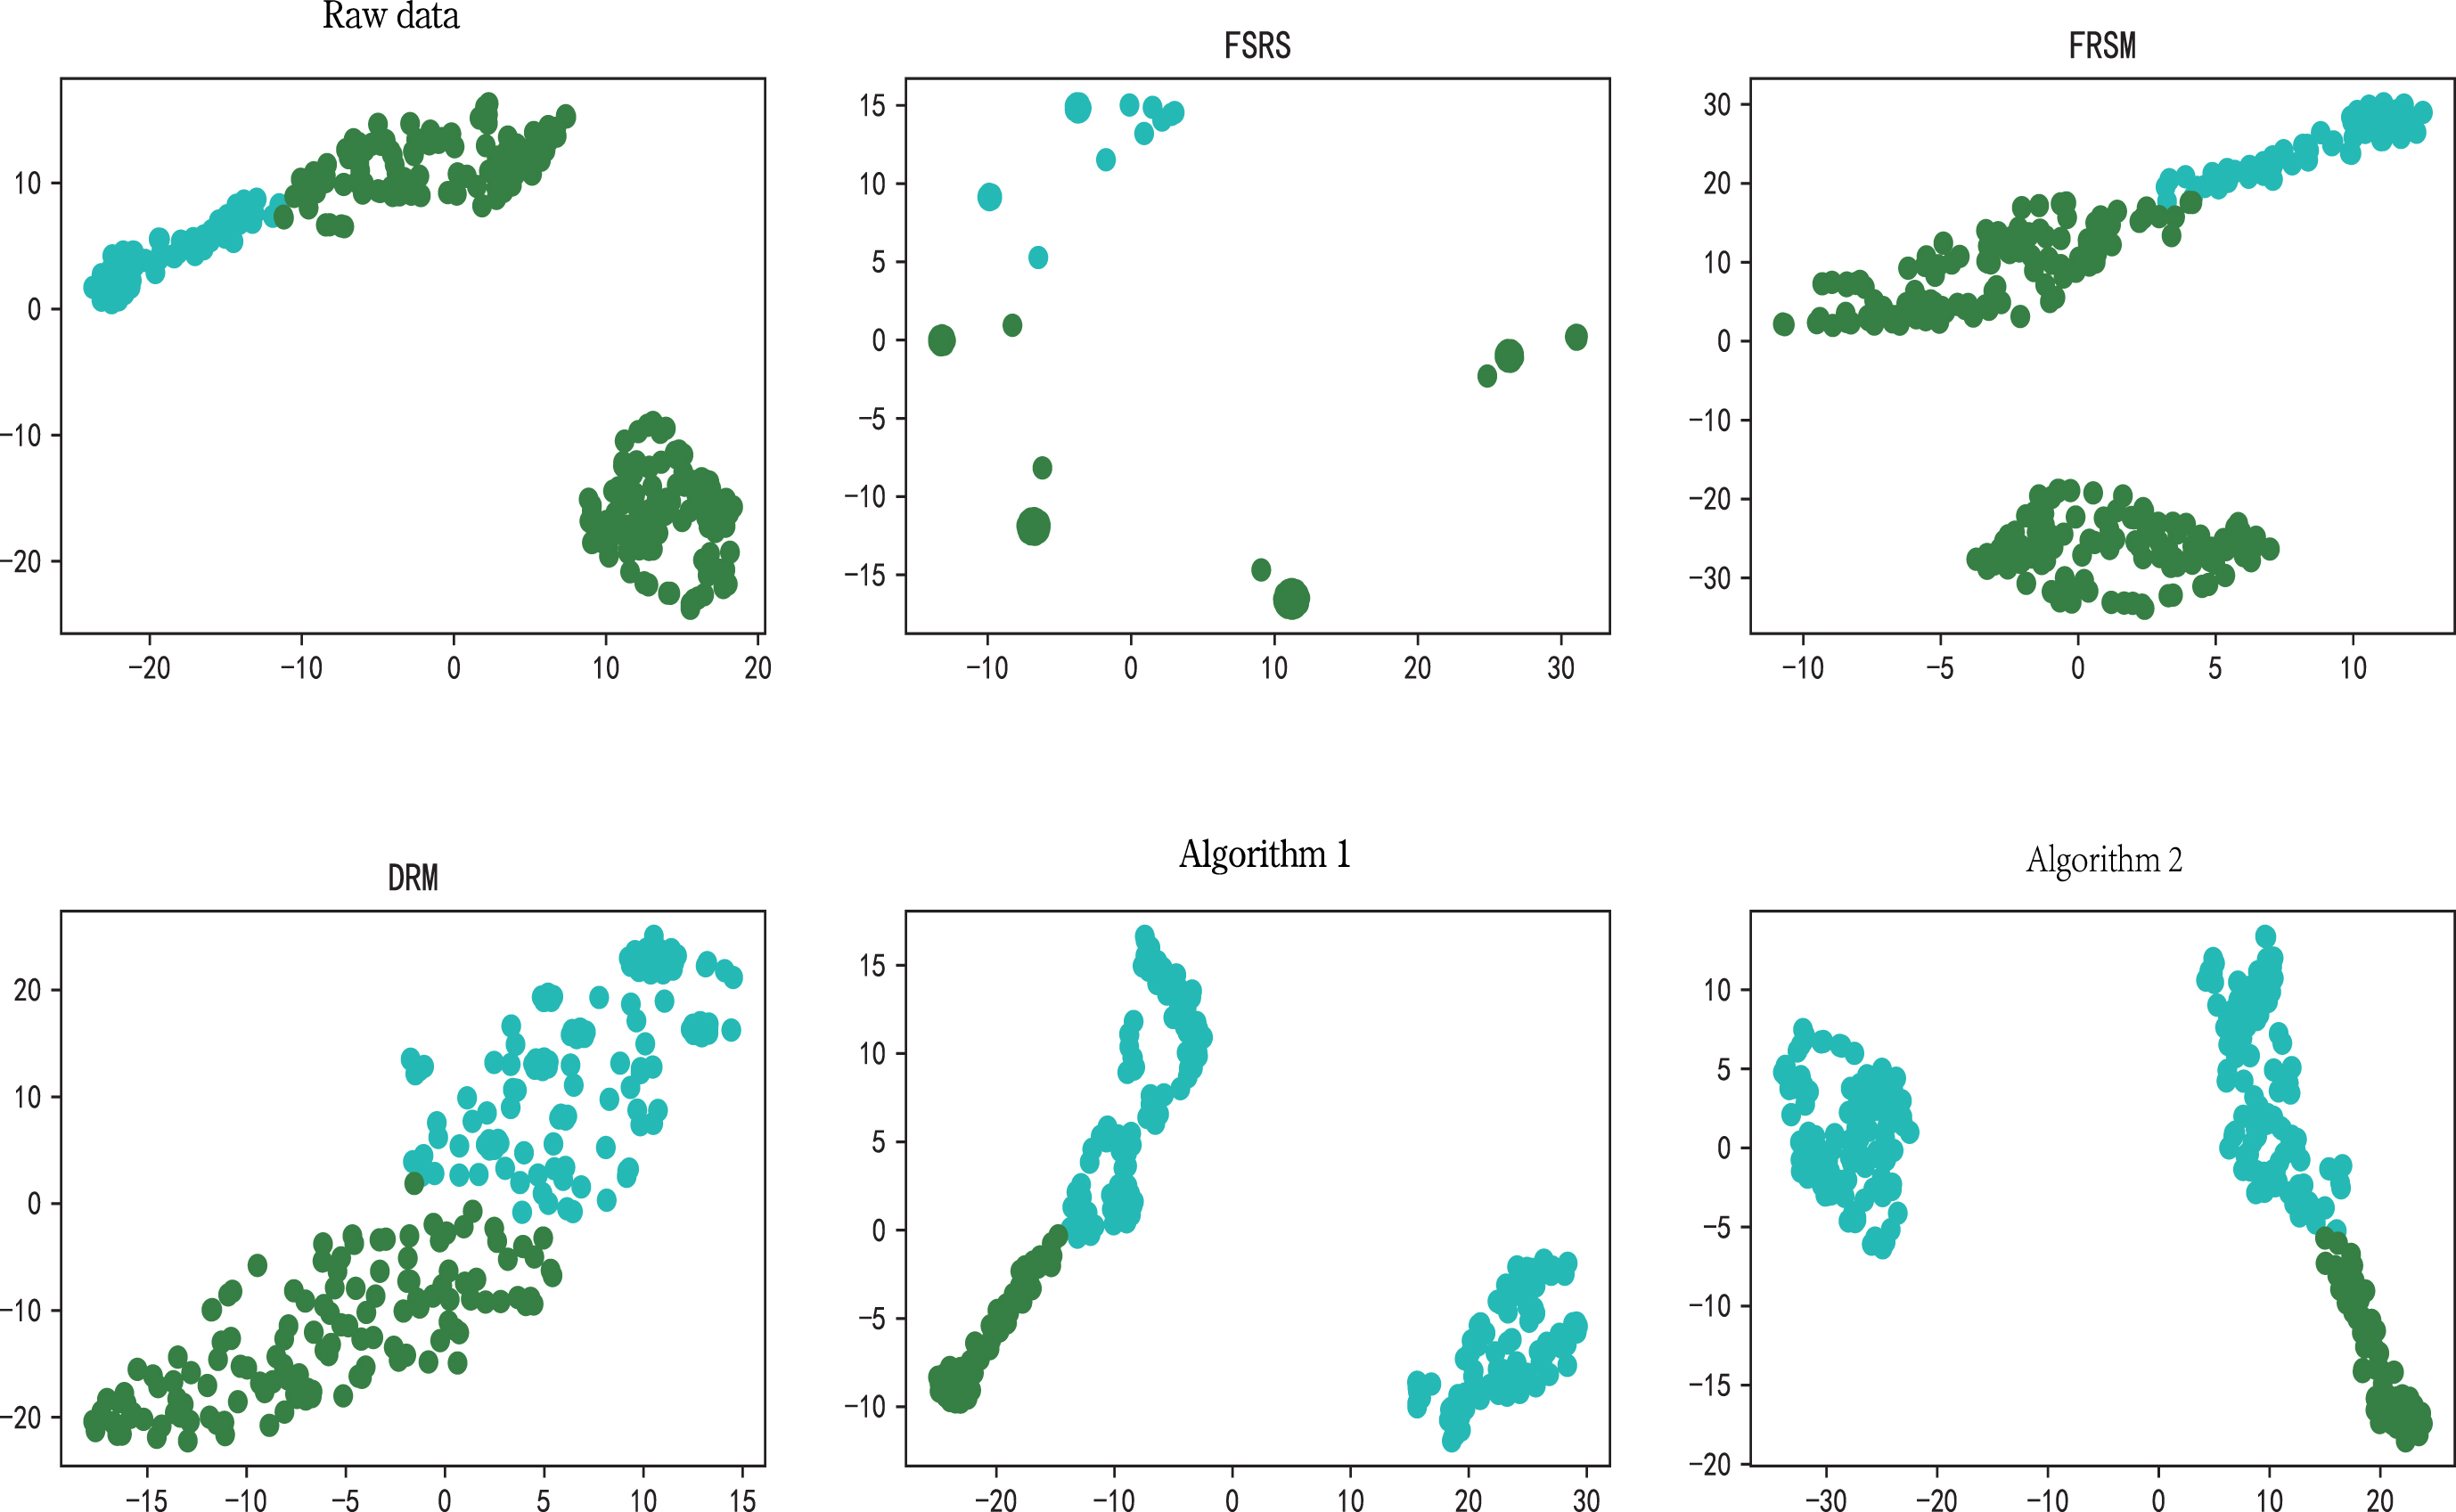
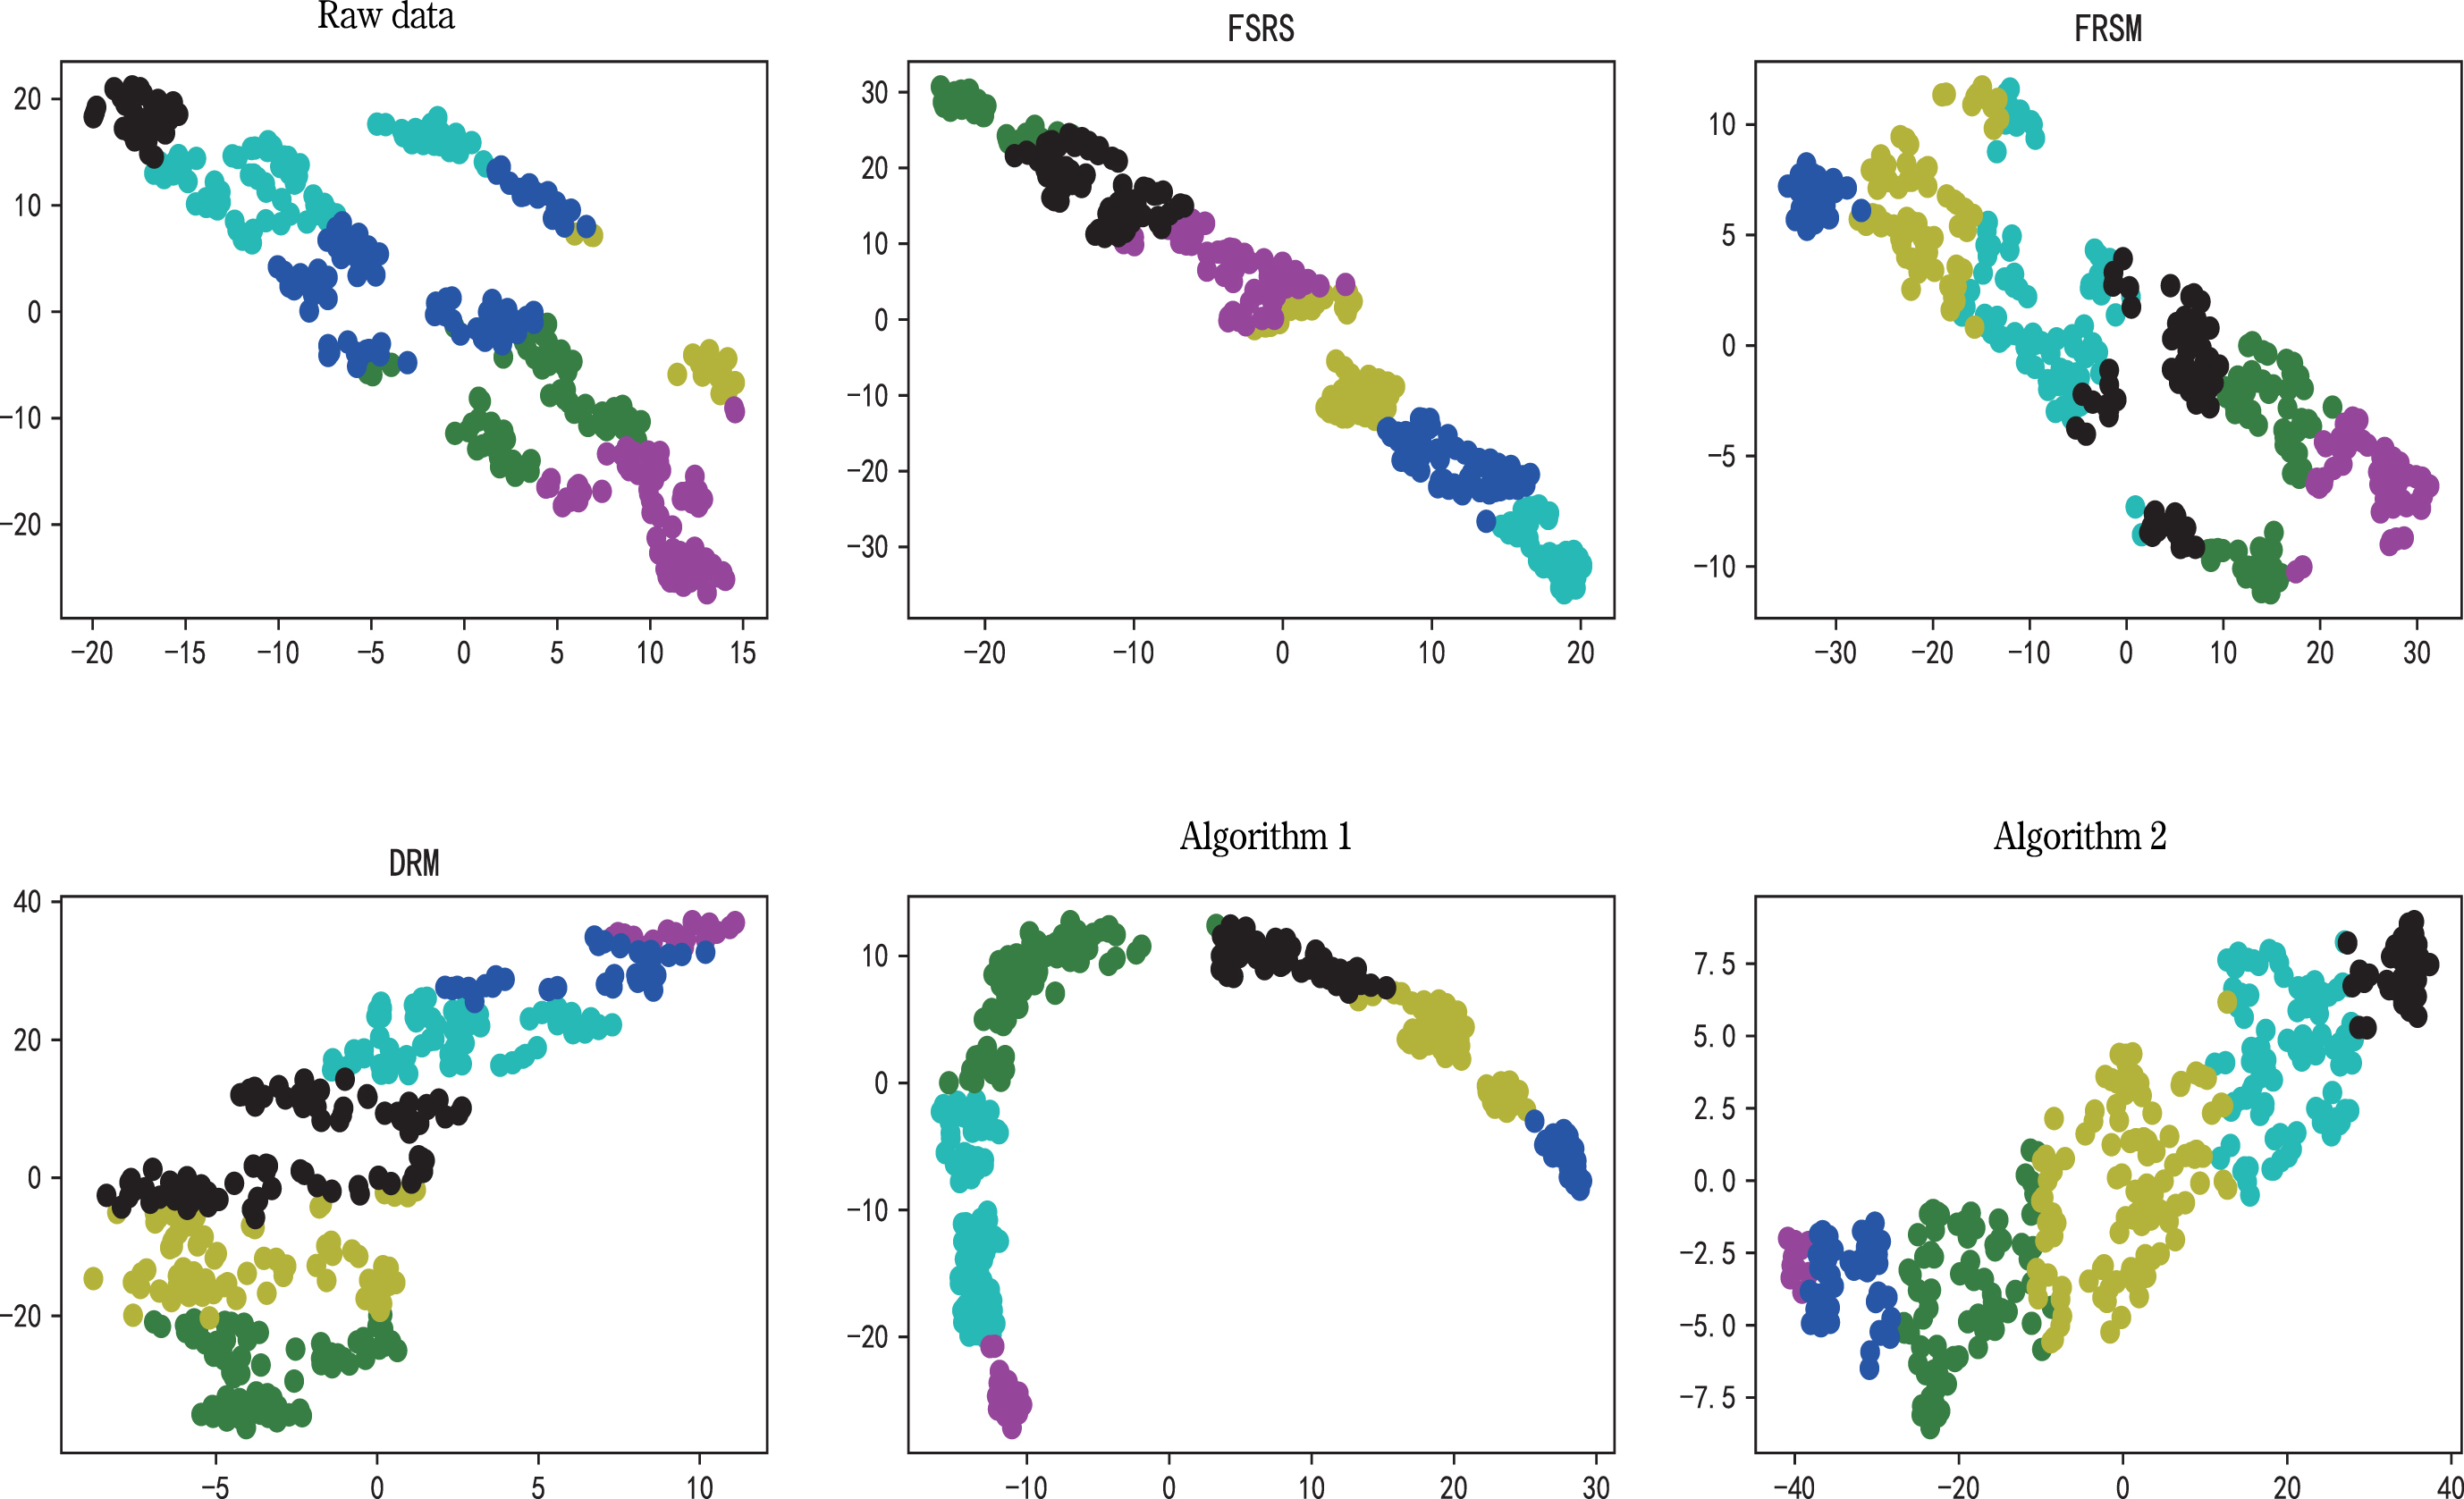
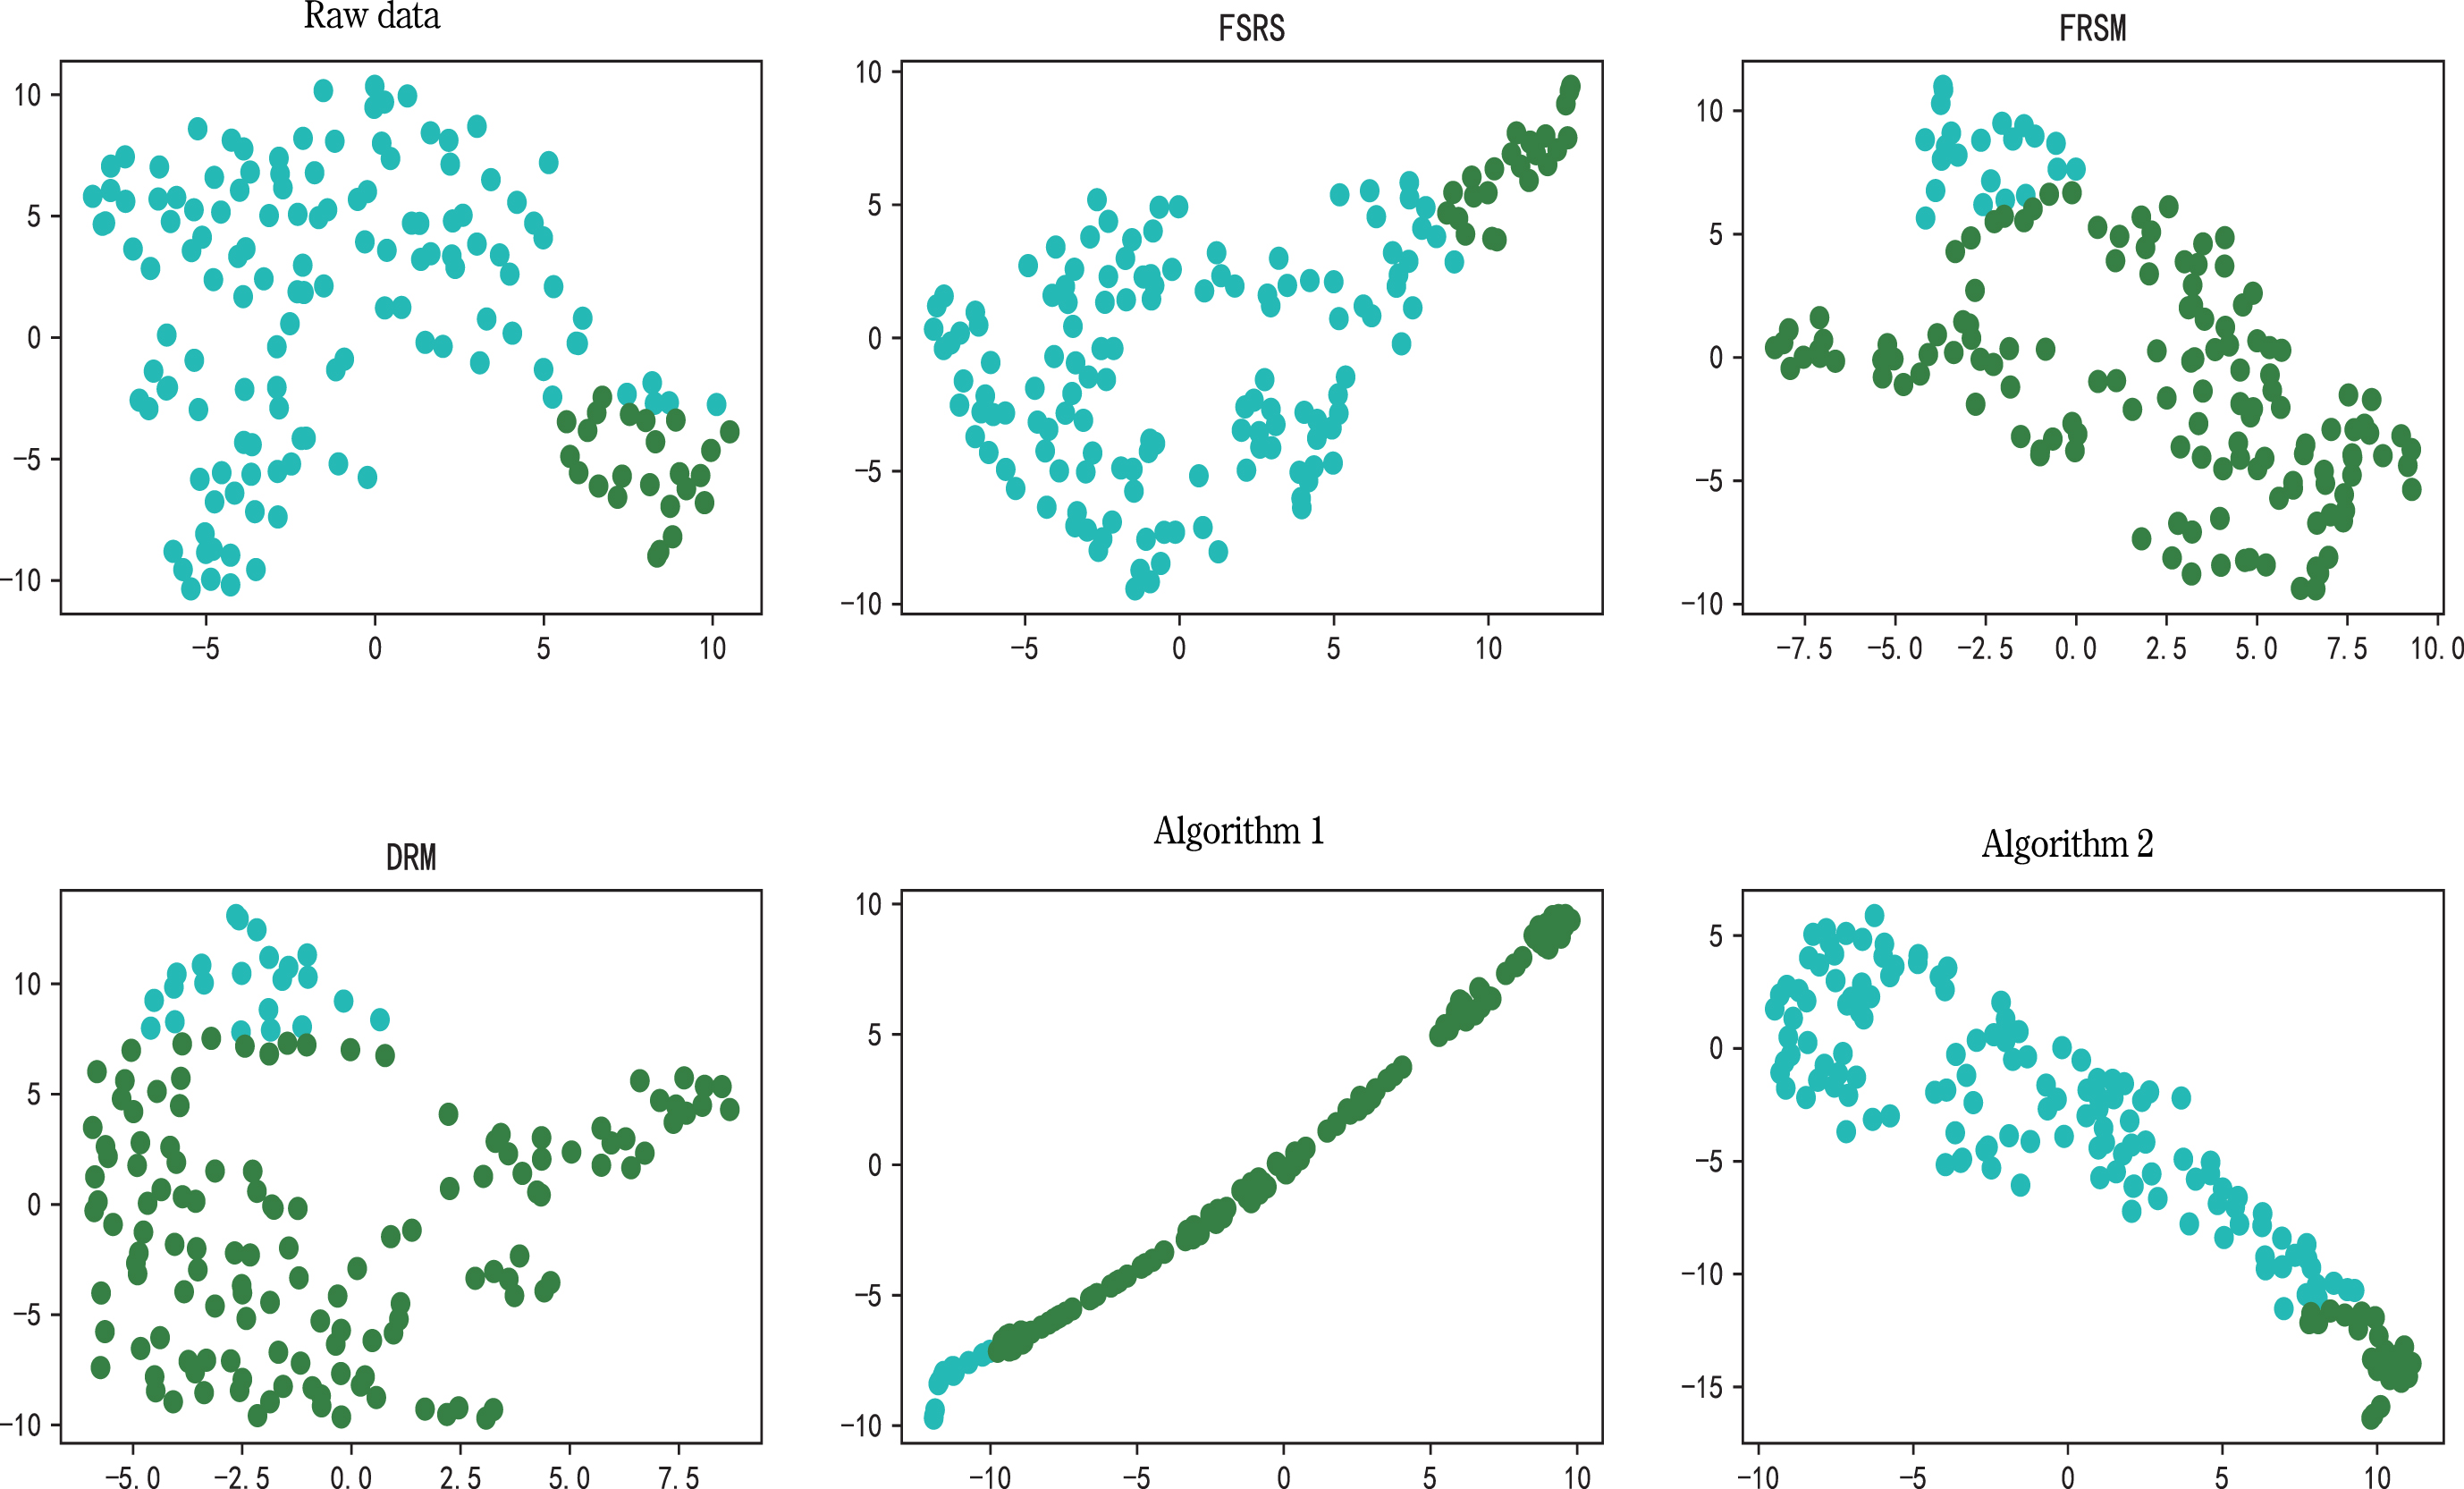
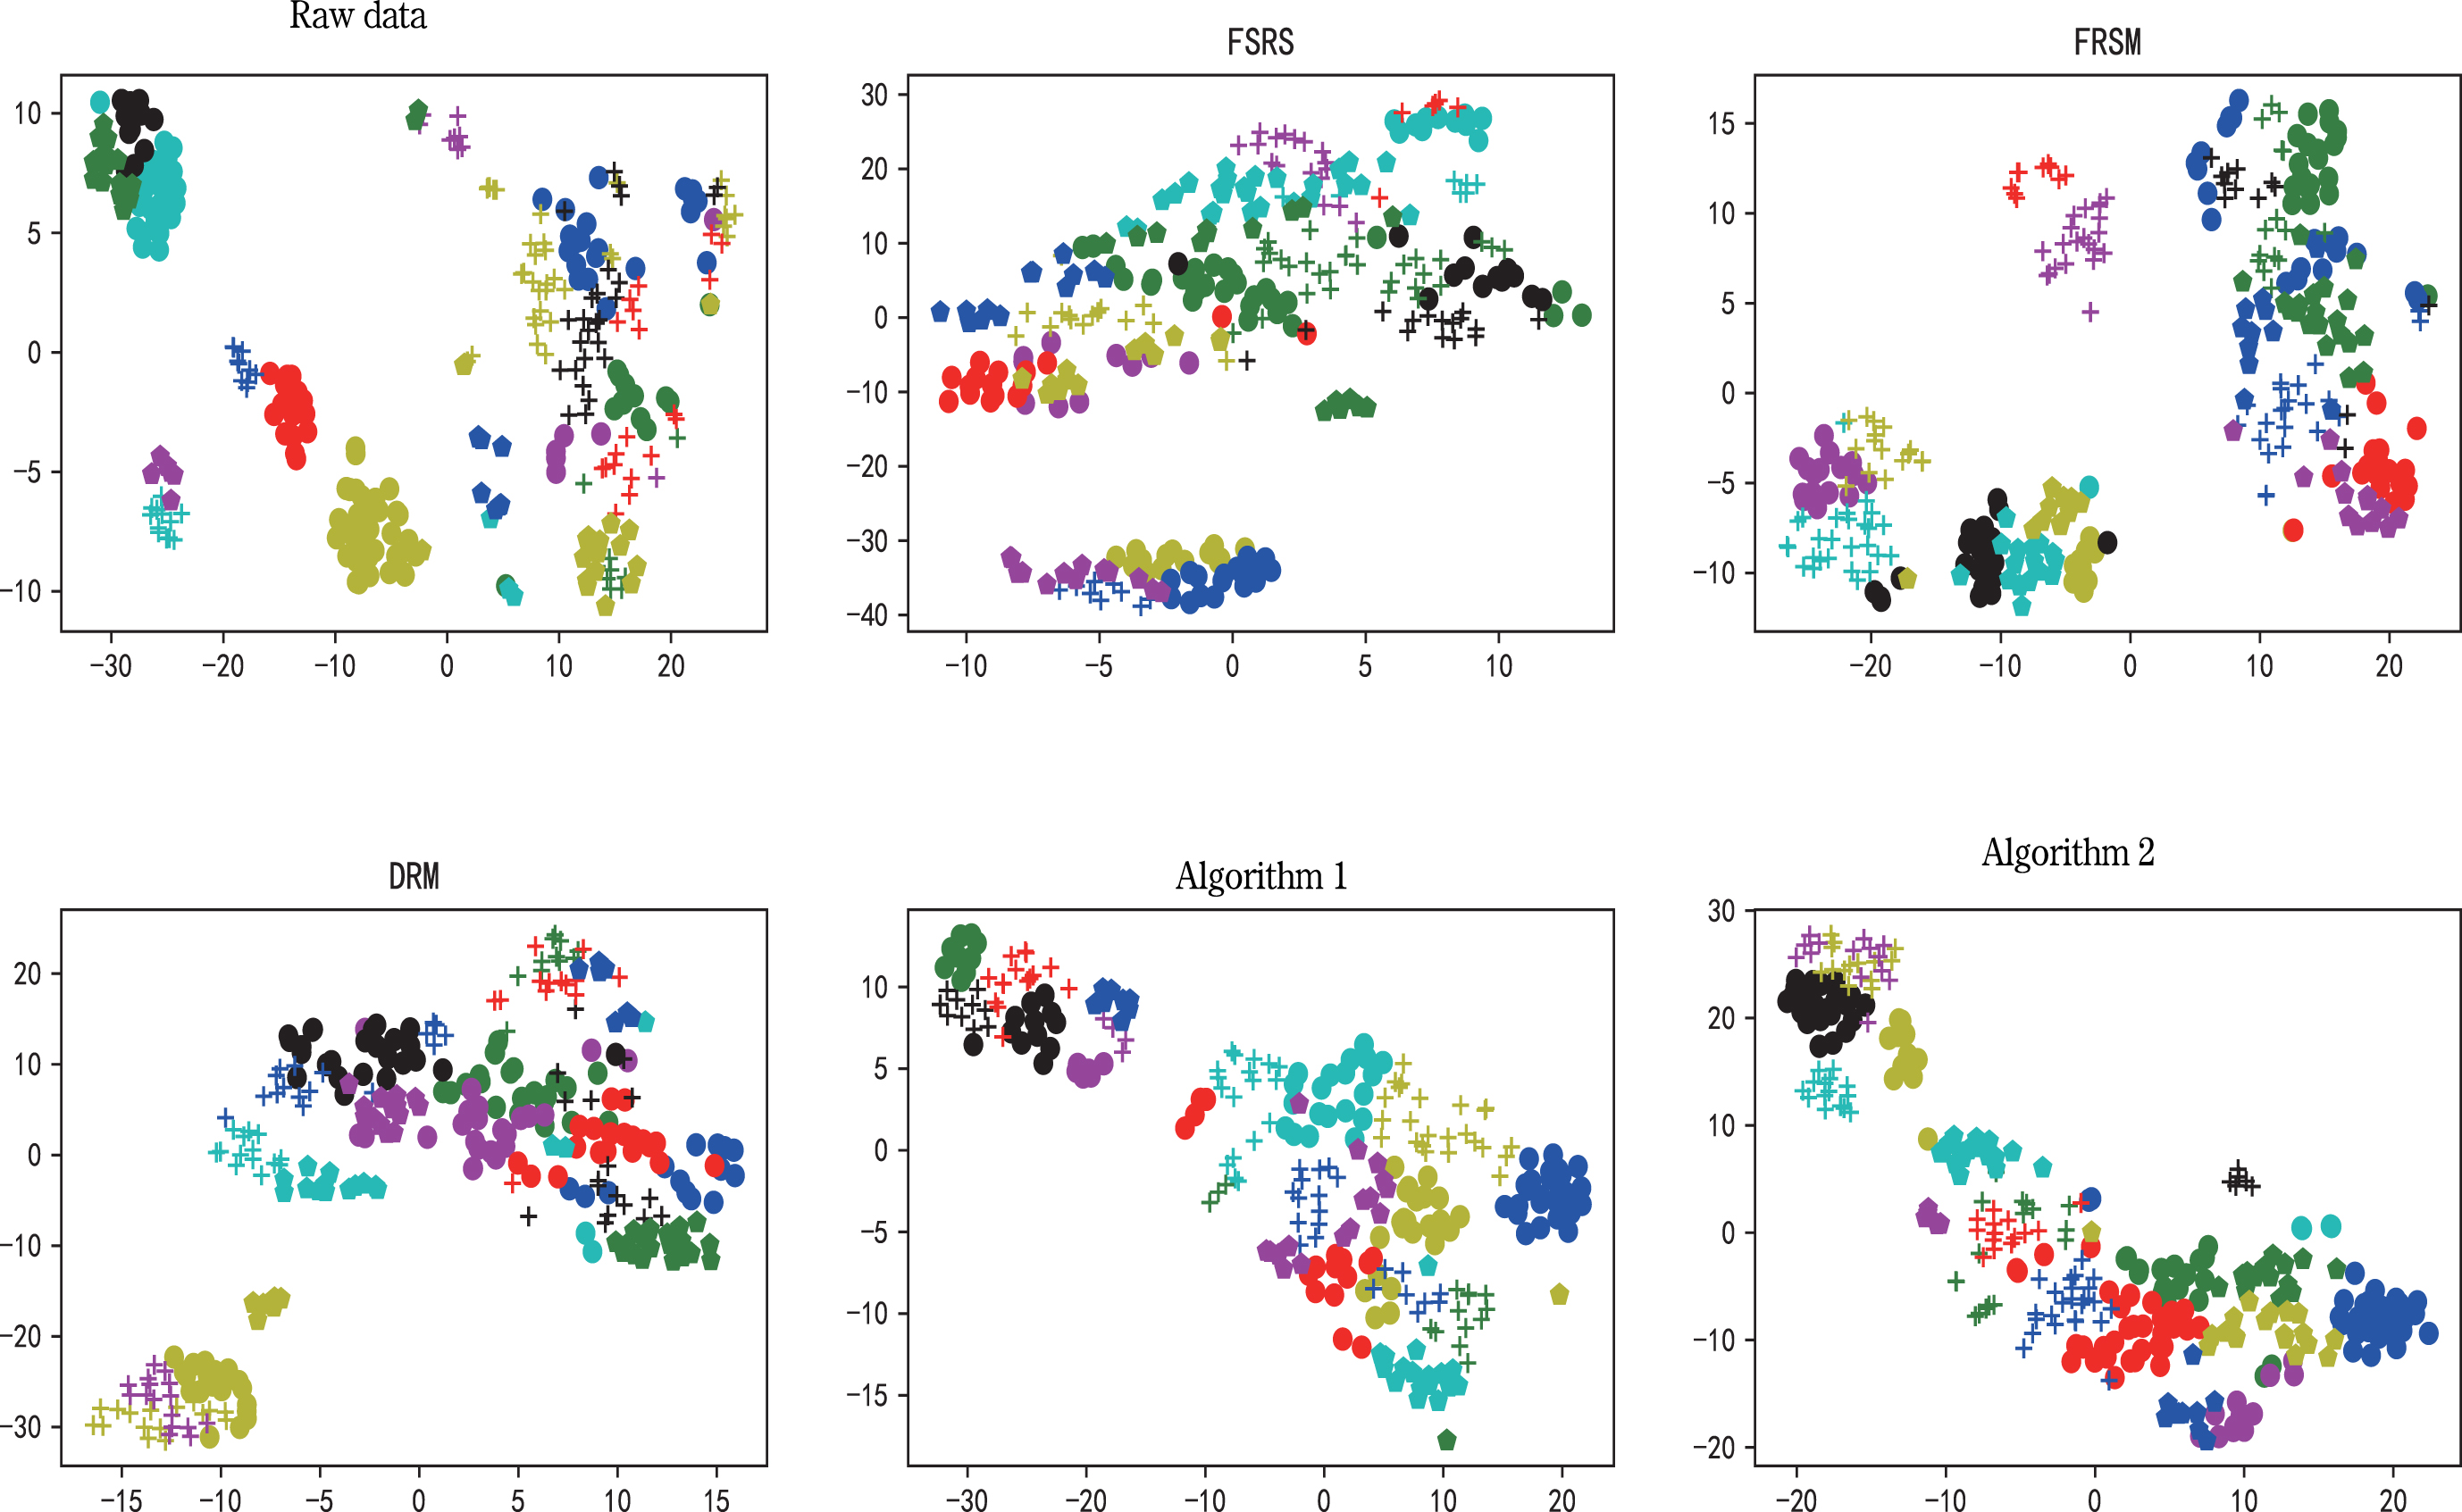
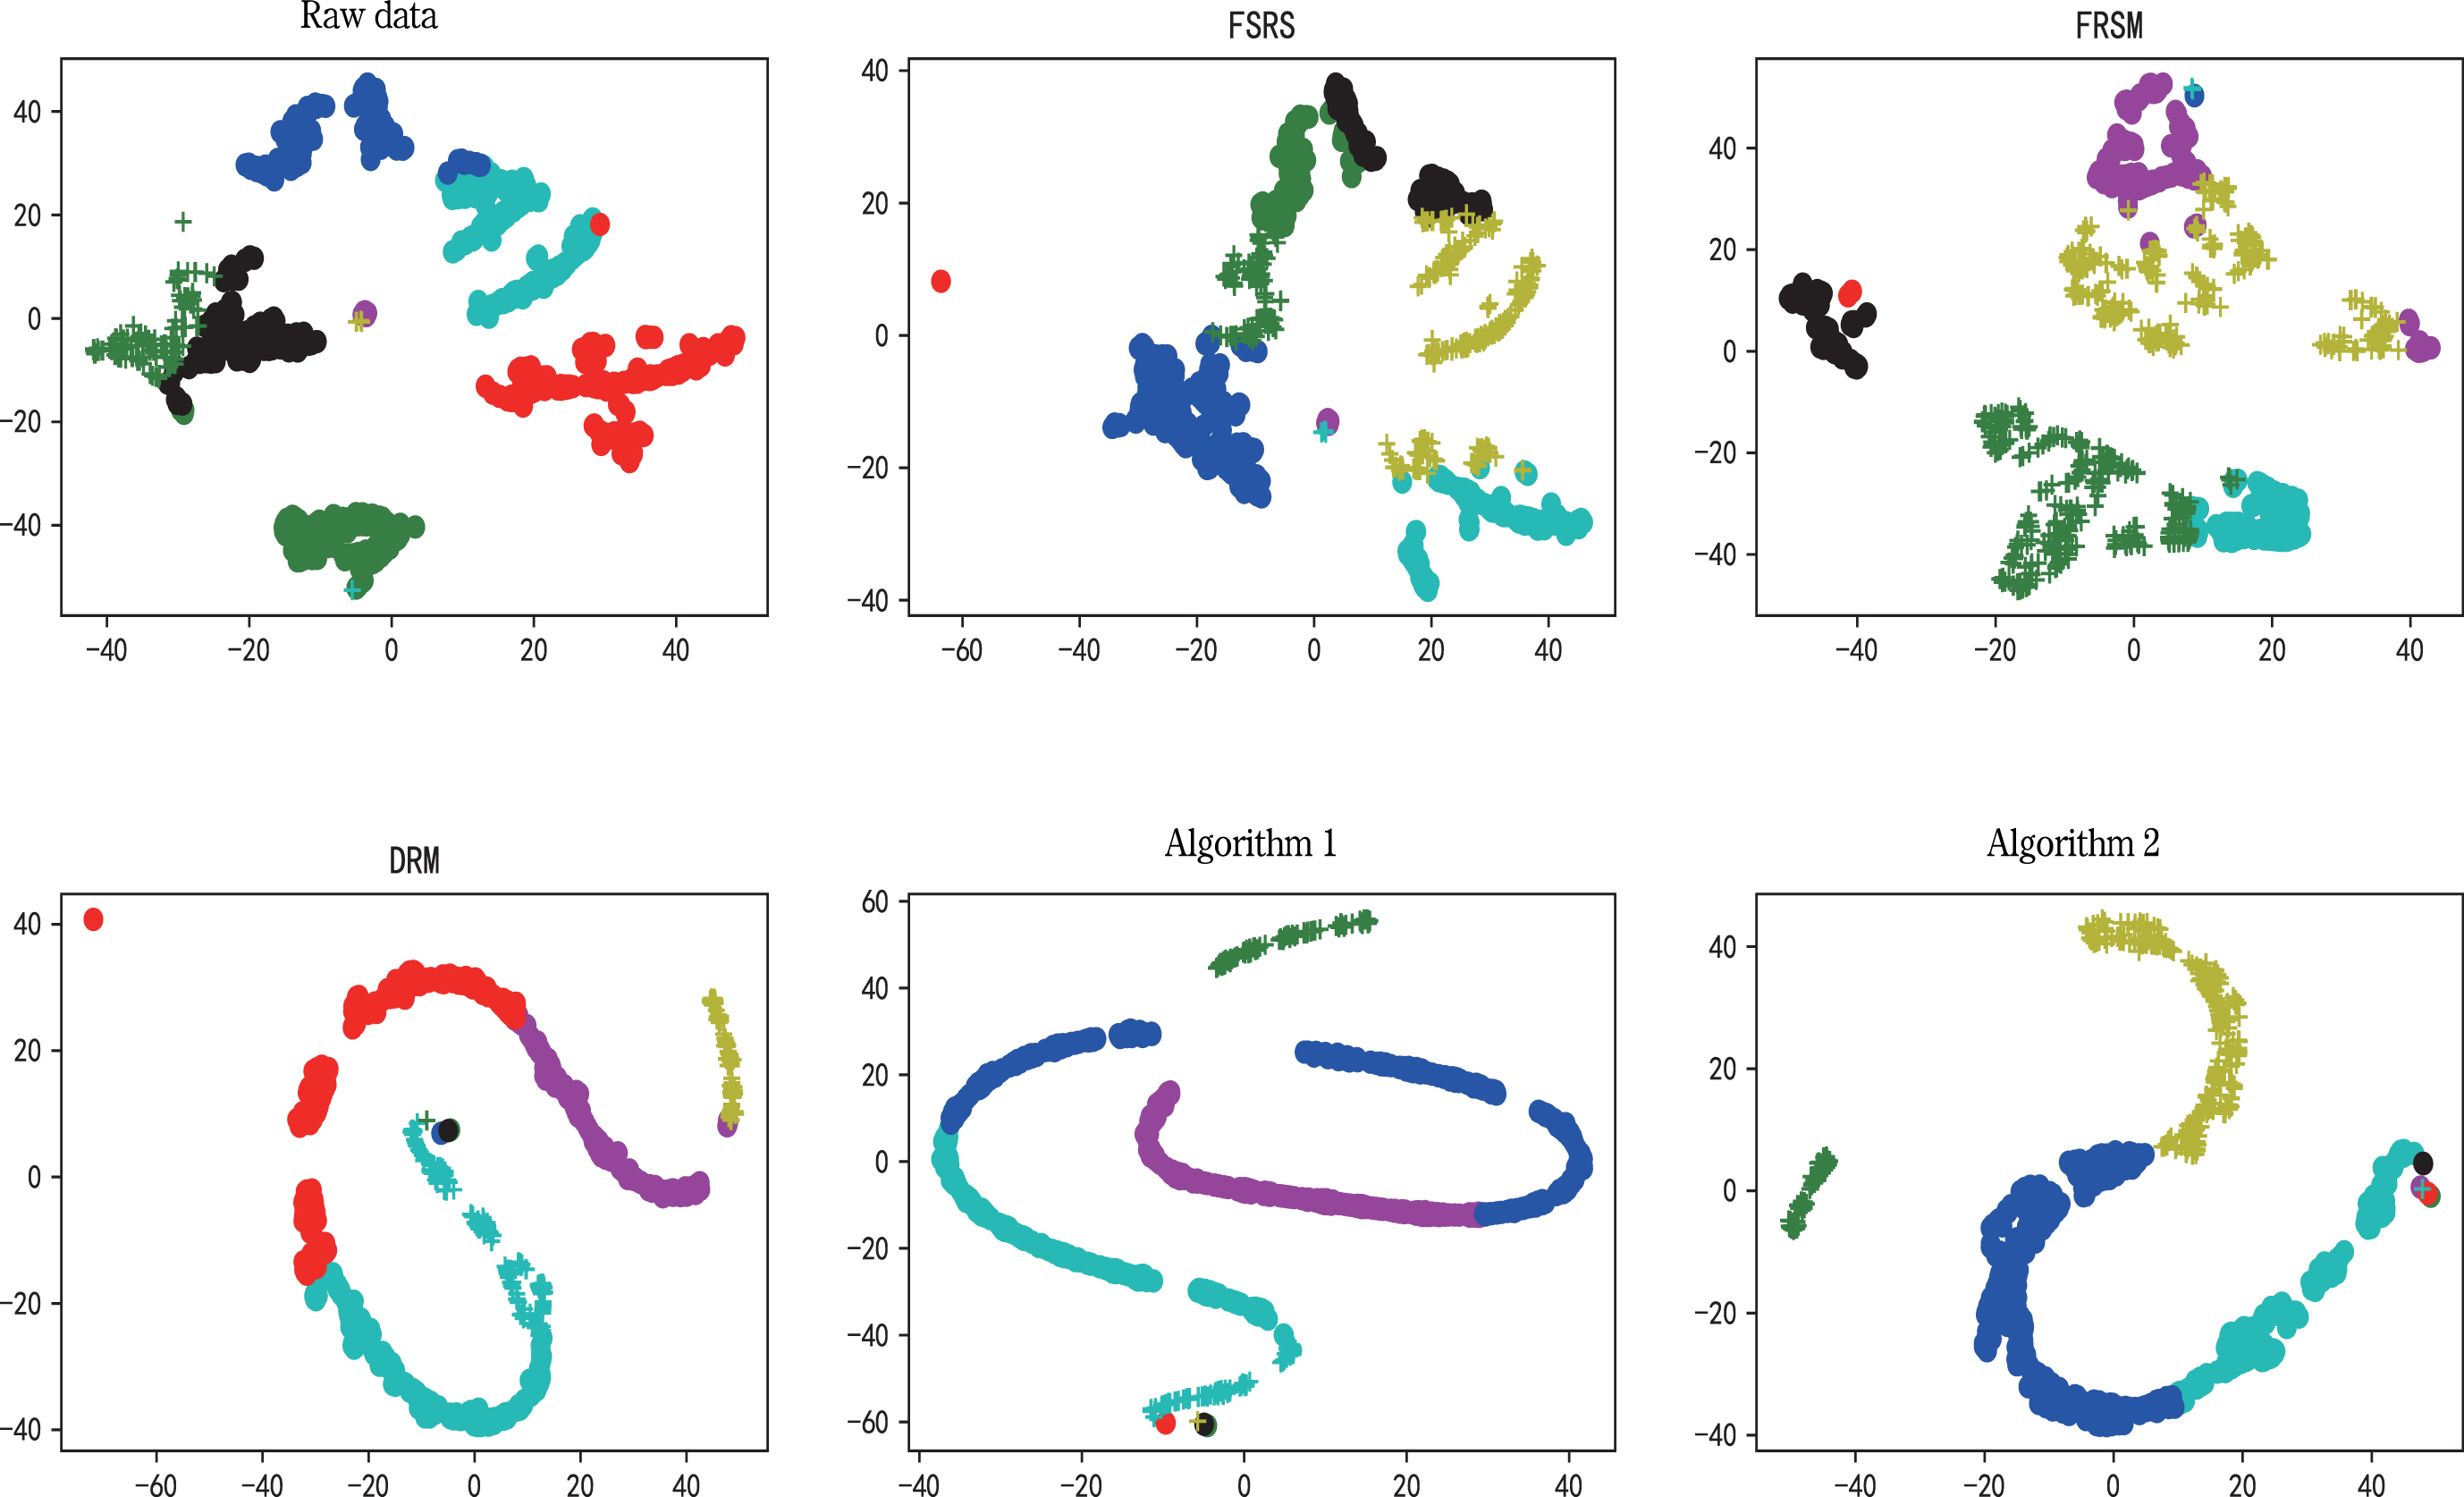
In order to evaluate the selected attributes, we use k-means clustering algorithm to cluster original data with reduced data, in which the missing values in datasets are filled with the data of adjacent positions. Then, silhouette coefficient [36] and calinski-harabasz index [12] are used to evaluate the clustering effect. The larger the coefficient of these two indicators is, the better the clustering effect is. To make the experiment more reasonable, we set the number of clusters to the number of categories inherent in the data. The clustering results are visualized by t-distributed stochastic neighbor embedding, as shown in Figs. 2–9.

The clustering results of Aa and the clustering results of the reducts obtained by the five algorithms on Aa.
The clustering results of Ac and the clustering results of the reducts obtained by the five algorithms on Ac.
The clustering results of De and the clustering results of the reducts obtained by the five algorithms on De.
The clustering results of He and the clustering results of the reducts obtained by the five algorithms on He.

The clustering results of Pc and the clustering results of the reducts obtained by the five algorithms on Pc.
The clustering results of Sl and the clustering results of the reducts obtained by the five algorithms on Sl.

The clustering results of Ob and the clustering results of the reducts obtained by the five algorithms on Ob.
The clustering results of Gw and the clustering results of the reducts obtained by the five algorithms on Gw.
The Nemenyi test results of silhouette coefficient.

The Nemenyi test results of calinski-harabasz index.
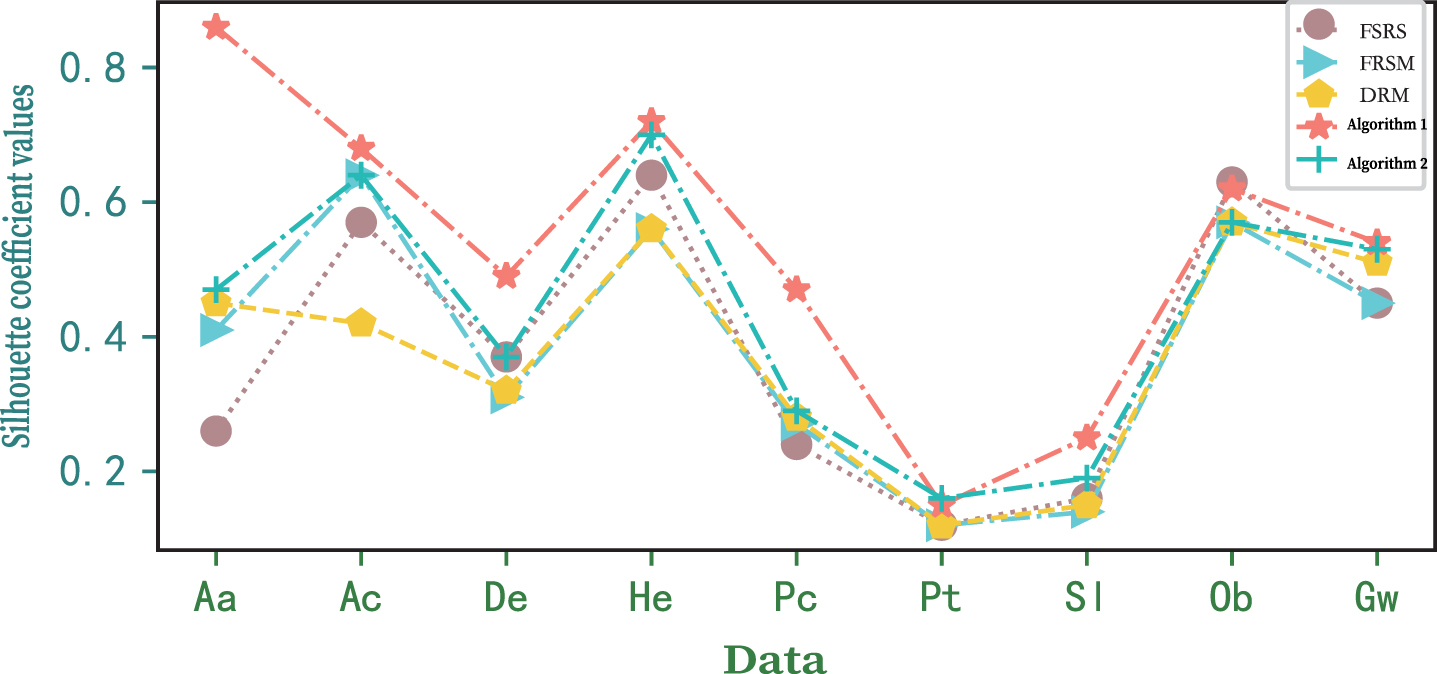
In order to make the comparison effect more intuitive, we give two index value graphs corresponding to the clustering results of the five algorithms, as shown in 6-7.
According to Table 6, as far as silhouette coefficient values are concerned, we can find the following results: Algorithm 1 is only lower than FSRS on Ob, but higher than the other four algorithms on other datasets. Algorithm 2 is higher than FSRS in all datasets except Ob and De. In addition, the silhouette coefficient exponents of Algorithm 2 on all datasets are not less than FRSM and DRM. In general, the average value of contour coefficients of Algorithm 1 is the highest, followed by Algorithm 2, and FSRS is the lowest.
The reduced silhouette coefficient values obtained by five algorithms
According to Table 7, in terms of calinski-harabasz index, we can find the following results: Algorithm 1 is only lower than FSRS in Ob, and significantly higher than the other four algorithms in other datasets. For FSRS, it outperforms Algorithm 2 only on dataset Ob and De, and Algorithm 2 outperforms it on all other datasets. Algorithm 2 is lower than FRSM and DRM on Pc and higher than FRSM on other datasets. In addition, Algorithm 2 is lower than DRM on Gw. In general, Algorithm 1 has the highest average contour coefficient, followed by DRM, and the lowest FSRS.
The reduced calinski-harabasz index obtained by five algorithms
To sum up, by combining Tables 5–7, the following conclusions can be drawn: for almost all datasets except Ob, Algorithm 1 has significantly better clustering effect than other algorithms. Except for Ob, De and Gw, for almost all datasets, Algorithm 2 obviously ranks second in clustering effect. Although Algorithm 1 is not a method to select the least features, it has the highest average evaluation among the two clustering evaluation indicators. For Algorithm 2, its clustering evaluation under most data is slightly lower than Algorithm 1, but obviously its clustering evaluation under most data is better than the other three algorithms. In short, Algorithm 1 can effectively reduce the attributes of data, and Algorithm 2 takes the second place.
Friedman test and Nemenyi test [20] are used to further evaluate whether there are significant differences between the five algorithms under the silhouette coefficient and calinski-harabasz index.
Friedman test is a nonparametric method that uses rank to test whether there are significant differences among multiple algorithms. It is defined as
When F F is greater than the threshold value of F α (k - 1, (k - 1) (N - 1)), it is considered that the performance of these algorithms is significantly different. Nemenyi test calculates the critical range CD α to determine which algorithm is better. When the average rank difference of the two algorithms reaches at least one critical distance, the performance of the two algorithms is significantly different.
Denotes
Next, we prove the statistical significance of these five algorithms by Friedman test and Nemenyi test.
First, we give the ranking of clustering evaluation of five algorithms on eight datasets (as shown in Tables 8, 9). Secondly, we use Friedman test to examine whether there is a significant difference in the classification ability of the five algorithms. For the five algorithms, under eight datasets, there are obviously k = 5, n = 8, k - 1 =4, (k - 1) (n - 1) =28, then F0.01 (4, 28) =2.157. Thus, the values of F F calculated from Tables 8, 9 are 2.32 and 9.35 respectively. Obviously, for the resulting F F has F F > F0.01 (4, 28).
Silhouette coefficient values sorting of five algorithms on 8 data
Calinski-harabasz index sorting of five algorithms on 8 data
Therefore, when α = 0.01, the performance of the five algorithms is significantly different. Next, in order to further illustrate the significant difference between the five algorithms, we performed Nemenyi test. For α = 0.01, we can easily calculate q α = 2.459 and CD α ≈ 1.705. When α = 0.01, the Nemenyi test results of these algorithms are shown in Figs. 12, 13, where the red line indicates that there is no significant difference between the algorithms.

The Nemenyi test results of silhouette coefficient.

The Nemenyi test results of calinski-harabasz index.
In this section, in order to highlight the innovation and contribution of this paper, several references that can process an ISVIS are discussed.
1) Wang et al. [42] researched the judgment theorem and discernibility matrix for attribute reduction in a set-valued decision IS on the views of α-level tolerance relations. On this basis, they also presented the attribute reduction method of set-valued decision data.
2) Liu et al. [31] proposed a new concept of dominance relation in a consistent set-valued IS and presented the problem of attribute reduction and judgment in this system. Therefore, they brought up a new method of attribute reduction in consistent set-valued decision data.
3) Huang et al. [25] studied a probabilistic set-valued IS by using probability distribution to describe set values. They used the Bhattacharyya distance to measure the similarity of objects and extended the variable precision rough set model by introducing a λ tolerance relationship.
4) Xie et al. [46] introduced the distance between the values of two information functions and applied it to obtain the information structures and uncertainty measure of an incomplete probability set-valued IS. They also perform a statistical analysis of the validity of the proposed measures.
5) Chen et al. [13] obtained the distance between two information values in incomplete set-valued information systems and put forward a fuzzy T cos -equivalence relation based on the Gaussian kernel. They discussed some tools for measuring uncertainty of incomplete set-valued information systems using Gaussian kernel and apply them to optimal selection of subsystems.
6) Singh et al. [37] introduced a new similarity degree between two information values and then proposed a fuzzy similarity-based rough set approach based on this fuzzy tolerance relation. In addition, attribute selection of a set-valued data based on degree of dependency is postulated.
7) The main contributions of this paper contain: (i) According to the available information of objects on an ISVIS, we define the probability distribution formula of objects in an ISVIS; (ii) We induce an FPIS based on an ISVIS; (iii) We study the problem of attribute reduction and judgment in an ISVIS; (iv) We propose two reduction algorithms bases on information granulation and information entropy; (v) We apply the obtained algorithms and three other algorithms in literature to 8 data of UCI, and obtain the reduction results of these data. (vi) We also analyze and verify those results by k-means clustering algorithm, Friedman test and Nemenyi test. The results show that the two algorithms are effective for an ISVIS.
Conclusions
In this paper, an ISVIS induces the FPIS, which consists of objects with probability distribution and fuzzy relations generated by objects about attributes. Based on this FPIS, attributes of an ISVIS have been classified according to importance. Based on information entropy and information granulation of an FPIS, attribute reduction in an ISVIS has been studied. Reduction algorithms based on information entropy and information granulation have been proposed. In order to see the rationality of the proposed algorithms, k-means clustering, Friedman test and Nemenyi test have been carried out. The limitation of this paper lies on the small experimental samples in the proposed algorithms. In future work, we will study the application of the proposed algorithms.
Footnotes
Acknowledgments
The authors would like to thank the editors and the anonymous reviewers for their valuable comments and suggestions, which have helped immensely in improving the quality of the paper. This work is supported by Natural Science Foundation of Guangxi Province (2021GXNSFAA220114).