
Abstract
The foundation of textile machinery digitization and intelligence is condition monitoring and identification. Online condition monitoring of looms is of great significance to ensure their long-term stable operation and improve their digital management level. However, the existing loom condition monitoring methods have problems such as insufficient depth of information mining, low condition recognition rate and poor system versatility. As a result, the loom on-board condition monitoring technology based on fuzzy rough set and improved DSmT theory is studied. To begin, we examine the loom operation mechanism, loom state characterization, and loom state feature data composition. Then, using the fuzzy rough set method, we analyze and make decisions on the loom state feature data, apply the theory of uncertainty and importance improvement DSmT fusion to solve the uncertainty problem of the rough set method’s decision rules, and build the loom state feature decision network on the embedded terminal using the decision rules. Meanwhile, to collect, communicate, display, and alarm loom characteristic data, this paper employs the STM32F407ZET6 microcontroller and designs a loom system status data collection platform with the AD7730 as the core, as well as tests loom status monitoring data collection and loom status data analysis and decision method based on this platform. The experimental findings show the usefulness of attribute data gathering as well as data analysis and decision-making processes. The technology enhances the precision of loom condition identification and decision making, as well as the safety and quality of manufacturing. It is critical for carrying out applications like as problem detection, remote monitoring, efficiency optimization, and intelligent weaving machine management.
Introduction
To ensure the long-term stable operation of rapier looms and raise their level of digital management, online condition monitoring is of utmost importance. But there are issues with the current loom condition monitoring techniques, including shallow information mining, a low rate of condition identification, and limited system adaptability. The best way to increase loom monitoring performance is to enhance loom characteristic data, research the integration of monitoring solutions, optimize monitoring algorithms, and ensure system dependability.
At present, condition monitoring technology has evolved from single source monitoring to multi-source data fusion monitoring and has become a popular topic in deep data mining research when paired with deep learning and other algorithms. After-the-fact maintenance, preventive planned maintenance, maintenance that takes economic objectives into account, and condition maintenance are the four stages of development that machinery and equipment maintenance technology has gone through [1]. The current domestic and international weaving machine overhaul solutions are the third generation of overhaul technology, which combines the knowledge of equipment operating efficiency, the experience of subject-matter experts, and partial sensor data. Picanol
BlueBox, a weaving machine electronic platform from Picanol in Belgium, combines an onboard diagnostic system, an intelligent productivity optimization system, a user interface, a device browser, and a remote fault diagnosis system for onboard condition monitoring of weaving machines. This enables intelligent management and online fault diagnosis of weaving machines [2]. P.P.J has designed a shuttle loom control module using peripheral interfaces and a microcontroller that monitors and measures warp and weft yarn errors [3]. D. Dong and Z. Shi achieved self-diagnosis of the loom system, automatic loading of operating parameters, and automatic shielding and recovery of loom interface failures using a redundant structure with dual buses and dual area processors [4]. The work mentioned above primarily focuses on controlling and monitoring weaving machines; however, the research is not focused on data fusion, feature extraction, or entire machine condition assessment of weaving machines. Additionally, because condition monitoring systems are very specialized, it is important to do focused research on condition monitoring of various manufacturing equipment. On the basis of perfecting the control system, it is necessary to analyze the mechanical structure of the loom equipment’s operation mechanism, ascertain the makeup of the loom condition feature data, analyze and process the data, and combine the data with fault diagnosis technology in order to better realize the monitoring of the loom machine condition.
The data of each loom structure is comparatively independent, and the complicated data information of the loom equipment is unknown. Multi-source data fusion technology must be implemented in order to acquire condition monitoring of the entire loom system and enhance the processing effect of multi-source uncertainty information. Methods for diagnosing information fusion faults frequently used include Bayesian networks, expert systems, fuzzy set theory, and D-S evidence theory. Han et al. [5] combined a dynamic fault tree model with an expert system knowledge base to form a new expert system knowledge for intelligent fault diagnosis of rapier looms. But too much redundant information of fault data in this process will affect the speed of fault diagnosis. Rough set theory can be used to reduce the complexity of fault diagnosis models by selecting useful fault attributes. When loom state data is processed by rough set theory, it produces more reduction results, and some researchers employ techniques such as deep learning to optimize the rough set attribute reduction process. M. Suo et al [6] for example, proposed the creation of a neighborhood decision theoretic rough set model (DNDTRS) employing a data-driven loss function matrix to improve attribute approximation results. In the processing of loom attribute data, our group [7] proposed utilizing a genetic algorithm to improve the simplification phase in the rough set approach, hence optimizing the simplification results and ultimately improving the classification accuracy of the system decision. However, loom state data are continuous in time, therefore classical rough sets must be discretized before attribute simplification. Because the discretized attribute values do not retain their differences in real values, this method may result in information loss in the original data [8].
In order to create the idea of fuzzy rough sets and define their associated properties, Dubois et al. [9] merged fuzzy sets with rough sets. Hybrid data attribute approximation has been used in conjunction with fuzzy rough sets. When dealing with fault diagnostic issues when the distinctions between several fault modes are ambiguous, fuzzy set theory might be applied. This paper proposes the DSmT (Dezert-SmarandacheTheory) uncertainty inference method [10, 11] improves DSmT fusion using uncertainty and importance to assign weight to indicators from subjective and objective considerations on the basis of dealing with evidence conflict problems. The problem of matching multiple rules with new objects in the decision-making process is addressed.
The main contributions of this paper are as follows: This paper analyzes the operation mechanism and the main structure of the loom. The characterization of the loom state and the composition of the loom state characteristics data are studied. Based on the above work, we have defined the loom airborne state monitoring system scheme. The classical rough set cannot handle the continuous data of the loom, and the discretization can lead to the loss of the original data. This paper proposed fuzzy rough set theory to handle uncertain and incomplete fault information. We establish the α information entropy uncertainty measure under the fuzzy similarity relationship, and use it as a heuristic information to make the fuzzy rough property reduction. In order to solve the problem of matching multiple rules for new objects emerging from rough set methods, the method of improving DSmT using uncertainty and importance is proposed. It can improve the reliability of decision making. This paper used STM32F407ZET6 microcontroller to design the loom system status monitoring platform with AD7730 as the core. It can realize the acquisition, communication, display and alarm of the loom feature data.
Other parts of this article are structured as follows: The second part analyzes the operation mechanism of loom and determines the characteristic data of loom state; The third part analyzes the loom monitoring data fusion and decision making based on fuzzy rough set theory; The fourth part introduces the construction of the airborne state monitoring platform, mainly the hardware circuit and human-computer interaction platform; The fifth part tests the loom airborne state monitoring based on the theory; The sixth part makes a summary of the full text. Table 1 shows the symbol definition.
Symbol definition
Symbol definition
The weaving machine system is a highly complex precision manufacturing equipment with numerous data collection and analysis possibilities for each mechanism. In order to determine an effective data acquisition scheme for loom condition characteristics and to identify scientifically feasible data acquisition points for the loom, consideration of the loom’s operating mechanism and objective requirements is essential.
Analysis of the main structure of the rapier loom
The rapier weaving machine is used to complete the horizontal and vertical interlacing of warp and weft yarns by means of transverse and longitudinal movements, thus forming a complete fabric. The main mechanical structure of the rapier loom is divided according to its relative independence into five main mechanisms: opening, weft drawing, weft beating, warp feeding and winding [12]. As is shown in Fig. 1, the main shaft of rapier weaving machine drives the three major mechanisms of weft guiding, weft beating and weft opening through the conjugate cam to do periodic reciprocating motion; the winding mechanism takes the weaving machine main shaft running speed as the reference and runs at a certain speed; the warp feeding mechanism takes the warp yarn tension as the reference and maintains the stability of the warp yarn tension together with the winding mechanism under the cooperation of the tension roller.
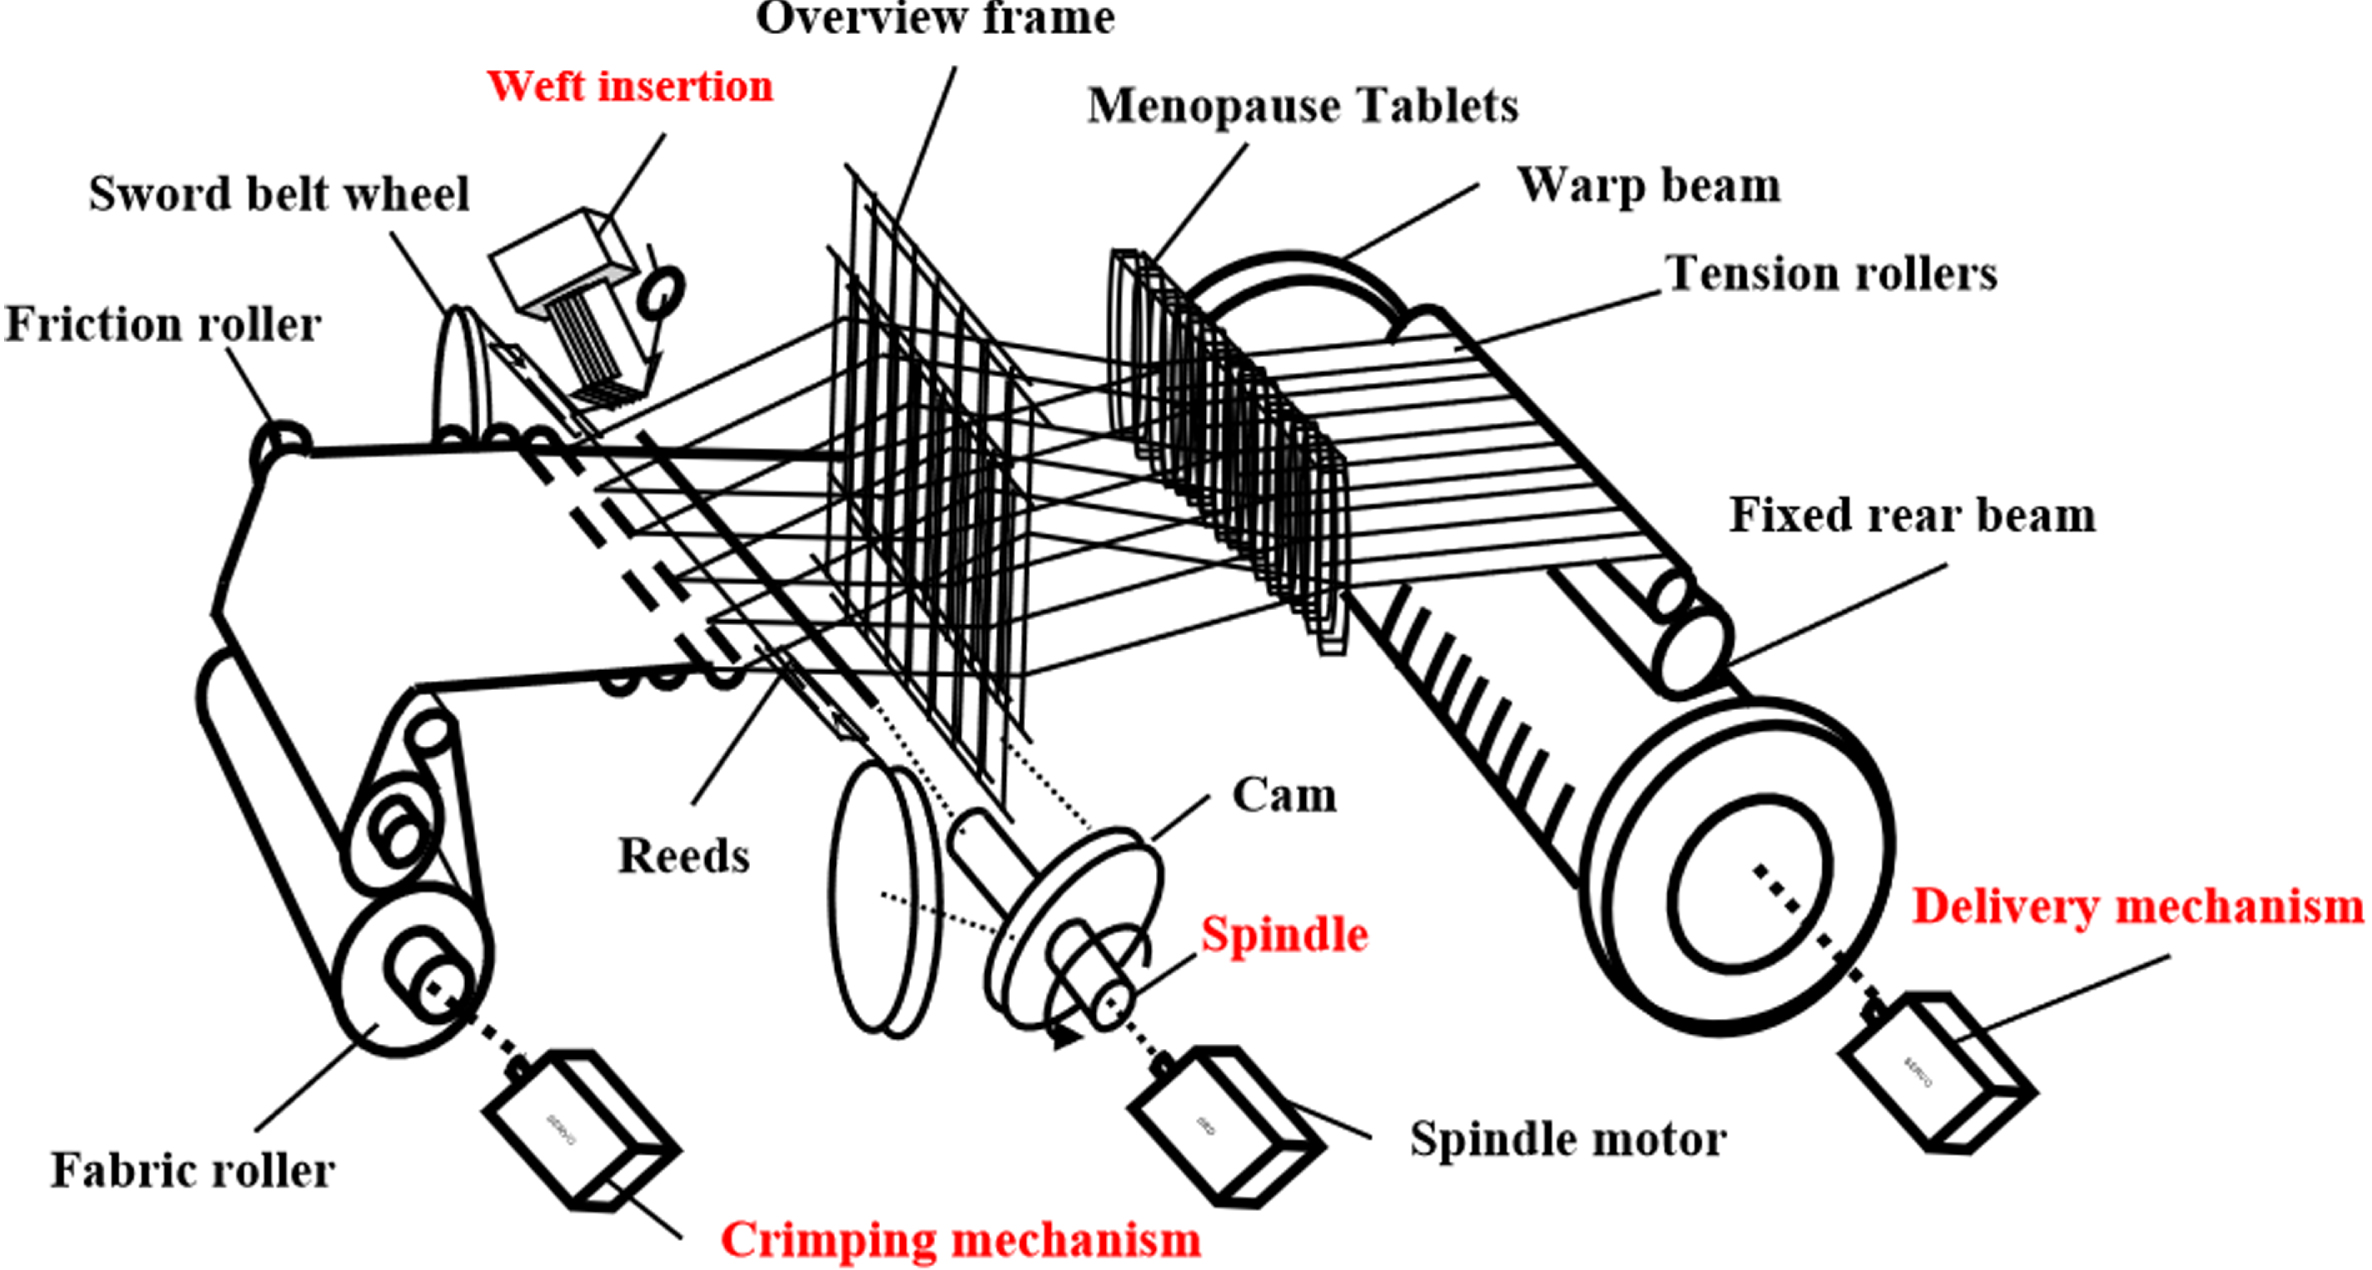
Structural diagram of rapier loom.
The main shaft of the rapier loom is the core of the loom’s operation, and all loom components are controlled around the main shaft movement. According to the relative independence, the mechanical system of the weaving machine can be divided into two major parts: the main body of the weaving machine directly connected with the mechanical drive of the main shaft and the feeding system consisting of the warp winding mechanism. Weaving machine mechanical body is usually mechanical structure failure, its condition monitoring can be completed by vibration detection, oil sample analysis and other methods; the core of the feeding system is the warp feeding servo and winding servo, its performance is usually evaluated based on the warp tension fluctuation parameters.
Weaving machine spindle running state characteristics are the core data source for weaving machine condition monitoring, and vibration monitoring is the classical method for its condition identification. For the condition of electrical systems and deep non-fatal system defects, specialized measurements and assessments of specific parameters are required. Therefore, the study of the characteristics of each subsystem of the weaving machine and the selection of a representative measurement scheme of the characteristic data is the key to determine the performance of the condition monitoring system of the weaving machine [13]. In this paper, weaving machine condition monitoring data is divided into four categories: weaving machine process parameters, weaving machine vibration data, system operation data and supplementary measurement data. Weaving machine process parameters including, inter alia, weaving machine process progress node data, weaving machine weaving process required measurement data and weaving machine weaving process formation data. In addition, there are data that are important for weaving machine condition assessment but are not used in the weaving machine process control system. For example, in the control system, a drive failure simply returns its fault signal, whereas more detailed fault information is required to monitor the weaving machine online and analyze the cause of the drive failure. The supplementary measurement data scheme is shown in Table 2.
Data acquisition scheme of rapier loom condition monitoring characteristics
Data acquisition scheme of rapier loom condition monitoring characteristics
The loom machine condition monitoring platform can be divided into six levels: data acquisition, data processing, data integration and synchronization, data reasoning and decision making, cloud data fusion platform, and data application [14–18]. In order to overcome the defects of the existing loom condition monitoring scheme and to take into account the sharing, real-time and continuous optimization of loom condition monitoring data, the loom onboard condition monitoring system system is designed as shown in Fig. 2.

Scheme of loom airborne condition monitoring system.
The first stage of the system realizes the acquisition of weaving machine process parameters, vibration data, system operation data and supplementary measurement data. The second stage of the system is the data processing stage, whose task is to solve the data inconsistency problem, the noisy data problem, the missing value problem and to complete the time-frequency domain analysis. The third level of the system is the data integration and synchronization level, whose core tasks are to resolve temporal differences in data formation, ensure data integrity, and integrate interrelated distributed heterogeneous data sources together to form a data set that is transparent to users. The fourth level is data inference and decision making, whose task is to realize the mapping between loom feature data and state decisions. The fifth level is the cloud data fusion level, which aims to complete loom state reasoning and decision making in the cloud using loom shared data and product tracking data, and to transfer the decision network features to the loom on-board state monitoring platform. The sixth level is the data application level, the task of which is to realize the display and application of loom monitoring conclusions.
The loom onboard condition monitoring system can work in network mode and offline mode. In the network mode, the real-time data from the embedded data acquisition and pre-processing module are integrated and synchronized to form a sample data set for loom condition monitoring, which is transmitted to the cloud data fusion platform via the data sharing and transmission module. At the same time, the sample data set, together with loom shared data and fabric feedback data, provides training samples for the data fusion and feature extraction module, and transmits the decision results back to the loom data sharing and transmission section to achieve continuous optimization of loom condition monitoring performance. In offline mode, the loom condition monitoring terminal cannot be connected to the cloud data fusion platform. At this time, the on-board condition monitoring system will use the latest decision result to identify the real-time data set from the embedded data collection and pre-processing system of the loom.
Fuzzy rough set theory
Rough set theory was first proposed by Pawlak in 1982. This theory provides a rigorous set of mathematical tools for classification problems with noisy, imprecise or incomplete data. The characteristic of rough set theory is that it does not rely on a priori information. It makes full use of known information and discovers the basic knowledge and rules of the target problem from the sample data while keeping the classification ability of the information system unchanged [19]. Classical rough set theory can only effectively deal with nominal or discrete data. It requires discretization process before attribute reduction for continuous type data. This process leads to information loss in the original attribute data and lacks the ability to adapt to noisy data, which has limitations [20]. Therefore, we combine rough sets and fuzzy sets, and use fuzzy similar relations instead of equivalence relations in classical rough sets for classification, which can effectively analyze and deal with attributes with fuzziness and continuity, and has strong applicability.
If R (x, x) = 1 (∀ x ∈ U), R is self-inverse. If R (x, y) = R (y, x) (∀ x, y ∈ U), R is symmetric. If R (x, z) ⩾ R (x, y) ∧ R (y, z) (∀ x, y, z ∈ U), R is delivered.
If R satisfies the converse, symmetry and transfer relations, R is called a fuzzy equivalence relation on U, which can be dynamically divided using the fuzzy equivalence relation.
U/IND (D) ={ D1D2 ⋯ D n } represents the classical equivalence class divided by the decision attributes. It can also be expressed as a U/D. Where, D j ∈ U/IND (D) is called decision class.
Where, |X| = ∑x∈UX (x), it denotes the misclassification rate of the fuzzy set R A (x) with respect to the fuzzy set X.
The positive, negative, and boundary domain of Dk are respectively:
The top and bottom of the decision attribute D is approximately:
The positive domain of the decision table is:
In the information system IS=<U, A, V, f>, if the indistinguishability relation induced by attribute set A is equal to the indistinguishability relation induced by its subset, i.e., IND(A)=IND(A-{a}), it means that attribute a is a redundant attribute of attribute set A. The process of eliminating redundant attributes in the attribute set is called knowledge parsimony. The simplification of the attributes of an information system can maintain both the classification capability of the information system. It can also simplify the representation of the system and optimize the computing performance of the system. An information system can have multiple attribute approximations and the intersection of all the approximations is called the kernel of the information system [21]. In this paper, we introduce α-information entropy into fuzzy rough set, establish α-information entropy uncertainty measure under fuzzy similarity relationship, and use it as heuristic information for attribute reduction of fuzzy rough.
In an on-board condition monitoring system for rapier loom, the condition characteristic attributes determined by theoretical analysis and expert experience are not equally important. Some attributes contribute little to the weaving machine condition decision and can even lead to mis-determination of the condition. In the information system IS=<U, A, V, f>, the information entropy of α under the fuzzy relation R for the set U is defined as formula 3.
The information system (U, A, V, f), B ⊆ A, The importance SIG (a, B) of ∀a ∈ B is defined as formula 4.
The decision making system (U, A, V, f), A = C ∪ d, C is the set of conditional attributes, d is the decision attribute. B ⊆ A, ∀a ∈ B for the decision attribute d the importance SIG is defined as formula 5.
As shown in Fig. 3, the above two attribute importance degrees are used as heuristic information to construct an information entropy-based fuzzy rough set reduction method (α-FRS), including two parts of reduction as well as relative reduction algorithm. As shown in Fig. 3 is the fuzzy rough mixed attribute reduction algorithm based on a information entropy. As shown in Fig. 4 is a fuzzy rough mixed attribute relative approximation algorithm based on a information entropy.

Fuzzy rough mixed attribute reduction algorithm based on ∂ information entropy.

Relative Approximation Algorithm for Fuzzy Rough Mixed Attributes Based on ∂ Information Entropy.
We assume that the loom state feature monitoring system can be expressed as IS=<U, A, V, f>. Let us take the problem of identifying the degree of spindle wear as an example. Let attribute a1 denote the degree of loom spindle wear, and its value is V1={severe, slight, normal}. Attribute a2 indicates the measured weft tension for a certain weaving cycle, divided into five levels V1={2, 1, 0, -1, -2}. Attribute a3 indicates the weaving performance of the loom at a certain stage and classifies the weaving performance of the loom into four categories V1={excellent, good, medium, poor}. Attributes a4 and a5 are the other parameter attributes of the loom. The decision table is constructed as Table 3.
An example of decision representation in spindle wear identification
For the problem of loom parameter monitoring, a decision table for loom weft tension monitoring is constructed as Table 4.
An example of decision-making in weft tension parameter monitoring
In the comprehensive evaluation problem, the decision table for the evaluation of loom efficiency is constructed as Table 5.
An example of decision representation in comprehensive efficiency evaluation
For identification problems, its decision attributes are usually quantities that cannot be measured by sensors. Its data samples need to be obtained by destructive experiments. For the parameter monitoring problem, for the core key parameters in the application, their values can be obtained by measurement. To guarantee the reliability of the data and to cope with missing data, it is necessary to carry out inference using system-related information. In the comprehensive evaluation problem, the results of the decision attributes can be obtained by human intervention. Because of its high time cost, reasoning about the values of its attributes through known correlation information is required.
The fuzzy rough attribute approximation based on α-information entropy is now applied to decision Table 2. The simplification process is shown in Fig. 4, with the following steps:
Step 1: ∀a ∈ C, The fuzzy similarity relation M (R) = (r ij ) n×n is calculated.
Step 2: Initialization of approximate sets, reduct =∅.
Step 3: ∀a ∈ C - reduct, The importance of each attribute a relative to the decision attribute is calculated. S i = SIG (a, C - reduct, d).
Step 4: The attribute with the highest attribute importance is selected,
Step 5: If SIG (a, C - reduct, d) > δ (δ is a very small value), the property is added to the approximate set, i.e. a → reduct, and return to Step 3.
The result of the approximation is: Set of attributes C
a
11={ a3, a4, a5}; Set of attributes C
a
12={a2, a4}; Set of attributes C
a
13={a2, a3, a5};
Similarly, the reduction result of decision Table 3 is: Set of attributes C
a
21={ a1, a3, a5}; Set of attributes C
a
22={ a1, a4}; Set of attributes C
a
23={ a3, a4, a5};
The reduction result of decision Table 4 is: Set of attributes C
a
31={ a1, a2, a5}; Set of attributes C
a
32={ a2, a4};
After attribute reduction, the decision rules are constructed by reducing attribute sets and attribute values [22]. For information system IS=<U, C, D, V, f>, let its attribute reduction result B be the proper subset of attribute set C, U/B means to classify U according to set B, U/D means to classify U according to set D, X belongs to U/B and Y belongs to U/D, then the decision rules of this information system are expressed as follows formula 6.
Where DES(X,B) is called the rule antecedent, which is the conditional part of the rule; DES(Y,D), called the rule successor, is the decision-making part of the rule. DES(X,B) is defined as formula 7.
Where a = f(x,a) represents the basic elements of class description.
Because of the inconsistency and uncertainty of data, there may be two relations between the antecedent and the consequent of rules: certainty and possibility. According to the generalization decision theory, the objects with the same generalization decision value in universe U are divided into the same set K. If the generalization decision |δ
B
(x)|>1 of a subset of objects K, it means that all objects in K can be accurately classified at the knowledge level given by B; If the generalization decision |δ
B
(x)|>1of the subset of objects K, it means that all objects in K cannot be accurately classified at the knowledge level given by B. The generalization decision of object X in U relative to attribute set B is defined as formula 7.
Where v i is the value of decision attribute. The minimum rule set extraction algorithm of rough set method can flow as shown in Fig. 5.
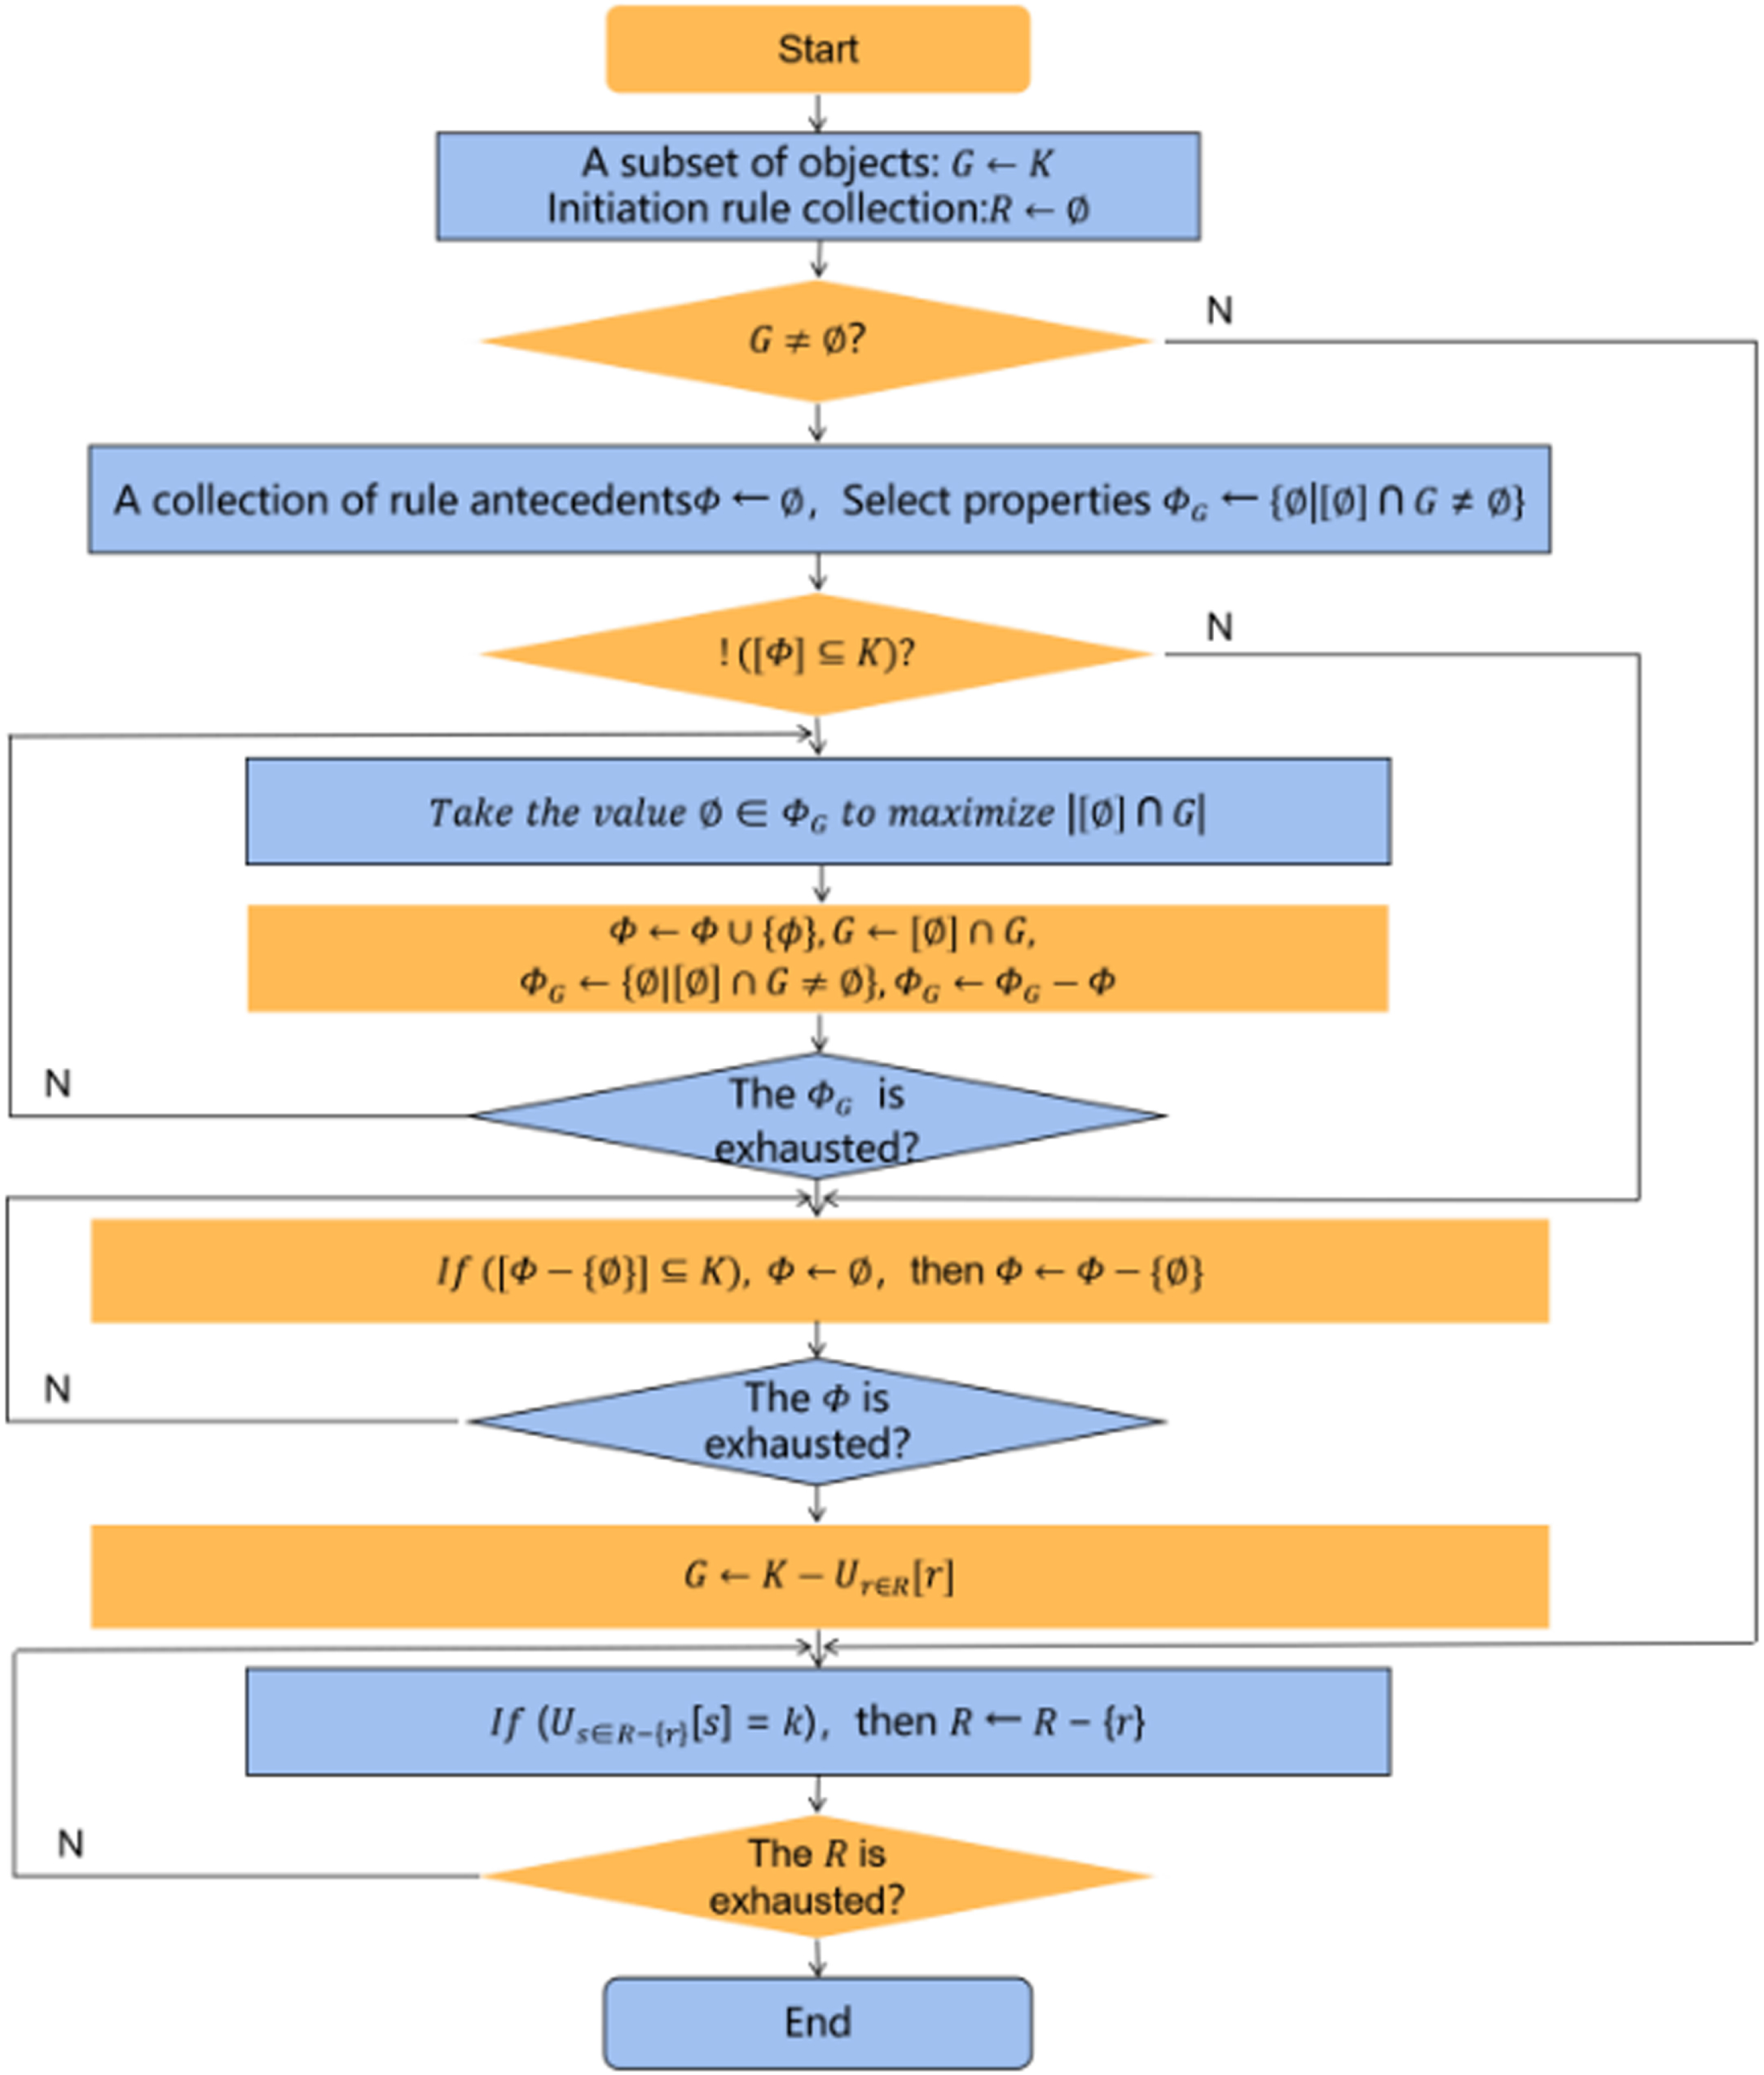
Rough set rule extraction process based on attribute importance evaluation.
Once an information system has obtained reduction, it can build decision rules by attributes and their values on the basis of reduced attribute sets. Usually, different rule extraction algorithms have different operation results for the same information system. In order to reduce the structural risk of rough set method and improve the implementation efficiency of the algorithm, rule extraction algorithms usually seek to obtain less rule complexity. The experiment shows that the minimum number of rules is the best index to measure the real complexity of rough set method. Therefore, in order to obtain the best classification accuracy, a smaller set of rules should be ensured when extracting decision rules.
Minimum rule set extraction in spindle wear identification
Minimum rule set extraction in weft tension parameter monitoring
Minimum rule set extraction in comprehensive efficiency evaluation
Rules extracted from rough sets may appear in three situations: (1)The new object only match one rule; (2) The new object matches multiple rules; (3) The new object does not match any rules. Case (1) can directly determine the value of decision attribute, and case (3) can be converted into case (1) or (2) usually by partial rule matching method. To deal with the uncertainty of system rule matching, this paper introduces DSmT (Dezert-SmarandacheTheory) uncertainty reasoning method [23, 24], and improves DSmT fusion by using uncertainty and importance. On the basis of dealing with evidence conflicts, the indexes are weighted from subjective and objective considerations.
DSmT fusion rule
The superpower set DU generated by the union and intersection of elements in the recognition frame satisfies the following conditions:
φ, θ1, θ2, . . . , θn ∈ DU If A, B∈DU, A ∩ B ∈ DU, A ∪ B ∈ DU In addition to the above two propositions, no other propositions belong to DU.
Then m(A) is called the generalized basic reliability assignment of A.
Where, mM f (U) (φ) = 0.
However, this classical combination rule is the information fusion of evidence. It does not consider the trust of different evidence and ignores a part of the prior information. The fusion results obtained with this classical DSm are not accurate enough.
DSmT fusion rule
We assume that loom condition monitoring has n matching rules and m decision attribute values, and define the uncertainty of the value of the jth decision attribute as follows formula 9.
Where, k = 1/lnn,
From the perspective of the monitoring data, the uncertainty reflects the relative magnitude of the effective information volume. It is not reasonable to calculate the weight of the evaluation index by only using the uncertainty of the evaluation index. Because calculated from the evaluation index, the system health status level needs to consider many factors including structural function. Therefore, all aspects of the system factors need to be considered comprehensively. The concept of assessing the importance of the index is introduced below to improve DSmT based on uncertainty.
Under the hierarchical model of decision attribute value, the comparison matrix
By adding the elements in D in columns, the importance of each attribute decision value relative to the new object matching rule can be obtained as formula 11.
Let the uncertainty of our new object matching rule be Ijand the importance be Zj, then the weight of DSmT fusion is obtaining as formula 12.
Where
Then the improved DSmT fusion formula considering uncertainty and importance is obtaining as formula 13.
Where m’(.)=W(IZ) m(.)
From formula 11 and formula 12, it can be concluded that if the possible attribute decision values are determined by uncertainty and importance, the greater the weight, the greater the proportion of them in DSmT fusion decision. For the weighted fusion of more than two rules, multiple information sources can be combined pairwise by the formula 13.
In order to ensure the reliability of the data acquisition and reasoning platform of loom condition monitoring system, the experimental platform for loom condition monitoring is constructed from two issues: hardware system and HMI man-machine interaction.
Parameter index of airborne condition monitoring hardware of loom
At present, the maximum display speed of narrow rapier loom can reach 850r/min, and the weft insertion rate is about 1500m/min. Therefore, the fundamental frequency signal of loom warp tension is within 15HZ. According to Nyquist’s sampling law, the sampling frequency of warp tension should be at least greater than 30HZ in order to make the fitting curve of warp tension undistorted. Meanwhile, according to the technological requirements, the measuring range of warp tension of rapier loom should be 850KG, the resolution should be greater than 0.3KG, and the sampling error should be less than 0.5%.
In order to obtain reliable loom vibration monitoring signal, the indexes of vibration signal sampling circuit, such as sampling interval, sampling length and frequency resolution, should be specified. After consulting relevant information, the highest frequency component of loom vibration signal is about 2.0KHZ. According to the sampling law, to avoid frequency mixing, the minimum sampling frequency of vibration signal is 4.0KHZ, which is generally 5.12 K ∼ 8.0 kHz. In addition to the sampling frequency, in order to ensure that the sampling results can reflect the whole picture of the signal and take into account the calculation amount of the system, after comprehensive consideration, the number of sampling points is 800 and the frequency resolution is 10HZ.
Hardware circuit of loom condition monitoring platform
Tension detection circuit
Tension control is an important link in loom control process, and the performance of warp tension control is a prerequisite to guarantee fabric quality. In the loom control system, the loom warp tension is sampled at a specific process angle. In an ideal situation, within the angle of warp tension collection technology, the loom control system does not perform any operation, and the warp tension is basically constant. However, due to the measurement error of loom spindle angle and the difference of angle interval selection of warp tension sampling process, this loom warp tension sampling scheme based on weaving process angle cannot obtain stable sampling value of loom warp tension. In order to select the angle interval of loom warp tension collection technology, and adjust the sampling points of loom tension online according to the actual weaving situation, the evaluation basis of loom warp tension control performance is provided. In the airborne condition monitoring system of loom, it is necessary to track the warp tension in full cycle.
As shown in Fig. 6, the sampling and conditioning circuit of loom warp tension consists of I/V conversion, RC low-pass filtering, voltage follower and input protection circuit. The warp tension sensor is a differential full-bridge measuring circuit, which outputs a differential voltage signal, which is converted into a standard current signal of 4∼20mA by the transmission circuit of the tension sensor. The warp tension sampling and conditioning circuit converts the standard current signal into a voltage signal of 0∼3.3V, which is sampled by the on-chip ADC peripheral of STM32F407ZET6 microcontroller. The built-in ADC of STM32 MCU is a configurable 6-bit, 8-bit, 10-bit or 12-bit successive approximation ADC. In the continuous conversion mode, with DMA peripherals, the analog-to-digital sampling task can be completed with minimum CPU consumption.
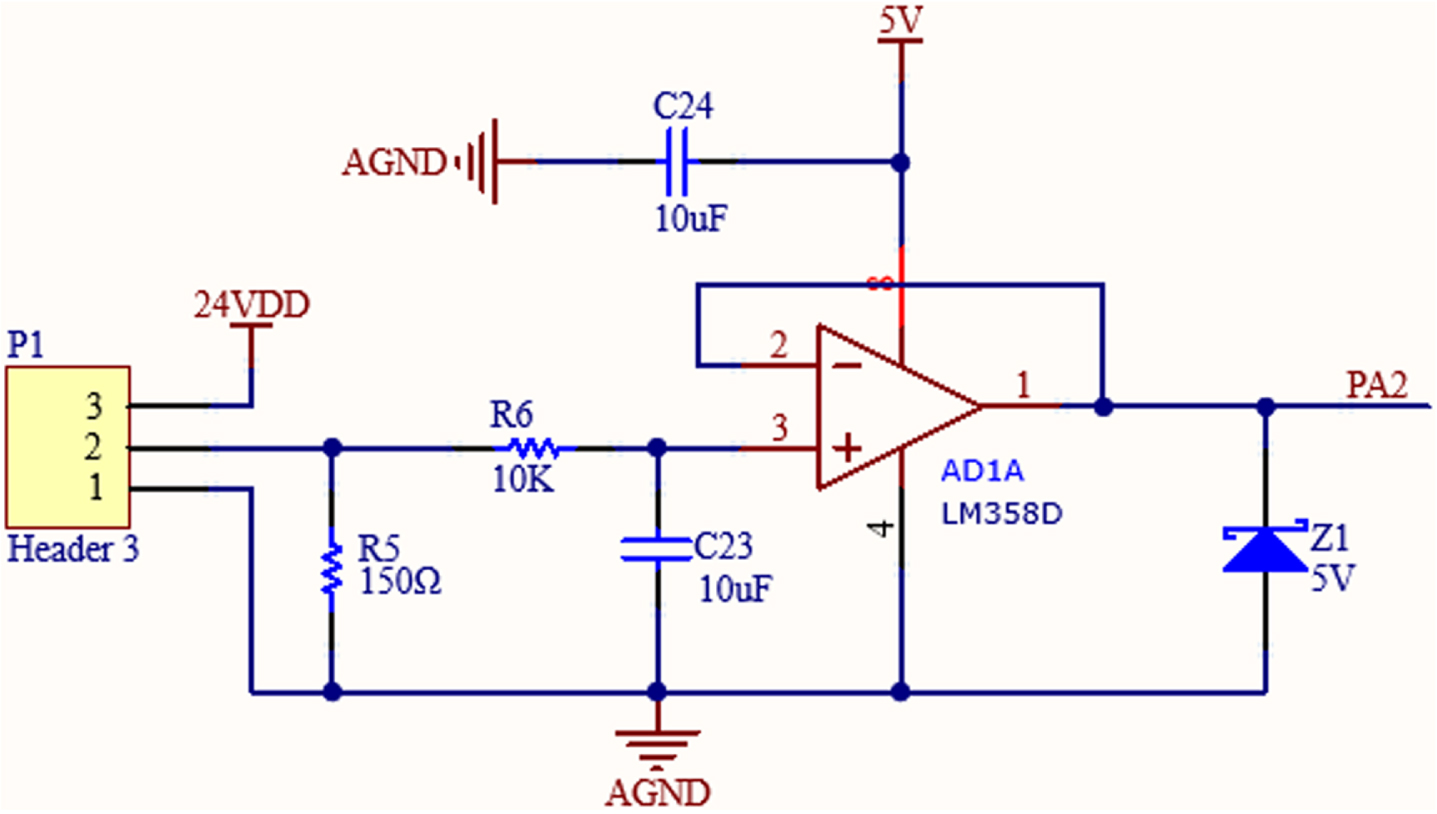
Loom warp tension collection circuit.
I/V conversion converts current signal into voltage signal; RC filter circuit filters out the high-frequency noise in the signal, and its cut-off frequency can be calculated by the formula 14.
The function of voltage follower is to realize impedance matching of front and back circuits; The input protection circuit is a 5V zener diode. Although the output of the circuit can’t exceed 3.3V under normal output regulation, in order to prevent accidental damage to the microcontroller, a 5V zener diode is connected in parallel to the pin of the microcontroller. Bypass capacitor, also called decoupling capacitor or decoupling capacitor, can filter out the high-frequency components in the power supply, improve the power supply quality of the system, and avoid the mutual interference between circuits in the power supply conduction.
On-chip ADC peripherals of STM32F407 series chips can be configured in 12-bit resolution mode at the highest, which can already meet the sampling requirements of warp tension signals. However, the vibration signal of loom spindle has the characteristics of high frequency and small amplitude, so the time history curve can’t be measured effectively with 12-bit resolution ADC. Therefore, in the loom airborne monitoring system, the sampling circuit of loom spindle vibration needs to expand the external ADC.
The external extended ADC selected in this paper is AD7190, which is a low-noise 24-bit ∑-Δ converter suitable for high-precision measurement. The AD7190 samples 5V analog voltage and 2.7V∼5.25V digital voltage for power supply, and can be configured as four pseudo-differential inputs or two differential inputs. The data output rate is between 4.7HZ∼4.8KHZ, and the chip current is 6mA. It is connected to the CPU by SPI interface. As shown in Fig. 7, the sampling circuit of loom spindle vibration signal consists of eight parts: external crystal oscillator, AD conversion, digital power bypass, analog power bypass, reference power supply, signal filtering, grounding processing and signal input interface. The analog sampling circuit has strict requirements on the quality of power supply. In order to ensure the power supply performance of the system and the reliability of the vibration sampling circuit, attention should be paid to the layout and wiring of the fibrechannel, and the grounding treatment should be done at the same time. AD7190 provides an internal system clock of 4.92MHZ, which is similar to the internal clock of single chip microcomputer. In order to improve the clock accuracy, an external clock circuit is used in this system. Under the influence of the clock circuit, the data output rate of the system can be calculated by the following formula when the chopping mode is disabled:

Vibration sampling circuit of loom main shaft.
In the above two formulas, f s is determined by the AD7190 mode register, and its value range is 1 ∼ 1023; f mod is the modulation frequency, and its value is MCLK/16; N is the order of sinc filter.
Human-computer interaction system architecture
The display of monitoring results is one of the important tasks of condition monitoring research. The condition monitoring results of loom will be displayed by the man-machine interaction system of airborne condition monitoring. In loom system, relevant statistical data should be completed by man-machine interaction system and synchronized to airborne state reasoning system. In addition, in order to facilitate the collaborative application of monitoring system and loom control system, it is necessary to integrate the man-machine interaction platform of loom control system with the man-machine interaction platform of state monitoring. Therefore, this paper will adopt the man-machine interaction interface based on loom control system to expand the monitoring system interface, as shown in Fig. 8.
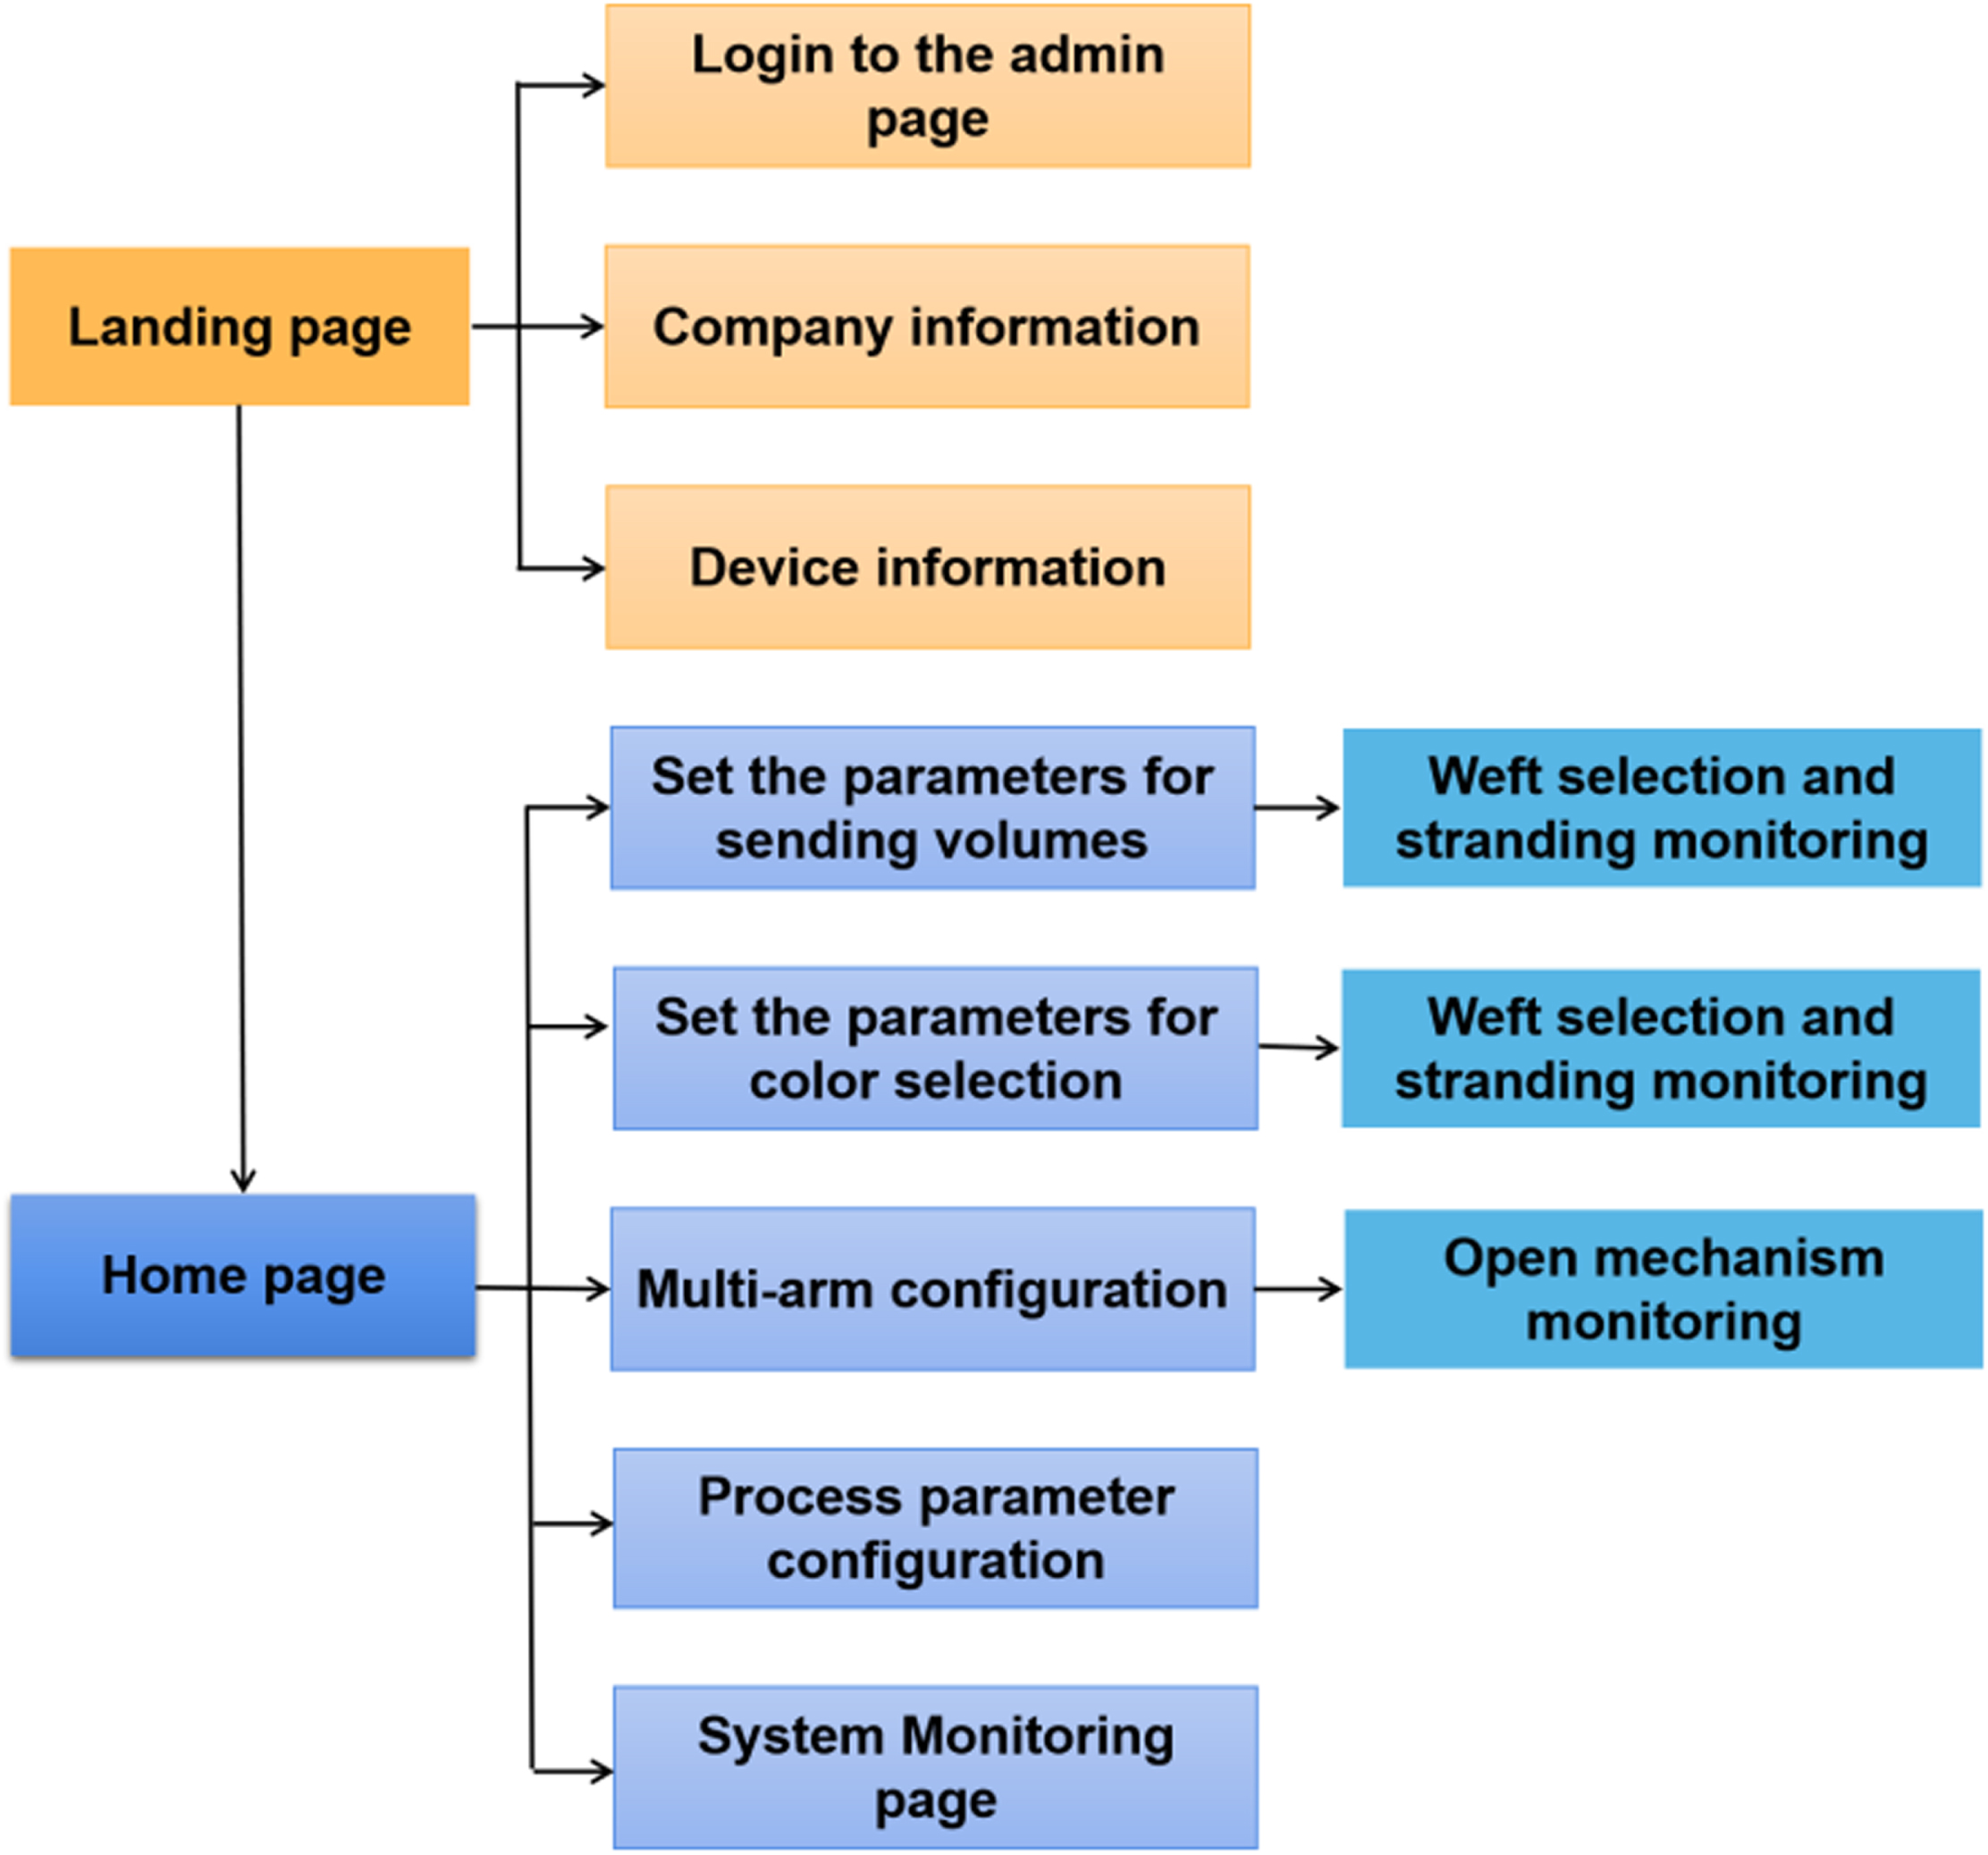
Human computer interaction flow structure.
According to the above interface frame diagram of man-machine interaction system, the man-machine interaction system of loom airborne condition monitoring includes login part, system parameter operation part and condition monitoring part. Part of the login tasks include, login personnel authority management, enterprise information management, system parameter self-inspection and loom equipment information management; The parameter operation part of the system is inherited from the man-machine interface of loom control system, and its tasks include parameter configuration, color selection configuration, dobby configuration, etc. The state monitoring part includes two modules: parameter monitoring and system monitoring, in which parameter monitoring is the display of system parameters and system monitoring is the display of state monitoring results.
Man-machine interaction system of airborne loom condition monitoring platform is realized by TPC7062Td touch screen of Beijing Kunlun Tongtai. According to the above man-machine interaction links and design contents, the system interface is configured and adjusted on McgsPro configuration software.
Kunlun-Thailand touch screen is equipped with RS232 and RS485 optional digital interfaces. RS485 interface is used to connect with single chip microcomputer in this system. In the communication system between touch screen and MCU, the touch screen is the upper computer, its parent device should be configured as serial port parent device, and its communication protocol is ModbusRTU protocol. During the communication process, the touch screen is refreshed in turn according to the order of the first input register, the zero output register, the third input register and the fourth output register. When the MCU gives a correct response, it can go to the next data refresh. The lower computer response program flow is shown in Fig. 9.
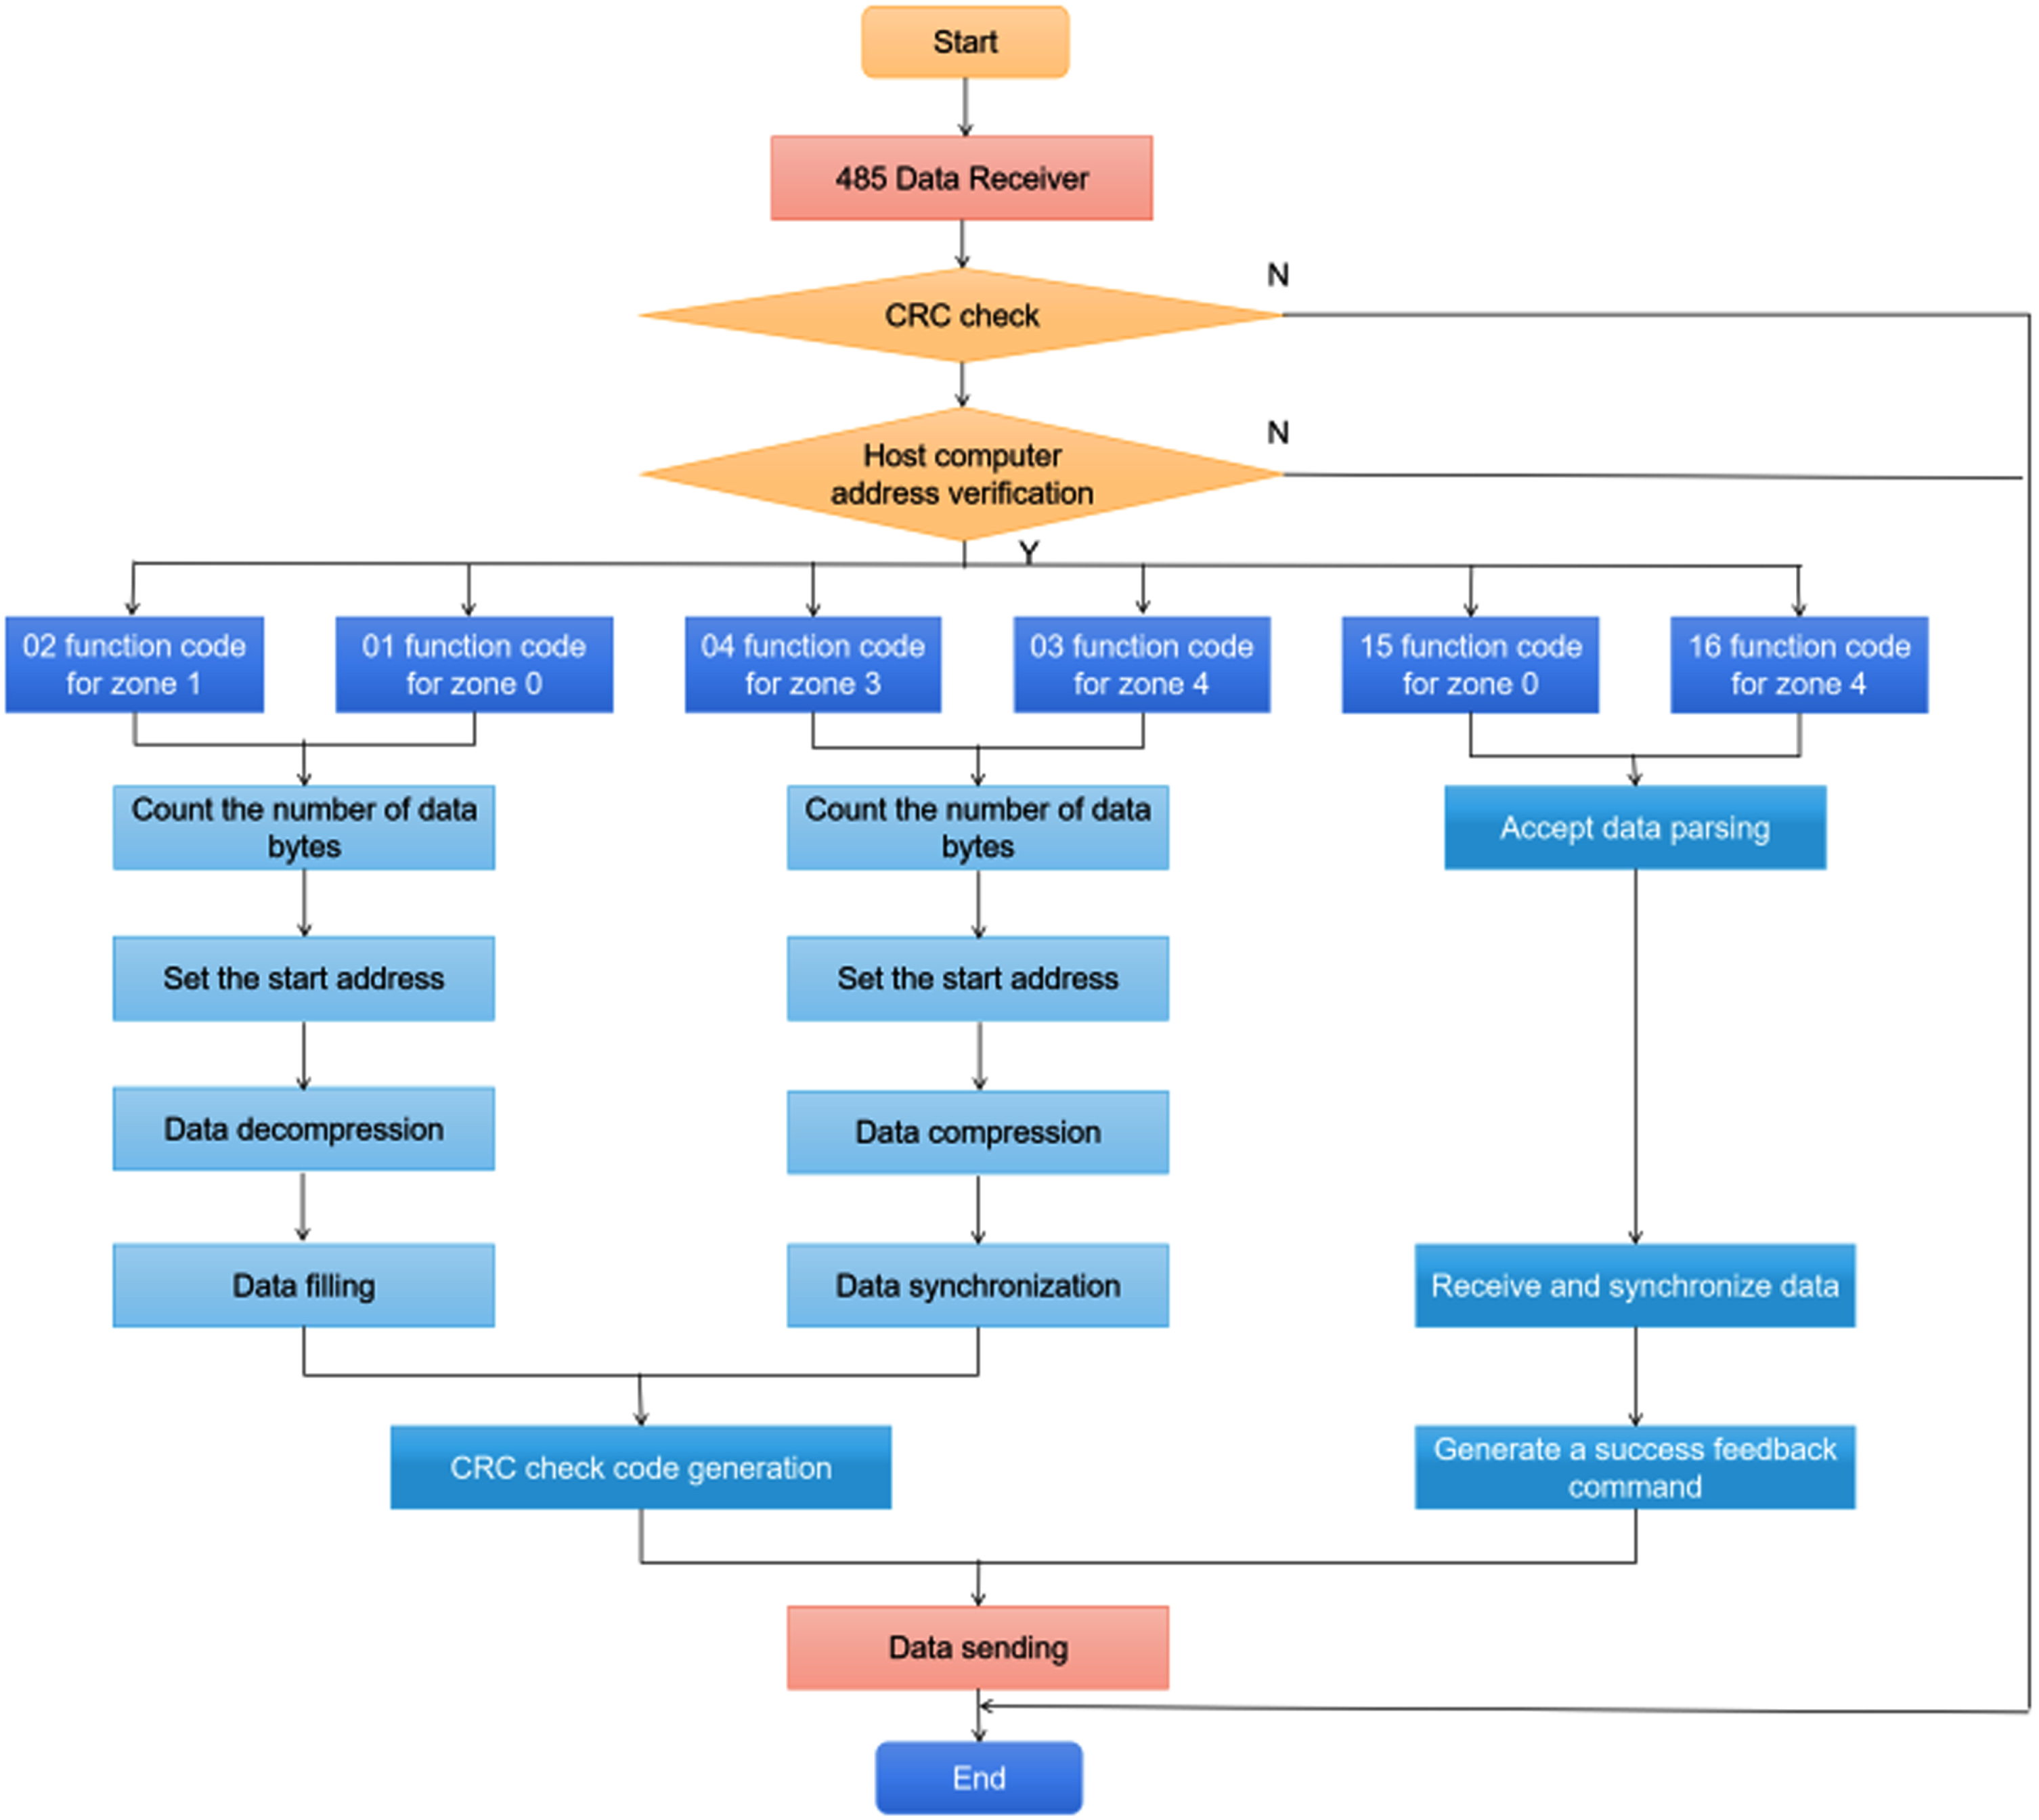
Human computer interaction flow structure.
Each function code follows ModbusRTU communication protocol, among which, the function of 15 function code and 0F function code is to complete the data transmission of the upper computer, or 05 function code and 06 function code in ModbusRTU protocol can be selected, but it should be noted that the selected function code needs to match the settings related to the touch screen configuration project.
Experimental platform
When monitoring loom’s airborne condition, the construction of attribute association rules is based on obtaining sample examples of attribute data. The airborne loom condition monitoring platform collects and preprocesses the data according to the initial state characteristics, and compiles it into a unified data group object in the man-machine interaction system to complete the synchronous display of data with different sampling frequencies.
The data acquisition period of the airborne loom condition monitoring platform is 1 minute, and the system provides the functions of data export and data query at any time interval.
As shown in Fig. 10, there is sampling data of some loom characteristic attributes. In the 20-minute query period, the calculation results of setting values and relative errors of loom parameters are shown in Table 8.

Loom status data acquisition and display.
As can be seen from Fig. 10, during the inquiry period, the loom continued to weave, and there was no weft fault (0 indicates weft missing or broken, 1 indicates normal weft insertion, and 2 indicates double weft) or stop operation, and the loom oil level was normal (0 oil level was too low, 1 oil level was normal). Through the analysis of loom analog data acquisition, it is found that the average value of loom spindle speed measurement is 330.01RPM, which is close to the set value of the actual system, and its maximum deviation is 1.01RPM, and the relative error is less than 0.31%, which meets the requirements of loom spindle speed measurement. Similarly, the relative errors of other analog acquisition parameters of the system are all lower than 0.35%.
By analyzing the indexes of attribute data in the Table 9, it can be seen that the sampling results of each attribute item data of the loom airborne condition monitoring system can truly reflect the actual situation of loom parameters, realize the real-time synchronization of loom condition characteristic data, and provide data support for state reasoning.
Effectiveness analysis of loom condition monitoring data acquisition
The running state tracking of loom includes the parameter monitoring of loom mechanism, the evaluation of loom performance and the process stage tracking of loom motion mechanism. As shown in Fig. 11, the homepage of loom airborne condition monitoring system can view three pages: loom condition data collection, loom running condition tracking and statistical analysis report.
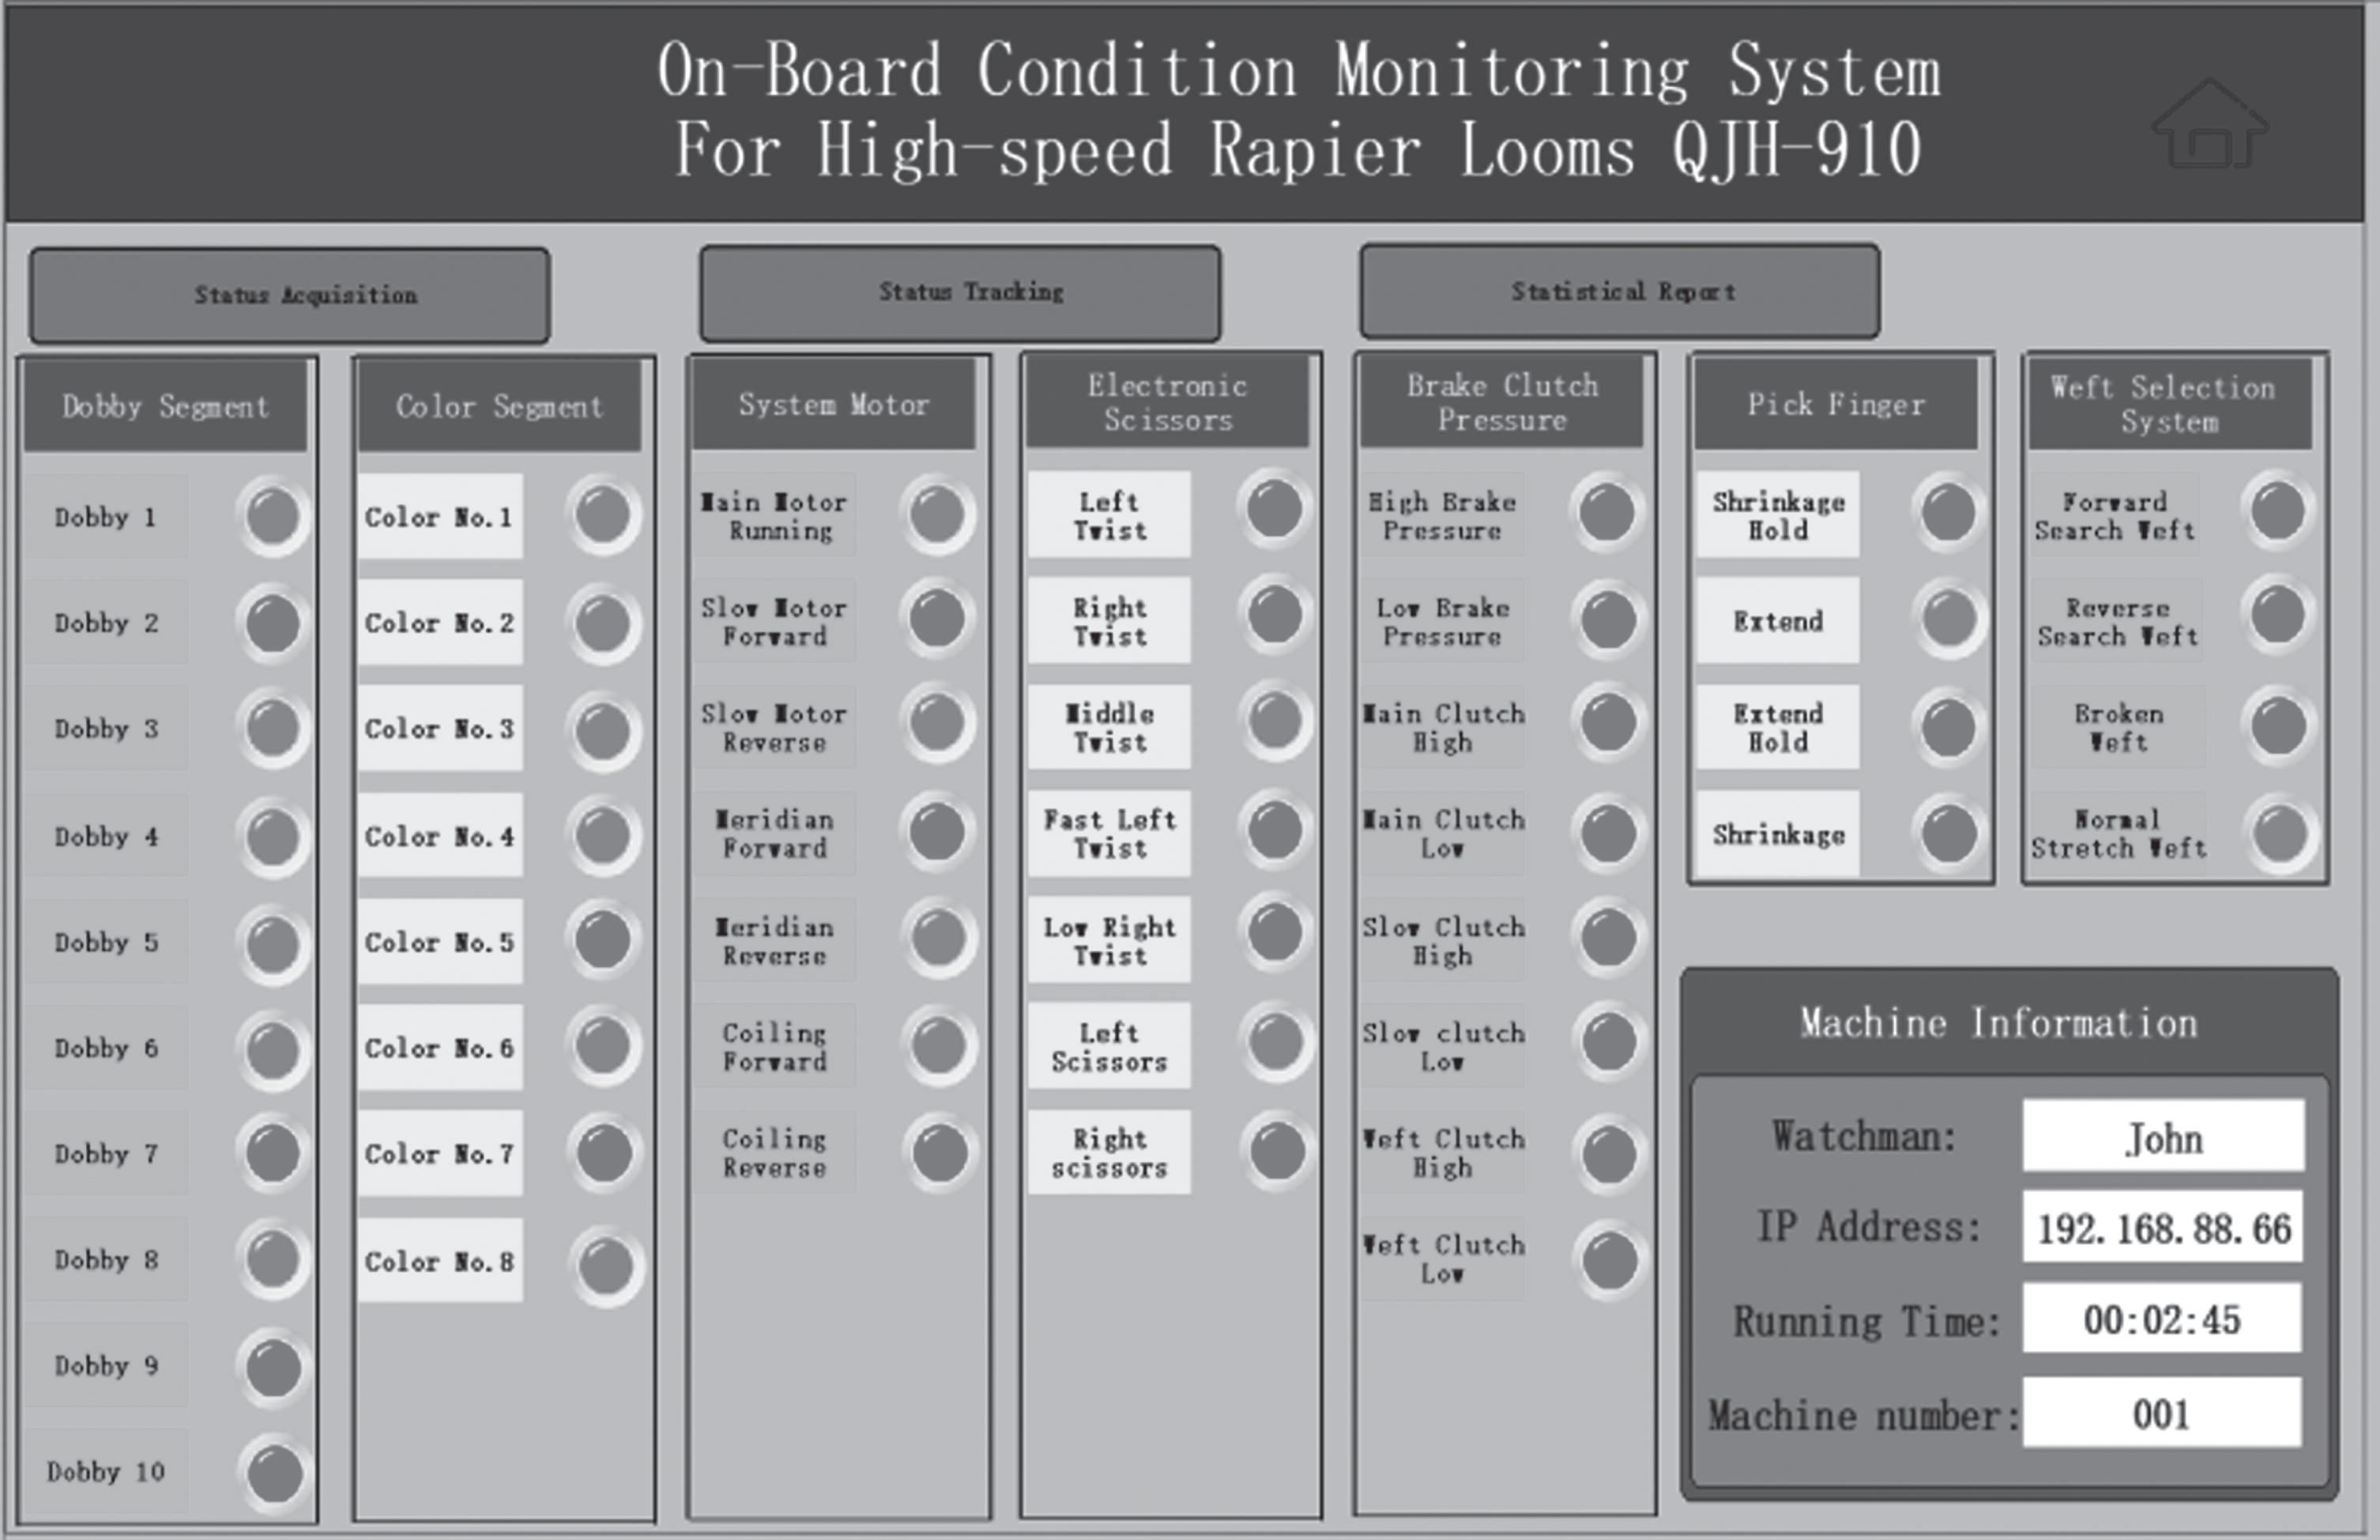
Loom running status tracking home page.
In addition, the current color selection segment number, dobby segment number, system motor operation, electronic scissors status, brake clutch status, weft selection finger status and weft selection system status of the loom can be directly viewed on the main page.
As shown in Fig. 12, the analysis results of current loom state parameters are displayed on this page, including the evaluation results of loom overall performance, identification of loom spindle wear state, identification of loom weft tension collection level, display of heald frame setting results, tracking of spindle angle change, etc.
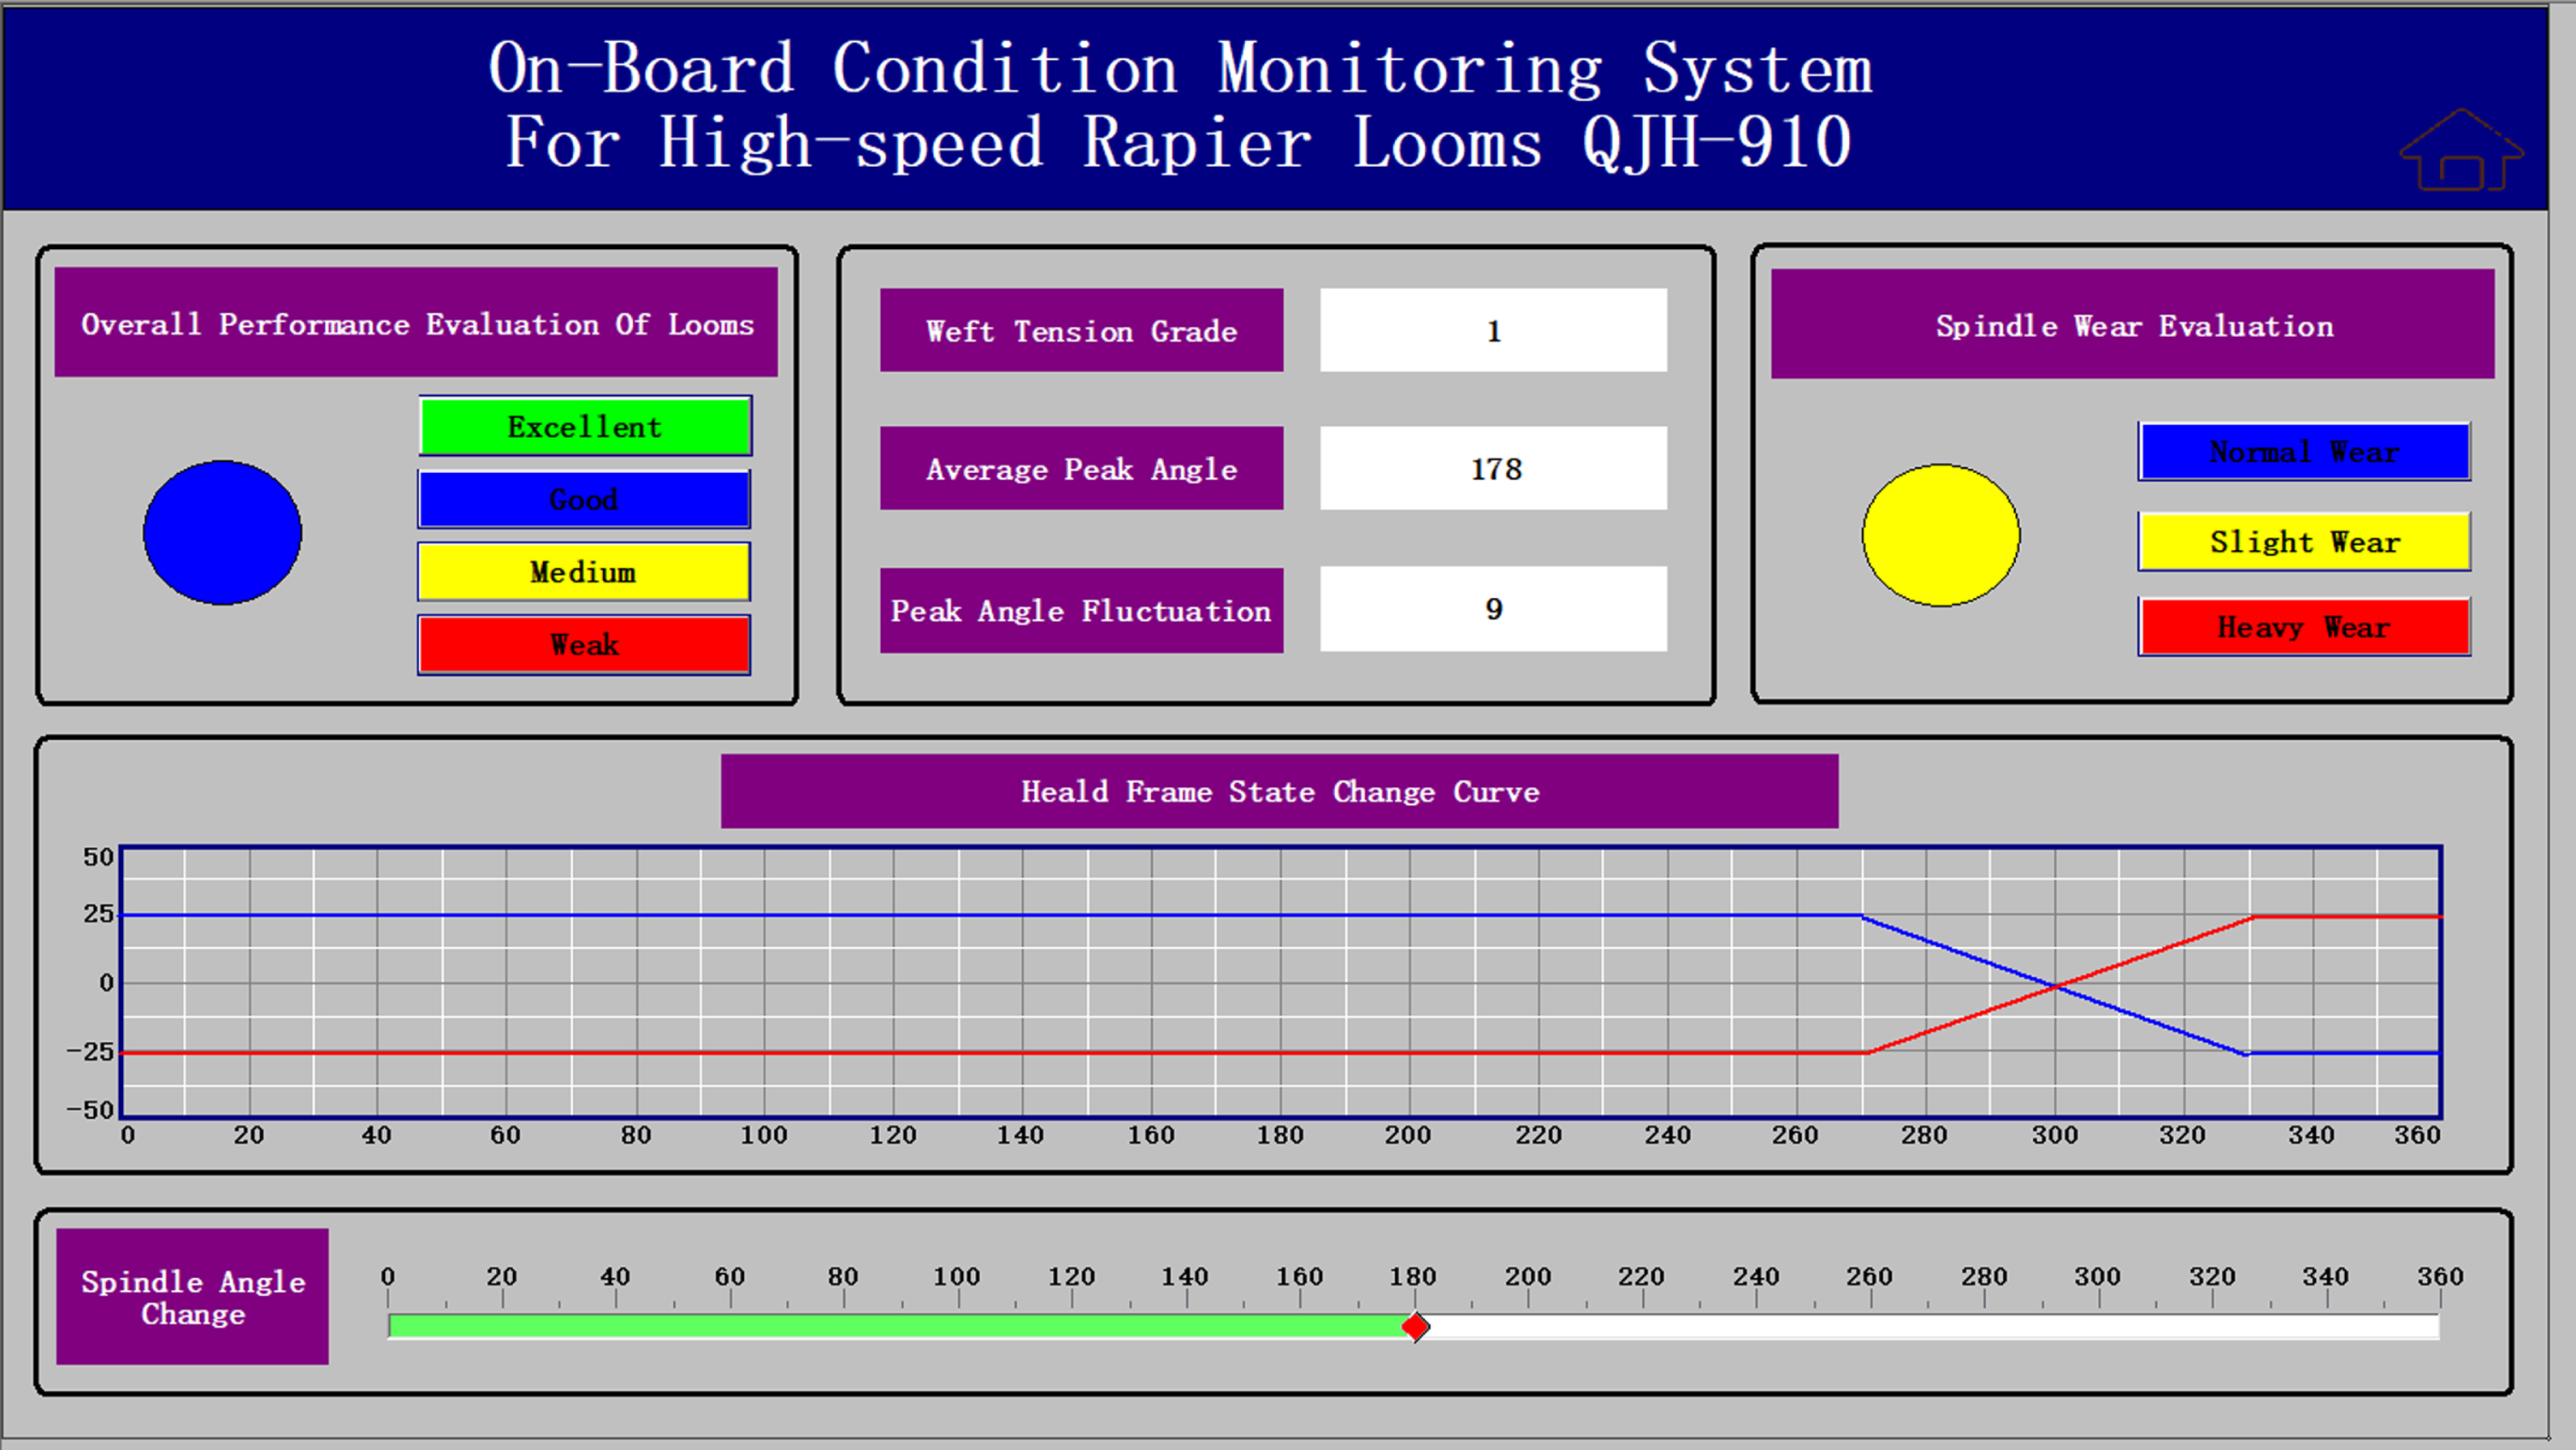
Real time tracking and monitoring interface of loom running state.
In order to test the recognition rate of spindle system wear by the proposed loom airborne condition monitoring method, we installed the airborne monitoring system on two looms of the same model with different wear degrees, and collected 1000 seconds of loom condition data respectively. Now, 2000 data examples are randomly divided into 10 groups, each of which contains 200 data examples. The recognition rates of the decision network constructed by the traditional rough set method and the decision network constructed by the fuzzy rough set method are respectively compared as shown in Table 10. Recognition rate is the percentage of the number of correctly identified input patterns of the total number of all input patterns identified. It is an important index to measure the performance of the pattern recognition system. The higher the value, the higher the recognition rate and the better the system performance.
Loom airborne condition monitoring method spindle wear recognition rate test table
Loom airborne condition monitoring method spindle wear recognition rate test table
The above test experiments on the recognition rate of spindle wear show that the average recognition rates of the loom condition mapping networks constructed by using DS-RS, DS-FS, DSmT-RS and DSmT-FS methods for the spindle wear problem are 99.05%, 99.08%, 99.24% and 99.65% in the 1000 seconds spindle wear condition recognition test. After the improvement of fuzzy rough set and improved DSmT theory, the average recognition rate of the spindle wear recognition problem is greatly improved, and the constructed loom condition monitoring mapping network can obtain better recognition results.
In this paper, the condition monitoring technology of high-speed rapier loom is studied, mainly improving the attribute simplification step and decision matching step of rough set theory, and building a condition monitoring platform at the same time. In order to solve the problem of redundant and repetitive condition monitoring data of looms, a fuzzy rough set attribute reduction method based on a information entropy is used for processing. In order to solve the problems of rough set method such as uncertainty of matching rules for new objects, and at the same time improve the accuracy and speed of decision making, this paper proposes a fuzzy rough set method combined with improved DSmT fusion decision theory. It uses both uncertainty and importance as weighting factors to obtain reasonable indicator weights. Finally, we conducted experimental tests on the constructed loom condition monitoring platform. The results show that the loom condition mapping network constructed by the fuzzy rough set method with improved DSmT fusion decision theory is better than the other three methods for spindle wear identification. The technique has better recognition effect on weaving machine condition decision making. The proposed technique can effectively reduce the false recognition rate of loom condition monitoring and improve the depth of loom condition information mining. It is of great importance to ensure the production safety and fault diagnosis technology of weaving machine equipment.
The limitations of this paper are the following two aspects: in the process of data collection and processing, there are fault modes or fault features missing, and the missing data can be completed by some coming methods; future research can discuss the algorithm proposed in the paper in detail from the perspective of improving the generalization performance.