
Abstract
In marketing, customer segmentation is a very critical element. This paper focuses on clustering algorithms. First, the commonly used K-means algorithm was introduced, and then, it was optimized using the improved Lion Swarm Optimization (ILSO) algorithm and the Calinski-Harabasz (CH) index. The results of the experiment for the UCI dataset showed that the CH indicator obtained an accurate number of clusters, and the clustering accuracy of the ILSO-K-means algorithm was higher, both above 90%. Then, in customer segmentation, the customers of an enterprise were divided into four groups using the ILSO-K-means algorithm, and different marketing suggestions were given. The experimental analysis proves the usability of the ILSO-K-means algorithm in customer segmentation, which can be further applied in practice.
Keywords
Introduction
With the rapid growth of the economy, marketing has become more and more refined, and the demand for customer information has further increased [1]. In order to avoid the loss of customers [2], the marketing methods adopted by enterprises are usually precision marketing, personalized marketing, etc., i.e, achieving low-cost, efficient marketing through full communication with customers. Most of the current marketing is based on customer segmentation; therefore, the research on customer segmentation has become a key element in business management and marketing [3]. Chen et al. [4] proposed an algorithm called PurTreeClust to analyze customer transaction datasets and verified the feasibility of the method through analyzing ten real transaction datasets. Motevali et al. [5] designed a wildebeests herd optimization algorithm to segment bank customers in four aspects, including profitability, loyalty, cost, and creditworthiness and proved the usability of the method. Barman et al. [6] proposed a customer segmentation method based on self-organizing mapping and minimum spanning tree and proved the accuracy of the method through evaluations on several datasets. Bhatnagar et al. [7] performed customer segmentation from the perspective of customer reviews through a long short-term memory (LSTM) model and found through experiments that the accuracy of the model reached 90.9%. Clustering algorithm is a common algorithm in customer segmentation, and the optimization and improvement of this algorithm have been widely studied. Ping et al. [8] applied the K-means algorithm to order batch optimization, improved it by using the seed sorting idea, and obtained higher picking efficiency. Thamer et al. [9] improved the kernel K-mean clustering algorithm using appropriate optimization algorithms and experimentally found that the method achieved the best computation time. For text clustering, Gopal et al. [10] used the whale optimization algorithm to select the fuzzy C-mean clustering centers and verified the performance of the algorithm on three datasets. Surono et al. [11] combined Minkowski distance and Chebyshev distance to optimize the fuzzy C-mean clustering algorithm and obtained a high clustering accuracy. This paper mainly studied the K-means algorithm among clustering algorithms, improved it, and applied it to customer segmentation. Moreover, some marketing suggestions were given for different types of customers. This work provides a theoretical basis for the marketing of enterprises.
Marketing and Customer Segmentation
With the development of the market, precision marketing has received more and more attention [12]. Precision marketing of enterprises is developing precise marketing strategies based on the correct customer segmentation. Steps from content production to pushing all have personalized features.
According to the concept of customer relationship management (CRM) [13], it is crucial for companies to understand the needs of customers [14]. Inadequate maintenance of customers, distant relationship with customers, inability to provide timely feedback on customer needs will all affect customer satisfaction with the company and lead to the loss of customers; therefore, it is necessary to strive for new customers as much as possible, take into account the old customers and strive to improve the value of customers, and in this process, customer segmentation is needed [15].
Customer segmentation can provide better services to target customers [16], and its purpose is to expand and maintain customers with high value for companies to guide their decision making [17] and increase business revenue [18]. Competition in the market is, in essence, a competition for customer resources, and for companies, maintaining good relationships with customers is a key focus of marketing.
In order to better play the role of customer segmentation, the following principles need to be followed: ding172 the purpose of segmentation should be clarified, and suitable indicators should be used for segmentation; ding173 the results of segmentation should be differentiable; ding174 the segmentation plan should be adjusted at any time according to the changes of the market. With the development of data mining technology [19], at present, factor analysis and neural network have been very widely used in customer segmentation [20].
Customer Segmentation Method Based on Clustering Algorithm
K-means algorithm
Clustering algorithms are methods to classify data from the perspective of sample similarity, which has a very wide range of applications in economics and biology [21]. Both clustering algorithms and fuzzy clustering algorithms are able to classify objects in a dataset into different groups; however, fuzzy clustering algorithms are more often used to deal with data with ambiguity or uncertainty, such as in the fields of text classification and image segmentation, while clustering algorithms are mostly used for exploratory data analysis. Therefore, in the customer segmentation problem studied in this paper, clustering algorithms are used.
The K-means algorithm is the most widely used one [22], and its basic steps are as follows. The number of clusters (k) for clustering is determined. k samples are randomly selected as the initial central points. The distance from every sample to the center point is calculated: d
ij
=∥ x
j
- u
j
∥. Every sample is classified into its closest cluster. The new clustering center is calculated again and again until every central point becomes stable. Finally, the result of clustering is obtained.
The K-means algorithm has a relatively simple structure and high computation speed. It can also handle well in the face of the large amount of customer data generated in marketing; however, it also has obvious disadvantages [23]: ding172 sensitive to the initial clustering center; ding173 the selection of the initial k value is mostly determined empirically, which may lead to locally optimal solutions.
Initial clustering center determination method
In this paper, an improved Lion Swarm Optimization Algorithm (ILSO) is used to obtain the initial clustering center of the K-means algorithm. The LSO algorithm is an algorithm that simulates the behavior of lion swarm [24]. It is assumed that the number of lions in the D-dimensional dataset, the number of lions is N, the number of adult lions is nLeader,
In the process of hunting, the update formula of the lion king’s position is:
The equation for updating the position of the lioness is:
The formula for updating the position of lion cubs is:
The position of the lion swarm is initialized using sin chaotic mapping. The number of lion kings, lionesses, and lion cubs are calculated, and the position of the lion king is regarded as the initial clustering center of the K-means algorithm. The position of the lion king, lioness, and cubs is updated. Whether the termination condition or not is reached is determined. If not, it returns to the last step; if it is, it goes to the next step. The optimal solution is obtained, i.e., the initial clustering center.
For the selection of the number of clusters, the Calinski-Harabasz (CH) index [25] is used in to determine the optimal K value, and the corresponding calculation formula is:
B
k
is the intergroup dispersion matrix:
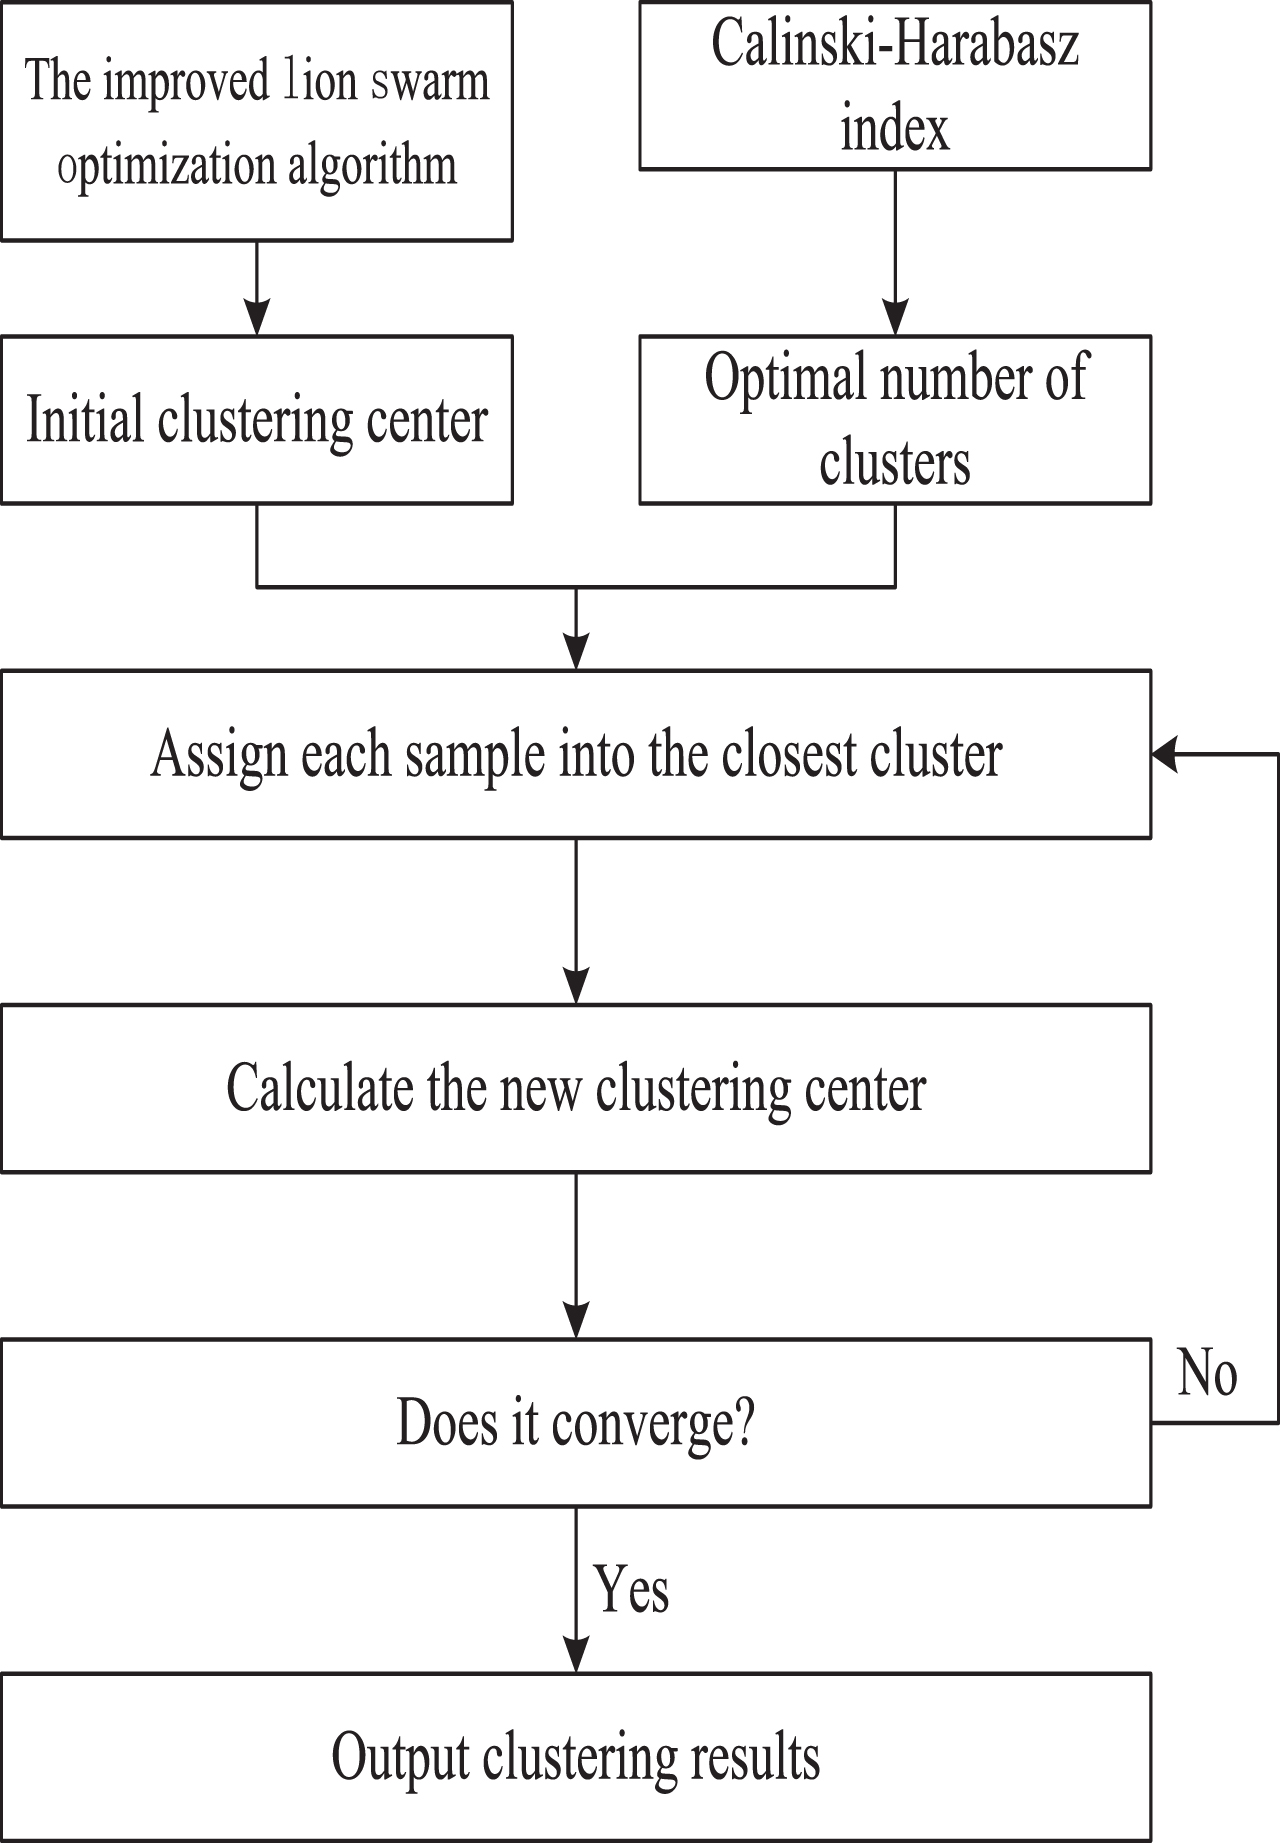
The flow of the clustering-based customer segmentation method designed in this paper is shown in Fig. 1.
The clustering-based customer segmentation method.
As shown in Fig. 1, the initial clustering center is first obtained by the ILSO algorithm, the optimal number of clusters is determined according to the CH index, the obtained parameters are input into the K-means algorithm, the distance of each sample to the clustering center is calculated, each sample is assigned to the closest cluster, whether the algorithm converges is determined by repeatedly calculating the clustering center, and the final clustering result, which is the result of customer segmentation, is output.
Segmentation indicator selection
For customer segmentation in marketing, this paper presented a case study of an online maternal and infant products enterprise. The enterprise’s products include baby bottles, pacifiers, tableware, toys, etc., but with the development of the market, the enterprise is facing more and more fierce competition, the phenomenon of customer loss is more serious, and product sales continue to be low. Therefore, in order to provide some support for the development of the future marketing plan of this enterprise, the customer segmentation was used to understand the customer situation. The selection of customer segmentation indicators is based on the RFM model [26]. The RFM model consists of three main indicators. R (recency) refers to a customer’s most recent consumption. If the number of customers that consume recently is gradually increasing, it indicates that the company’s recent marketing strategy has obtained good results, and the trend of development is good. F (frequency) refers to the consumption frequency of customers over a period of time. In marketing, the more frequent the consumption, the higher the business revenue brought by the customer to the company, i.e., the higher the value of the customer. M (monetary) refers to the total spending of customers over a period of time. The higher the spending of customers, the higher the revenue for the company, and when there are limitations in resources and costs for the company, targeting high-spending customers for marketing can lead to greater revenue.
The traditional RFM model in customer analysis ignores the customer’s experience of the company, and the F and M indicators also have the problem of collinearity, because when a customer’s consumption frequency is higher, his consumption amount is also higher, therefore, for these two problems, the following optimization was made. Customer satisfaction indicator S was used to describe the customer’s sense of experience in the process of consumption. It is generally believed that the higher the customer’s satisfaction with the product and company, the stronger the inclination to continue to buy, and it will affect the decision of other consumers in the wait-and-see state. The average customer spending (M/F) was used to replace the total spending to better reflect the customer’s spending power.
According to the RFMS model obtained above, the order data of the enterprise from March 1, 2022 to December 31, 2022 were collected. The statistics of different indicators are as follows. R: the interval between the time of the latest consumption of the customer and the statistical cut-off time (December 31, 2022). F: frequency of consumption of the customer from March 1, 2022 to December 31, 2022. M: the average customer spending from March 1, 2022 to December 31, 2022. S: the average value of the scores of all the orders of the customer from March 1, 2022 to December 31, 2022, and the range of the score was 0–5.
The collected sample data were sorted. After eliminating abnormal and incomplete values, a total of 41,258 customer data were obtained, and some of the data are shown in Table 1.
Some customer data
Some customer data
It was seen from Table 1 that there was a large gap between the values of different indicators, which needs to be standardized. The smaller the R value, the higher the value of the customer. The formula of standardization is:
The larger the values of F, M, and S, the higher the customer value. The formula of standardization is:
First, five datasets were selected from UCI for analysis [27], as shown in Table 2.
UCI dataset
UCI dataset
First, the optimal K value determined using the CH indicator was analyzed and compared with the actual number of categories in the dataset, and the results are shown in Fig. 2.

Analysis of the determination of the optimal number of clusters.
It was seen from Fig. 1 that the optimal K value determined using the CH indicator method exactly matched the actual number of categories in every dataset, indicating that the optimal number of clusters can be obtained through the CH indicator.
Then, the accuracy of traditional K-means and ILSO-improved K-means algorithms in classifying clusters was compared. The experiment was first carried out using the UCI dataset. The average value was taken after running the two algorithms for ten times. The results are shown in Fig. 3.

Accuracy analysis of clustering algorithms.
It was seen from Fig. 3 that the accuracy of the traditional K-means algorithm for all the five datasets was below 90%, among which, the accuracy for Wine was only 56.44%. After using the ILSO algorithm to optimize the initial clustering center, the accuracy of the algorithm reached more than 90% for all the datasets, and the accuracy reached 96.54% for Wine, which was 40.1% higher than the traditional K-means algorithm. This proved the reliability of the ILSO algorithm. The algorithm could be used in customer segmentation.
The customer data of this enterprise were segmented using the ILSO algorithm. The number of clusters was determined as 4 by the CH indicator, and the specific results are shown in Table 3.
Customer clustering results
Customer clustering results
It was observed in Table 3 that customer group 1 had the highest number of people, reaching 47.64%. To be specific, this category of customers had a short period of time since their latest consumption, a high frequency of consumption, and a higher average spending (4521.36 yuan), and an average satisfaction degree of 4.33, indicating that this category of customers was accustomed to and happy to spend money at the enterprise. Based on the analysis, it was considered that such customers were the retained customers and main consumer group of the enterprise.
In the marketing process, the enterprise should improve the loyalty and adhesion of such customers through the membership system, points exchange and other methods to create greater value for the enterprise. At the same time, it should further improve customer satisfaction with the enterprise through birthday wishes, holiday sympathy, and other ways to maintain a good reputation in such customer groups, which is conducive to the increase of enterprise revenue.
Customer group 2 accounted for a high percentage in the four customer groups, reaching 31.22%. During this period, it has been a little longer since the last consumption, the frequency of consumption was not particularly high, and the average spending was 2,856.33 yuan, but customer’s satisfaction with the enterprise was high. These customers may be new customers and may become stable customers in the future. Based on the analysis, it was considered that such customers were potential customers of the enterprise.
In the marketing process, the enterprise should attract such customers to consume through coupons and discount activities to further explore the value of such customers, and at the same time, it can further understand the popular products among new customers through investigating of such customers, which can provide a reference for the subsequent production.
Although customer group 3 accounted for the smallest proportion, only 7.41%, but this type of customer has a recent consumption behavior and a high consumption frequency. During this period, compared with other customer groups, this type of customer had the highest average spending (13,025.77 yuan) and a high average satisfaction value (4.87). Based on the analysis, it was considered that this type of customer was the value customers of the enterprise and have a high satisfaction level with the enterprise, which can also bring a large revenue to the enterprise.
In the marketing process, for such customers, the enterprise should do a good job in customer management, make more efforts in marketing, try to avoid the loss of value customers, understand customer needs through various ways, provide them with high-quality services, and recommend new products as a priority to create more revenue for the enterprise.
Customers in customer group 4 had a small percentage, 13.73%. Specifically, the period of time since their last consumption was the longest, 153.94 days, and the consumption frequency was the lowest, 3.57 times, and the average spending was low, only 1,429.61 yuan. Their satisfaction with the enterprise was also poor, indicating that such customers were less satisfied with the enterprise and its products, so there was a risk of losing them. Based on the analysis, it was considered that such customers needed to be retained by the enterprise.
In order to retain customers, companies can understand the reasons for less consumption and poor satisfaction through investigation, and then, where appropriate, the investment in marketing resources can be reduced, such as sending regular promotions, consumer coupons, etc. At the same time, it is also necessary to carry out a more in-depth segmentation of such customers, retain customers with certain values, and abandon customers with low values.
This paper mainly researched customer segmentation through clustering algorithms, improved the K-means algorithm for its defects, and took the customer data of an enterprise as an example. Through experiments, we found that the improvement of K-means was reliable, and it obtained the accurate number of clusters and had a higher accuracy. The enterprise’s customers were divided into four groups, and different marketing suggestions were made for different groups, which provided some referable directions for the future development of the enterprise.