
Abstract
Since the dawn of the digital web era, web-based learning resources have become more and more significant in the field of education. To a certain extent, the visual communication design of these resources influences how well students learn. In view of this, the study proposes a deep learning-based approach to visual communication design. Convolutional neural networks are introduced to automatically construct the visual communication interface, a recommendation algorithm is used to develop the system’s recommendation function, and machine translation is used to translate the language description text. The study method’s efficacy was evaluated. According to the experimental results, the research method’s runtime in a color environment was only about 37.7 seconds at 4k resolution; in a non-color environment, the method’s F1 value was 0.87 at a recommended list length of 35, which was higher than that of other methods; and when it came to the interface solutions in real terms, the research method produced 526 at 30 buttons. The aforementioned findings demonstrate that the suggested approach can successfully increase the visual communication’s design speed and performance in online learning materials and offer a suitable answer to the needs of real-world applications.
Keywords
Introduction
With the advent of the digital era, the visual communication design of web-based learning resources has become essential. Effective visual communication design can improve user experience and learning effectiveness in this era of ever expanding information by facilitating users’ access to and comprehension of learning resources [1, 2]. Web-based educational materials must be created with a variety of users’ requirements and preferences in mind, including learners with varying ages, educational backgrounds, and learning objectives [3, 4]. At present, collaborative filtering algorithms and matrix decomposition algorithms are the most widely used personalized recommendation algorithms. The former has the drawbacks of cold start, recommended waterfall effect, and friend interference wind, while the latter has the drawbacks of poor interpretability and slow training speed [5]. How information is presented should be taken into consideration if better information transfer and understanding is to be realized [6]. Visual communication design can be traced back to the ancient Egyptian period, when visual communication design is only used to convey personal ideas. The development of visual communication design coincided with the discovery of printing art, which led to its widespread dissemination and increased diversity of function. Visual communication design has entered the digital era with the rise of the Internet, and its range of applications has expanded. The common learning visualization technology is WebAR technology based on Marker, but it is easy to be affected by factors such as illumination and occlusion, and Marker is used as the identification object, which is bound to have a certain impact on the beauty, order and natural characteristics of the real scene. Convolutional neural network (CNN), as one of the most important algorithms in the field of computer vision, can realize the advanced feature extraction and classification of images by simulating the visual processing method of the human brain, but the physical meaning of the extracted features is not clear, resulting in poor interpretability and easy to local optimal; thus, the recommendation results are not accurate or personalized. The recommendation algorithm can effectively realize the routine recommendation, improve the user’s experience, and effectively make up for the lack of CNN personalized recommendation. In the field of education, developing and designing general learning resources, including teaching materials, syllabus, and teaching objectives, combined with visual design, helps to combine theoretical teaching with practice, improve the learning efficiency and effectiveness of scholars. Therefore, in order to improve the user experience and engagement and provide more accurate and personalized recommendations, this study designed a new visual communication method to construct the system recommendation function. Then, a convolutional neural network is introduced to automatically design the visual communication interface and use machine translation to translate the language description text. Therefore, a feasible reference solution is provided for the visual communication design of network learning resources [7].
The research can be divided into four main parts. The first part discusses the current research results related to visual communication design and deep learning. The second part focuses on the design of a deep learning-based visual communication design method for web learning resources. The third part is a test and empirical analysis of the performance of the research method. For this paper, the main contributions are as follows: (1) using CNN to extract the properties of learning resources in order to provide individualized recommendations. (2) Utilizing the recommendation algorithm, suggest educational materials to users based on their individual learning requirements. (3) The interface tree generation methodology enables the rapid production of interactive learning interfaces in order to enhance user experience.
Related works
Experts have recognized the importance of visual communication design strategies for online web learning resource platforms due to the quick development of web technologies and the growing availability of online web learning resources. Liu et al. [8] proposed a computational model based on unsupervised learning, namely the time cognition topic model (TCTM), for the question of how to understand the state of students in learning. The model can intuitively show the focus and cognitive engagement of learners in the online learning process. A reconfiguration approach for the visual transmission of Hong Kong cityscapes was proposed by Toland and Cate [9]. The method converts alterations into visual representations by analyzing ecosystems and ground remodeling. The suggested approach is able to resolve complicated urban area visual communication design issues, according to experimental findings. Baker [10] suggested a solution to the issue of visual communication design in sustainable living that is based on quantitative data. The procedure integrates the public’s intention into the design and presents the PLS-SEM method for assessing public attitude. The suggested approach can produce works that have a positive influence. Li [11] suggested addressing the issue of visual communication design for digital advertising from a product-based perspective. The procedure develops the design within the framework of society after analyzing the nature and qualities of the product itself. The experimental findings demonstrate the good visual design effects of the suggested strategy. A free-association-based strategy was put up by Urban et al. [12] to address the design challenge of visual communication in neighborhoods. Free association of billboards in various areas is part of the process, which entails linking composition, content, etc. The outcomes of the experiments demonstrate that the suggested approach produces design outcomes that satisfy local construction requirements. Wang [13] put forth an attention-based deep collaborative learning resource recommendation model in terms of learning resource recommendations. To determine which recommendations to make, the model uses artificial intelligence to evaluate the learning materials gathered by numerous sensors. A recommendation system based on CLSAN was presented by Wenige et al. [14] for the challenge of personalized recommendation in the software crowdsourcing task. By integrating the attention mechanism, this framework can determine the attention weight of user preferences and extract both short- and long-term feature layers from past tasks, resulting in a tailored preference for each user. The problem of convolutional graph convolutional neural networks and personalized learning path recommendation was put forth by Zhang et al. [15]. In order to more precisely represent learner preferences, this method uses a graph convolutional network approach to model higher-order correlations on knowledge graphs.
A deep learning-based solution for the ultrasonic inspection picture recognition problem was put out by Selvathi and Chandralekha [16]. The procedure increases the image input source and enhances local phase properties. According to experimental findings, the suggested strategy has a high accuracy rate. Yan et al. [17] put out a deep learning-based solution to the power construction industry’s violation detection challenge. The procedure uses photos to segment the target, erases extraneous portions, and inserts a YOLO model to serve as a detector. According to experimental findings, the suggested strategy offers a high detection accuracy. A deep learning-based solution to the unfolding optical fiber sensor problem was put out by Kong [18]. Phase detangling is carried out after an upscaled one-dimensional phase has been encoded. The results of the experiments indicate that the decoupling quality of the suggested method is high. A deep learning-based approach to the tax audit sample problem was put out by Lee [19]. The Apriori algorithm is utilized to confirm that the reconstruction error is appropriate, and the autoencoder algorithm is introduced for error reconstruction. The experimental findings indicate that the suggested approach is capable of identifying suspicious taxpayers with accuracy. Yan et al. [20] suggested a deep learning-based solution to the upper gastrointestinal tract cancer screening issue. The procedure uses endoscopic image recognition with artificial intelligence algorithms. The outcomes of the experiment demonstrate that the suggested strategy can raise the effectiveness of cancer screening in the gastrointestinal system.
In conclusion, despite extensive study in many domains, little is known about the use of deep learning to the design of visual communication. To address these issues and give more reference solutions for the growth of the visual communication design sector, the study suggests a deep learning-based approach to visual communication design for Web learning resources.
Deep learning-based visual communication design approach for web learning resources
A well-designed visual communication tool can improve students’ ability to access online educational materials. The technical tools utilized in the research’s visual communication design approach to the Web learning materials will be the main topic of this part.
Design of a recommendation method for web learning resources based on recommendation algorithms
With the development of digital networks, the Web has become the preferred learning path for many learners, and digital networks serve as a reliable vehicle for Web learning resources [21]. However, due to vast number of different types of learning resources, learners meet difficulties in selecting the Web learning resources they need. Using recommendation algorithms for course recommendation in learning systems is a solution [22, 23]. Web learning resources are updated quickly, and this study prioritise and recommend newly released learning resources, and to design a system recommendation function based on it, as shown in Fig. 1.
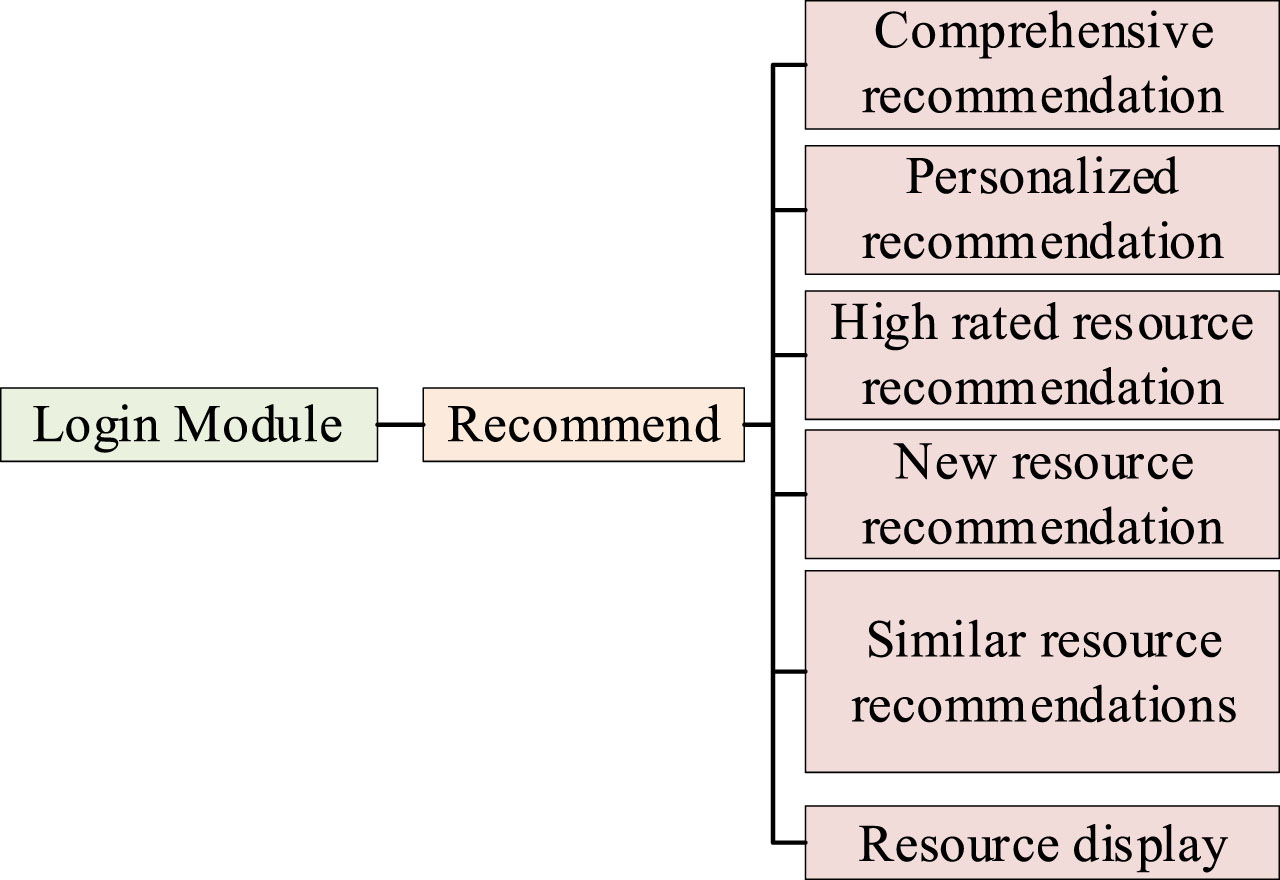
Recommended system framework.
Seven modules make up the system’s recommendation function, as shown in Fig. 1: the login module, the comprehensive recommendation module, the personalised recommendation module, the high-rated resource recommendation module, the newly released resource recommendation module, the resource display module and the similar resource recommendation module. Upon the learner’s first login, the login module establishes the learner’s initial profile and gathers basic information about them. The Highly Rated Resource Recommendation, Personalised Recommendation, Newly Released Resource, and General Recommendation modules all operate in tandem to suggest educational materials for students using various reasoning. The resource display module shows the material when students have chosen the resources they need to learn. Following education, the module for similar resources identifies and recommends the learning materials that are most comparable to the available resources. The learner model, web learning resource model, and recommendation algorithm are the three sub-models that make up the system recommendation model. The recommendation algorithm is the main component of the learner model, which is composed of learner identity information, behavioural data, and learning interests. The web-based learning resource model is composed of content, features, and learning resource identification information [22]. Equation (1) illustrates how the comprehensive recommendation module builds a prediction matrix for users by utilising a hidden semantic model method to fill in the gaps in the system’s predictive scoring matrix.
In Equation (1),
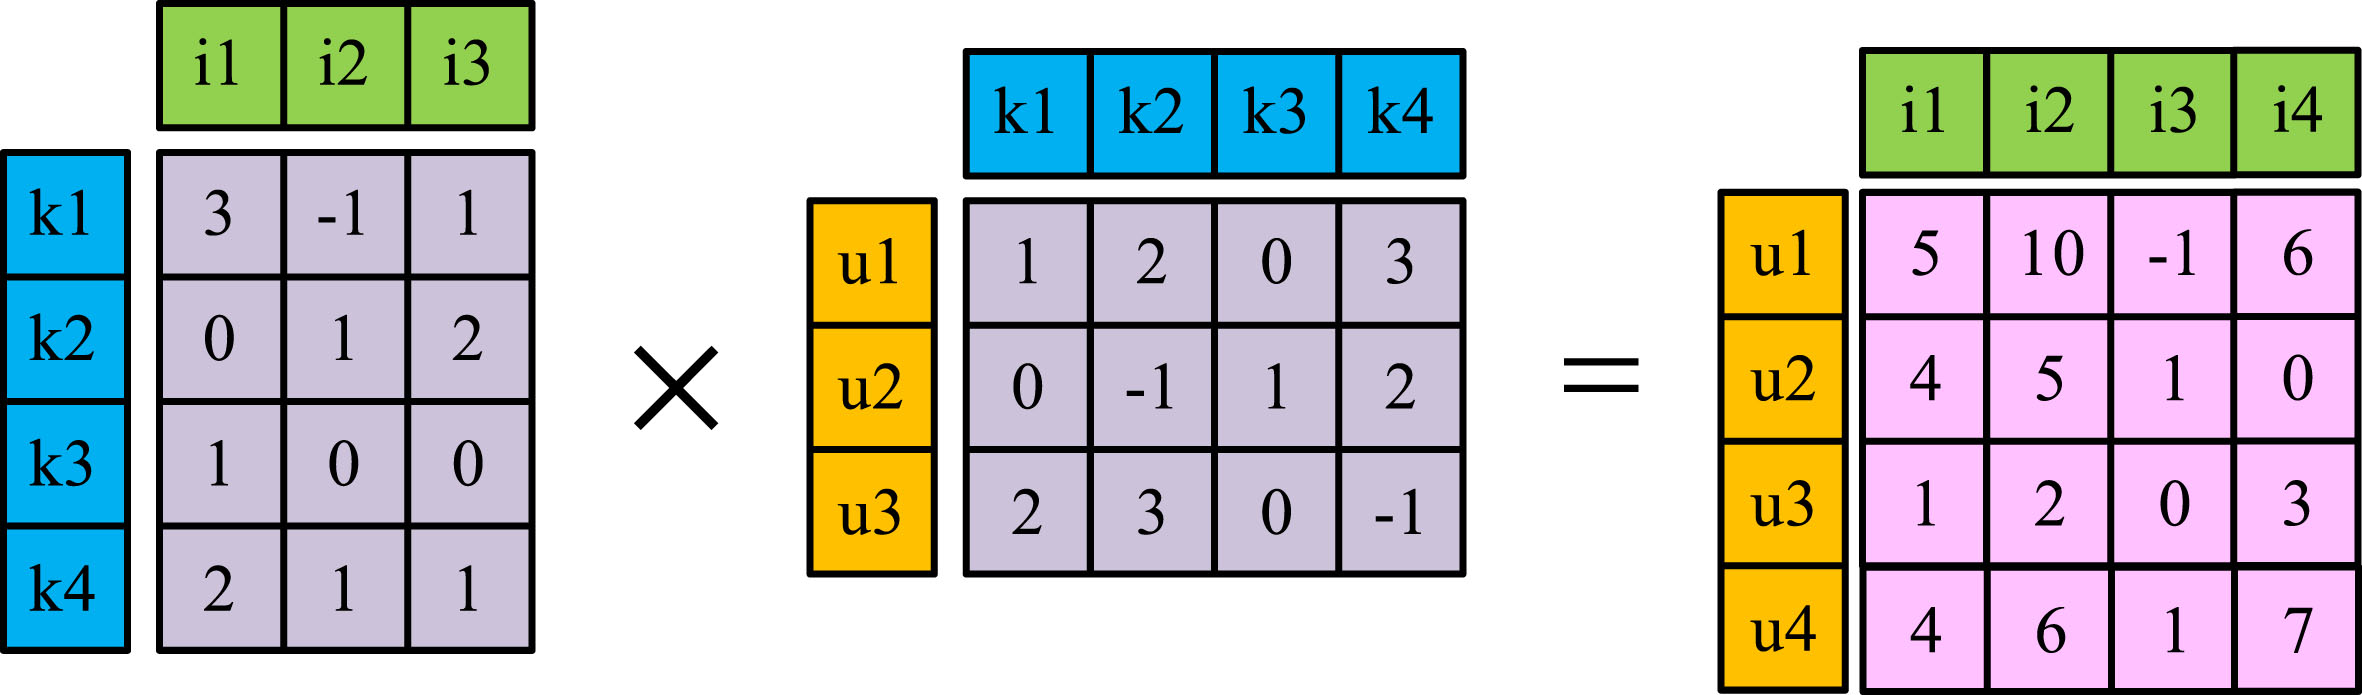
Relationship between prediction matrix and decomposition matrix.
As can be seen from Fig. 2, the prediction matrix has users and items on different directional edges. The prediction matrix with 3 rows and 3 columns is changed into a matrix with 3 rows and 4 columns and a matrix with 4 rows and 3 columns after decomposition transposition, and the new dimensions K1, k2, k3 and k4 obtained are the hidden features between users and items mined by the hidden semantic model algorithm. The product of the transpose matrix of one decomposition matrix and the other decomposition matrix is the prediction matrix, and the two decomposition matrices are computed using a squared loss function solution as shown in Equation (2).
In Equation (2), R
ui
represents the value in a coordinate point of the scoring matrix; R
ui
represents the value in a coordinate point of the prediction matrix; and Reg represents the regularization term to prevent over fitting. The personalized recommendation module uses a real-time recommendation calculation algorithm to calculate the cosine similarity between resources, as shown in Equation (3).
In Equation (3), m and n represent the two learning resources; k refers to the total number of learners; and f mi means the learners’ ratings of the resources. The real-time calculations are ranked in order of priority and then the recommendations are calculated as shown in Equation (4).
In Equation (4), j represents the set of resources with high similarity to the target resource; P
ij
means the priority of the recommended resource. The similarity calculation is performed using the word frequency inverse document frequency algorithm for similar resource recommendation. The word frequency calculation is shown in Equation (5).
In Equation (5), ni,j represents the number of occurrences of a word in a sentence; n*,j means the total number of words obtained in a sentence. The reverse document frequency is calculated as shown in Equation (6).
In Equation (6), N represents the total number of sentences in the sentence set; N i means the total number of sentences containing a word in the sentence set. The word frequency inverse document frequency is calculated as the product of the word frequency and the inverse document frequency. The process of similar resource recommendation is shown in Fig. 3.
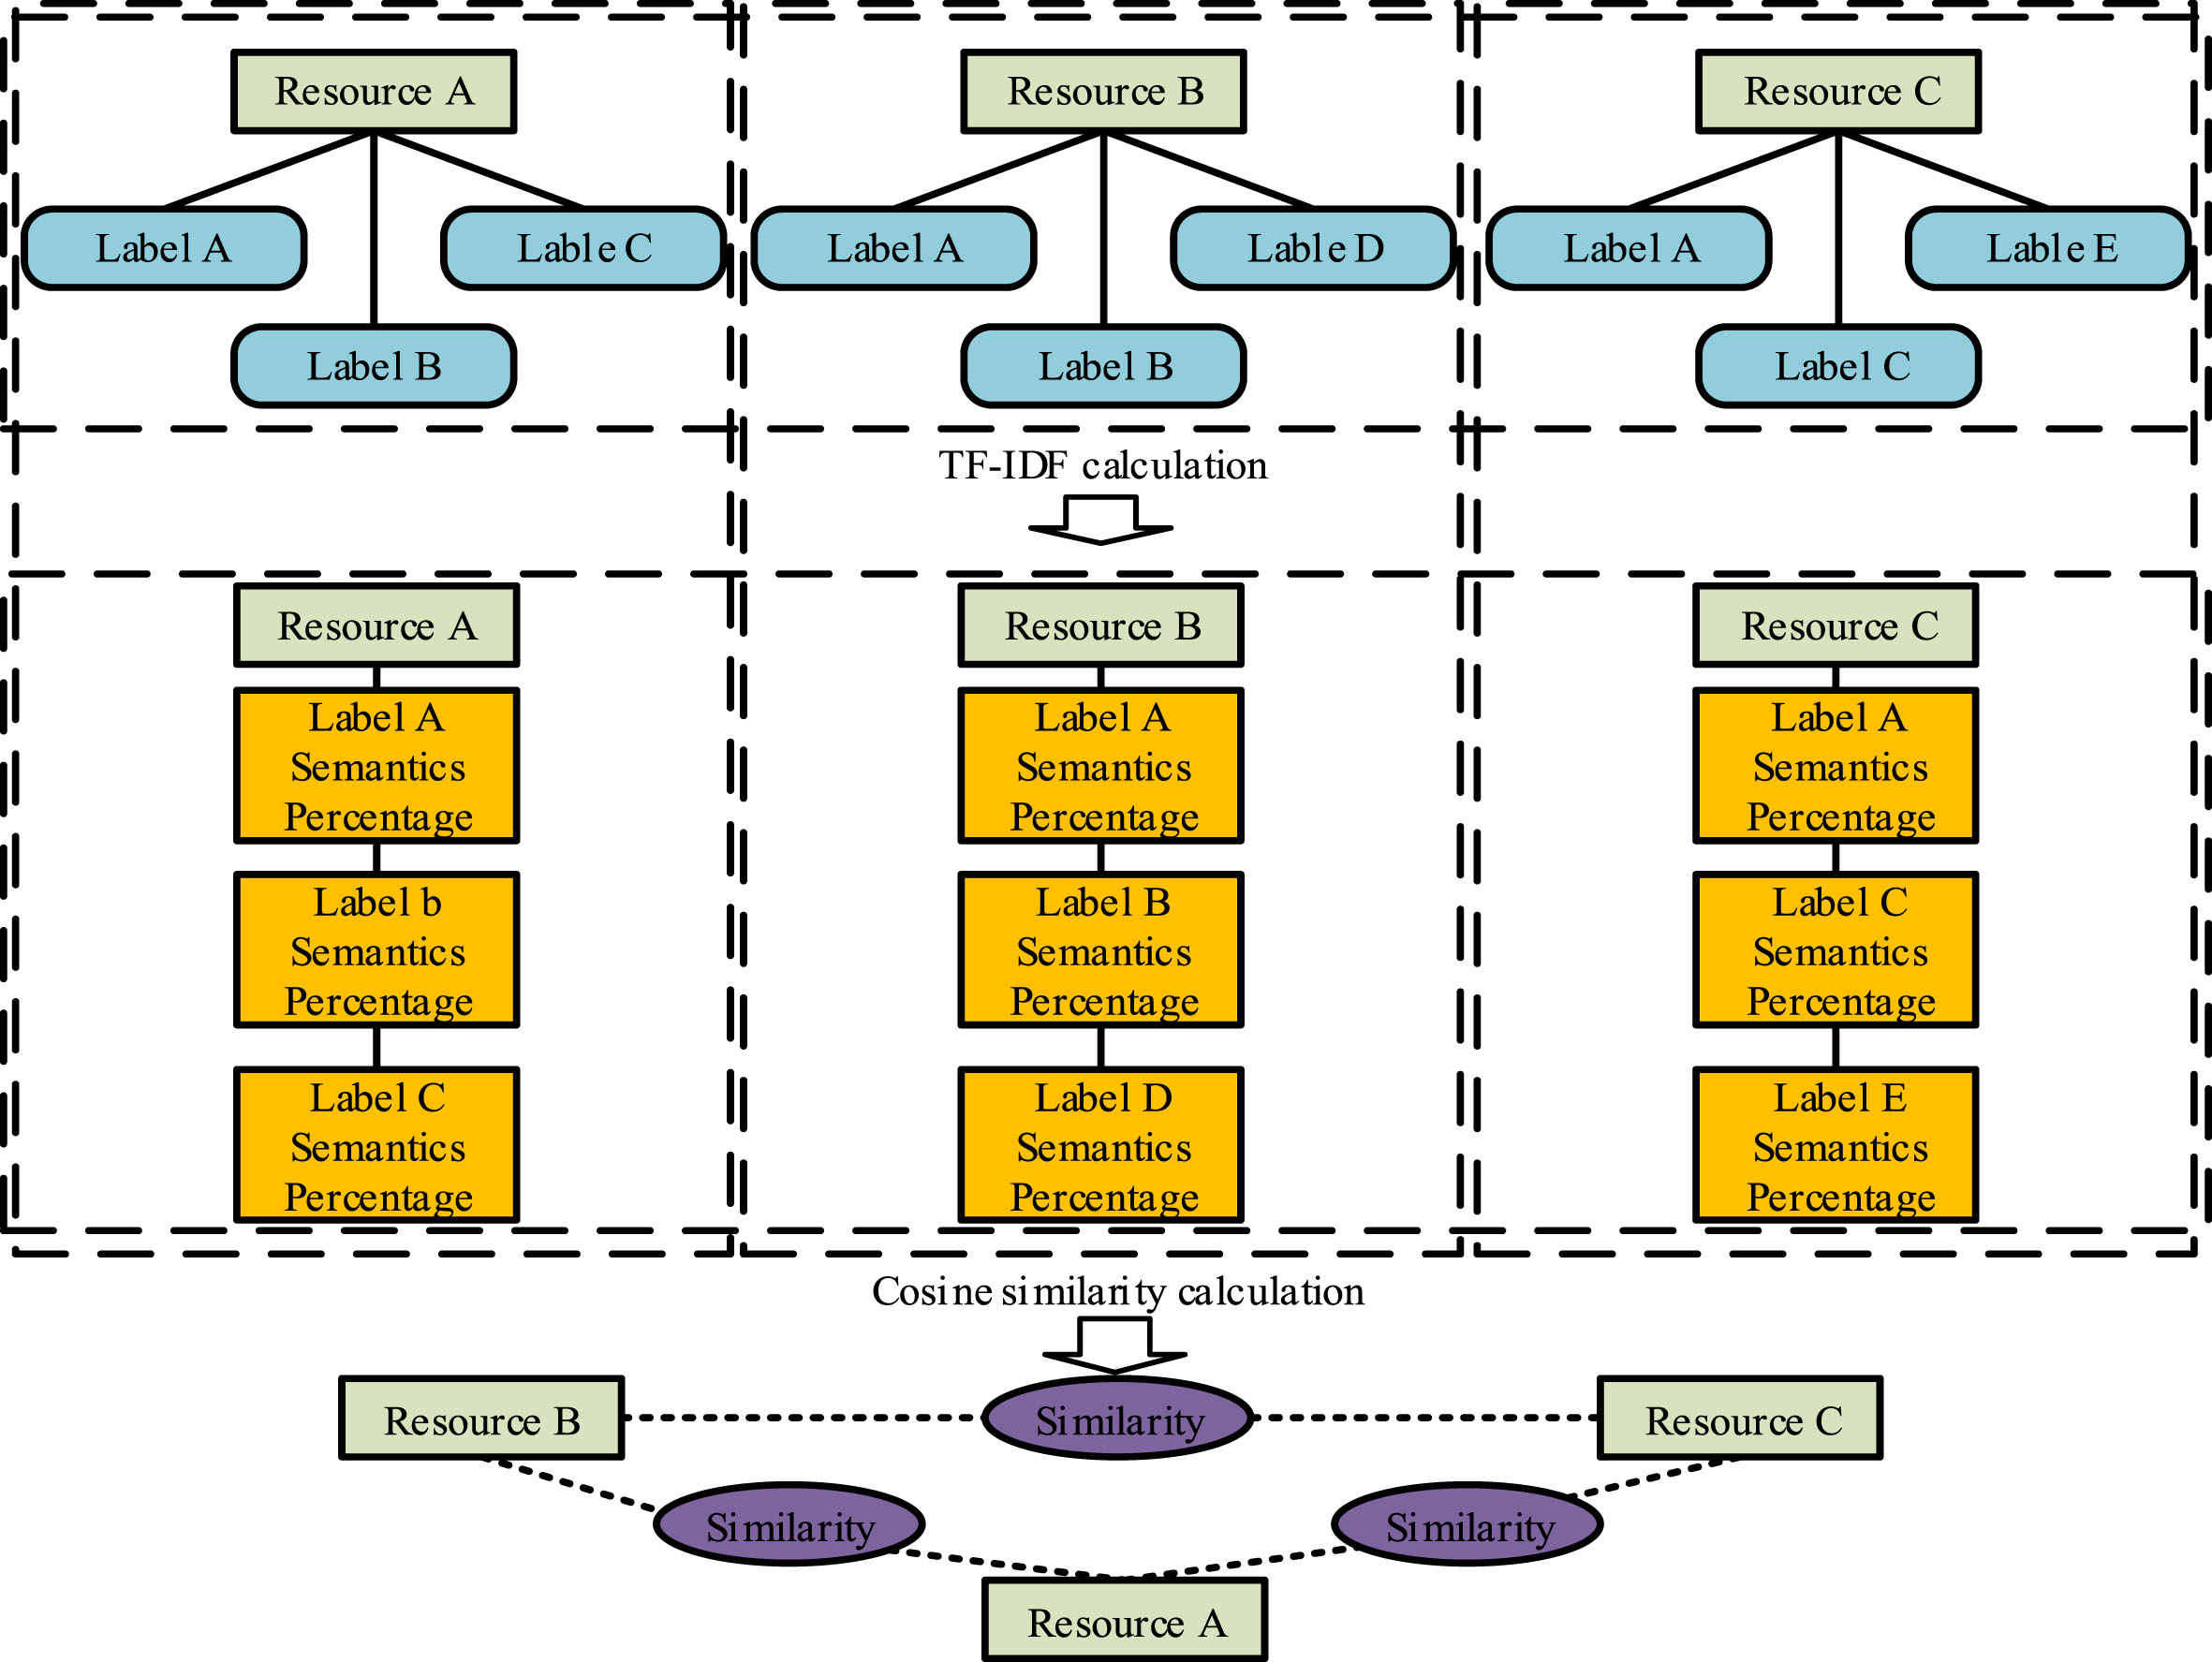
Similar Resource Recommendation Process.
As can be seen in Fig. 3, each resource’s tags are disaggregated before being entered into the word frequency inverse document frequency method, which is then used to determine the semantic share. In order to connect comparable resources and complete recommendations for similar resources, the similarity between resources is then computed using the cosine similarity technique.
A good approach for system visual communication design can improve the user’s perception when using the system and increase the efficiency of learning resource suggestion. Web learning resource recommendation requires a proper system carrier to function [24]. People are using mobile applications more and more often because of the growth of the mobile device business and communication technologies [25]. The study presents CNN for autonomous interface design, one of the deep learning algorithms with strong picture feature extraction capabilities. Equation (7) provides the calculation for the convolution layer’s output size.
In Equation (7), w1 represents the parameter, x0 represents the input variable and b0 represents the offset. Since several vectors rather than numerous numerical values frequently make up the convolution’s input, the dimension d of each vector be included into A matrix, including A filter group composed of d filters and A bias group composed of d bias. The new matrix calculation is shown in Equation (8).
In Equation (8), S represents a sequence composed of multiple values; F the filter group; B the offset group; and Rd×|s| the set of real numbers. The pooling formula is shown in Equation (9).
In Equation (9), a is the vector, and k is the number of values to be aggregated. The feature map dimensions are calculated as shown in Equation (10).
In Equation (10), Input
size
represents the input tensor size; padding
size
represents the liner size; filter
size
represents the size of filter; and stride represents the filter move step. Machine translation will be able to convert the linguistic description text into the target language. Recurrent Neural Networks (RNN), which are effective at handling generative tasks of variable length, use tanh as the activation function, as shown in Equation (11).
In Equation (11), U and W are the weight functions; b is the bias parameter; and h t represents the hidden state. The structure of the RNN is shown in Fig. 4.
The RNN’s computational process is executed in time steps, as shown in Fig. 4. The conventional single-layer neural network structure is modified by looping in the Hidden layer to create the single-layer RNN network structure. The RNN is then enlarged in time steps to create a multi-step single-layer network structure. The current input text word is used as the input for a vector containing the output of the previous time step. An operation is then carried out to extract the hidden state, and the weights are moved to the subsequent time step. Equation (12) illustrates the computation procedure used by transformer to accomplish information modelling based on attention.
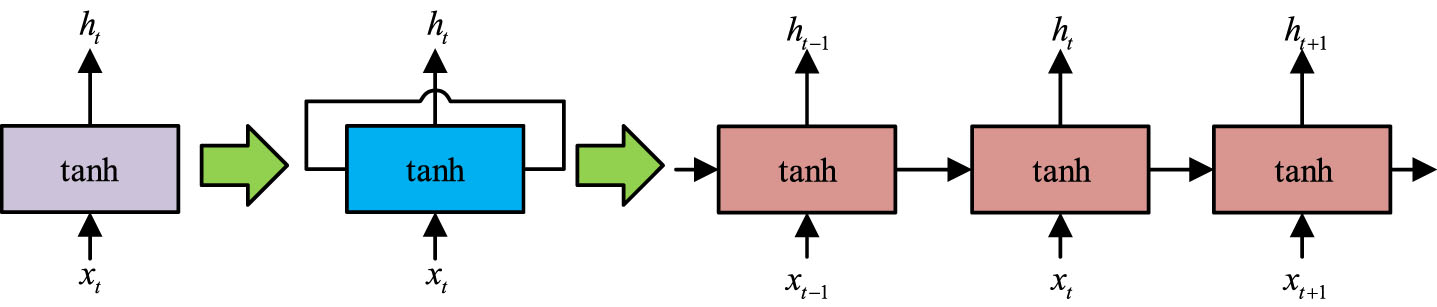
RNN structure.
In Equation (12), Q, K, V represents the three input vectors of the model at each moment; and d k represents the dimensionality of the two vectors of query, key. The study integrates CNN and Transformer into the same framework to build an interface tree generation model, as shown in Fig. 5.
As demonstrated in Fig. 5, the CNN receives a high-fidelity design image as input, and uses convolution and pooling techniques to extract and diversify the image’s interface elements. After that, the Transformer encoder recodes the spatial layout data found in the image features to create context vectors. The interface tree construction process then makes use of these context vectors along with the input text data, which includes a text sequence that represents the depth-first traversal sequence. Since the encoder requires a sequence of vectors as input, the feature map is stretched to convert its two dimensions into a vector whose length is the product of the two dimensions. Spatial location encoding is then used to preserve the spatial location data. Equation (13), which illustrates one-dimensional position encoding, is used in the encoder portion to carry out the position encoding.

CNN and Transformer Interface Tree generative model.
In Equation (13), pos represents the position data; i represents the encoding dimension; and d
model
is half of a one-dimensional value. d
model
means the different positions of rows and columns need to be encoded and stitched back to normal size before generating the spatial position encoding. When encoding spatial layout information, the zebra mapper first needs to perform a flatten operation on the feature map extracted by the CNN, perform a vector sequence transformation, and add a position encoding that preserves the spatial position information. Each layer of input is first linearly transformed three times when encoding is performed, and the three transformations do not share weight parameters, thus generating three uncorrelated tensors, and then the encoder performs a matrix product operation. After obtaining the base attention and multiplying it with value to produce the final attention weights, as shown in Equation (14).
In Equation (14), soft max() represents the soft max function; d
k
represents the dimensionality of the key and query vectors. Equation (15) shows the mean and variance calculations after concatenating the original input with the attention weights provided by the encoder and using the LayerNorm method for normalisation to the last dimension of the input data.
In Equation (15), E (a) represents the mean; Var (a) represents the variance; H represents the size of the last dimension of the input data; and a represents the size contained in the last dimension. Normalization is carried out as shown in Equation (16).
In Equation (16), eps is the number of protections against a denominator of 0; and Sublayer represents the sub-layer structure. The normalised data is then fed into the feed-forward neural network as shown in Equation (17).
In Equation (17), FFN () represents the output of the feedforward neural network; Relu () represents the Relu activation function. The normalization process is repeated, and the cycle continues until the final layer outputs the context vector. The decoder generation interface tree is built and the structure is shown in Fig. 6.
In Fig. 6, the decoder starts by tagging <sos >and is transformed by word embedding, after which positional encoding is added. The model’s convergence efficiency is increased by using real spatial text as input, and the study makes use of the Teacher forcing training technique to increase training speed and parallel efficiency. To hide text data that is not part of the current time step, a mask matrix is made. The input is subjected to linear transformation and self-attentive computation following the mask matrix. The output of the attention module is linked to the input by the establishment of residuals for the output. After matrix product operation and normalisation, the output is input into the pre-expansion neural network. A continuous loop then directs the last layer to finish the output and receive the output text. The recommendation function is inserted using the output text information to finish the interface’s visual communication design. In summary, the suggested approach for designing visual communication involves developing the system’s recommendation function first in order to identify potential user-interested content. Next, a convolutional neural network is introduced to automatically design the visual communication interface, and then machine translation is used to translate the language description text [26].
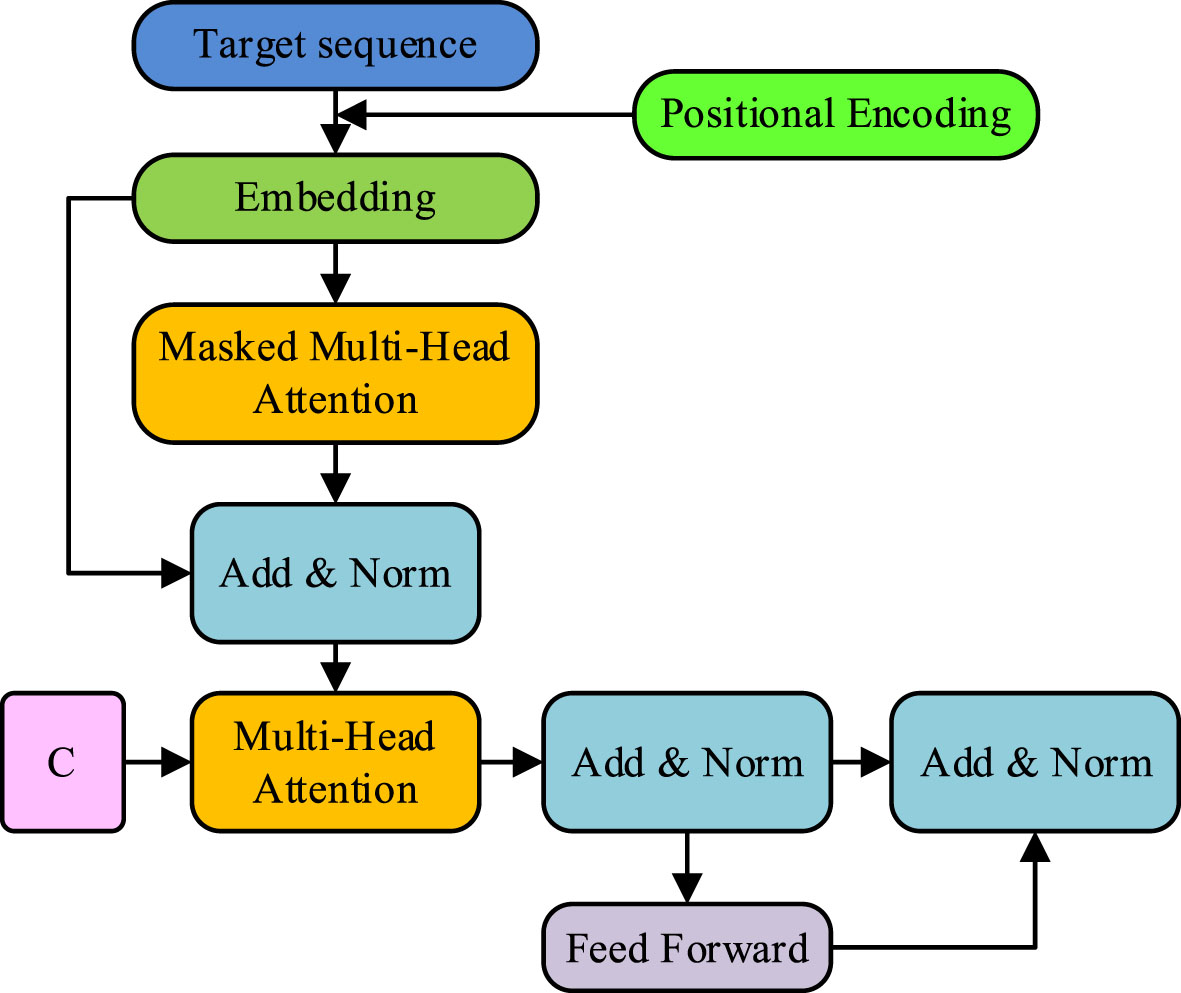
Decoder structure.
Automated visual communication design techniques can lighten the strain and boost output for designers. This section aims to evaluate the efficacy of the research technique by conducting a practical application analysis and testing its performance in creating visual communication for web learning resources.
Performance testing of a deep learning-based design approach for visual communication of web learning resources
Performance tests and application analysis were carried out on the research technique, and the usefulness of the visual communication design approach created for the study in the design of visual communication for web learning resources was examined. In order to evaluate the study method’s performance with that of ResNet34 and DCRNS, performance tests were initially carried out on the research method utilising a neural network framework of Pytorch 1.6 and parallel computing frameworks of CUDA10.1 and CUDMN 7.6. Figure 7 illustrates the initial testing of the loss values during the research method’s training.
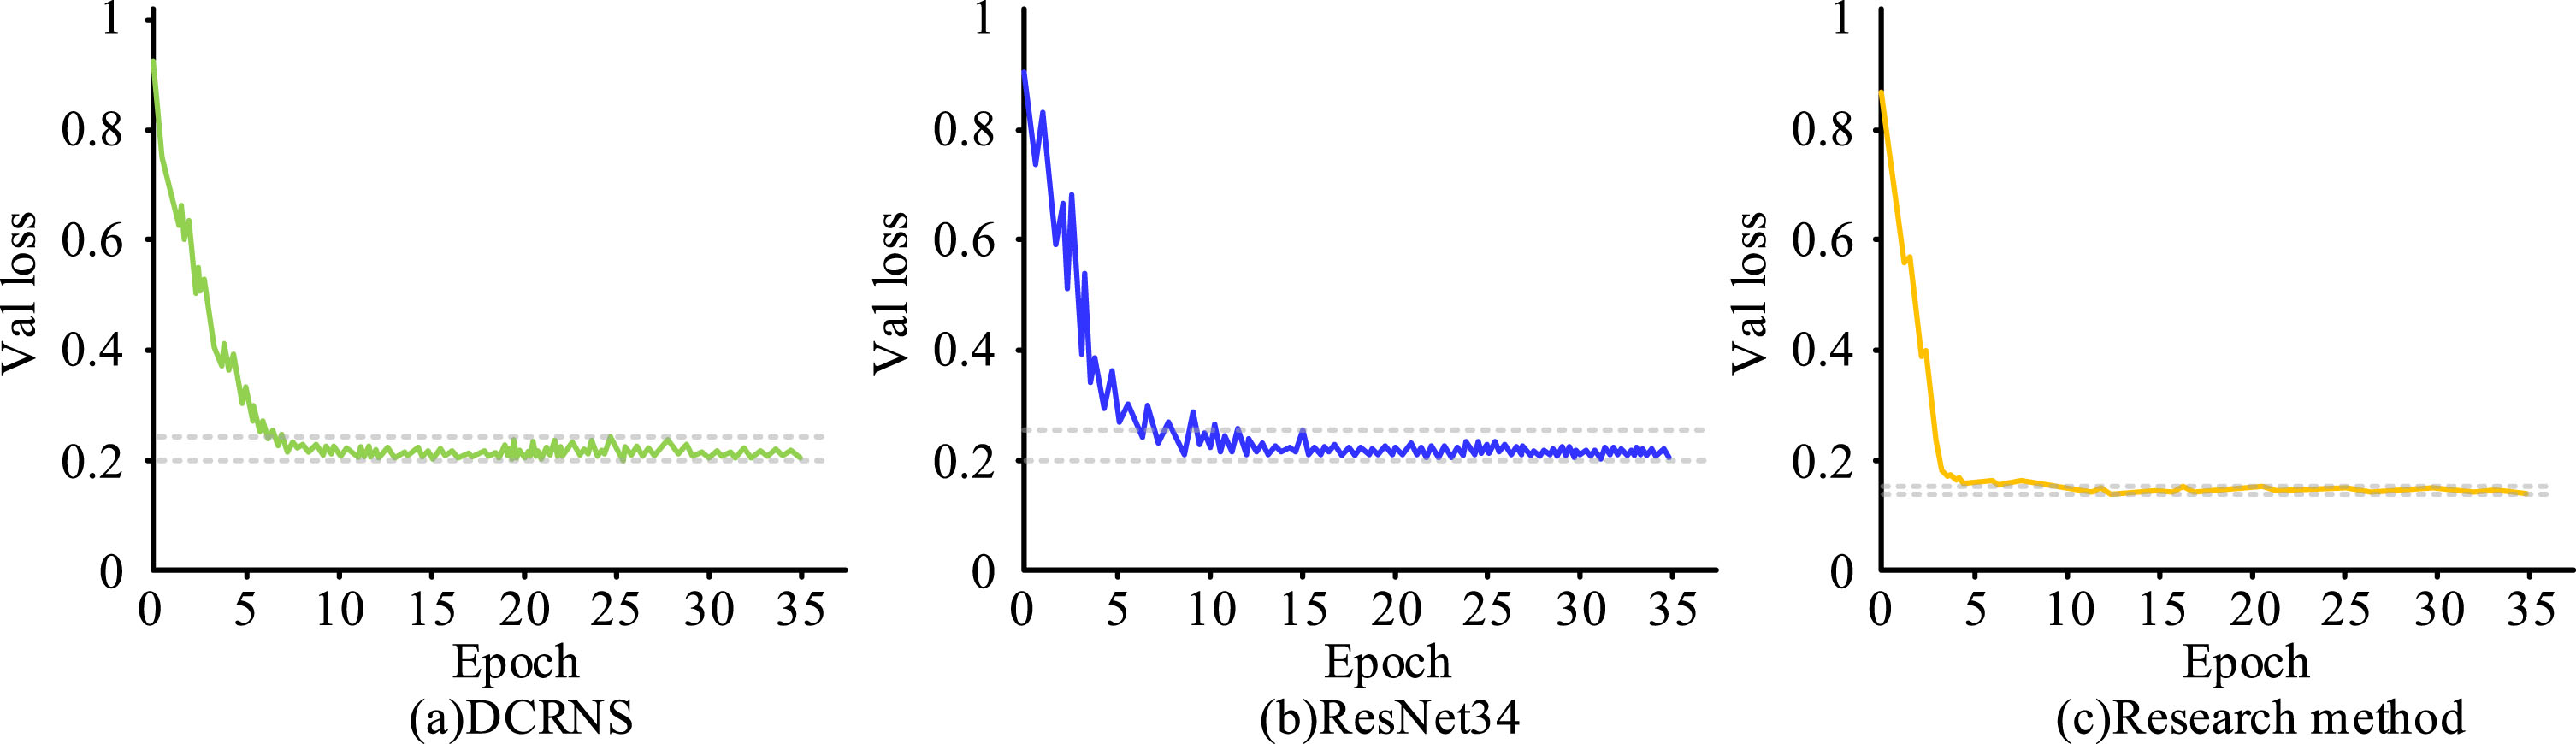
Loss curve.
Figure 7 illustrates how the loss values for all three approaches decrease quickly in the early iterations before stabilising in a brief period after training. At the sixth iteration, the DCRNS stabilises at a value that varies between 0.2–0.24, with only minor changes in the curve during the decline. After around ten iterations, the ResNet34 approach stabilises at a value of 0.2–0.25, with recurrent strong swings in the curve during the decrease. The loss value ranges between 0.2–0.25 after stabilisation, with the curve exhibiting frequent significant changes along the fall. The study approach stabilised at the fourth iteration, with sporadic minor variations in the curve value during the fall and a fluctuating loss value between 0.14 and 0.16 following stabilisation. This suggests that the training effect and iterative performance of the research approach are superior. Figure 8 displays the results of testing the research method’s running time.

Run time.
As seen in Fig. 8, at runtime, the runtimes for all three methods increase with the sharpness of the interface. In the colour-free environment, the DCRNS has a runtime of approximately 3.1 s at 480 p definition, increasing to approximately 33.2 s at 4 k definition; the ResNet34 method has a runtime of approximately 4.3 s at 480 p definition, increasing to approximately 24.2 s at 4 k definition; and the study method has a runtime of approximately 2.8 s at 480 p definition, increasing to approximately 15.8 s at 4 k definition. In the colour environment, the DCRNS has a running time of about 8.7 s at 480 p and increases to about 70 s at 4 k; the ResNet34 method has a running time of about 16.2 s at 480 p and increases to about 53.1 s at 4 k; and the ResNet34 method has a running time of about 16.2 s at 480 p and increases to about 53.1 s at 4 k. This indicates that the research method has a faster visual communication design speed.
The F1 values for the study method were tested and are shown in Fig. 9.

F1 score.
According to Fig. 9(a), in the uncoloured environment, the F1 value for the DCRNS is approximately 0.24 at a recommended list length of 5 and increases to approximately 0.62 as the recommended list length grows to 35; the F1 value for the ResNet34 method is approximately 0.27 at a recommended list length of 5 and increases to approximately 0.79 as the recommended list length grows to 35; and the F1 value for the Research method is approximately 0.31 at a recommended list length of 5 and increases to approximately 0.87 as the recommended list length grows to 35. As seen in Fig. 9(b), in the coloured environment, the F1 value for the DCRNS is about 0.24 at a recommended list length of 5 and increases to about 0.56 at a recommended list length of 35. The F1 value for the ResNet34 method is about 0.28 for the recommended list length of 5 and increases to about 0.79 for the recommended list length of 35; the F1 value for the research method is about 0.30 for the recommended list length of 5 and increases to about 0.89 for the recommended list length of 35. and recall to a higher equilibrium with better model performance. The greedy search effect of the research method was tested as shown in Table 1.
Greedy search effect
As can be observed from Table 1, the research method outperforms the other approaches in terms of perfect match rate (70.44%) and BLEU rate (93.21%); on the other hand, the average Levenstein edit distance (3.09) and average tree edit distance (2.31) are both lower. It suggests that the created text sequences can be closed more smoothly and that the research method’s translator performance can perform better.
The research methodology was applied to the design of a school Web learning resource sharing site page through an application analysis. This involved creating an interface that would function in a WebKit kernel browser and importing an image package with 60k images as the material package. Figure 10 illustrates the production of solutions utilising the research process.
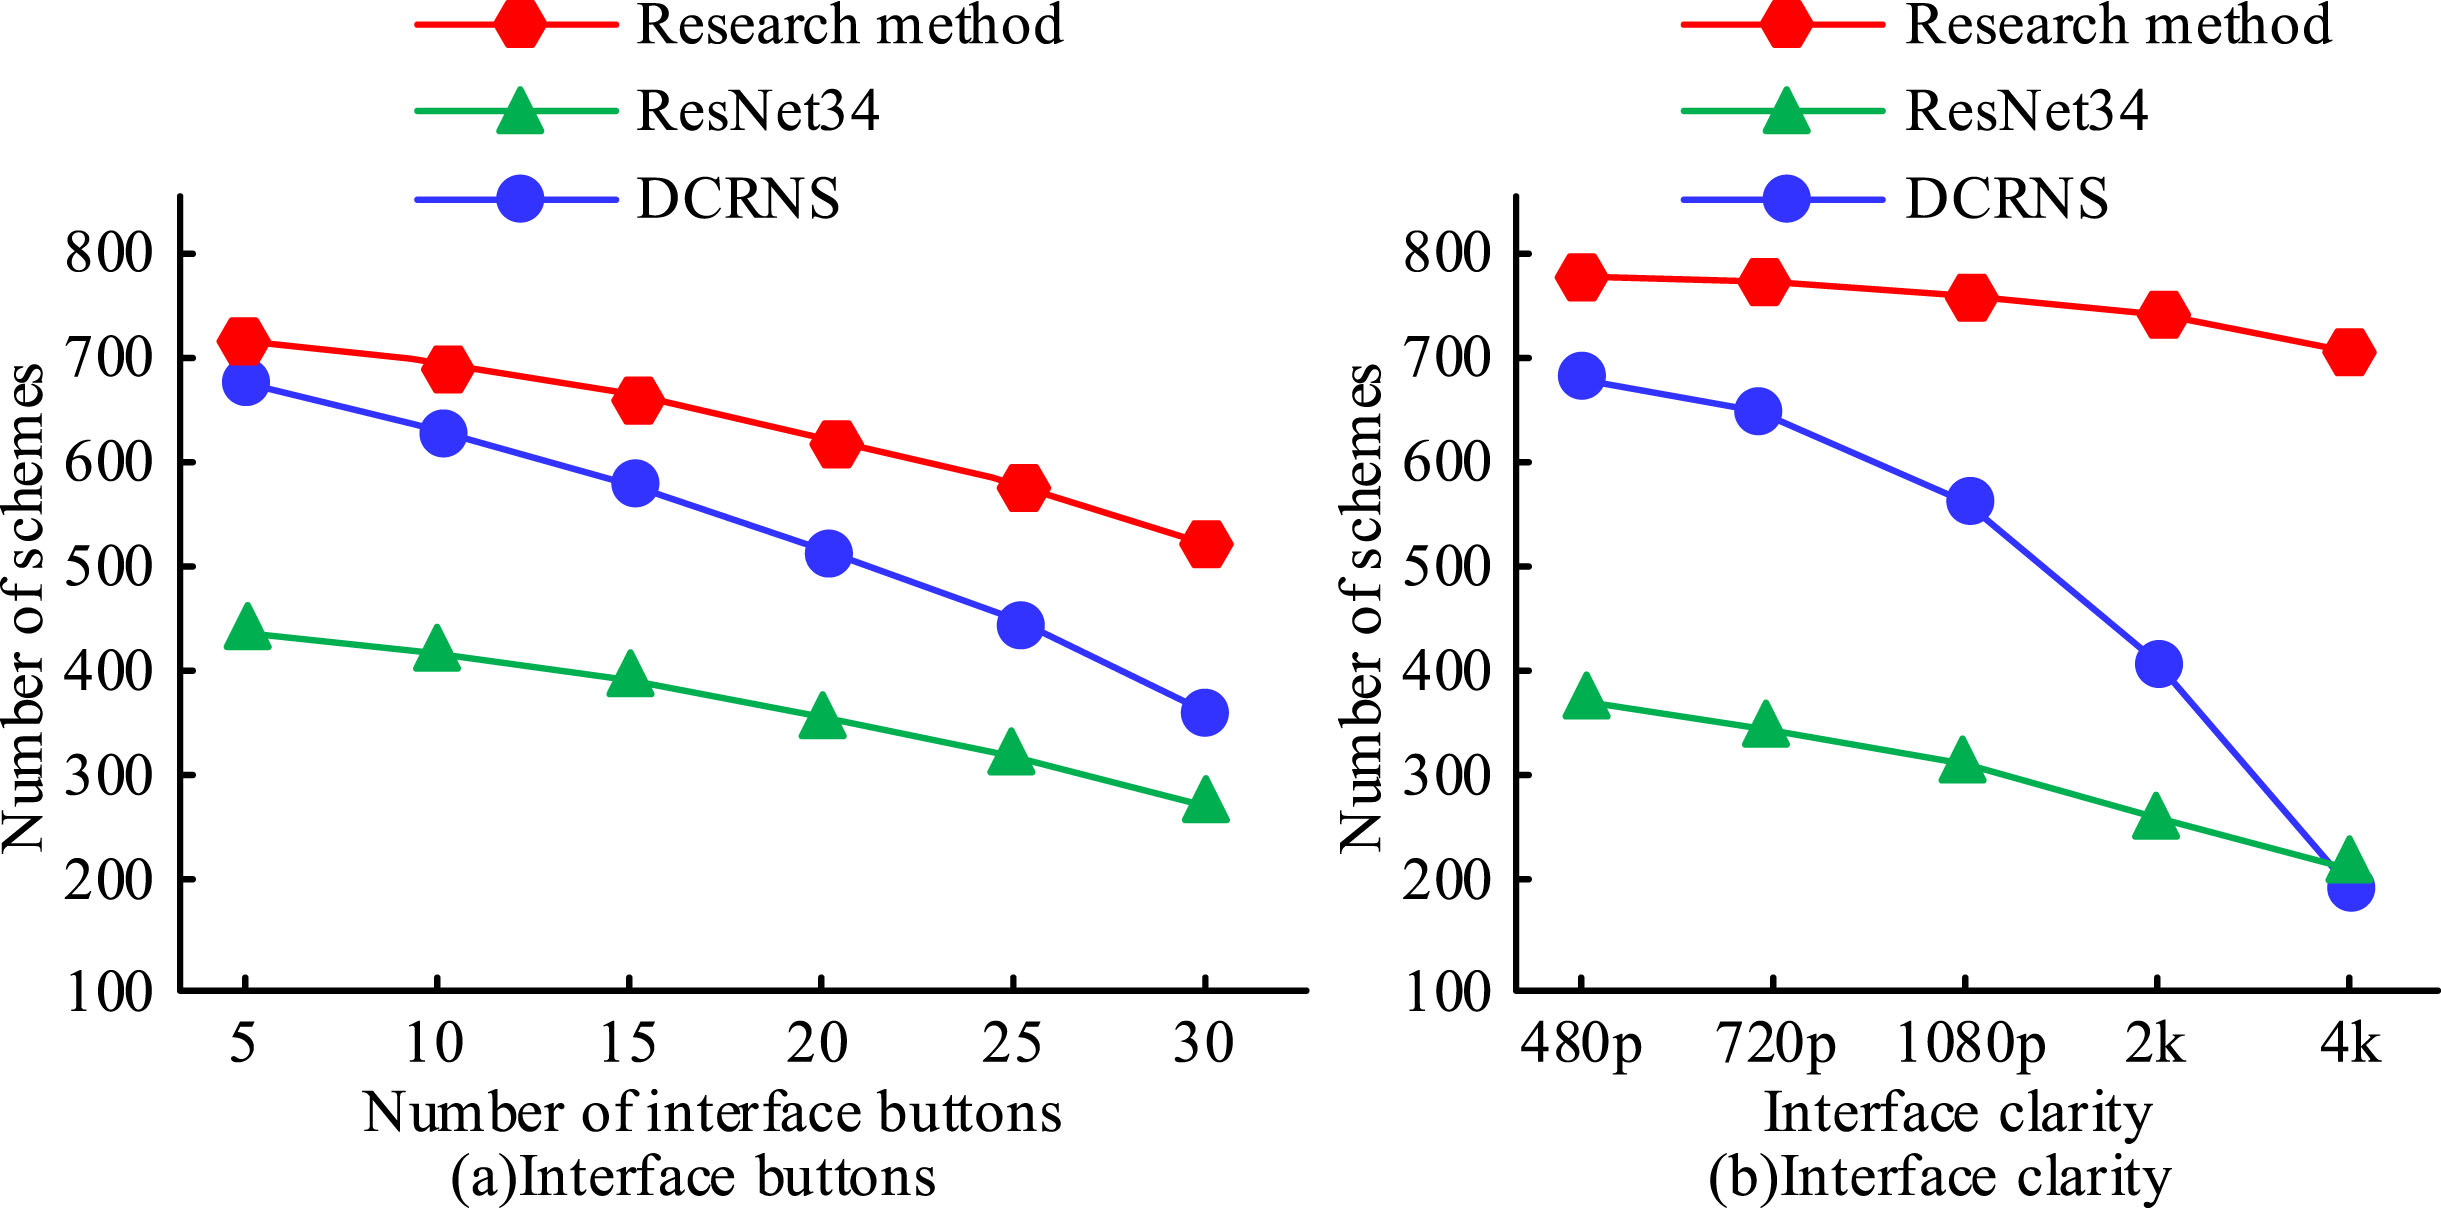
Number of generated schemes.
When there are five buttons, the DCRNS creates 687 interface possibilities; when there are thirty buttons, the number of interface solutions decreases to 362. When there are five buttons, the ResNet34 approach produces 434 interface solutions; when there are thirty buttons, the number of interface solutions decreases to 271. There are only 271 interface solutions when the number of buttons is increased to 30. When there are five buttons, the Research approach produces 721 interface solutions; when there are thirty buttons, the number of interface solutions drops to 526. The DCRNS generates 689 interface solutions at a resolution of 480 p when generating interfaces of different resolutions, as shown in Fig. 10(b). When the resolution is increased to 4 k, the number of generated interface solutions drops to 187. When the resolution is increased to 4 k, the number of interface solutions produced by the ResNet34 approach drops to 219 from 372 at 480 p. When the specification was expanded to 4 k, the research approach produced 773 interface solutions in 480 p, which decreased to 702 at that resolution. The study technique has a higher ability to extract information from the material package and has better orchestration performance when executing solution production, as evidenced by the high number of solutions it generated and the moderate fall in the number of solutions. Figure 11 illustrates how the final, extracted best visual communication solutions were used in practise and learner assessment data was gathered.

Learner evaluation of the use of the visual system.
As can be seen from Fig. 11, the satisfaction indicators of the Web learning resource sharing site page generated using the research method are comparable to those of the original page, and most of them have increased. The biggest increase is 14% for the satisfaction with the recommended content; the only indicator that has not increased is 93% for the satisfaction with the course length. The interface graphics received the highest level of satisfaction (99%) among the pages developed by the study approach, while the working logic received the lowest level of pleasure (90%). This suggests that the research methodology was successful in producing visually appealing Web learning resource sites that satisfied learners through visual communication designs. To verify the reliability of the results, the significance of the above experiments was tested. The test results showed that the p-value of this experiment was less than 0.05.
According to Fig. 12, with the increase of learning time, the learning investment of learners using each model gradually decreased. The input of ResNet34 decreased from 75.4% to 60.3%, DCRNS from 74.8% to 58.6%, and the input of research methods decreased from 90.8% to 84.3%. It can be seen that research methods can effectively improve learners’ learning input.
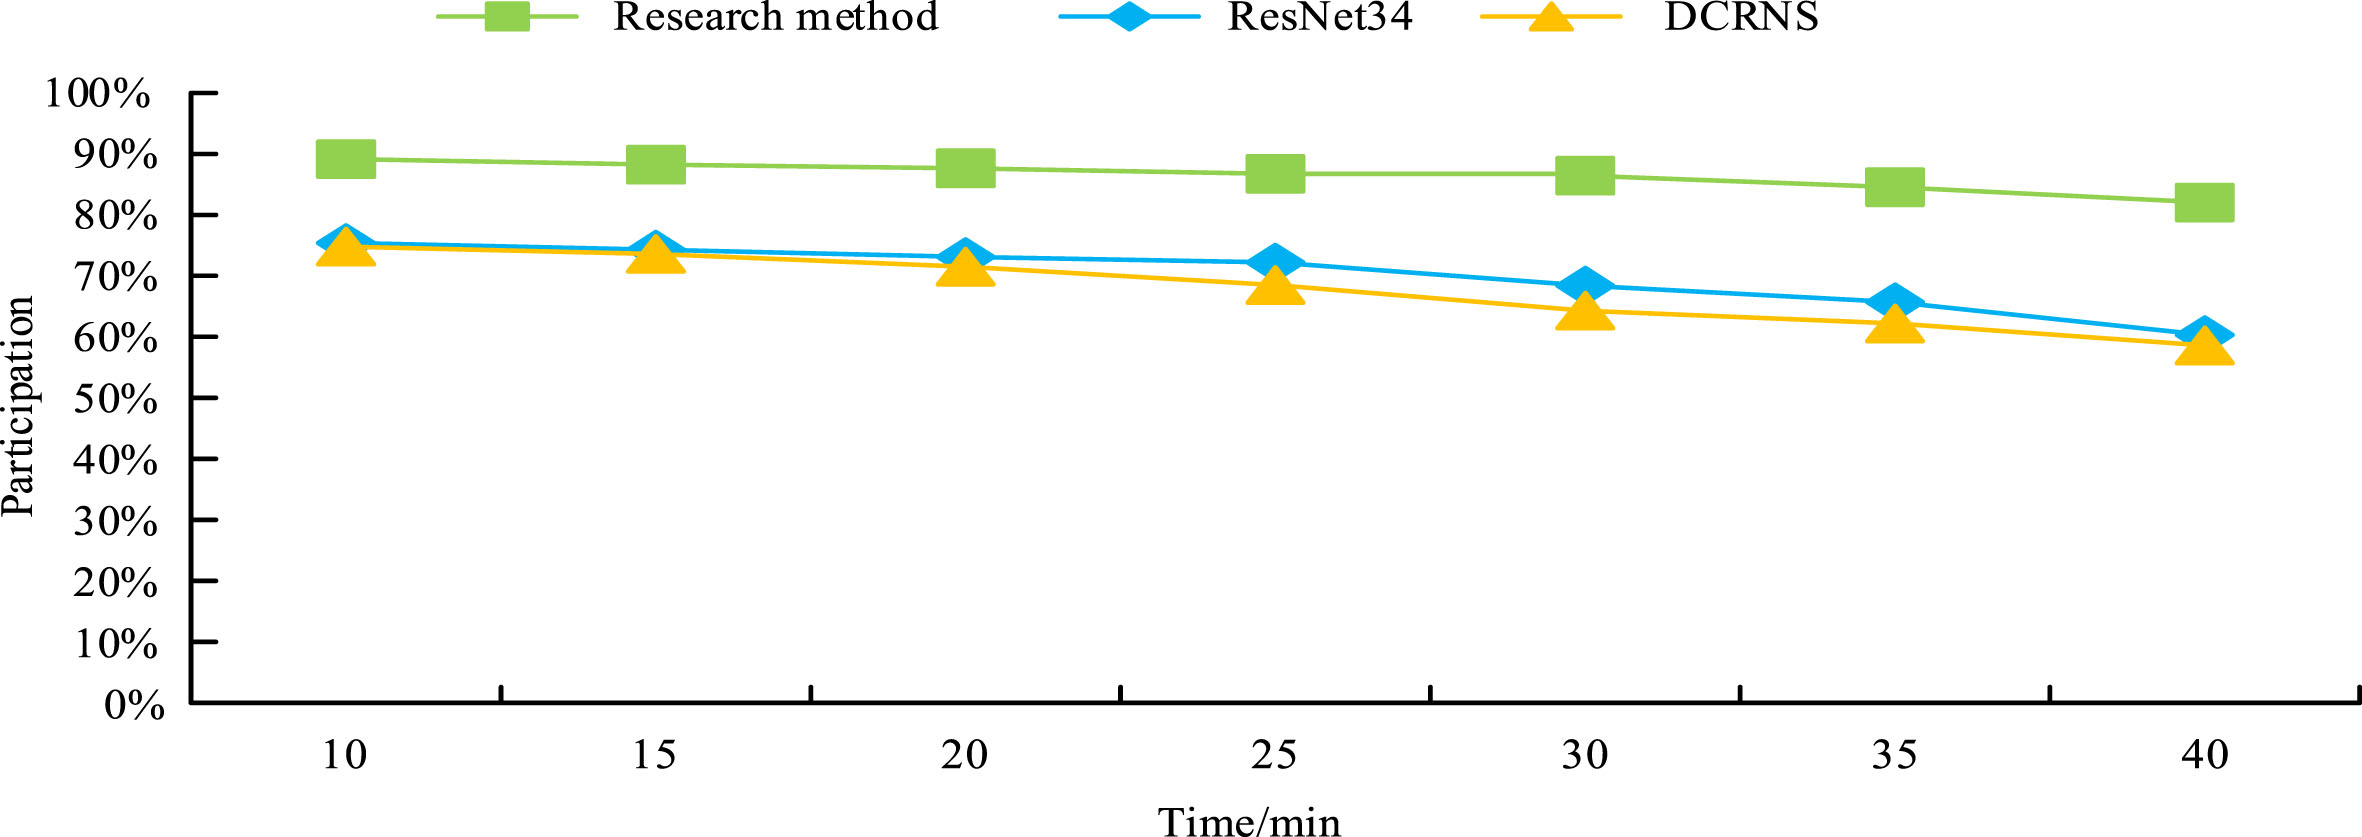
Learner engagement with visual learning materials.
In the context of the digital web era, the research proposes an an automatic design strategy for visual communication of web learning resources based on deep learning to improve their dissemination. Combining an implicit semantic algorithm with a recommendation algorithm creates a recommendation model for learning resources. After using RNN to solve the text language description problem in machine translation, Transformer is fused with RNN to complete the interface tree generating model. The results of the experiment indicate that the research method drops below 0.2 in the loss value test after just four iterations; in the runtime test, the research method takes approximately 15.8 seconds for 4 k resolution without colour and 8.4 seconds for 480 p resolution in colour, which is less than other methods; in the F1 value test in the colour environment, the research method’s F1 value drops below 0.2 when the recommended list length reaches The research method produced 702 interface solutions in 4 k resolution for the actual solution generation test; the maximum improvement of the visual communication design satisfaction index of the research method was 14%. In the greedy search effect test, the research method achieved an exact match rate of 70.44% and a BLEU rate of 93.21%. In the F1 value test in colour, the research method’s F1 value was 0.89 when the length of the recommendation list reached 35. These findings demonstrate that the study methodology performs well in terms of design speed and model performance when it comes to the visual communication design of Web learning resources, and the solutions produced can satisfy the needs of real-world applications. Since the study was limited to a single browser kernel, it is challenging to assess the framework’s performance across different browser cores. Therefore, the compatibility of this framework needs to be developed to ensure its performance in multiple browser cores.
Funding
This study was supported by Program for the Philosophy and Social Sciences Research of Higher Learning Institutions of Shanxi and the Study of Visual Innovative Design on the Vinegar Culture of Shanxi (NO. 2020W234).