
Abstract
Accurate segmentation of knee cartilage in MR images is crucial for early diagnosis and treatment of knee conditions. Manual segmentation is time-consuming, leading researchers to explore automatic deep learning methods. However, the choice between 2D and 3D networks for organ segmentation remains debated. In this paper, we propose a hybrid 2D and 3D deep neural network approach, named UVNet, which combines the strengths of both techniques to enhance segmentation performance. Within this network structure, the 3D segmentation network serves as the backbone for feature extraction, while the 2D segmentation network functions as an information supplement network. Local and global MIP images are generated by employing various maximum intensity projection modes of knee MRI volumes as input for the information supplement network. By constructing a local and global MIP feature fusion module, the supplementary information obtained from the 2D segmentation network is fully integrated into the backbone network. We assess the quality of the proposed method using the Osteoarthritis Initiative (OAI) dataset and the 2010 Grand Challenge Knee Image Segmentation (SKI-10) dataset, comparing it to the Baseline Network and other advanced 2D and 3D segmentation methods. The experiments demonstrate that UVNet achieves competitive performance in the aforementioned two cartilage segmentation tasks.
Introduction
The knee joint is the largest and most complex joint in the human body. Abnormal changes in the knee joint may indicate the onset of diseases, such as degenerative changes in knee cartilage. Osteoarthritis (OA) is a prevalent degenerative joint disease, affecting a substantial number of individuals [1]. OA is a major cause of morbidity and disability, resulting in considerable socioeconomic costs. In 2004, arthritis was estimated to cost the United States $336 billion, or 3% of gross domestic product [2, 3].
OA is a complex, heterogeneous condition that commonly causes disability in the aging population [4, 5]. Since joint tissue damage is irreversible, early diagnosis is critical for patients in the early stages of osteoarthritis development. While OA damages all joint tissues, cartilage degeneration is the hallmark [6, 7]. Studies have shown that the morphometric assessment of cartilage structure, such as volume, thickness, and area, via MR images provides an accurate and precise measure of OA progression [8, 9]. Consequently, precise segmentation of knee cartilage tissue has become a critical step in knee image analysis. But a major hurdle to quantifying cartilage outcomes from MRI scans is the lack of resources necessary for tissue segmentation [10]. It may take up to 6 hours for a clinical reader to manually segment each series of 3-dimensional (3D) knee MR images [11]. In the process of extensive segmentation, professionals may also make some inevitable mistakes.
Deep learning-based automatic segmentation technology has attracted a lot of attention recently since it can automatically learn features. Deep convolutional neural networks with an encoder-decoder architecture have produced outstanding results in a variety of medical picture segmentation applications since the introduction of U-Net [12]. However, the encoder requires multiple downsampling operations to capture deep semantic information, which leads to a significant loss of information and consequently affects the segmentation accuracy. The purpose of this study is to propose a hybrid 2D and 3D CNN framework named UVNet for the automatic segmentation of knee joint cartilage from MRI data. In medical image segmentation methods, 2D approaches focus more on the details of individual slices and require fewer resources, while 3D approaches can capture global context. We aim to leverage the strengths of both methods to alleviate the issue of information loss caused by downsampling. In UVNet, 3D V-Net [13] is used for feature extraction from the 3D volume, and 2D U-Net extracts features from local and global Maximum Intensity Projection (MIP) images as supplementary information. These supplementary information sources are fused with the main network through a feature fusion module to compensate for the information loss due to downsampling. Therefore, during the training process of the 3D network, shape and location information extracted by the 2D network can assist in the segmentation of knee joint cartilage structures. In summary, we make the following three contributions:
(1) We propose a hybrid network, the UVNet, which employs V-Net as the 3D backbone network and U-Net as the information supplement subnetwork. This hybrid network architecture, which combines different dimensional segmentation methods, integrates the advantages of both 2D and 3D networks. Experimental results indicate that its segmentation performance exceeds that of independent 2D or 3D segmentation networks (refer to Table 5).
(2) Additionally, we introduced a more effective approach for the application of MIP (Maximum Intensity Projection) images. By combining local and global MIP images, U-Net can obtain additional shape and positional information to compensate for the information loss caused by downsampling in V-Net. Based on the characteristics of local and global MIP features, we also proposed different feature fusion modules.
(3) Our method merges the segmentation features of 2D and 3D convolutional networks, thereby enhancing the performance of network segmentation. Experiments conducted on the OAI-ZBI and SKI-10 datasets reveal that our method outperforms other traditional segmentation methods across various evaluation metrics.
Related works
Knee joint segmentation method
Recently, deep convolutional neural networks have achieved achievements in biological image processing tasks such as classification [14] and segmentation [15–17]. Meanwhile, U-Net-like structures have been widely used in knee joint segmentation tasks. For the segmentation task of key knee joint structures, Woo et al. [18] combined anomaly information detection with the segmentation task for the first time. First, anomaly information is extracted using U-Net for knee MRI and then added to the downstream segmentation task to assist segmentation. Mao et al. [19] also proposed a similar two-stage knee segmentation network. First, significance detection was performed to obtain different bone structure location regions, and then two U-Net networks were used to segment different bone structure regions independently. For the first time, Chen et al. [20] suggested using adversarial loss to enhance the segmentation of bone structure images after resampling. In addition, a recovery network was used to restore the bone structure to its pre-sampling resolution. Meanwhile, Ambellan et al. [21] employed a CNN to locate the bone surface in the first stage, followed by the use of SSM to refine the segmentation by CNN and a smaller 3D-CNN for sub-volume segmentation. The above multi-stage segmentation methods bring segmentation performance improvements while increasing computational complexity.
There is a general problem of category imbalance in medical images, and this problem is more worthy of attention in knee images. To address this problem, Lee et al. [22] proposed a do-differential segmentation network that first segments the bone and cartilage complex (BCC) and then the bone. Cartilage is obtained by subtracting bone from BCC. This avoids segmenting the cartilage directly and alleviates the problem of category imbalance in the segmentation task. Dai et al. [23], on the other hand, proposed a new loss function to solve the problem of category imbalance in images. In addition, the method uses a compact convolutional network to reduce the computational complexity so that the 3D knee images can be fed more completely into the network. Similarly, Raj et al. [24] proposed a multi-category loss function to obtain more accurate segmentation of different types of cartilage.
There are also some researchers who hope to find better segmentation methods than U-Net. Sun et al. [25] explored the effect of replacing the standard convolutional blocks in U-Net [12] and DeepLabv3plu [26] with different blocks such as residual block, residual SE block, dense block, and dense SE block on the task of knee image segmentation and found that the variant using SE block has better feature capturing capability. Sengar et al. [27] utilized a knee joint dataset to assess variants of the U-Net architecture, such as U-Net++ [28] and U-Net3+ [29], from various angles, tasks, and embedding methods. Their objective was to obtain a superior and more widely applicable alternative to U-Net. Kessler et al. [30] applied conditional generative adversarial networks (cGANs) [31] for the first time to the segmentation of knee MRI and compared them with U-Net in various aspects, and they concluded that cGANs networks have better robustness. Kessler et al. [32] used the 3D-CaSM [33] method to extract accurate regional measurements of cartilage morphology on 2D and 3D U-Net segmented knee masks. More et al. [34] proposed the “Discrete-MultiResUNet”, which combines the Discrete Wavelet Transform (DWT) and the MultiResUNet architecture and is more effective in extracting salient features for key tissue segmentation. Overall, the UNet-like method has been shown to be effective in knee segmentation tasks. It is worth noting that U-Net downsampling results in the loss of feature information, which is also present in the other UNet-like methods mentioned above. However, this problem has not been given enough attention.
Method
In this section, we introduce our proposed multidimensional network structure system for medical image segmentation framework, UVNet. The overall structure is shown in Fig. 1, which consists of two network branches: a backbone feature extraction network, V-Net, and an information supplementation network, U-Net. The V-Net takes the knee MRI volumes as input and the pixel-by-pixel probabilistic map as output. The U-Net, on the other hand, uses local and global MIP maps extracted from MRI volumes as input. Additional information is supplemented by fusing the MIP feature maps with the hierarchical feature maps of the V-Net through the feature fusion module. This work has been inspired to some extent by [35]. In the next three sections, we explain the backbone and information supplementation network structure, the local and global MIP extraction strategy, and the feature fusion module.
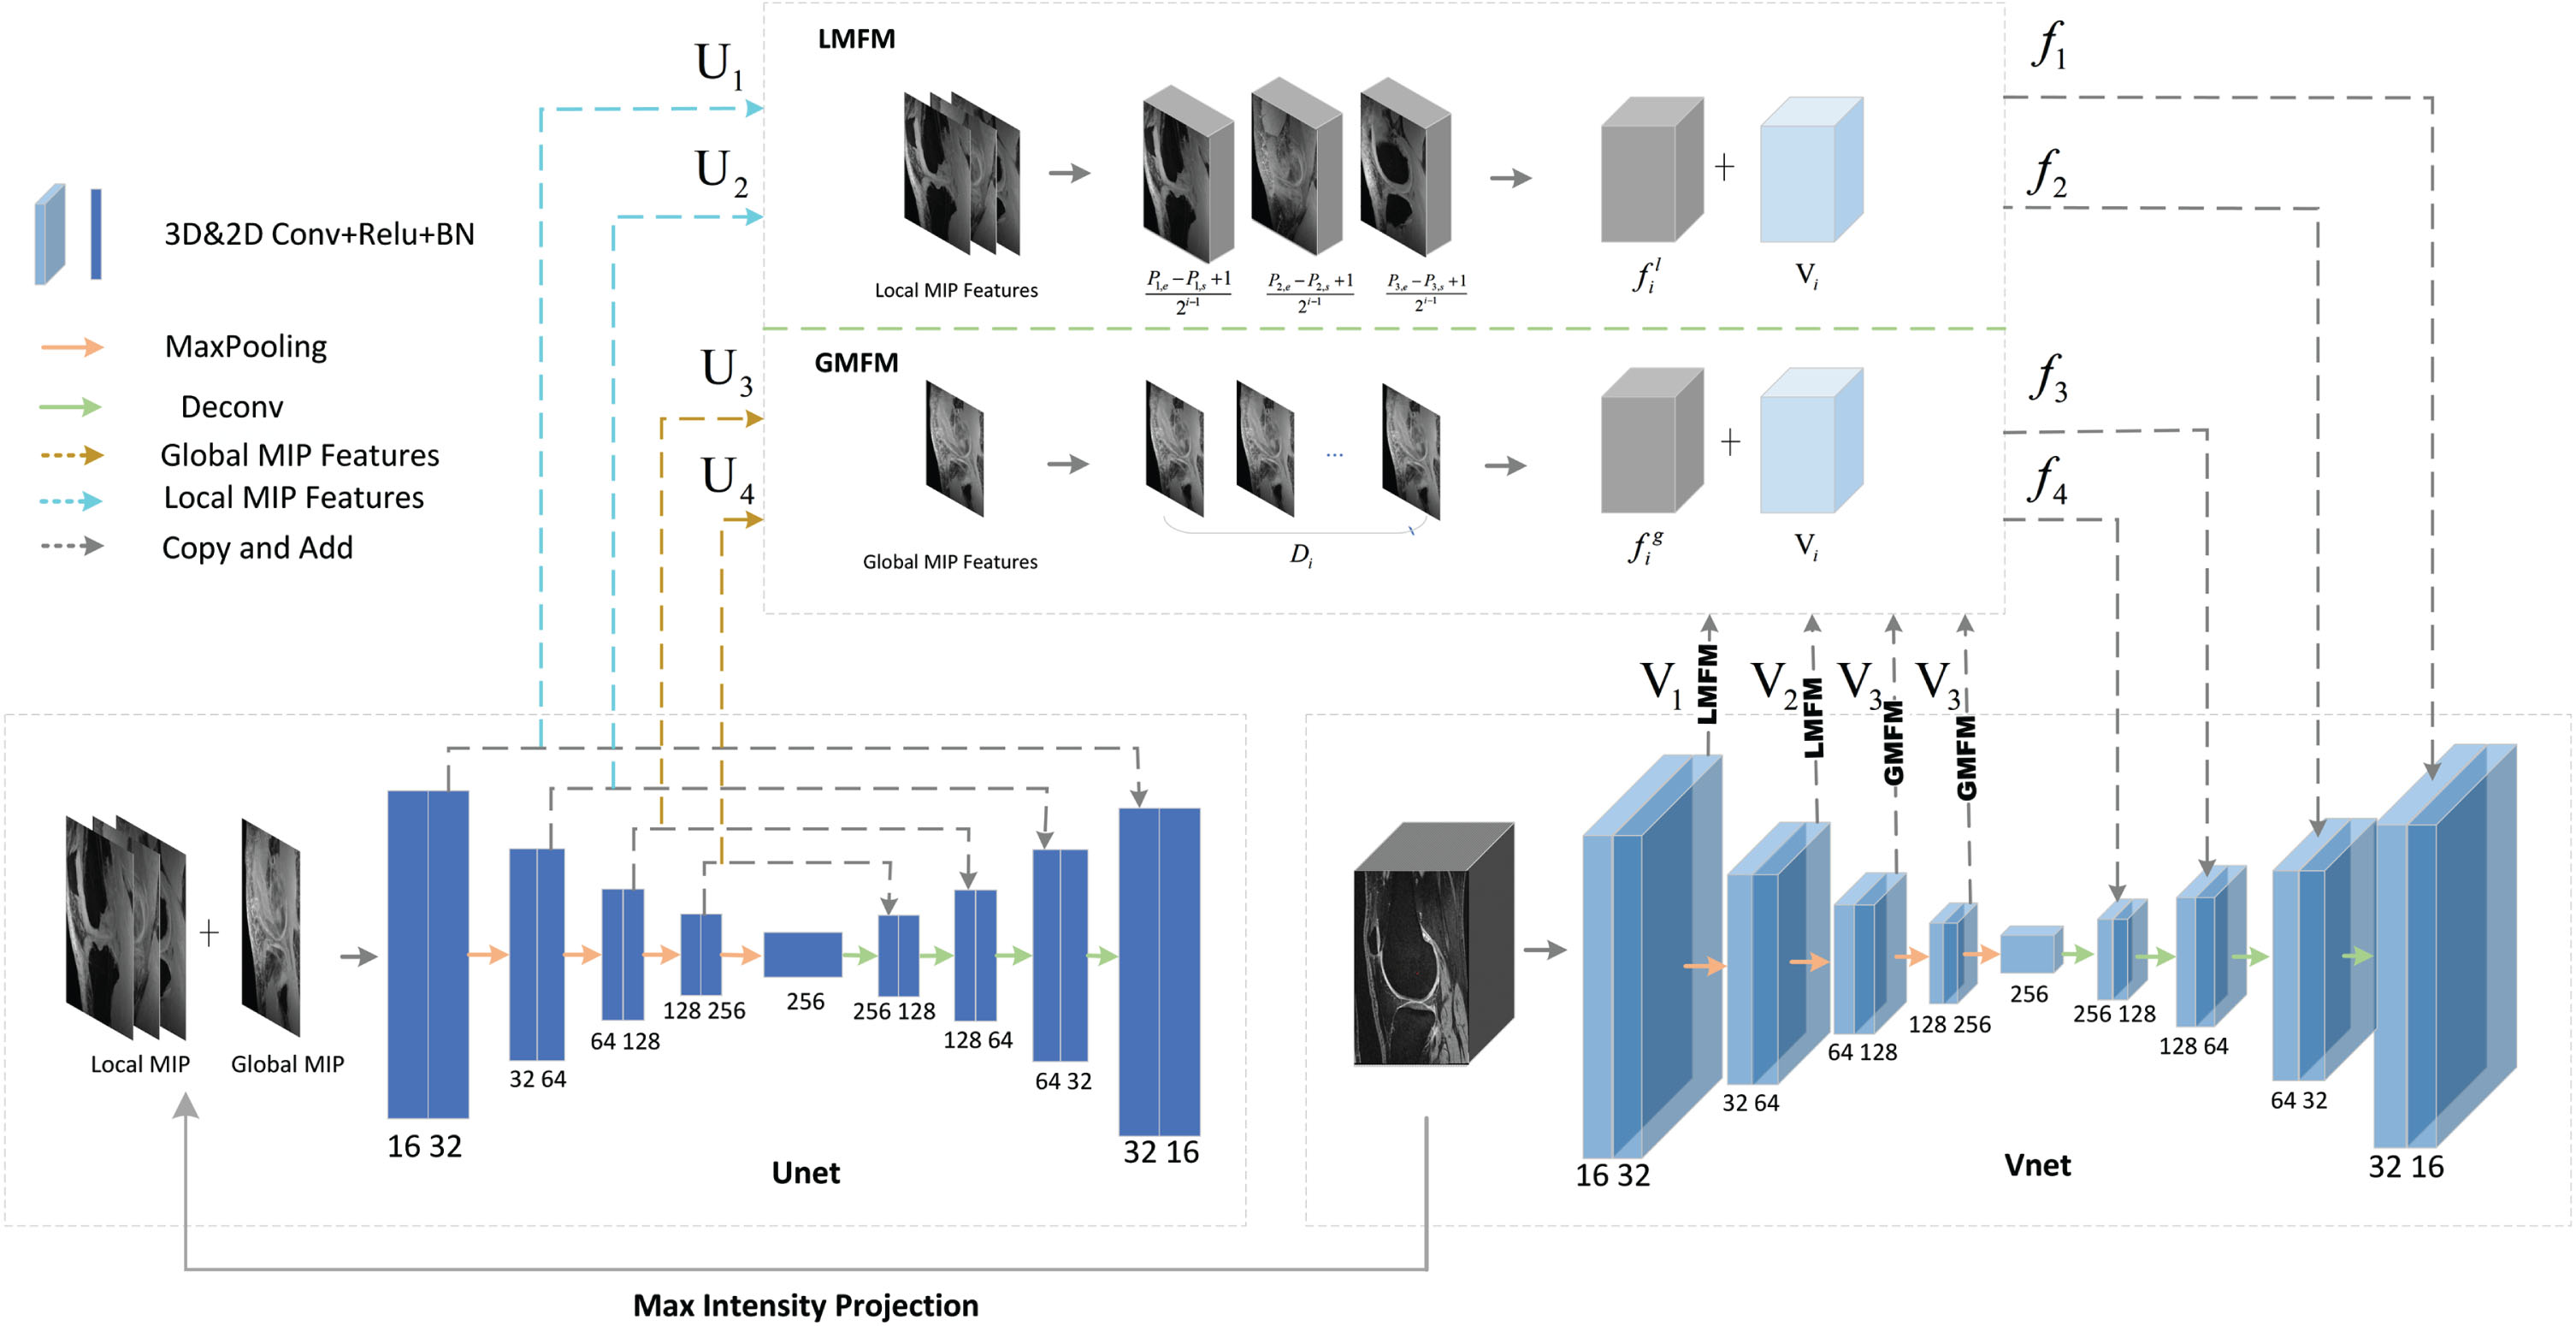
The UVNet architecture consists of a main body composed of U-Net and V-Net. Additionally, there are local MIP fusion module (LMFM) and global MIP fusion module (GMFM) parts. The maximum intensity projection of various models is applied to the MRI volume to provide local and global MIP images,which are used as input for the U-Net.
UVNet employs V-Net as the backbone feature extraction network, which has proven its effectiveness in various medical image segmentation tasks. It uses 3D convolution for feature extraction and achieves end-to-end segmentation through an efficient encoding-decoding structure. In the encoding path, each layer of features undergoes two consecutive identical convolutional layers, followed by batch normalization and the ReLU activation function, and then downsampling using a convolution operation with a stride of two. The decoding path is similar to the encoding path, but the feature map scale is recovered by upsampling, and in the last layer, a 1 × 1 ×1 convolution is performed to map each component feature vector to the desired number of classes. Skip-connections are also used between the encoder and decoder to recover the information loss caused by downsampling.
Traditional medical image segmentation methods usually use a separate 2D or 3D network for feature extraction, which is normally effective. But, in order to extract the deep semantic information, it is necessary to downsample the feature maps, which inevitably results in the loss of information. Even though skip-connections are used in V-Net to supplement the lost information, the skip-connections of the next layer are still obtained by downsampling the previous layer. Knee joint cartilage has an elongated morphology and occupies a relatively small proportion of pixels in the entire medical image. After multiple downsampling steps, this information loss becomes even more critical for cartilage features, leading to issues like under-segmentation or even cartilage breakage in the segmentation mask. Therefore, in addition to using V-Net for feature extraction, we also employ U-Net to segment MIP images as additional supplementary information to alleviate information loss in skip-connections. U-Net utilizes two-dimensional convolution and has the same number of layers as V-Net, making it compatible for feature fusion with V-Net.
Local MIP images and Global MIP image
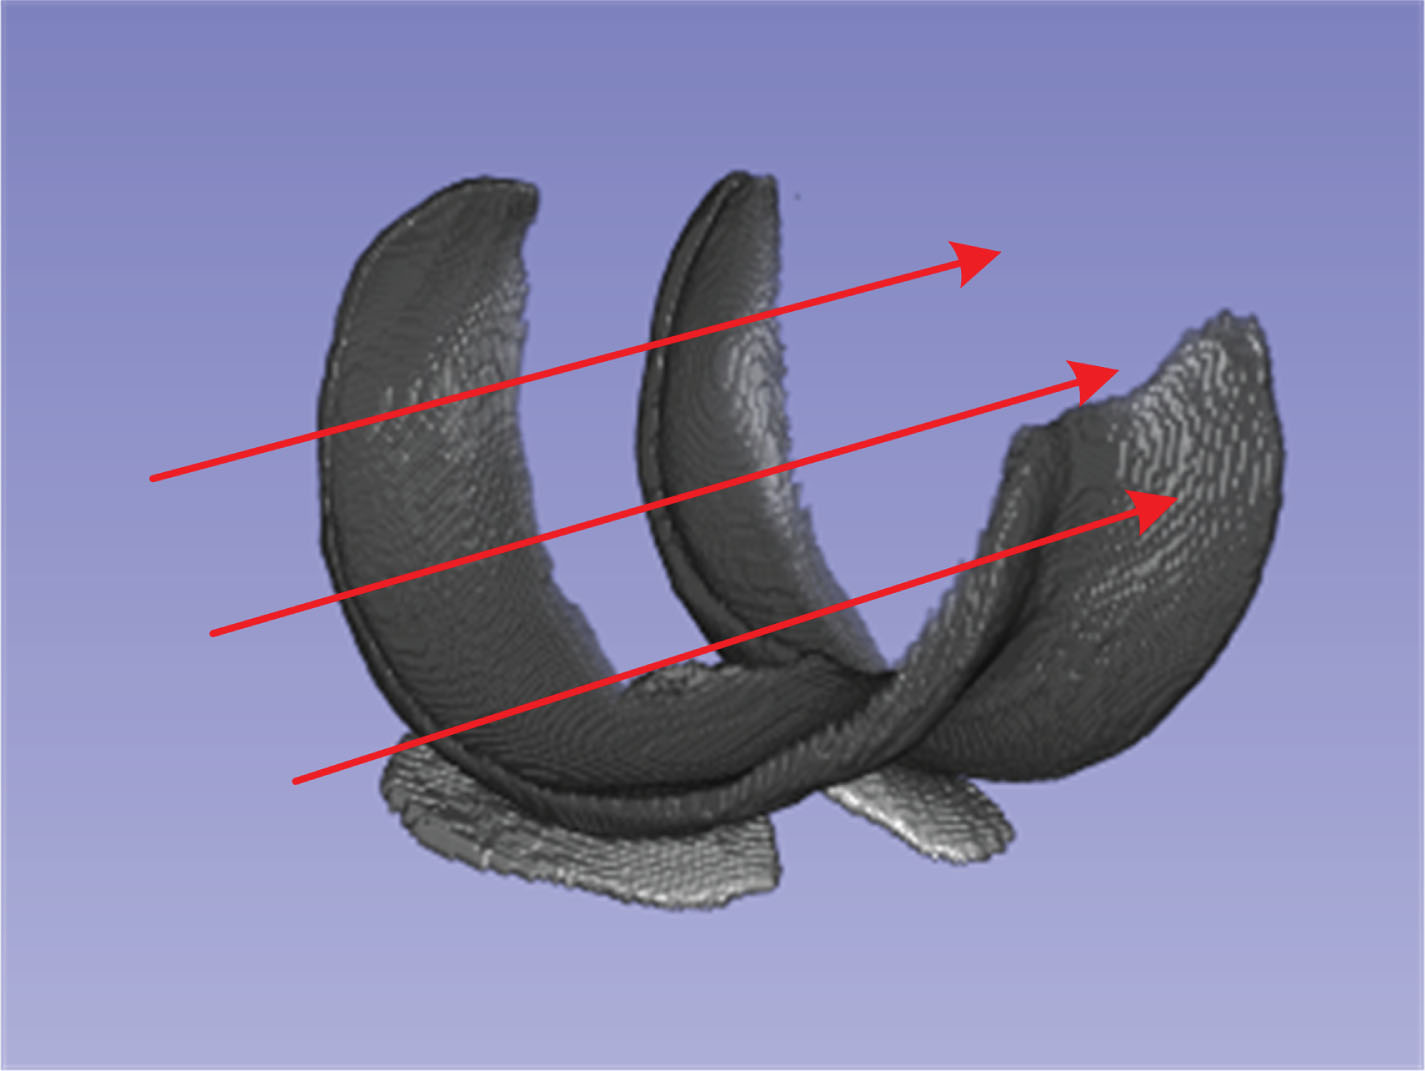
Maximum Intensity Projection (MIP) is a projection method used for extracting structures and features from medical images. The conventional projection process involves scanning the entire MRI volume in a specific direction to find the maximum pixel intensity. Then, the maximum intensity values from all pixels along that direction are projected onto a two-dimensional image, which we refer to as the global MIP image. The projection process can be represented as illustrated in Fig. 2. By applying this process separately to the MRI volume and corresponding labels, MIP images and MIP labels are obtained. Although this projection process is relatively straightforward, it finds extensive application in medical image analysis, including tasks such as reconstruction [36, 37], detection [38, 39], and segmentation [40, 41]. During the projection process, cartilage structures are typically retained in the MIP image, providing valuable information about the shape and location of the cartilage.
Maximum Intensity Projection
It is worth noting that during the process of ray projection, lower pixel values will be overwritten by higher pixel values. Therefore, when acquiring the global MIP image, a substantial amount of valuable shape and positional information is lost, and this should be given due consideration. If the global MIP image is used exclusively as supplementary information, it may introduce interference during the training of V-Net, resulting in a decrease in accuracy. Considering the complexity of the segmentation task, relying solely on global projection as additional information may appear overly simplistic and brute-force. To mitigate the aforementioned issue of information loss and enrich the supplementary information structure, we have employed a method for calculating MIP based on the morphology of cartilage, which we call local MIP. We consider that the cartilage morphology in adjacent slices exhibits similarities. By performing maximum intensity projection across multiple neighboring slices, the loss of information is expected to decrease, and the morphological structure of the cartilage will be more prominently represented in the MIP image. As depicted in Fig. 3, we have partitioned the entire cartilage structure into three parts according to the morphological characteristics, denoted as S1, S2, and S3. The S j (j = 1, 2, 3) represents the MRI volume between slices pj,s and pj,e, where pj,s denotes the number of the starting slice, and pj,e denotes the number of the last slice. We then carried out projections on these three parts separately, resulting in three local MIP images, namely L1, L2, and L3. These local MIP images are combined with the global MIP image, denoted as G, and together they serve as inputs to the U-Net.
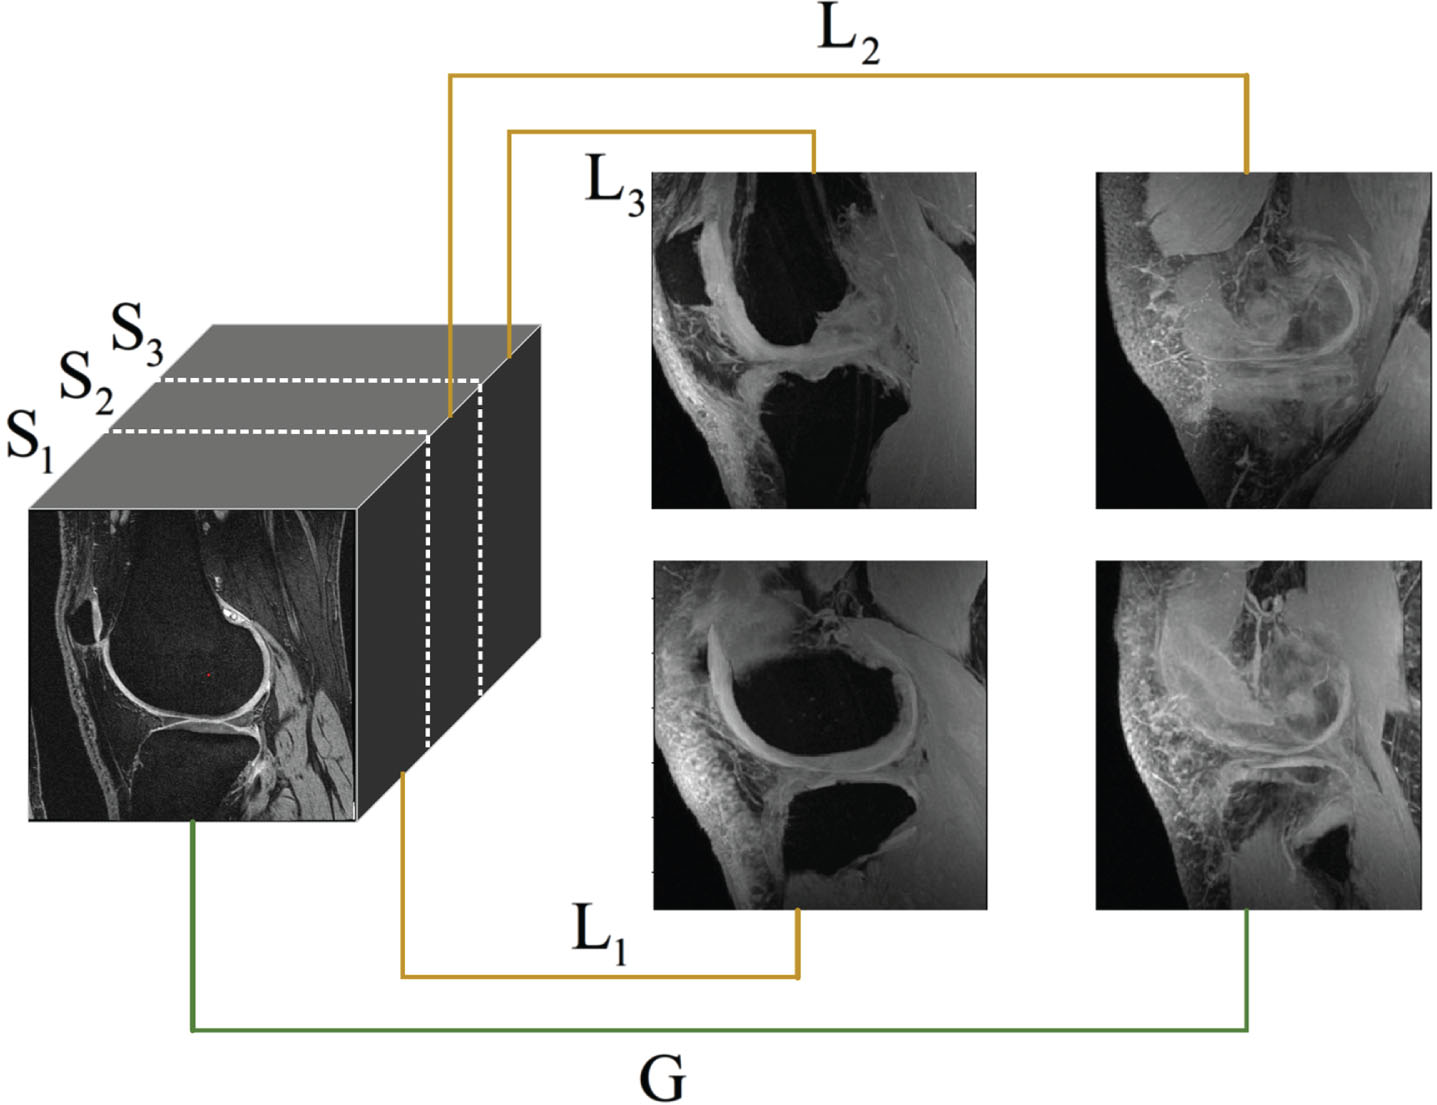
For each MRI volume, three local MIP images and one global MIP image were extracted.
To incorporate the extracted MIP image as supplementary information into the V-Net, we need to perform dimension expansion on different MIP images. We propose two feature fusion modules for this process, referred to as the Local Feature Fusion Module (LMFM) and the Global Feature Fusion Module (GMFM), as shown in Fig. 1. U
i
(i = 1, 2, 3, 4) represent the MIP feature maps obtained from U-Net, with dimensions
Local MIP fusion module
The U1 and U2 are used as inputs for LMFM to accomplish feature fusion with the V1 and V2, respectively. In LMFM, only li,1, li,2, and li,3 undergo dimension expansion. As mentioned earlier, the L
j
(j = 1, 2, 3) are obtained by extracting continuous slices between pj,s and pj,e. To ensure that the size of the local MIP features matches the 3D semantic feature f
v
, we need to replicate li,j by (pj,e - pj,s + 1)/(2i-1) times and concatenate them to form
The U3 and V3, as well as the U4 and V4, respectively, serve as inputs for GMFM to complete fusion. The difference from LMFM is that in GMFM, we only perform dimension expansion on the global MIP feature g
i
to match its scale with V
i
. The specific expansion process involves duplicating g
i
by D
i
times, yielding
Similar to the LMFM, a weighted linear sum is performed between the obtained 3D global MIP map
loss function
In the training process, DiceLoss was selected as the loss function for both 2D and 3D models and defined as,
The overall loss function of network is defined as:
SKI-10
Our model utilized the SKI-10 database from the SKI-10 MICCAI challenge [42], which comprises 100 knee MR images along with expert-annotated femur and tibia segmentation images. The SKI-10 database is based on MR images provided by Biomet, Inc. These images were collected at 80 different centers across the United States using equipment from all major manufacturers, such as General Electric, Siemens, Philips, Toshiba, and Hitachi. All images were captured in the sagittal plane with a rectangular pixel spacing of 0.4 × 0.4mm and a slice distance of 1 mm, without the use of contrast agents. Experts at Biomet, Inc. interactively segmented all MR images into four categories: femur, femoral cartilage, tibia, and tibial cartilage [42]. In this study, we only used femoral and tibial cartilage.
OAI-ZIB
The Osteoarthritis Initiative dataset (OAI-ZIB) consists of 507 MRI volumes with manual segmentations by experts at Zuse Institute Berlin. Images were acquired using a 3T Siemens MRI scanner and quadrature transmit-receive knee coil (USA Instruments, Aurora, OH) at one of four sites using a 3D sagittal water-excited T1-weighted (TE 5 ms, TR 16 ms, fip angle 25°). Dual Echo in the Steady State (DESS) sequence with in-plane resolution of 0.365× 0.365 mm, FIP Angle 25°) dual echo in the steady state (Dess) sequence with in-plane resolution of 0.365× 0.365 mm, matrix size 384×384, and slice thickness of 0.7mm [43].
Experimental detail
In our study, we divided the two datasets into 80% for network training and 20% for testing. Since the diagnosis of osteoarthritis in clinical practice mainly refers to the morphological manifestations of cartilage, only cartilage tissue labels were retained in the data set. After removing the labels of bone, the dataset contained three categories: 0-background, 1-femoral cartilage,and 2-tibial cartilage. Then, the images are randomly cropped into patches with a size of 256 × 256 × 96, which are sent to the V-Net for training.
During the training period, the learning rate is set to 0.002 in the initial stage, the training batch size of V-Net is set to 1, and the training batch size of U-Net is set to 4, so as to ensure that the training of each MIP is non-interference. The total training epochs are set at 500. The Adam [44] optimizer is used for optimization, and the attenuation coefficient is 0.0001.
Evaluation metrics
We used the Dice Similarity Coefficient (DSC), Recall, and Precision [45–47] as evaluation metrics, all of which were commonly used to evaluate similarity in the field of medical image segmentation.
Comparison of loss hyper-parameters
Firstly, we study the influence of hyper- parameters on the partial performance of the loss function. We experimented with the effect of different values of ω from 0.15 to 0.75 on the performance of the hybrid network. The experimental results are shown in Fig. 4. When ω = 0.35, the experimental performance is the best.
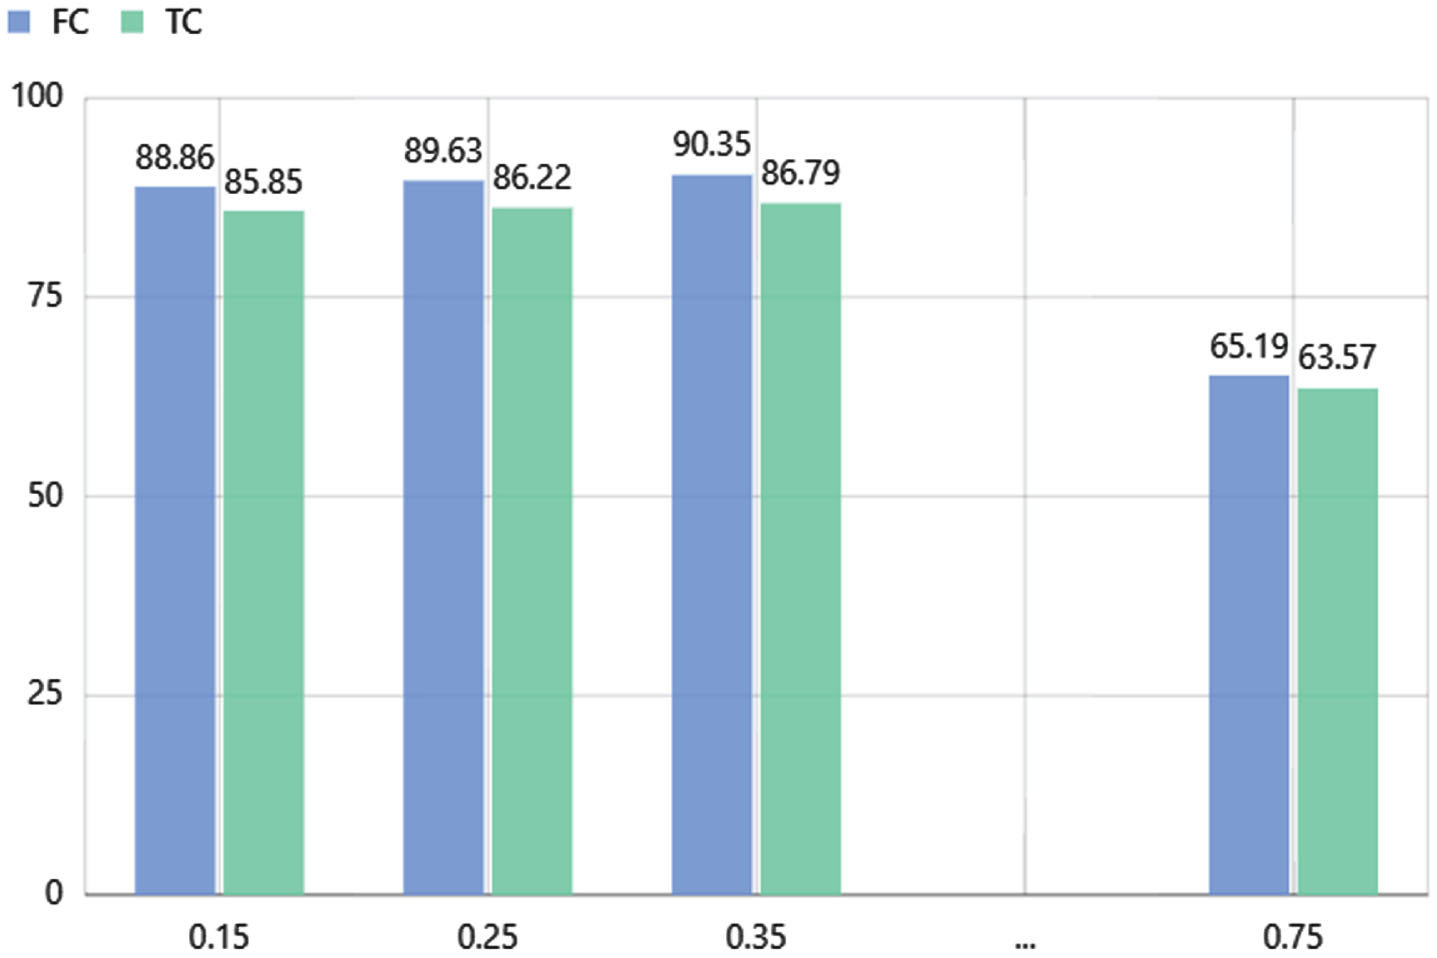
The influence of hyper-parameter ω on network performance.
In order to evaluate the performance of our proposed network framework, we conducted a comparative analysis with several popular deep learning-based medical image segmentation methods, such as U-Net [12], U-Net++ [28], V-Net [13], and 3D U-Net [48], on the OAI dataset. Table 1 presents the performance comparison of the different methods on the OAI dataset, with the best results emphasized in bold.
Quantitative valuation of different methods on the OAI-ZIB images
Quantitative valuation of different methods on the OAI-ZIB images
Our proposed hybrid network model, UVNet, which incorporates local and global MIPs, achieved impressive DSC scores of 90.35 for femoral cartilage (FC) and 86.79 for tibial cartilage (TC). These scores outperformed those of other commonly used segmentation methods. The U-Net model obtained DSC scores of 86.91 and 83.40, while the V-Net model achieved DSC scores of 87.45 and 85.24. By utilizing a hybrid network model, we successfully enhanced the segmentation performance for both femoral and tibial cartilage.
Table 2 presents the quantitative results for the SKI-10 MICCAI challenge knee cartilage segmentation dataset. According to the experimental evaluation, the FC and TC DSC scores for the UVNet model are 83.57 and 80.12, respectively. These values are 6.04 and 6.44 points higher than the U-Net and are 4.3 and 2.7 points higher than the baseline V-Net. Furthermore, we compared our work with U-Net++ and 3D U-Net, which have served as robust baselines for various image segmentation tasks. Our DSC scores for FC and TC surpass those of U-net++ by 5.66 and 5.96 points, and outperform 3D U-Net by 5.4 and 3.47 points, respectively. Upon careful visual analysis of the qualitative results, it is evident that the UVNet model produces superior segmentation outcomes. In comparison to other network models, UVNet demonstrates better performance in terms of TC integrity segmentation results, which is often a crucial factor in clinical examinations.
Quantitative valuation of different methods on the SKI-10 images
Quantitative valuation of different methods on the SKI-10 images
We conducted two experimental directions on the OAI-ZIB dataset to validate the structural rationality of our model. The first direction explores the impact of varying the number of local MIP images on model performance, while the second direction examines the influence of different feature embedding methods on model performance.
(1) Different Number of Local MIP Images: To address the issue of information loss in global MIP images, we introduced local MIP images. A combination of local and global MIP images was used as input to the information augmentation subnet, U-Net. Table 3 illustrates the effect of the extracted number of local MIP images on the model’s segmentation performance. Using too many local MIP images can interfere with the feature extraction of the backbone network, while using too few can result in significant information loss, essentially reverting to global MIP images. It can be observed that the model achieves optimal performance when three slices of local MIP images are used. This approach effectively reduces information loss while minimizing interference during fusion with the backbone network. This method ensures a balanced presentation of cartilage structures and surrounding tissues, resulting in more precise segmentation results.
(2) Different Feature Embedding Methods: Another key challenge is how to embed local and global MIP feature maps into the V-Net. We compared four different embedding methods:
The influence of different number of local MIP image on the experimental results of UVNet
The influence of different number of local MIP image on the experimental results of UVNet
(a) L: V1 V2 G: V3 V4 represent embedding local MIP features into V1 V2 and global MIP features into V3 V4;
(b) L: V3 V4 G: V1V2 represent embedding local MIP features into V3V4 and global MIP features into V1V2;
(c) L: V1V2V3V4 represent embedding local MIP features into V1V2V3V4;
(d) G: V1V2V3V4 represent embedding global MIP features into V1V2V3V4;
From Table 4, we can see that the model performs best when adopting the (a). This is attributed to the fact that local MIP feature maps focus more on shape and boundary information, while global MIP feature maps emphasize positional information and the overall morphology of the cartilage. Embedding local MIP feature maps into the shallow features V1V2 effectively supplements the boundary information lost in the middle cartilage, ensuring cartilage continuity. Embedding global MIP feature maps into the deep semantic features V3V4 enhances cartilage localization and reduces morphological deficiencies in the cartilage structure.
The influence of different feature embedding methods on the experimental results of UVNet
Relative improvement of U-Net, V-Net, and UV-Net in DSC
In knee MRI, cartilage is wrapped by other tissues, which are very similar in their morphology performance, and the cartilage occupies a small proportion in the whole image, which can easily cause the loss of boundary information during convolution and downsampling. The above phenomenon may lead to the problem of cartilage under-segmentation or even cartilage breakage in the final mask. To address the above problems, UVNet can compensate for missing boundaries by obtaining additional shape and position information from the MIP feature maps.
Figure 5 shows examples of cartilage segmentation on the OAI-ZIB and SKI-10 datasets by the proposed and comparative methods. It can be observed that our method shows smoother and more continuous cartilage with an overall morphology closer to the ground truth. As shown in the second and fourth rows of Fig. 5, TC tends to be under-segmented in the results of the baseline network and the other compared methods, while the segmentation loss of TC is compensated in our proposed method. Similarly, in the first, and third rows of Fig. 5, the cartilage mask obtained from the baseline network performs poorly, and some of the cartilage is even broken, whereas the UVNet corrects this defect and ensures the integrity of the cartilage morphology. It can be concluded that this is mainly attributed to the fact that the local and global MIP images are able to replenish the boundary information lost by downsampling, enhance the cartilage’s morphological representation in the whole image, and make the cartilage’s boundary more continuous. Our method can well guarantee the integrity of cartilage segmentation and reduce the possibility of cartilage breakage in the final segmentation mask.
In Section 3.2, we explain how to combine the morphological representation of knee cartilage to extract MIP images as an information supplement. In Section 3.3, it is explained how they can be fused with the hierarchical features of V-Net and added to the training. Figure 6 demonstrates the advantages of our proposed method by visualizing the MIP feature map and the feature fusion process. The specific fusion process is done by the feature fusion module, and these representative feature maps are obtained by averaging feature maps of different channels. It can be observed that after one downsampling, the cartilage morphology of the feature map (c) becomes blurred and the boundary distinguishability is relatively poor, which will affect the accuracy of the subsequent segmentation. The fusion of the MIP feature map (b) with (c), which contains additional information, can supplement the lost cartilage boundary information in the feature map (c) and give the cartilage a more complete morphology. We can see that the boundary of cartilage in the fused feature map (d) is more recognizable, and the demarcation line between cartilage and bone as well as cartilage and other tissues is clearer. After color filling, we can observe this more clearly in (e) and (f). The richer expression of the information will be very helpful for subsequent segmentation.
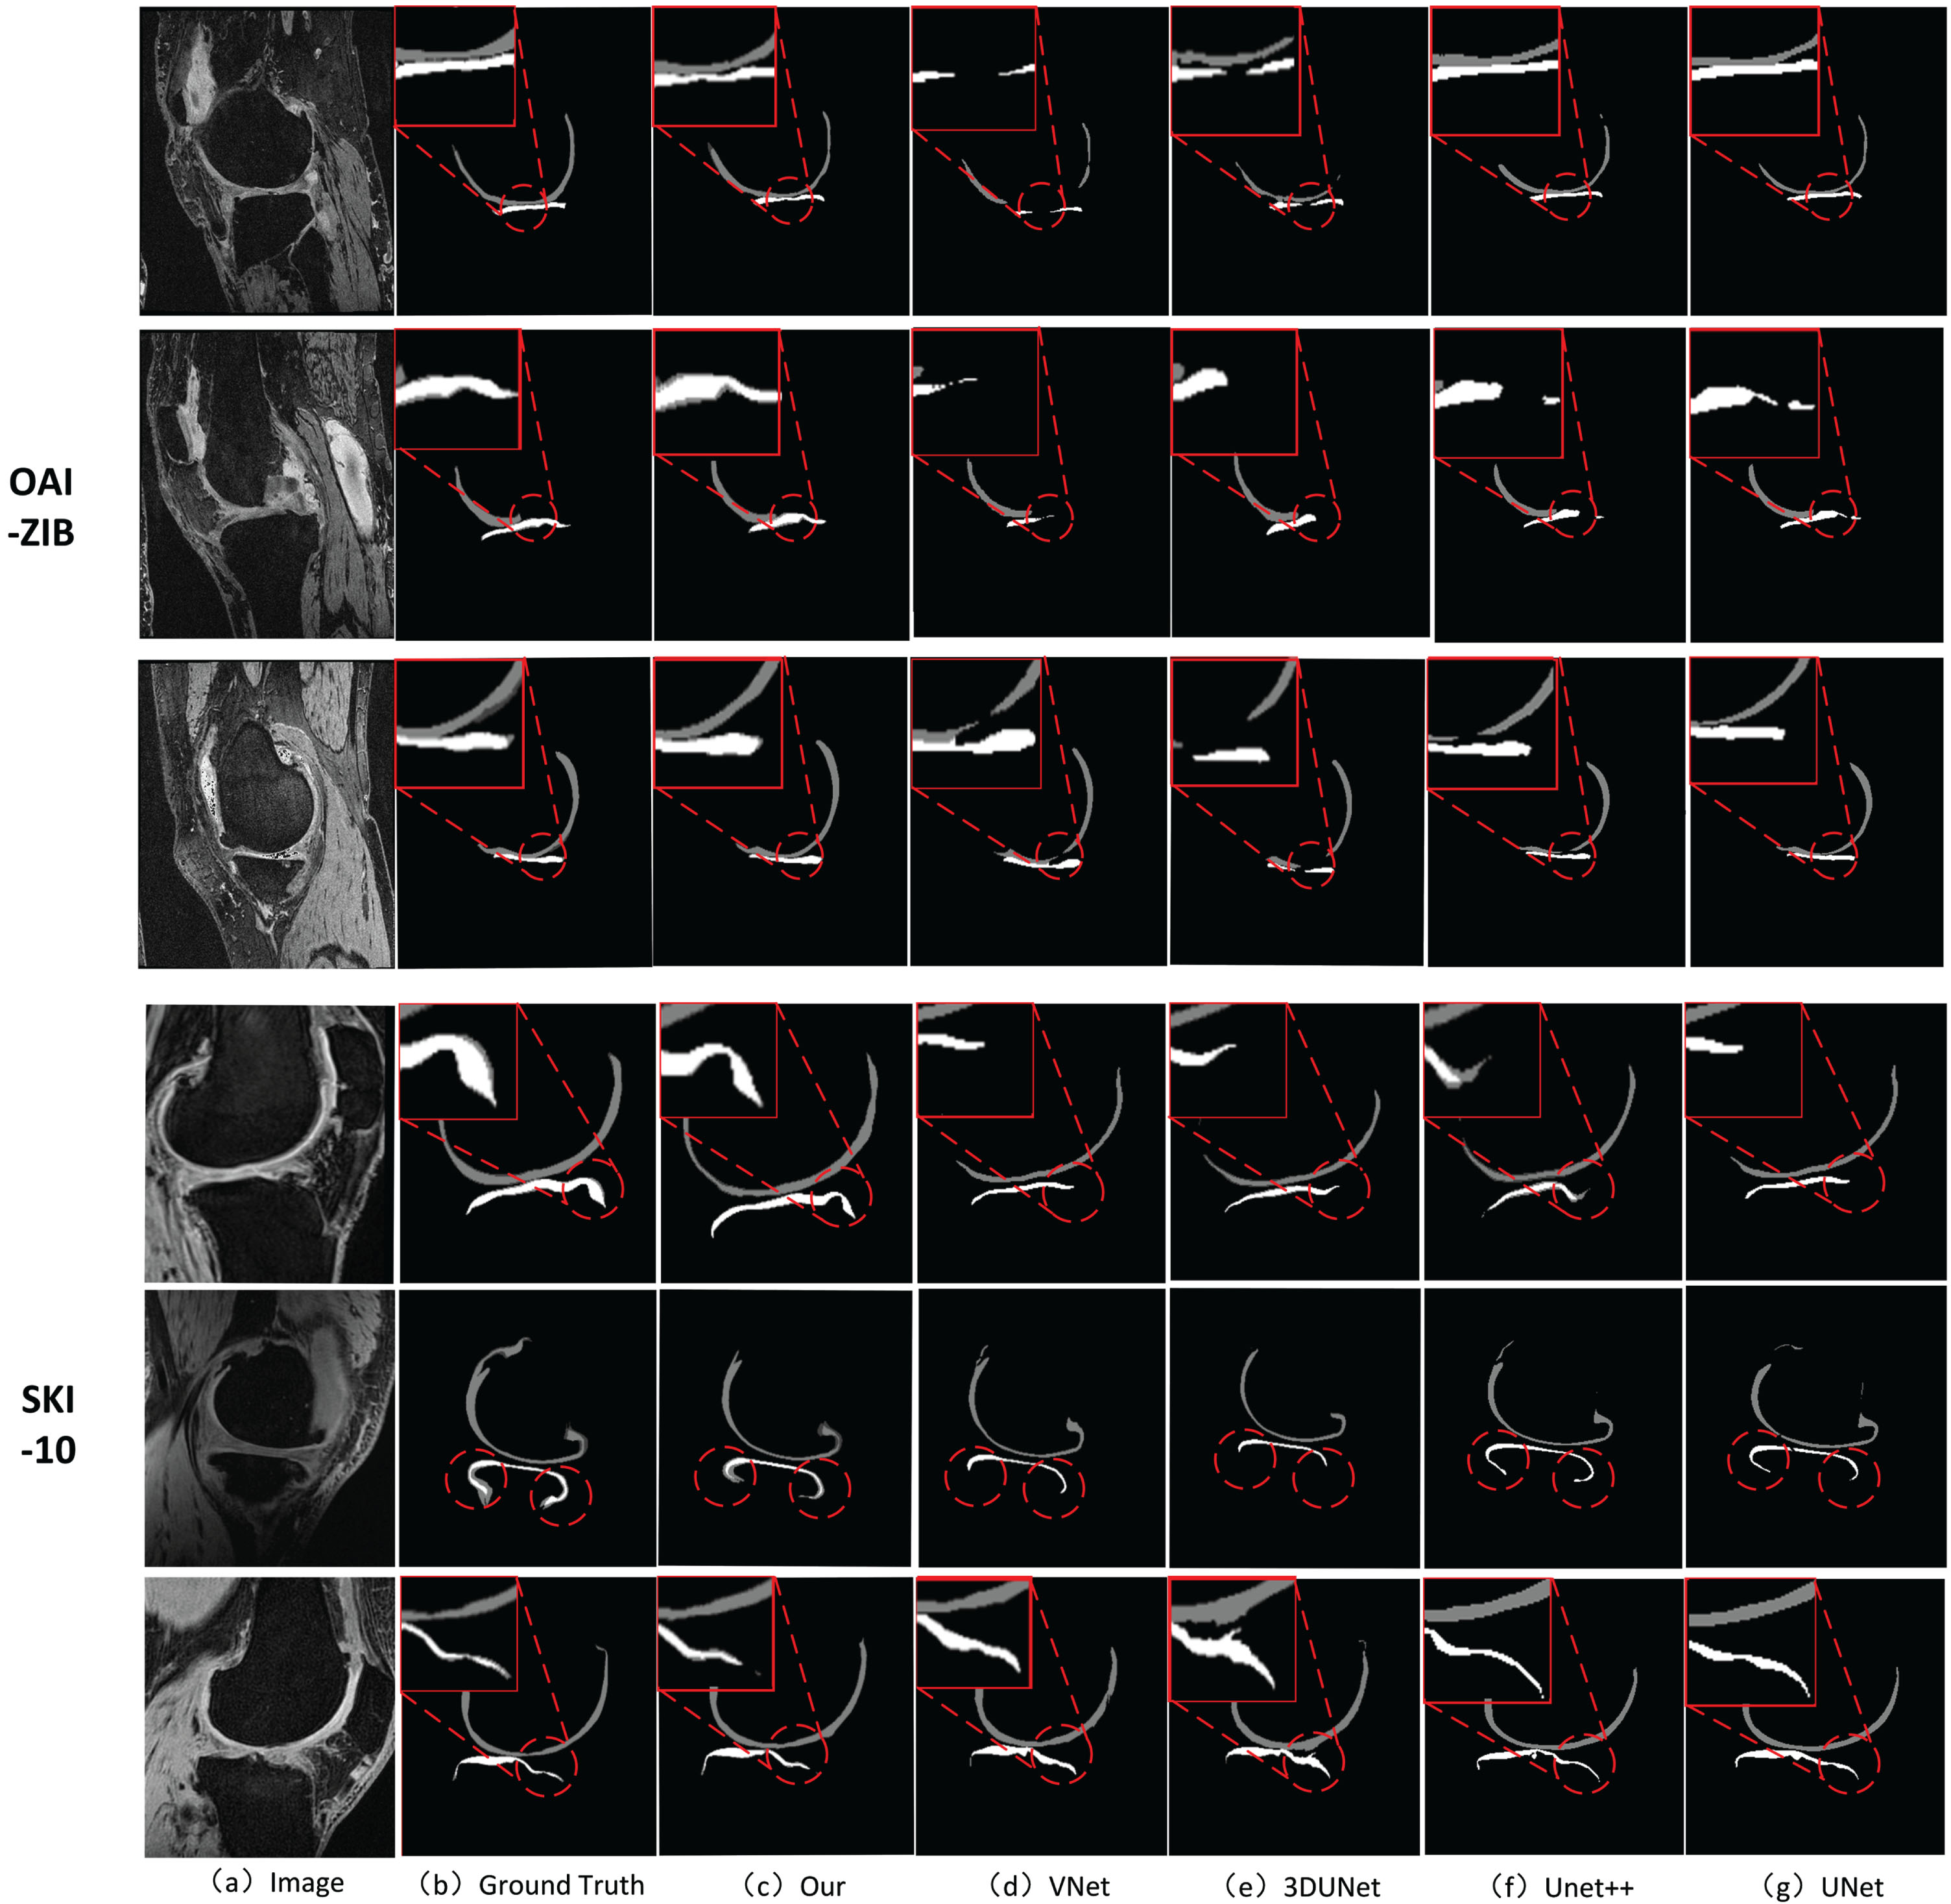
The illustration of two sampled segmentation results of proposed method and the compared methods 3D U-Net, 3D V-Net, U-Net and U-Net++ on OAI-ZBI and SKI-10 datasets. The cartilage structure of the knee joint is described as: femoral cartilage (dark gray), tibial cartilage (light gray).
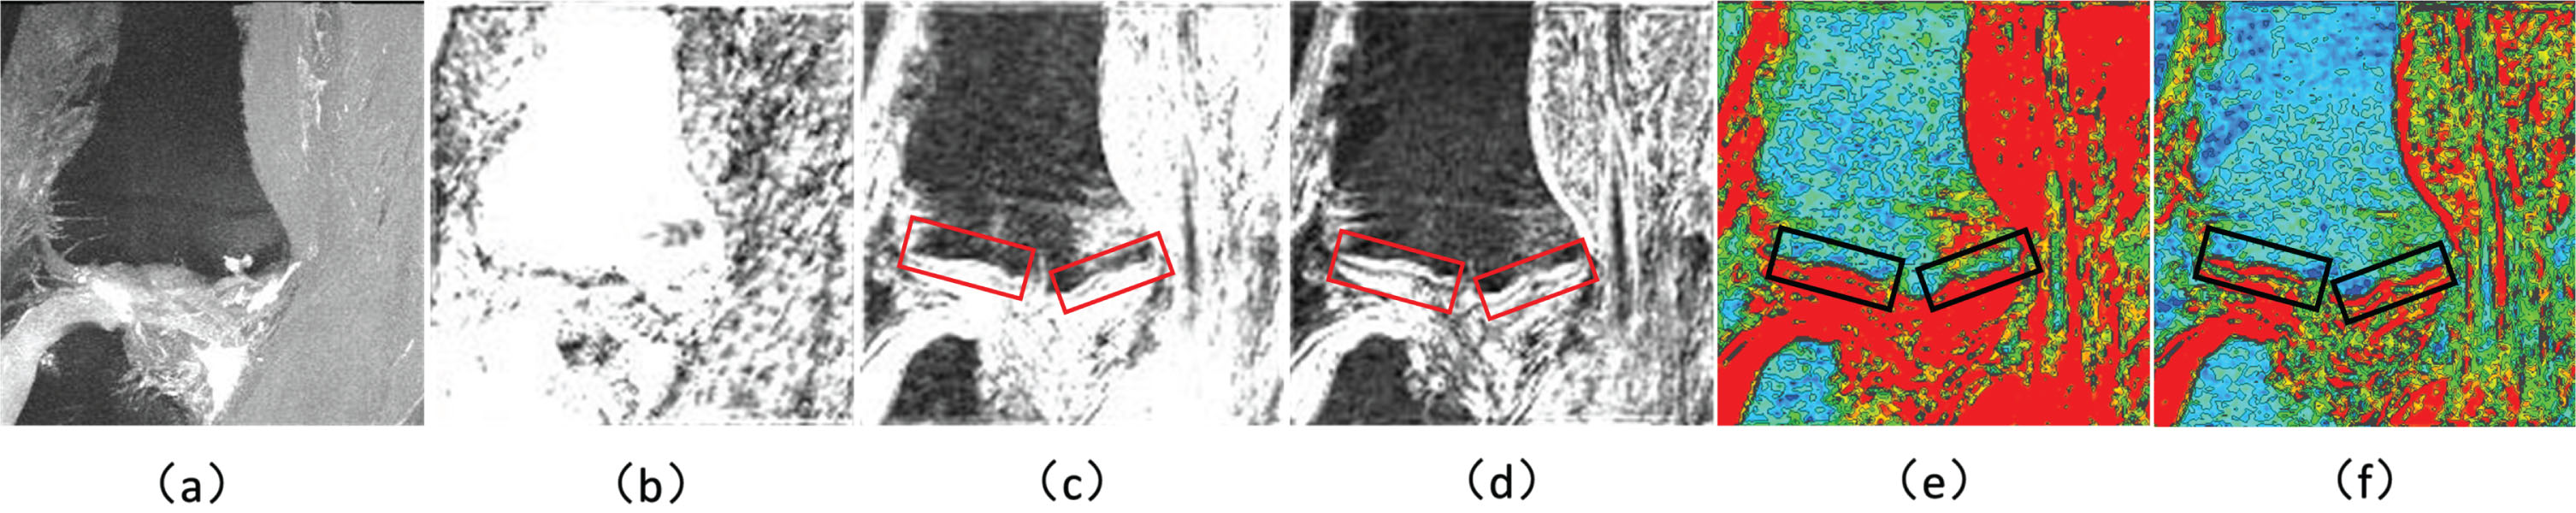
Visualization of the feature map fusion process. (a) the MIP image, (b) the MIP feature map, (c) the feature map of V-Net after one downsampling, (d) the hierarchical features fused with the MIP feature, (e) Color fill for (c), (f) Color fill for (d).
In this study, we combine 2D U-Net with 3D V-Net to propose a new knee cartilage segmentation method, which we name UVNet. We propose for the first time to extract local MIP and global MIP based on the morphology of knee cartilage and apply them as complementary information in the segmentation to minimize information loss due to downsampling. Specifically, the local and global MIP images are feature extracted using U-Net, and the features are fused into the decoding subnetwork of V-Net through the local and global MIP feature fusion module, which effectively enhances the morphological representation of knee cartilage tissues in the images and ensures the completeness of cartilage segmentation. We evaluated our proposed method using two knee MRI datasets, OAI-ZIB (507 samples) and SKI-10 (100 samples). Experimental results show that UVNet performs significantly better than other segmentation methods.
In our future work, we will focus more on simplifying the model architecture while retaining its segmentation capability. The limitation of UVNet is that it has more parameters and longer training and inference times. We plan to use a 2D network with smaller parameters to segment MIP images to reduce the overall number of parameters in the model without compromising segmentation performance. In addition, we will collect more clinical patient data, such as knee data from the Johnston County Osteoarthritis Program (JoCoOA) [49], to validate our proposed segmentation method and extend the application area of our method.
Footnotes
Acknowledgments
This work was supported in part by the National Natural Science Foundation of China under Grant No. 61806107, 61702135 and 62201314, the Opening Project of State Key Laboratory of Digital Publishing Technology, and the Shandong Province “Double-Hundred Talent Plan” on 100 Foreign Experts and 100 Foreign Expert Teams Introduction (WST2021020).