
Abstract
Panchromatic and multi-spectral image fusion, called panchromatic sharpening, is the process of combining the spatial and spectral information of the source image into the fused image to give the image a higher spatial and spectral resolution. In order to improve the spatial resolution and spectral information quality of the image, an adaptive multi-spectral image fusion method based on an improved arithmetic optimization algorithm is proposed. This paper proposed improved arithmetic optimization algorithm, which uses dynamic stochastic search technique and oppositional learning operator, to perform local search and behavioral complementation of population individuals, and to improve the ability of population individuals to jump out of the local optimum. The method combines adaptive methods to calculate the weights of linear combinations of panchromatic and multi-spectral gradients to improve the quality of fused images. This study not only improves the quality and effect of image fusion, but also focuses on optimizing the operation efficiency of the algorithm to have real-time and high efficiency. Experimental results show that the proposed method exhibits strong performance on different datasets, improves the spatial resolution and spectral information quality of the fused images, and has good adaptability and robustness. The source code is available at: https://github.com/starboot/IAOA-For-Image-Fusion.
Keywords
Introduction
Generally, a single imaging sensor cannot obtain complete information about a target scene [1]. Therefore, to obtain richer information, researchers have frequently used multiple sensors to collect two types of images simultaneously: single-band panchromatic (PAN) and multi-spectral (MS). Under the current conditions, PAN image has both low spectral resolution and high spatial resolution. However, the opposite is the MS image. Combining these two types of images to produce high spectral and high spatial resolution images has been widely used in military, remote sensing [2], medical imaging [3], industrial inspection and other fields. Compared with images captured by a single imaging sensor, multi-modal images can provide richer information.
Image fusion can be divided into four categories of methods [4], including component replacement multi-resolution analysis, based on component substitution (CS), hybrid and model-based methods. Among these methods, CS-based methods are one of the most classical methods, such as Intensity Hue Saturation (IHS), principal component analysis (PCA) and Gram-Schmidt (GS), which have the advantages of fast speed, simple implementation and high spatial resolution, but may suffer from spectral distortion and local artifacts. Multi-resolution analysis (MRA) methods, on the other hand, can retain richer spectral information.
In order to reduce the spectral distortion in the IHS method, an adaptive IHS method has been proposed by Rahmani et al. [5], which can adjust the band coefficients according to the actual situation to obtain a more accurate detail map. In addition, to improve the spectral fidelity at the edges, researchers have used edge-preserving filters and injected detail maps into each MS band. In contrast, another research team Leung et al. [6] found that it was not enough to inject detail maps using PAN images only, so they also used a linear combination of MS images and PAN images in combination. However, there are still some drawbacks in these methods, such as the detailed maps with fixed weights may lead to distortion problems such as local artifacts and local pseudo details. Existing methods may perform poorly in terms of image sharpness, contrast and color accuracy. Meanwhile, image fusion techniques are not limited to single modality, but can also be used for multimodal data fusion. However, existing methods have limitations in preserving multimodal information and improving target detection performance. In practical applications, image fusion techniques need to have real-time and high efficiency. However, traditional mathematical methods are often difficult to meet the real-time processing requirements in large-scale scenarios because they are based on the computation of deterministic solutions and the processing speed may be low. To address these issues, this study uses a combination of adaptive weight tuning band coefficients and edge preserving filters to improve the spectral fidelity. In addition, this study enhances the performance of the fusion results in detail maps by linearly combining MS images with PAN images. Also, a meta-heuristic algorithm is used to balance the fusion results with the computation time. With these improvements, this study expects to better address the challenges of image fusion techniques in practical applications. Therefore, in this study, an adaptive computational method for incoming detail maps is proposed for computing lower resolution (LR) MS detail maps. In this process, how to calculate the weights of the detail maps in a reasonable adaptive manner is a key issue, which will directly affect the degree of resolution and reduction of the image distortionproblem.
Although traditional mathematical methods are able to obtain optimal solutions to problems through strict mathematical logic, they are more suitable for solving small-scale problems due to long computation time. With the increasing complexity of real-life problems, approximation algorithms began to emerge, including heuristics and meta-heuristics. Compared to traditional mathematical methods, they may not necessarily find the optimal fitness value, but can significantly reduction of running time. The exploration and mining capabilities of the algorithm are improved based on its characteristics, and have better practicality in various practical engineering problems.
Many researchers have chosen to use meta-heuristic algorithms to solve various problems in engineering, such as, IoT smart home energy management [7], vehicle routing problems (VRP) [8], and automatic guided vehicle (AGV) energy-efficient scheduling problems [9], because of the advantages of shorter computation time, the ability to handle more complex large-scale problems, and a wide range of applications compared to traditional mathematical methods. However, the free lunch theorem has been proven to have both advantages and disadvantages for all meta-heuristic algorithms in any field. For any problem, all algorithms need to be improved or new algorithms proposed to solve the problem [10]. Usually, based on the laws of special problems, academics improve existing algorithms or propose algorithms for special effects [11]. These improved and innovative algorithms can often be better adapted to the complexity and special needs of the problem at hand, and improve the optimization effect and searchspeed.
Calculation formulas of image fusion quality
Calculation formulas of image fusion quality
In general, meta-heuristic algorithms fall into four categories: those based on the laws of genetic evolution in nature, those based on population intelligence, those based on physical and chemical phenomena, and those based on human social behavior. The first category is based on genetic evolution, which implements search by simulating biological evolutionary processes. It represents the problem as a chromosome and generates new solutions through selection, crossover and mutation operations. The classical evolutionary algorithm is the genetic algorithm (GA) [12], evolutionary strategy (ES) [13], differential evolutionary algorithm (DE) [14], biogeography based optimization algorithm (BBOA) [15], evolutionary programming (EP) [16] and immune algorithm (IA) [17]. The second type of meta-heuristic algorithm based on population intelligence, implements search by simulating the behavioral processes of animals during hunting or migration. It represents the problem as a population of individuals and computes it through the collective behavior and properties of animals in nature, and generates new solutions for solving engineering optimization problems. The classical population intelligence algorithms are particle swarm optimization (PSO) [18]. Ant colony optimization (ACO) [19] and artificial bee colony (ABC) [20] are also popular swarm intelligence algorithms today. Other common group intelligence algorithms include the ant lion optimization (ALO) [21], grey wolf optimization (GWO) [22], squirrel optimization algorithm (SSA) [23], whale optimization algorithm (WOA) [24], the orchard algorithm (OA) [25], artificial hummingbird algorithm (AHA) [26], chimpanzee optimization algorithm (ChOA) [27], firefly algorithm (FA) [28], aquila optimizer (AO) [29], african vultures optimization algorithm (AVOA) [30], snake optimizer (SO) [31] and dung beetle optimizer (DBO) [32]. The third category of meta-heuristic algorithms is based on physical and chemical methods, which achieve search by simulating physical phenomena or laws of nature. For example, simulated annealing algorithm (SAA) [33], gravitational search algorithm (GSA) [34], golden section optimization algorithm (GSOA) [35], black hole algorithm (BHA) [36], sine cosine algorithm (SCA) [37] and equilibrium optimizer (EO) [38] have been widely recognized in academia. The artificial electric field algorithm (AEFA) [39] and Henley gas solubility optimizer (HGSO) [40] are based on Henley’s law, among others, and propose new solutions for solving engineering optimization problems. The fourth category of meta-heuristic algorithms is based on the principles of human social behavior, by modeling the way human individuals or groups behave in order to solve complex social problems. In recent years, some of them are widely recognized by academics, such as social learning optimization algorithm (SLOA) [41], volleyball super league algorithm (VPLA) [42], teaching optimization algorithm (TLBO) [43] and election algorithm (EA) [44]. Among the more famous ones are Moghdani et al. [45]. An improved election optimization algorithm by Kanwal et al. [46] developed which has been applied to IoT cloud data processing. An improved teaching optimization algorithm by Xu et al. [47] proposed which has been applied to distance fitness learning strategies and has some potential for solving optimization decision making and collaborative cooperation.
The arithmetic optimization algorithm (AOA) [48] is an optimization algorithm based on arithmetic operations designed to solve mathematical optimization problems. Its design background draws on basic arithmetic operations and optimization ideas in mathematics to search for optimal solutions by performing stepwise addition, subtraction, multiplication and division operations on the values in the solution space. AOA utilizes basic arithmetic operations and is very simple and intuitive in terms of numerical computation, easy to implement and understand [49, 50]. Due to these advantages, AOA has been successfully applied to problems in many engineering fields. Among them are Talpur et al. for optimizing deep neuro-fuzzy classifiers [51], Rajagopal et al. for improving deep convolution spiking neural network models [52], Kharrich et al. for solving grid energy storage system design problems [53], Montano et al. for solving optimal tide problems in DC networks [54], Bahmanyar et al. for solving multi-objective problems in IoT smart homes [7], Abualigah et al. for implementing efficient text document clustering methods [55], etc. However, Wolpert et al. points out, no single algorithm is applicable to all domains. Academic researchers need to improve algorithms to obtain better performance and results in specific domains, depending on the characteristics of the problem at hand [11].
This paper further demonstrates the effectiveness of meta-heuristic algorithms and image fusion in solving practical problems by investigating the problem of adaptive multi-spectral image fusion. Based on the AOA, improved arithmetic optimization algorithm (IAOA) is proposed to improve the ability of population individuals to jump out of the local optimum through dynamic stochastic search technique and adversarial learning, which is based on local search and behavioral complementarily of population individuals. The contributions and work of this paper are as follows: IAOA using dynamic stochastic search tech-niques and dyadic learning operators is presented. An adaptive multi-spectral image fusion method based on the IAOA is proposed. Combining IAOA with multi-strategy for adaptive multi-spectral image fusion problems. Experimental results show that the proposed method improved the spatial resolution and spectral information quality of the fused images, and has good adaptability and robustness.
The rest of this article is organized as follows: Section 2 introduction related work and basic CS-based model approach. Section 3, the AOA and its improved strategies are presented, and the fusion method using IAOA for multi-spectral images is introduced. The experimental results are discussed and analyzed in Section 4. Section 5, summary and future works.
This section presents four types of work related to image fusion: the current state of the art in image fusion development, CS-based methods, image evaluation metrics, and arithmetic optimization algorithms. In addition, multi-spectral image fusion is a classical problem in image processing and plays a crucial role in computer vision and medical image analysis applications. In the real world, due to the physical characteristics of imaging sensors, a single sensor can usually only acquire data with specific attributes. However, with multiple sensors, image datasets with many different features are obtained, i.e., multiple datasets with different attributes are generated in the same scene. However, any individual attribute dataset cannot satisfy the needs of downstream work processing; therefore, fusion utilization of datasets from multiple imaging sensors becomes particularly important. It can provide richer and more accurate image data for various downstream applications and further promote the application of image processing and analysis techniques in different fields. Because of this, it is of great practical significance to study image fusion. This paper further demonstrates the effectiveness of meta-heuristic algorithms and image fusion research in solving real-world problems by investigating improved arithmetic optimization algorithms for adaptive multi-spectral image fusion problems.
By combining the adaptive weights to adjust the band coefficients and the edge preserving filter, this paper in proposes a method based on the meta-heuristic algorithm to optimize the adaptive weights and then adjust the band coefficients, so that the fusion results can better maintain the spectral fidelity. At the same time, the introduction of an edge preserving filter helps to improve the clarity and fidelity of the edges. This combination of methods can effectively improve the quality of the fusion results, making the image details clearer and more realistic.
Different from the traditional methods, IAOA further enhances the performance of the fusion results in detail maps by optimizing the adaptive weights to linearly combine MS images and PAN images. This fusion strategy makes full use of multi-spectral and high-resolution information, resulting in more detailed and accurate final fusion results. IAOA introduces the dynamic random search technique and the opposition-based learning operator, which are used to enhance the optimization and generalization capabilities of the solution. The dynamic random search technique searches for optimal solutions on both global and local scales and further optimizes the solution. And the opposition-based learning operator optimizes its own decisions by competing and gaming with the adversaries in a multi-party game process.
These innovative techniques enable IAOA to better adapt to uncertain environments and provide more efficient and accurate fusion results. IAOA compares with existing methods in terms of fusion strategy, it has the features of heuristic adaptive weight adjustment, edge preservation, and linear combination, as well as the addition of dynamic random search technique and opposition-based learning operators make it perform well in image fusion problems. IAOA algorithm is designed to improve the performance of image fusion problems by combining multiple techniques and methods, aiming to improve the effect and performance of imagefusion.
Image fusion
Current remote sensors are unable to provide high spectral resolution and high spatial resolution imagery due to various limitations. Common remote sensors, such as IKONOS, QuickBird and World-View, are only able to acquire both PAN and low spatial resolution multi-spectral (LR MS) images. While multi-spectral images contain valuable spectral information for distinguishing between different materials, panchromatic images contain important spatial information such as the geometry of the object. By combining spectral and spatial information, classification accuracy can be improved and better results can be achieved in applications such as target detection.
Typically, researchers fuse a LR MS image with the original pixel information in a panchromatic image, aiming to produce a fused image with high spatial and spectral resolution, a process known as panchromatic sharpening. The panchromatic sharpening technique can effectively integrate the superior information from multiple images for downstream work in computer vision, industrial applications, remote sensing processing and more. The use of such fusion techniques can better meet demand and improve image quality and usability, thereby advancing related fields.
Early in the field of image fusion were Burt et al. [56] who proposed a pyramid fusion method to achieve image fusion through multi-scale decomposition and reconstruction of images. Mallat et al. [57] proposed a wavelet packet fusion method based on wavelet transform, extending the traditional wavelet fusion. The fusion of images is achieved by analyzing and fusing the wavelet coefficients. Li et al. [58] proposed a non-parametric image fusion method based on information theory. By maximizing the mutual information of the fused images, a better image fusion effect is achieved. Some authors have also done some work on image fusion through neural network models in recent years. Zhang et al. [59] used convolution neural networks for multi-focal image fusion task to improve the quality of multi-focal images through effective feature extraction and fusion. Singh et al. [60] proposed a feature-level image fusion and image segmentation method for night vision context enhancement based on arithmetic optimization to achieve low light image enhancement and fusion.
Finally, this study employs a combination of meta-heuristic algorithms and CS-based methods, while utilizing adaptive weights to adjust the band coefficients and edge keepers to improve the problems in image fusion. Specifically, the arithmetic optimization algorithm is improved by introducing dynamic random search technique operator and opposition-based learning operator to enhance the ability of the algorithm to jump out of the local optimal solution and the search capability. In solving the adaptive multi-spectral image fusion problem, several techniques are combined to simultaneously compute linear combinations of gradient weights to better fuse features from multiple images and reduce the effects of spectral distortion and local artifacts. These improved methods are expected to improve the performance and effectiveness of image fusion techniques and provide better solutions for practical applications.
CS-based method
For CS-based methods, the spatial and spectral information in the MS image can be considered as separable. Therefore, a spectral transformation of the MS image is generally performed to separate the component containing the most spatial information from the spectral component in order to replace the spatial component in the up-sampled LR MS image directly with the corresponding PAN image. Following this principle, the up-sampled LR MS image first needs to be projected into the new space by an appropriate transformation to produce the spatial components. These spatial components are then replaced, in whole or in part, with histogram-matched PAN images. Finally, the fused high-resolution (HR) MS image is generated by an inverse transformation. There are some classical and common transformations in this type of method, such as the IHS, PCA and GS transform [61].
CS methods have a number of advantages. They are simple and fast to run, and they retain the spatial information in the fused product [62]. Due to incomplete matching of spectral channels between MS and PAN images, local differences may lead to unwanted spectral distortion. Therefore, spectral distortion needs to be dealt with by histogram matching before replacement, ensuring that the histogram of the PAN image matches the histogram of the corresponding component MS image. The CS method is a premium solution when fusing highly correlated MS and PAN images.
Current research articles on image fusion show that CS-based methods excel in enhancing the spatial detail of fused images. These methods are simple to operate and easy to implement. Although in terms of accuracy, they may not be comparable to other methods. However, their appeal to researchers lies in their simplicity and effectiveness, and still makes them worthy of further research.
In mathematics, CS-based image sharpening methods have been summarized by several scholars and can usually be written as
Where P refers to the PAN image and I is the intensity component of the IHS method and has spatial detail information. The formula is as follows.
In this case, the variable α is used to define the band coefficients, which are non-negative real numbers less than 1. In order to evaluate the calculation of these coefficients, the following optimization problems need to be solved in the study to reduce the effect of the low frequency component:
The optimal solution for the coefficient d, which can be calculated by using the least squares method (LSM), is expressed in the following form:
At this point, Equation 2 and Equation 5 are used to calculate the primitive detail map.
Several evaluation metrics can be used when objectively evaluating the experimentally obtained panchromatic sharpened images. In addition to visual inspection of the color sharpness and naturalness of the images, the following six commonly used metrics can be used for comparison to more fairly and objectively assess the fusion performance of different optimization algorithms. The correlation coefficient (CC) is a measure of the correlation between the sharpening result and the reference, with a larger CC value indicating better panchromatic fusion and less distortion. The optimal value for CC is 1. Root mean square error (RMSE) is a commonly used evaluation metric to measure the degree of difference between the reconstructed image and the original image, and thus to assess the quality of the reconstructed image. Relative global dimensional synthesis error (ERGAS) is often used to measure the overall quality of the sharpening result, where an optimal value of 0 for ERGAS indicates optimal image fusion. The universal image quality index (UIQI) is used to reflect the degree of correlation loss, the degree of luminance distortion and the degree of contrast distortion; A higher value of UIQI indicates better retention of spectral quality. When the value of UIQI reaches 1, the spectral quality is optimal. The spectral angle mapper (SAM) is typically used to indicate the absolute value of the spectral angle between the fused result and the reference vector. The optimal value for SAM is 0. The relative average spectral error (RASE) is typically used to represent the average performance within a spectral band. Where a lower value of RASE indicates a higher spectral quality. Here the optimum value ofRASE is 0.
.
The AOA Algorithm
Abualigah et al. were inspired by the principles of mathematical operators and proposed AOA using properties and laws of mathematical operators plus optimizers and other methods. The operational process of AOA includes parameter initialization, exploration and optimization in the development phase. In the design of the algorithm, the basic principles of meta-heuristic primitives are fully considered and inspired in this study and have been inspired by them. By modeling the behavior of arithmetic operators, AOA is able to select, update and move individuals in the population in order to find a more optimal solution. By continuously iterating and updating the population, AOA is able to progressively improve the optimization results and demonstrate good performance in solving various optimization problems.
A population needs to be randomly generated before the initiation of AOA, where each individual is a set of candidate solutions. Assume that the dimension space of the real problem is n and that there are N individuals within the population. The candidate solution matrix is shown below:
The AOA is developed mathematical optimizer acceleration (MOA) function for adaptive selection of exploration and exploitation behavior, the mathematical expression of which is:
Where MaxIter is the pre-set number of population change updates and CurrentIter denotes the number of iterations currently in place with a value between 0 and Max. According to Abualigah et al. Min and Max are usually set to 1 and 0.2. Another important function as an AOA is the mathematical optimizer probability (MOP), where the mathematical expression is
where β is used is expressed as a sensitive parameter that usually indicates the development accuracy during the operation of the algorithm. Again this parameter was specified as 5.2021 in the experiments in the article by Abualigah et al.
In each iteration of AOA, three random numbers (r1, r2 and r3) are generated. In this case, the size of the random number r1 and MOA are compared to determine whether the algorithm enters the exploration or exploitation phase. When MOA is less than r1, the AOA is selected to enter the exploration part D (exploration) or M (movement). In the exploration phase, the update scheme for the population individuals is shown below:
Where x denotes the solution in the next iteration in dimension j for the ith individual in the population, and bestX is the best individual obtained in the previous iteration. To effectively prevent the denominator from being zero, Abualigah et al. avoid this by including a very small integer c. and by controlling the accuracy of AOA’s search for the best by μ. The formulae ub and lb denote the upper and lower bound values of the space to which the problem belongs, respectively.
The AOA decides whether to explore by comparing the random number r1 with the MOA. If the conditions for entering exploration are not met, the AOA will automatically enter the exploitation phase. By performing S (exploration) or A (adaptation), AOA is able to effectively improve the accuracy of the search for excellence in complex problems. The following is a concrete implementation of the population location update formula for the exploitation phase:
Proposed AOA with OBL and dynamic random search for image fusion
Mathematical model
A schematic diagram for solving the adaptive multi-spectral image fusion problem is shown in Fig. 1. A simple modification of Equation (11) helps us to understand it better, and Equation (11) is modified as follows:
Where Γ
k
is a weighting matrix described as follows:
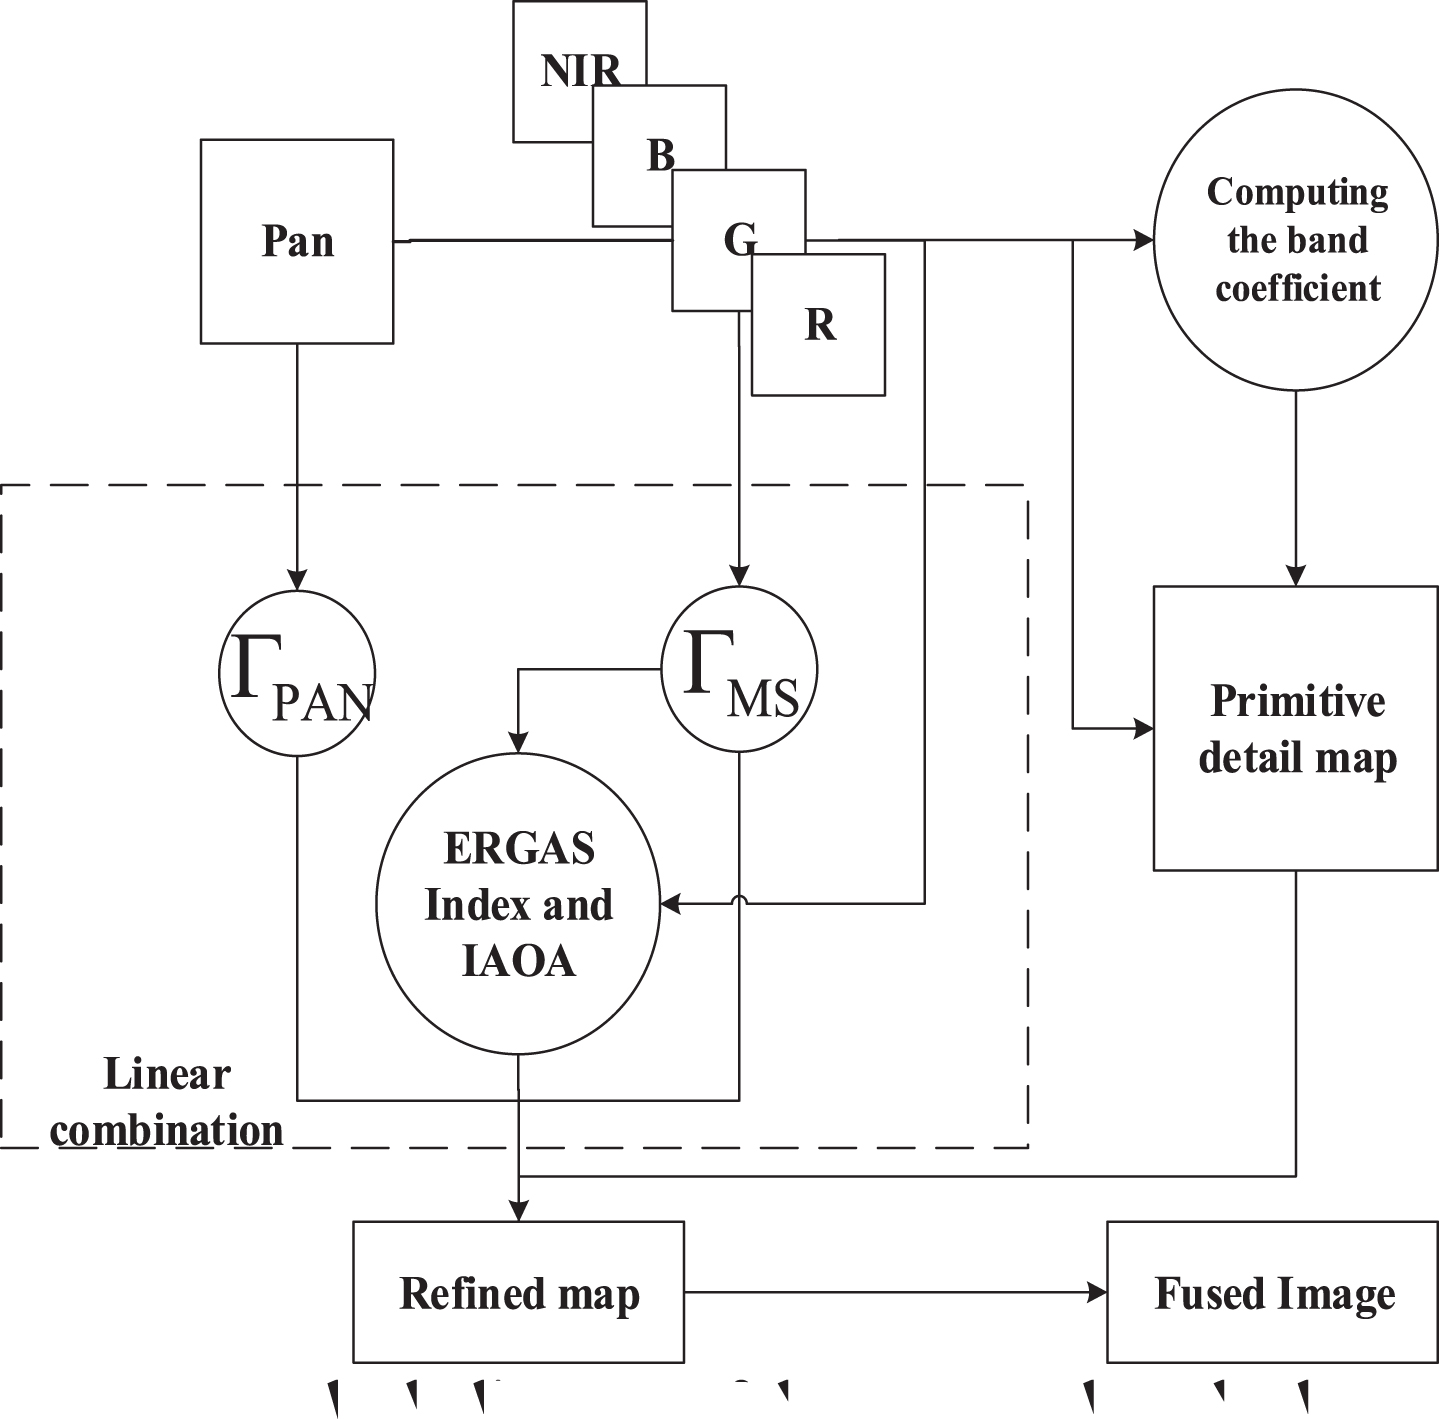
Block diagram of the proposed method.

Flowchart of the IAOA
Several variables and metrics can be defined here to illustrate the problem. P denotes the gradient of the PAN image and MS denotes the gradient of each multi-spectral band. A is a parameter used to control the smoothness of the image and e is a minimal value used to avoid the denominator being zero. As different multi-spectral bands have different spectral characteristics, this may lead to the appearance of local artifacts, which means that different multi-spectral bands do not have the same detail map. To solve this problem, we can calculate parameter B to adaptively refine the detail map by using the ERGAS index between the fused image and the low-resolution MS image.
The ERGAS index can be defined as follows:
In Equation 14 A and B represent the MS image and the fused image and are used to represent the relationship between them respectively. K represents the resolution of the high-resolution image and L represents the resolution of the low-resolution image. M is the average radiance of the only band involved in the fused image, while RMSE represents the root mean square error and is used to measure the degree of difference between the two images.
The DRST is a novel random search method introduced by Hamzacebi et al. [55]. The DRST method consists of two phases: a regular search phase and a local search phase.
In the regular search phase, a global search is performed by randomly generating candidate solutions, similar to the traditional random search method. However, unlike the traditional method, DRST saves the information related to the location of the found fitness for use in the subsequent local search phase. In the local search phase, the saved aptitude location information is used as a base point by searching for a better solution within its surrounding area. In this way, DRST not only searches for the optimal solution at a global scale, but is also able to further optimize the solution at a local scale. By combining global and local searches, DRST is able to make full use of known information about the location of the fitter during the search process in order to approximate the optimal solution as efficiently as possible. This strategy can improve search efficiency and help overcome the limitations of traditional stochastic search methods.
In this study, the local search phase is the focus of the research. The mining capacity of AOA is enhanced by its search capability. Therefore, local search techniques are presented in this section. A random search is performed in the vicinity of the best solution of the mining phase of the algorithm, which in turn reveals whether a better solution exists in the vicinity of the historical optimal solution.
The Opposition-based learning (OBL)
The OBL is a method based on adversarial. The basic principle of OBL is to introduce adversarial and to transform the learning problem into a multi-party game process [64]. In OBL, the model no longer optimizes alone, but competes and confronts one or more adversaries. By interacting with the adversaries, the model can gain feedback and inspiration from their behavior and further optimize its own decision-making strategy and performance.
In the optimization problem, candidate solutions and their opposite solutions are played as adversaries in a multi-party game. This allows for faster convergence of the search algorithm and near-global optimal solutions. By selecting the better fitter as the initial solution through a process of competition and rivalry, it helps to bring the optimization algorithm closer to the globally optimal solution. By introducing adversarial competition and games, OBL can help algorithms learn to adapt to uncertain environments, optimize decision strategies, and have good generalization capabilities.
Assuming that
In this section, space complexity and time complexity will be used to illustrate the computational complexity of IAOA, which is discussed next by analyzing them separately. The complexity of AOA is mainly affected by the number of iterations of population updating (T), the number of individuals in the population (N), and the problem dimensions of multi-spectral adaptive fusion (D).
Time complexity
The IAOA requires these operations in each generation (iteration) when solving the multi-spectral image fusion problem. Firstly, update the position of the individual. Secondly, the fitness value of the individual is calculated (to assess the quality of the solution.). Finally update the individual optimal solution and the global optimal solution. The time complexity of updating the positions of the individuals is O (N×D). The time complexity of calculating the fitness value of an individual is O (N×D). The time complexity of updating the individual optimal solution and the global optimal solution is O (N). Therefore, the time complexity of each generation is O (N×D). The number of iterations of the OBL process is T and the number of iterations of the global and local search processes in the DRST operator is T. Thus the total time complexity is O (T×N×D).
Space complexity
IAOA needs to store the location information of individuals when solving the image fusion problem and requires a space of O (N×D). The DRST operator needs to store the individual optimal solution and the global optimal solution, which requires a space of O (D). Therefore, the total space complexity is O (N×D).
Experimental results and analysis
In this section, an evaluation of the effectiveness and feasibility of IAOA in solving adaptive multi-spectral image fusion models is carried out. In order to validate IAOA’s ability to solve the adaptive multi-spectral image fusion problem, experimental data from two satellites and with different themes are used as a benchmark. The dataset used for the experiments in this section is NBU_PansharpRSData, available at https://github.com/starboot/NBU_Panshar~pRSData. Where this dataset contains data from the QuickBird, IKONOS, GF and WorldView satellites, this experiment focuses on data from the commonly used QuickBird and GF satellites to obtain four classic scenes for experimentation. This section is presented through the following five aspects. The dataset details and algorithm parameters are shown. Experimental results of 10 well-known algorithms are presented and compared in the dataset with the theme Urban. Experimental results of 10 well-known algorithms are presented and compared in the dataset with the theme Green Vegetation. The experimental results of 10 well-known algorithms are presented and compared in the dataset on the theme of water scenes. The experimental results of 10 well-known algorithms are presented and compared in the dataset on the theme of coast.
Experimental setup
The proposed algorithm is compared with 10 algorithms, such as PSO, ACO, DE, GA, GWO, WOA, EO, AHA, AO and AOA. The MATLAB source codes for PSO, DE, GA, GWO, WOA, AOA, EO, and AHA are available from https://seyedalimirjalili.com/, the ACO in MATLAB source code can be obtained at https://yarpiz.com/67/ypea104-acor [11] and the MATLAB source code for AO proposed by Abualigah L and Yousri D et al. can be downloaded from https://ww2.mathworks.cn/matlabcentral/fileexchange/89381-aquila-optimizer-a-meta-heuristic-optimization-algorithm. The parameter settings for each of these algorithms refer to the published articles, and the specific parameters and their values are shown in Table 3. The same data set was used for all experiments, and to eliminate the effect of randomness on this experiment, all algorithms were run 30 times independently, with 10 iterations as the dimensionality of the problem was not very large. The mean value obtained for each function in the experiment is recorded, where bold indicates superiority over the other algorithms. This paper effectively demonstrates the validity and feasibility of IAOA by comparing convergence curves, analysis of variance tests and radar plots. In addition, SAM is measured in degrees.
Considering the fairness and credibility of the experimental results, the system environment of all meta-heuristic algorithms in this experiment remains consistent. The experiments will be conducted in MATLAB 2018a with a device equipped with an Intel Core(TM) i7-9700 processor at 3.00 GHz, an operating system of Windows 10 and 16GB of RAM. This configuration will provide sufficient computing resources to run the experiments and ensure the accuracy and reproducibility of the results.
The open database NBU_PansharpRSData contains 2270 pairs of PAN/LR MS remote sensing images. In addition, the authors group the dataset according to different thematic surface features, including urban areas, green vegetation, and water scenes.
Table 2 clearly shows the details of the NBU_PansharpRSData database.
Spatial and spectral resolutions of different satellites
Spatial and spectral resolutions of different satellites
Parameter variables involved in algorithms
Experiments in urban scenarios
The urban scene is used as a test in this section. The urban scene includes imaging data from two detectors, GF and QuickBird, respectively. Comparison will be made with the improved AOA by 10 popular meta-heuristic algorithms such as PSO, ACO, GA, DE, GWO, WOA, EO, AHA and AO. And the performance metrics of different algorithms for different fusion results are demonstrated in Table 4, where black bold indicates the optimal results. The convergence curves of the different algorithms are displayed by Fig. 3 and Fig. 4 displays the variance of metrics of different algorithms for ERGAS in urban image fusion is used to reflect the stability of the algorithms. Figure 5 clearly shows the radar chart of different algorithms ranked in different metrics, and finally the fusion results of IAOA in urban scenarios are compared through Fig. 6.
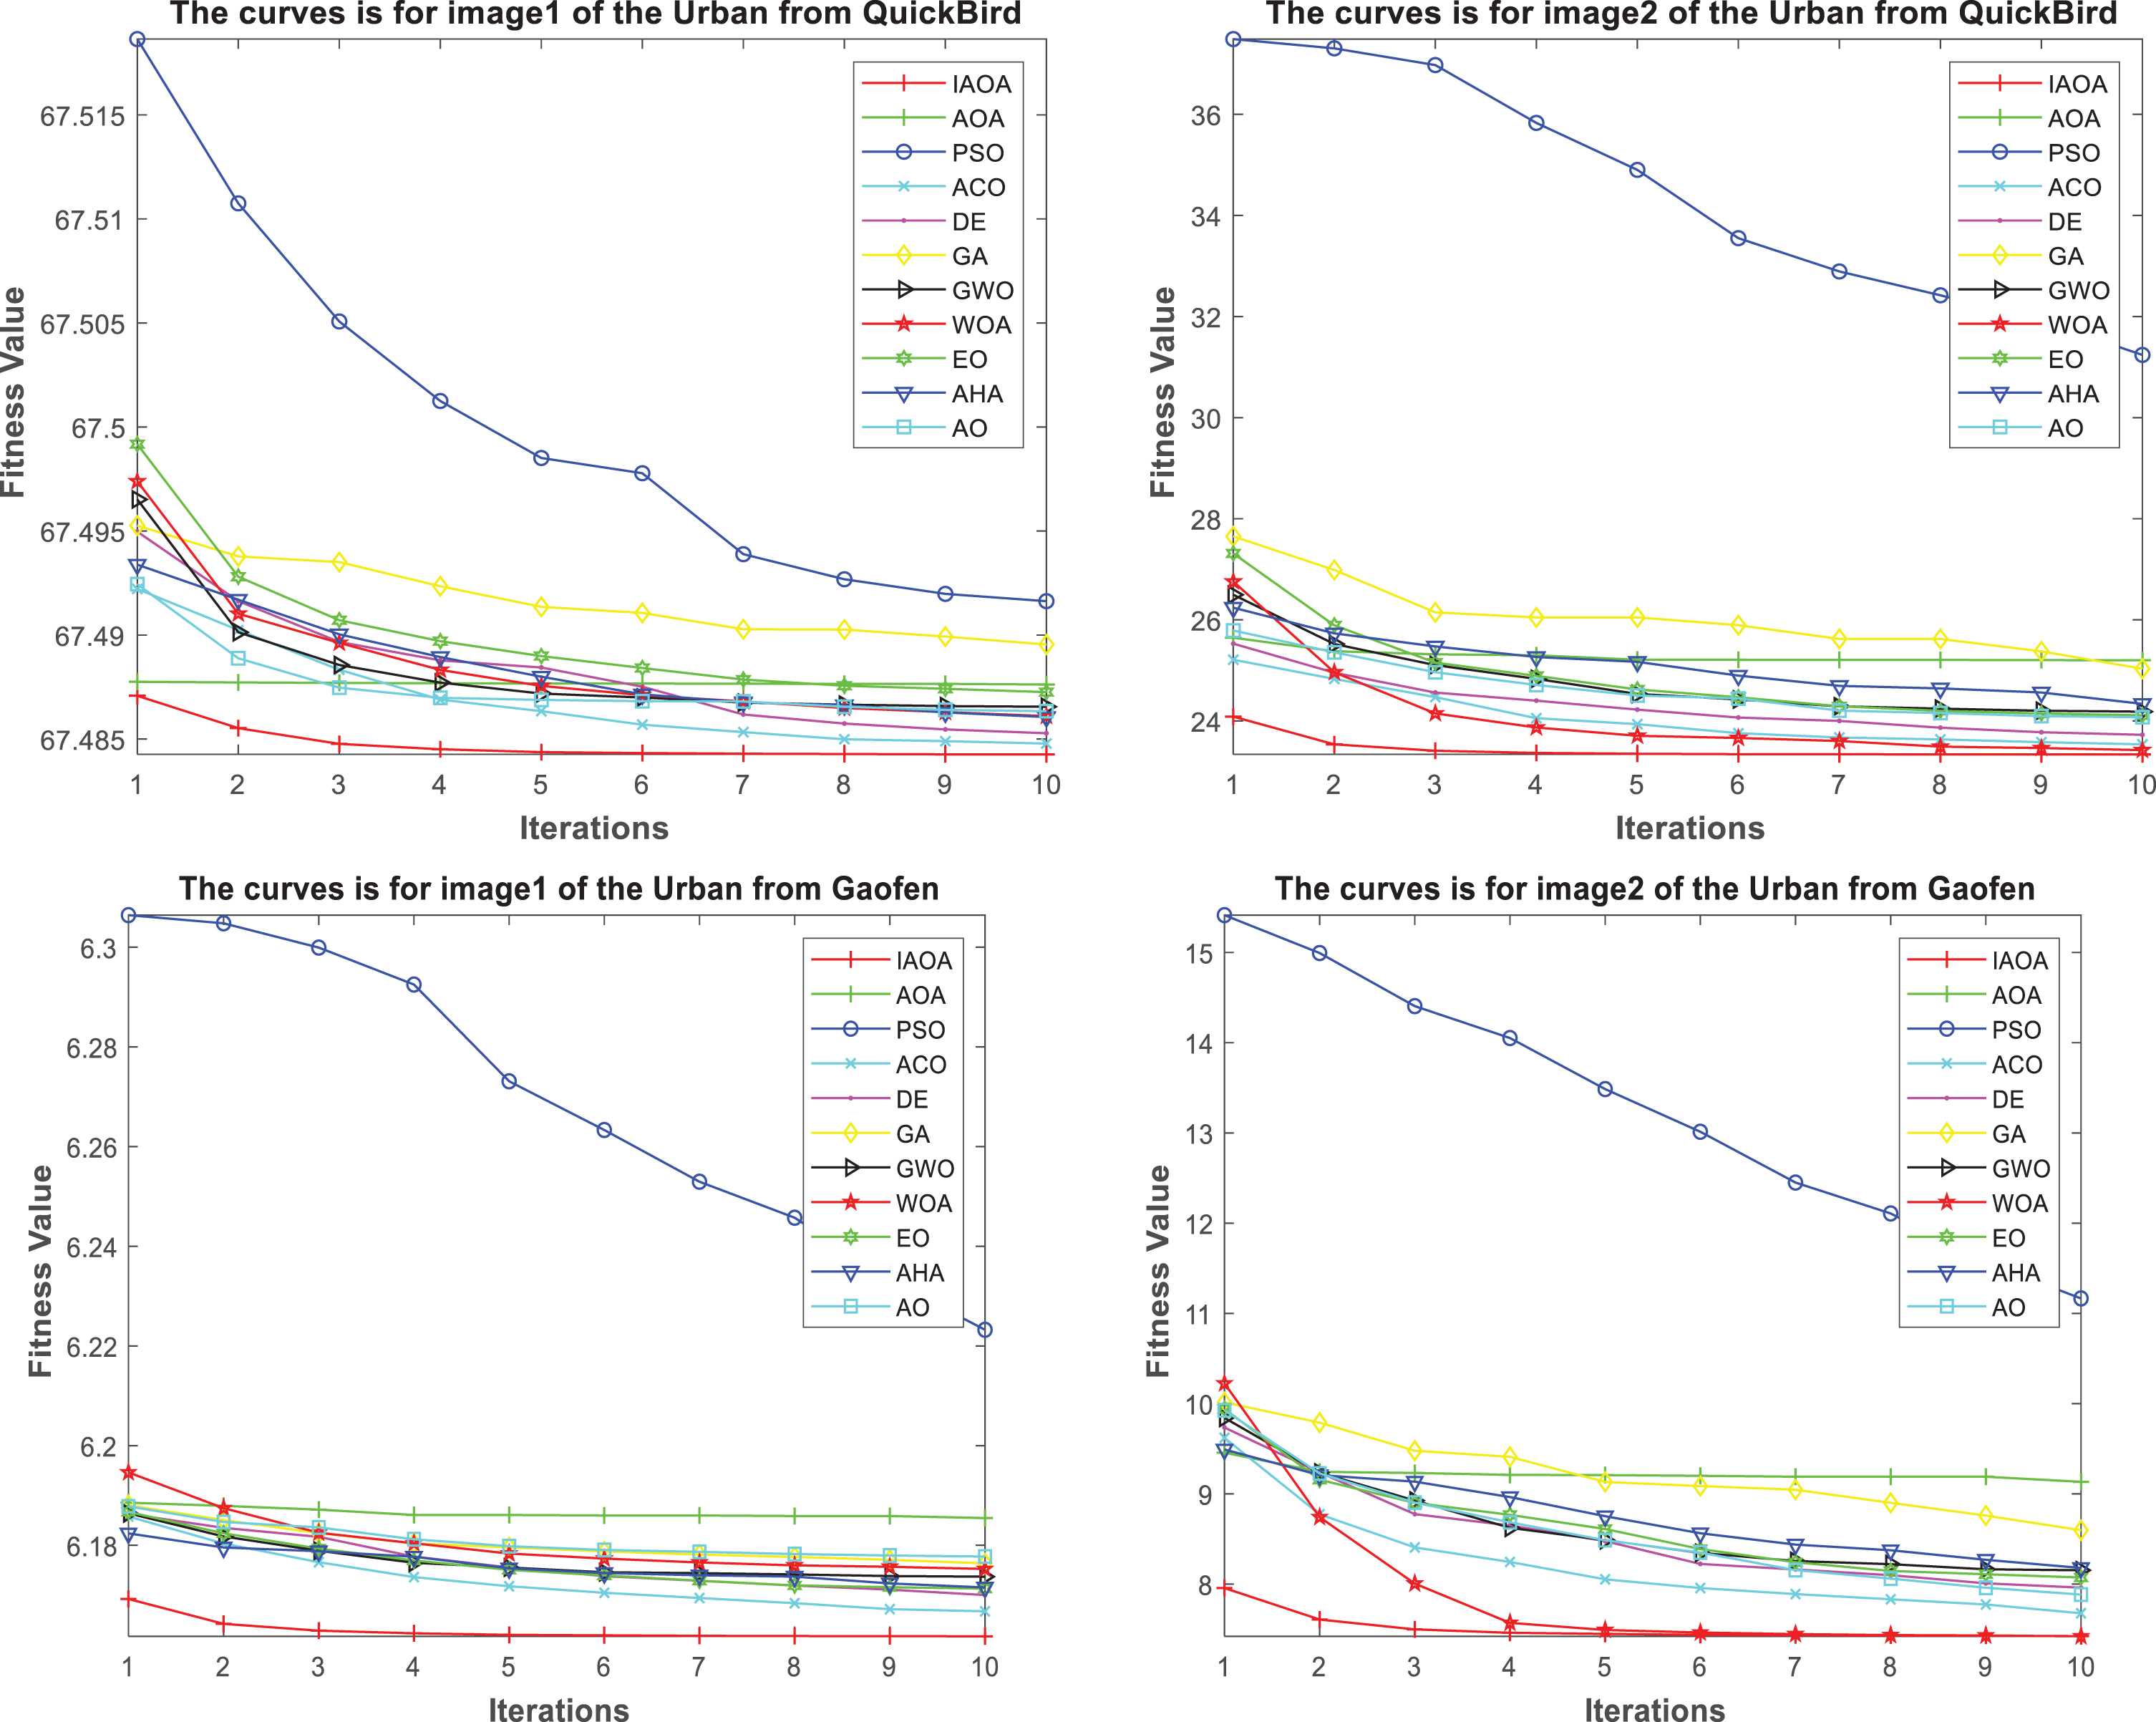
The Convergence curves of different algorithms for urban scenarios.
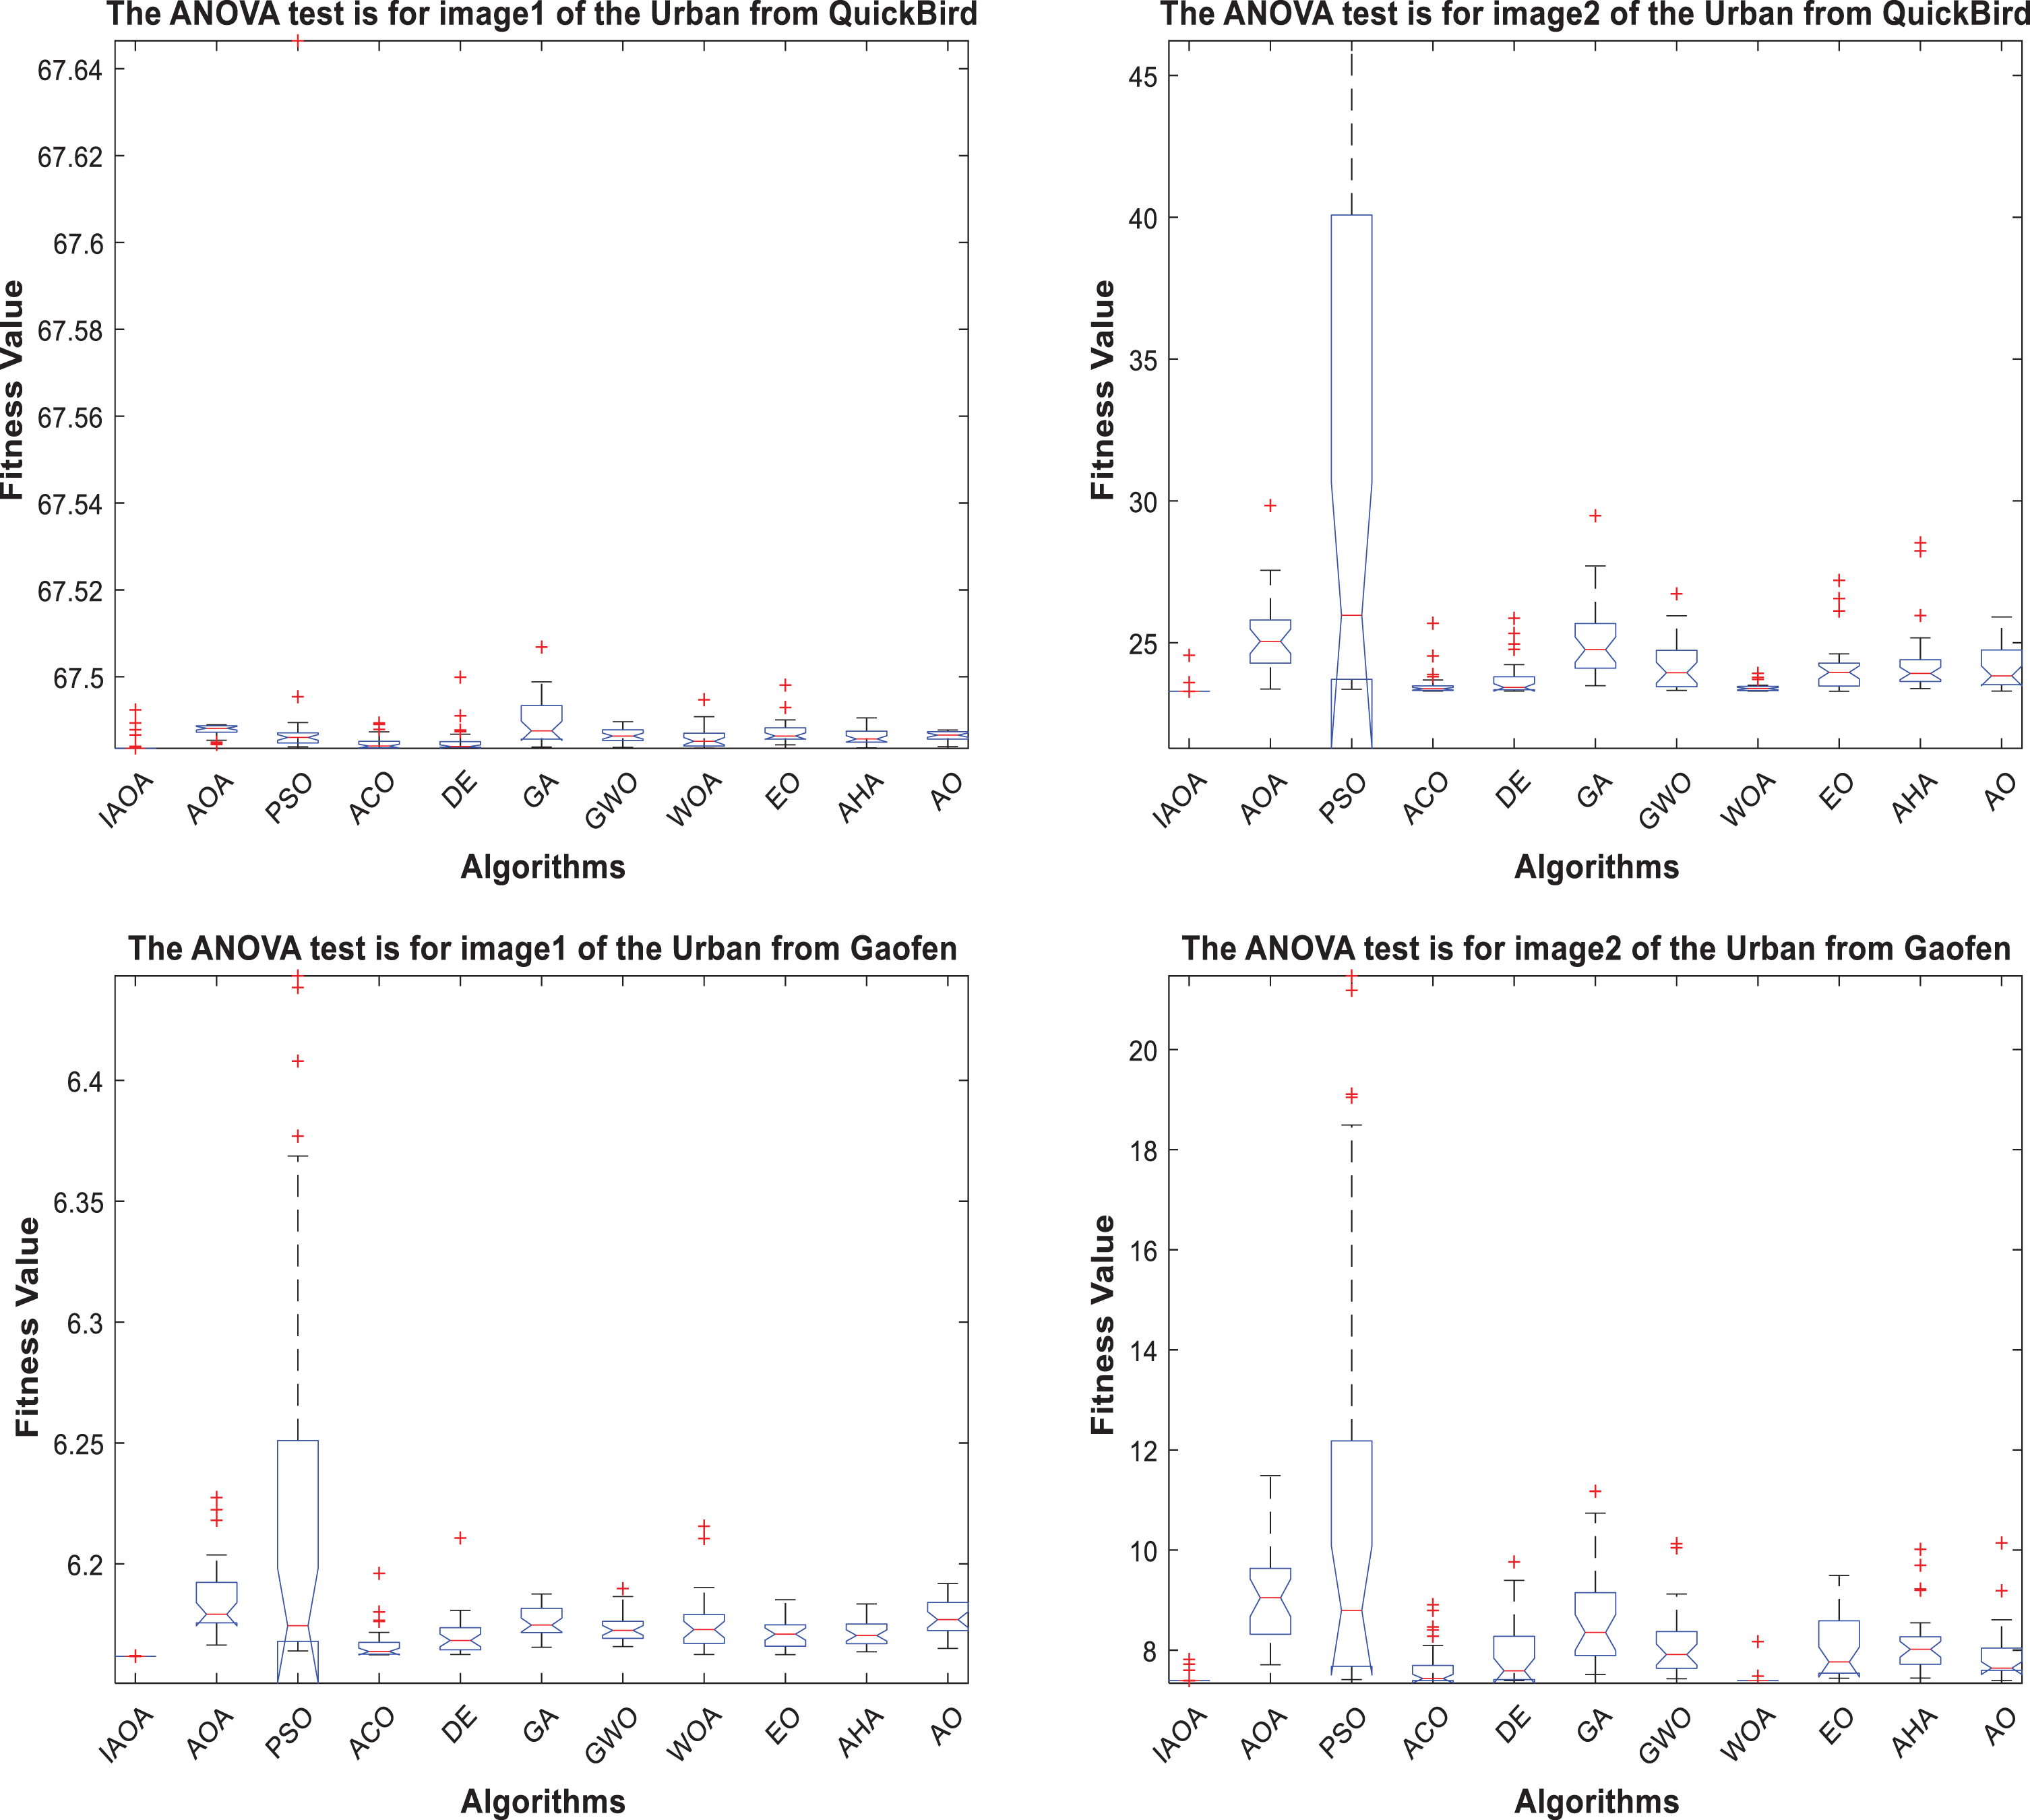
The ANOVA test of different algorithms for urban scenarios.
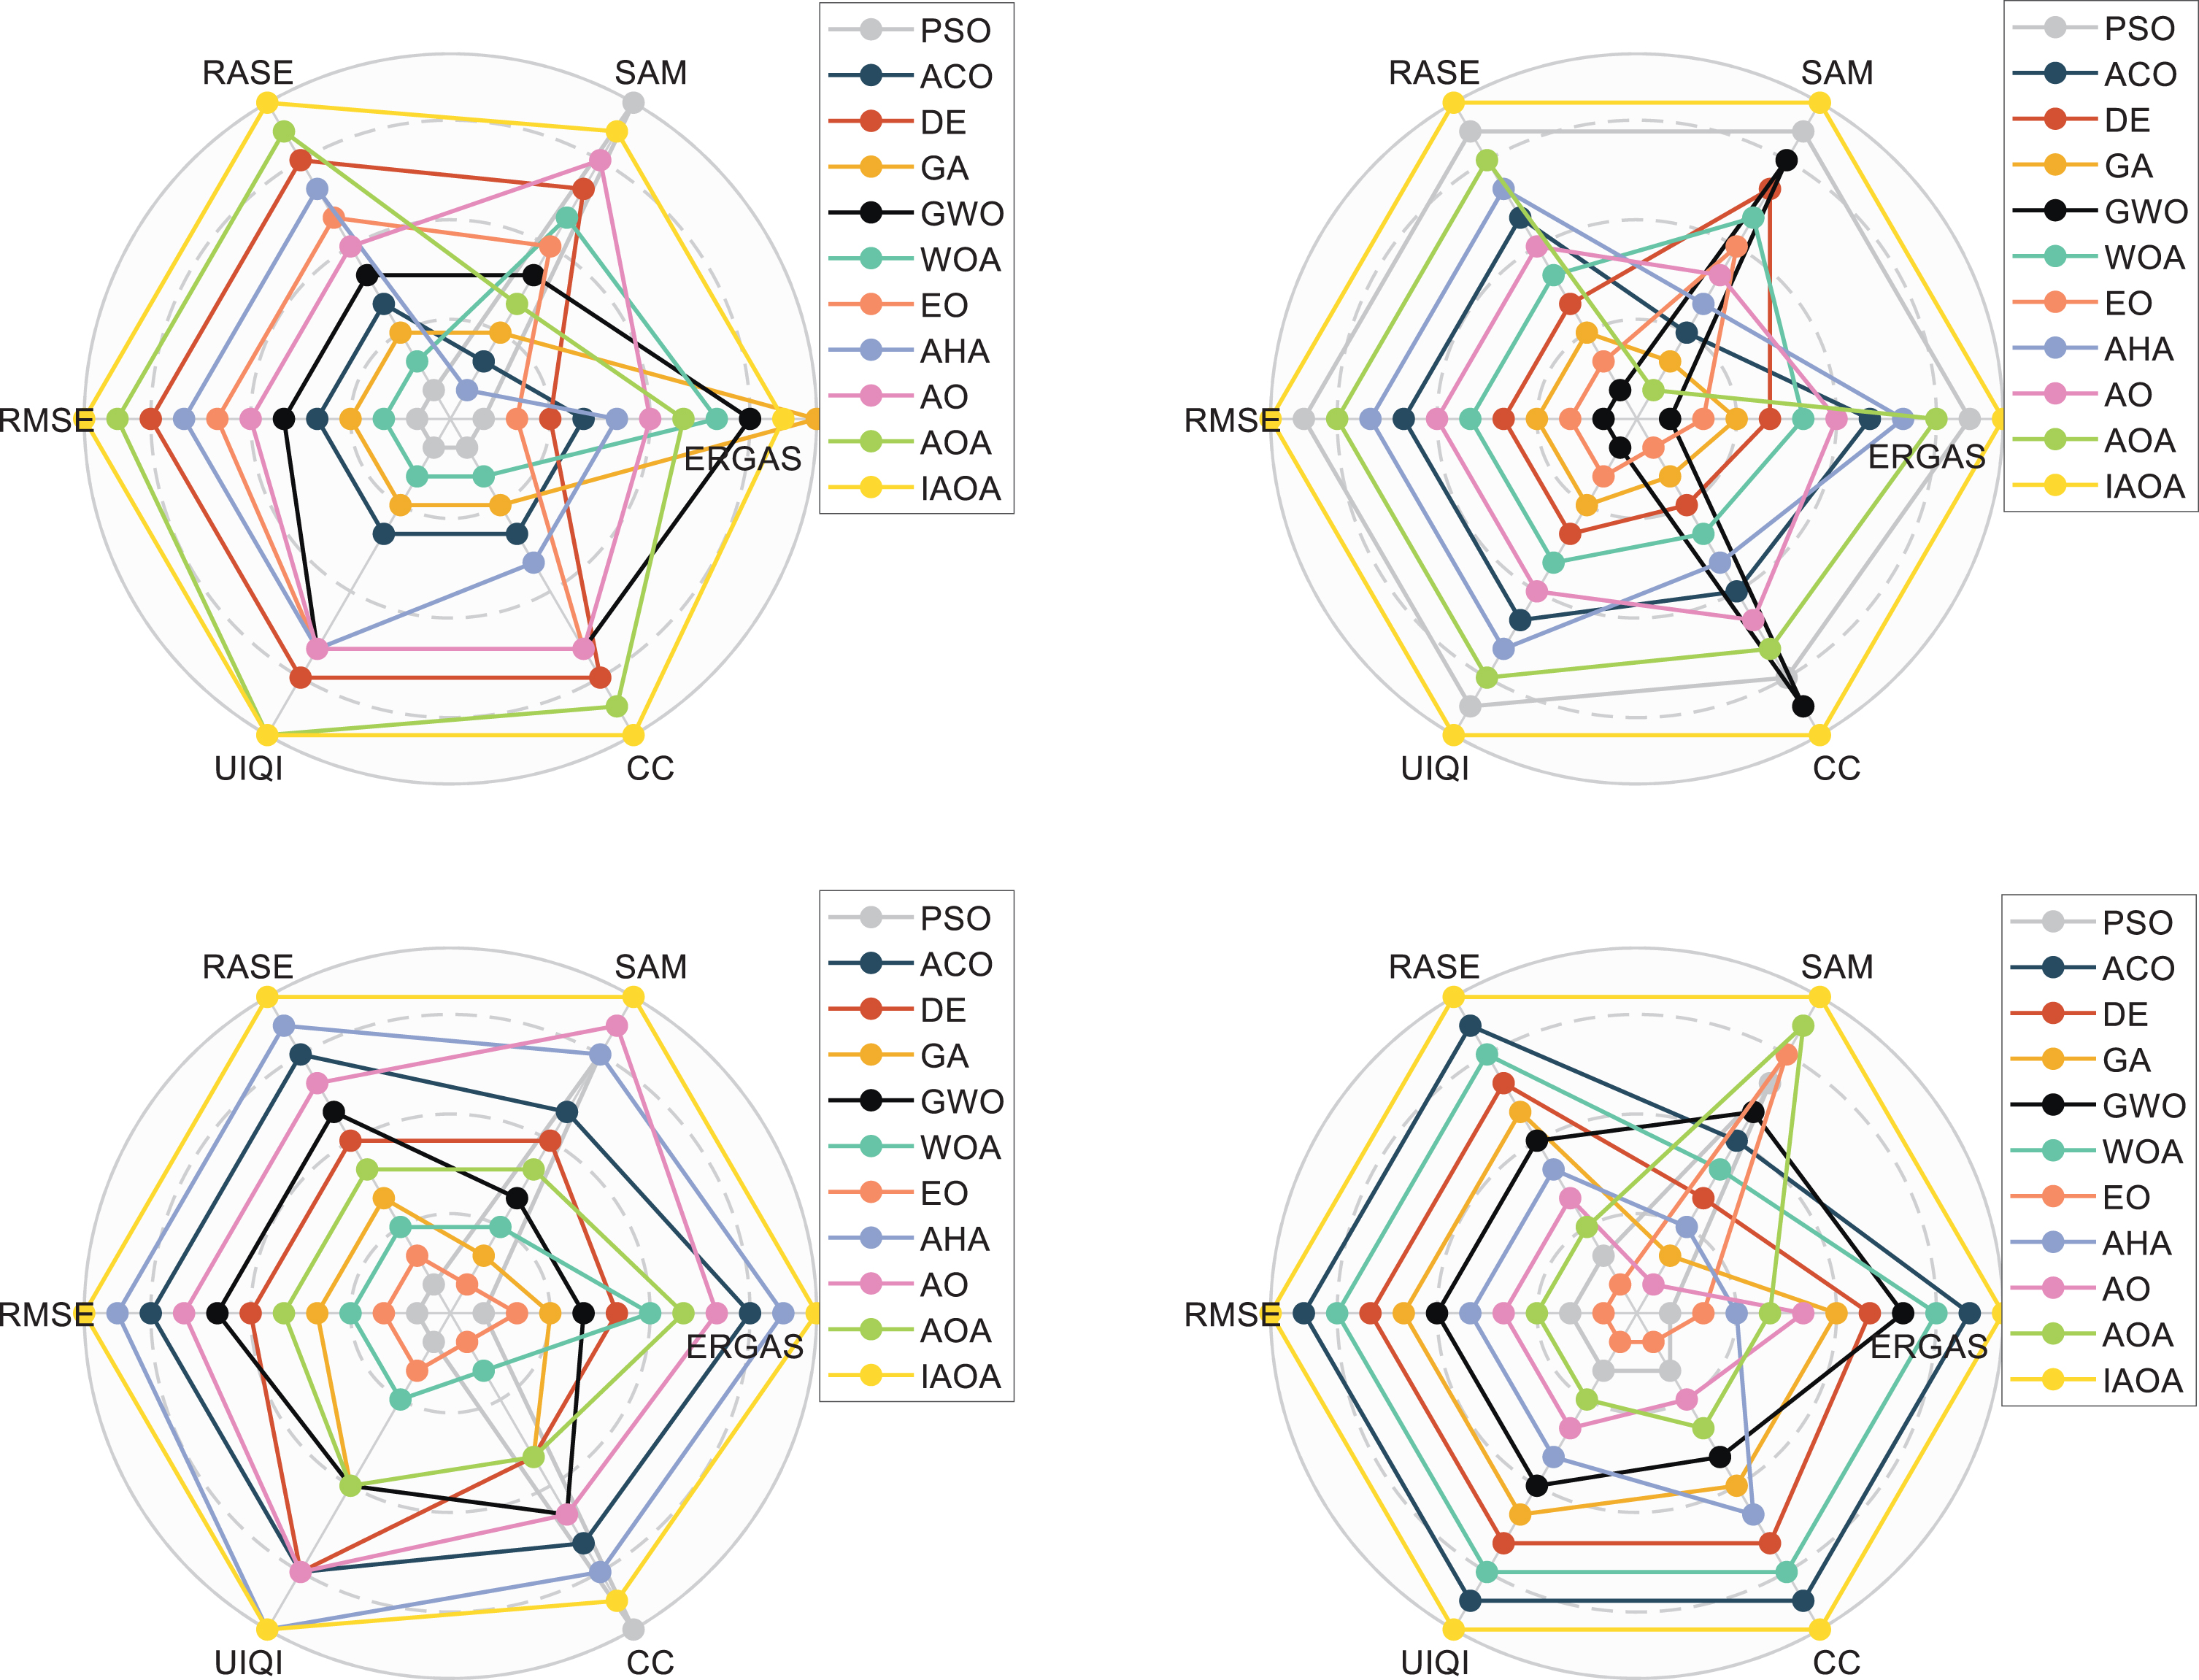
The radar map of different algorithms for urban scenarios.
Visual assessment for marked region in Urban dataset.
Experimental results of eleven algorithms for urban scenarios
The fusion results of 10 different algorithms are compared in urban scenes, the results can be clearly obtained. In the fusion results of image 1 of QuickBird it can be clearly seen that IAOA is not as good as GA in ERGAS metrics but all other metrics are better than other algorithms and only CC metrics are worse in GF-image 1.
The CC metric is usually used as a metric to measure the correlation between the sharpening results and the reference image. In urban scenes, there may be some detailed parts such as buildings and roads, which will have a great impact on the sharpening results. The GA algorithm’s unique genetic characteristics lead to the algorithm’s historical memory and genetic variation characteristics, which makes it per-form better in the face of complex building clusters and road details during operation. However, IAOA is already ahead of most algorithms.
In image 2 of the QuickBird and image 2 of the GF detector, all the performance indexes of the IAOA are better than the other algorithms. This proves the feasibility of the improved results. All the algorithms are run independently for 30 times, and it is displayed in Fig. 3 that the convergence speed of IAOA is better than the other algorithms. The convergence speed of IAOA is faster than other algorithms, which means it is easier to find the global optimal solution. The stability of IAOA is also relatively better as can be obtained in Fig. 4 [65], indicating that it has strong anti-interference ability against random noise or initial parameter changes.
Experiments in green vegetation scenarios
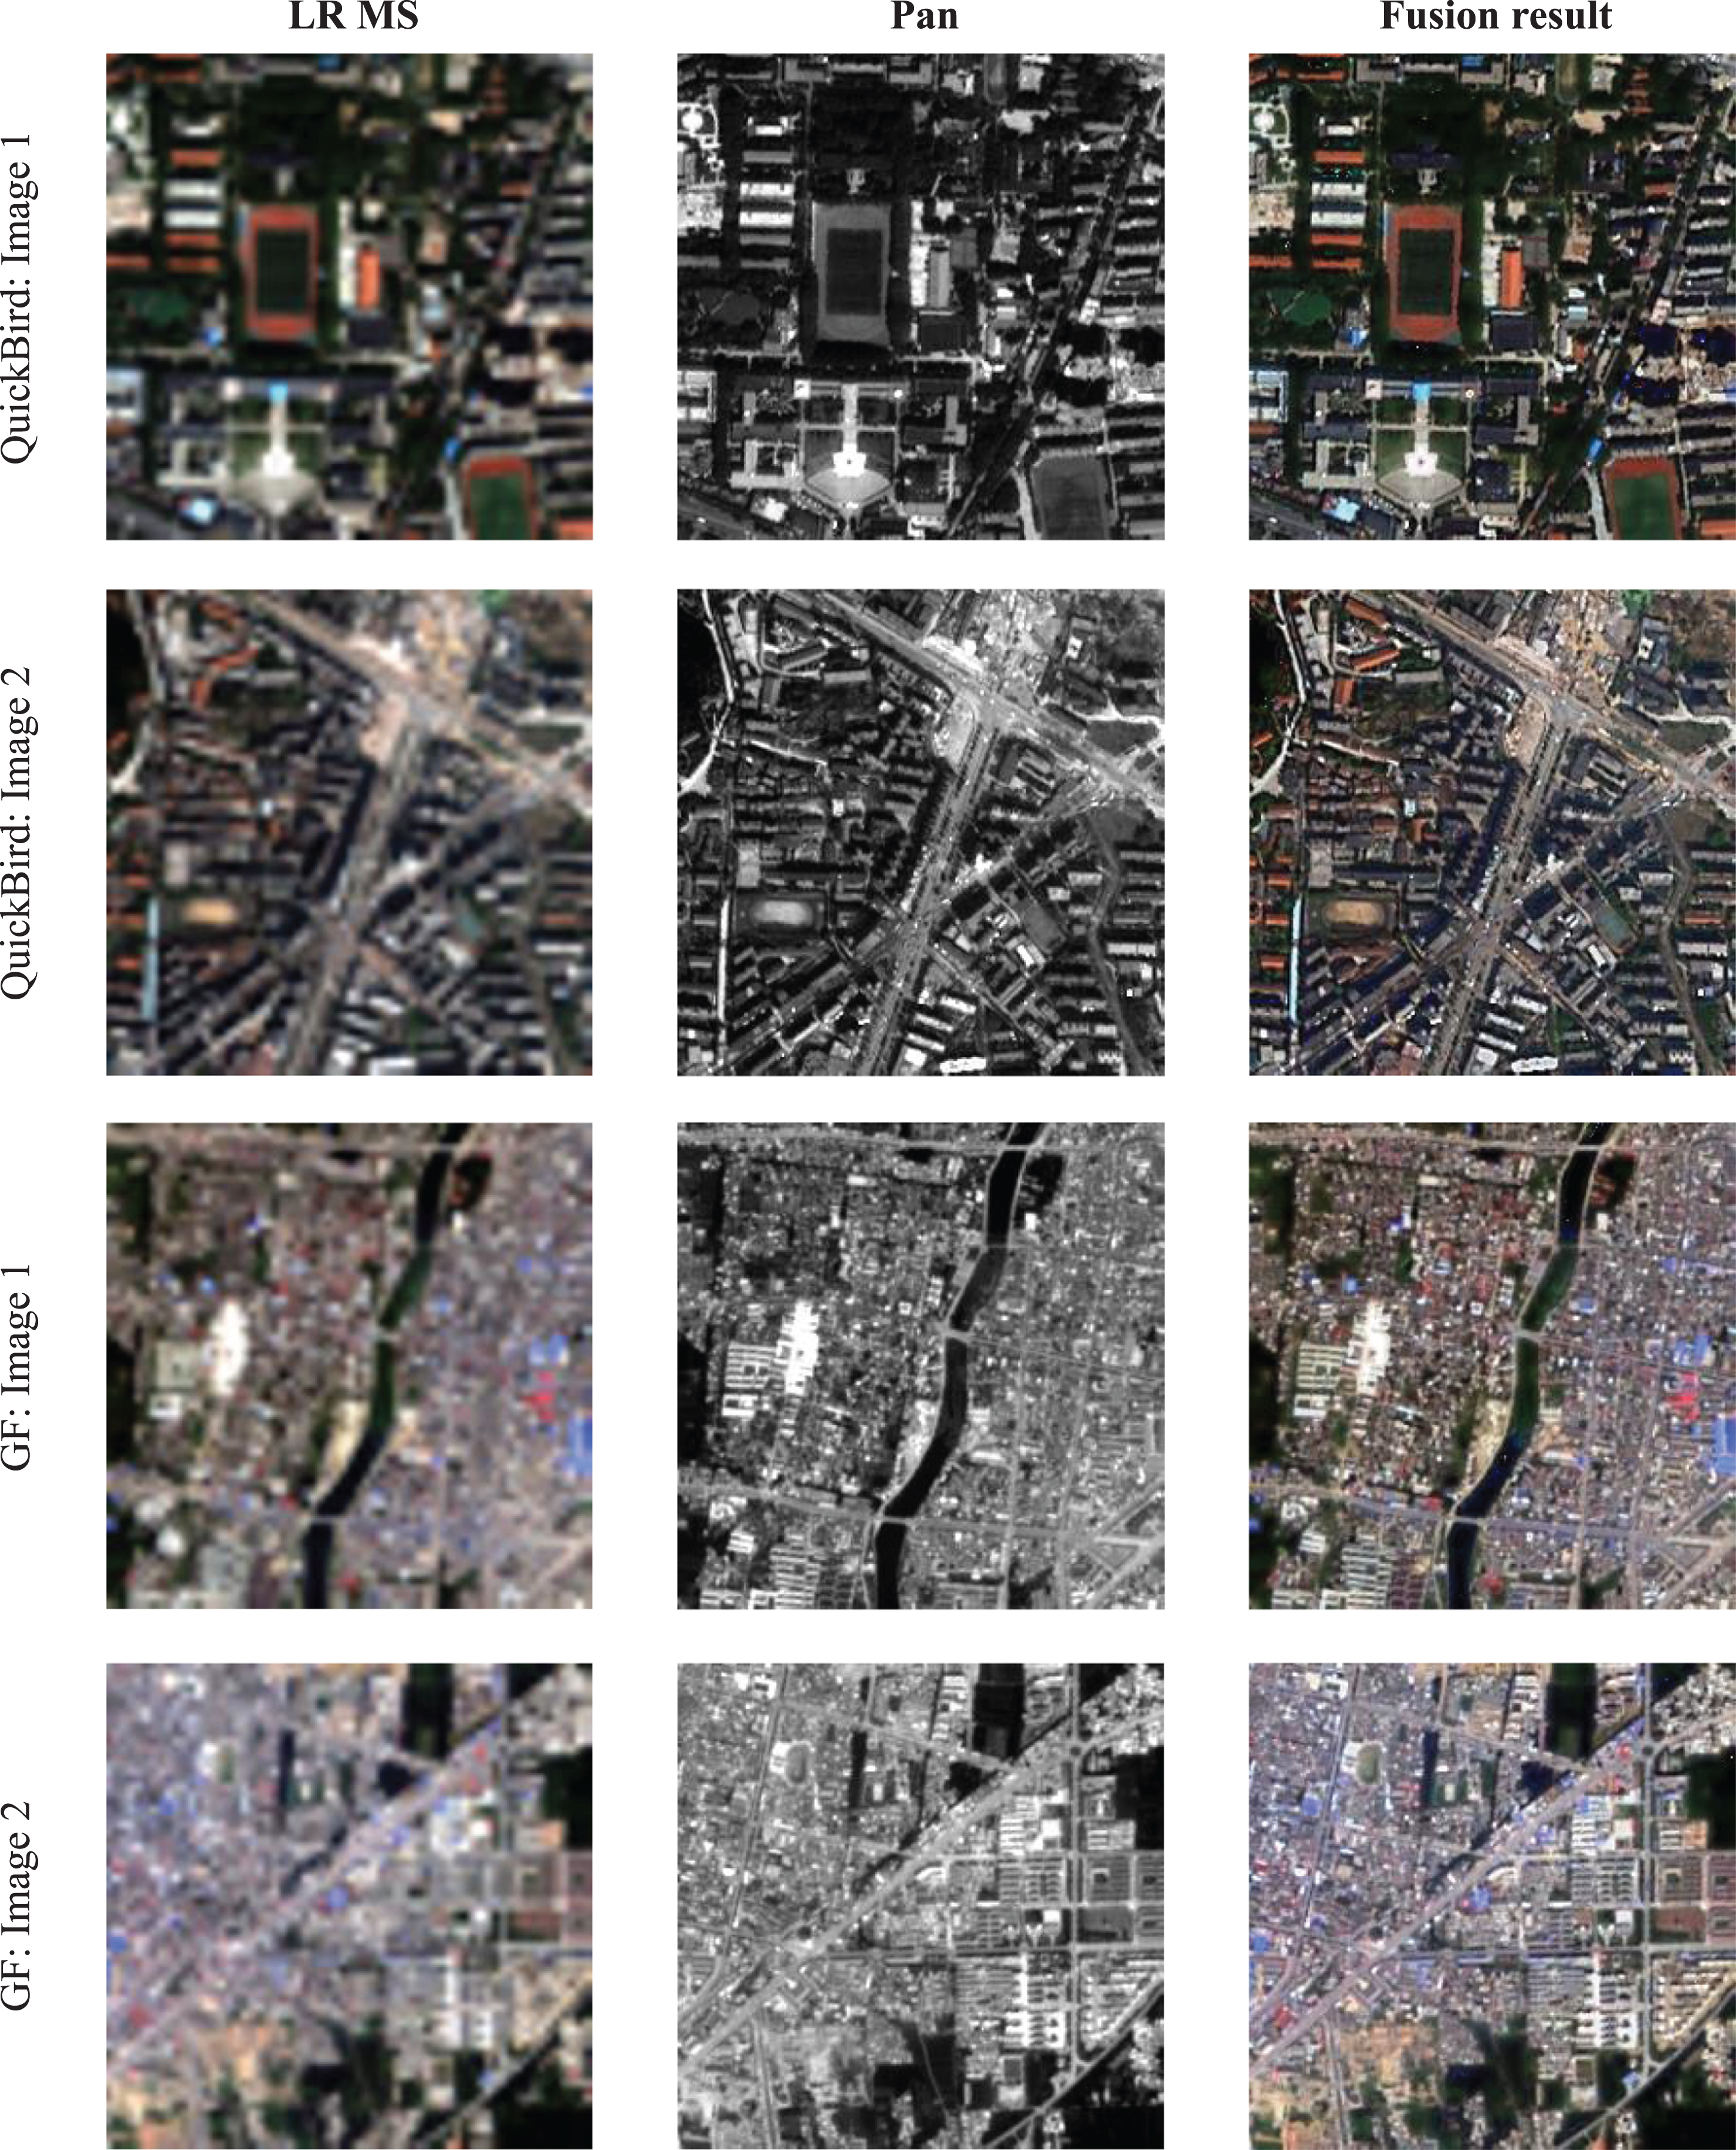
Results of the experiment
In this section, the green vegetation scene was used as a test. The green vegetation scene includes imaging data from two detectors, GF and QuickBird, respectively. The IAOA is compared with another algorithm. And the performance metrics of different algorithms for different fusion results are shown in Table 5, where black bold indicates the optimal results. Figure 7 shows the convergence curves of different algorithms, and Fig. 8 shows the variance of ERGAS metrics of different algorithms in green vegetation image fusion for reflecting the stability of the algorithms. Figure 9 clearly shows the radar chart of different algorithms ranked in different metrics, and finally the fusion results of IAOA in green vegetation scene are compared by showing in Fig. 10.
Experimental results of eleven algorithms for green vegetation scenarios
Experimental results of eleven algorithms for green vegetation scenarios
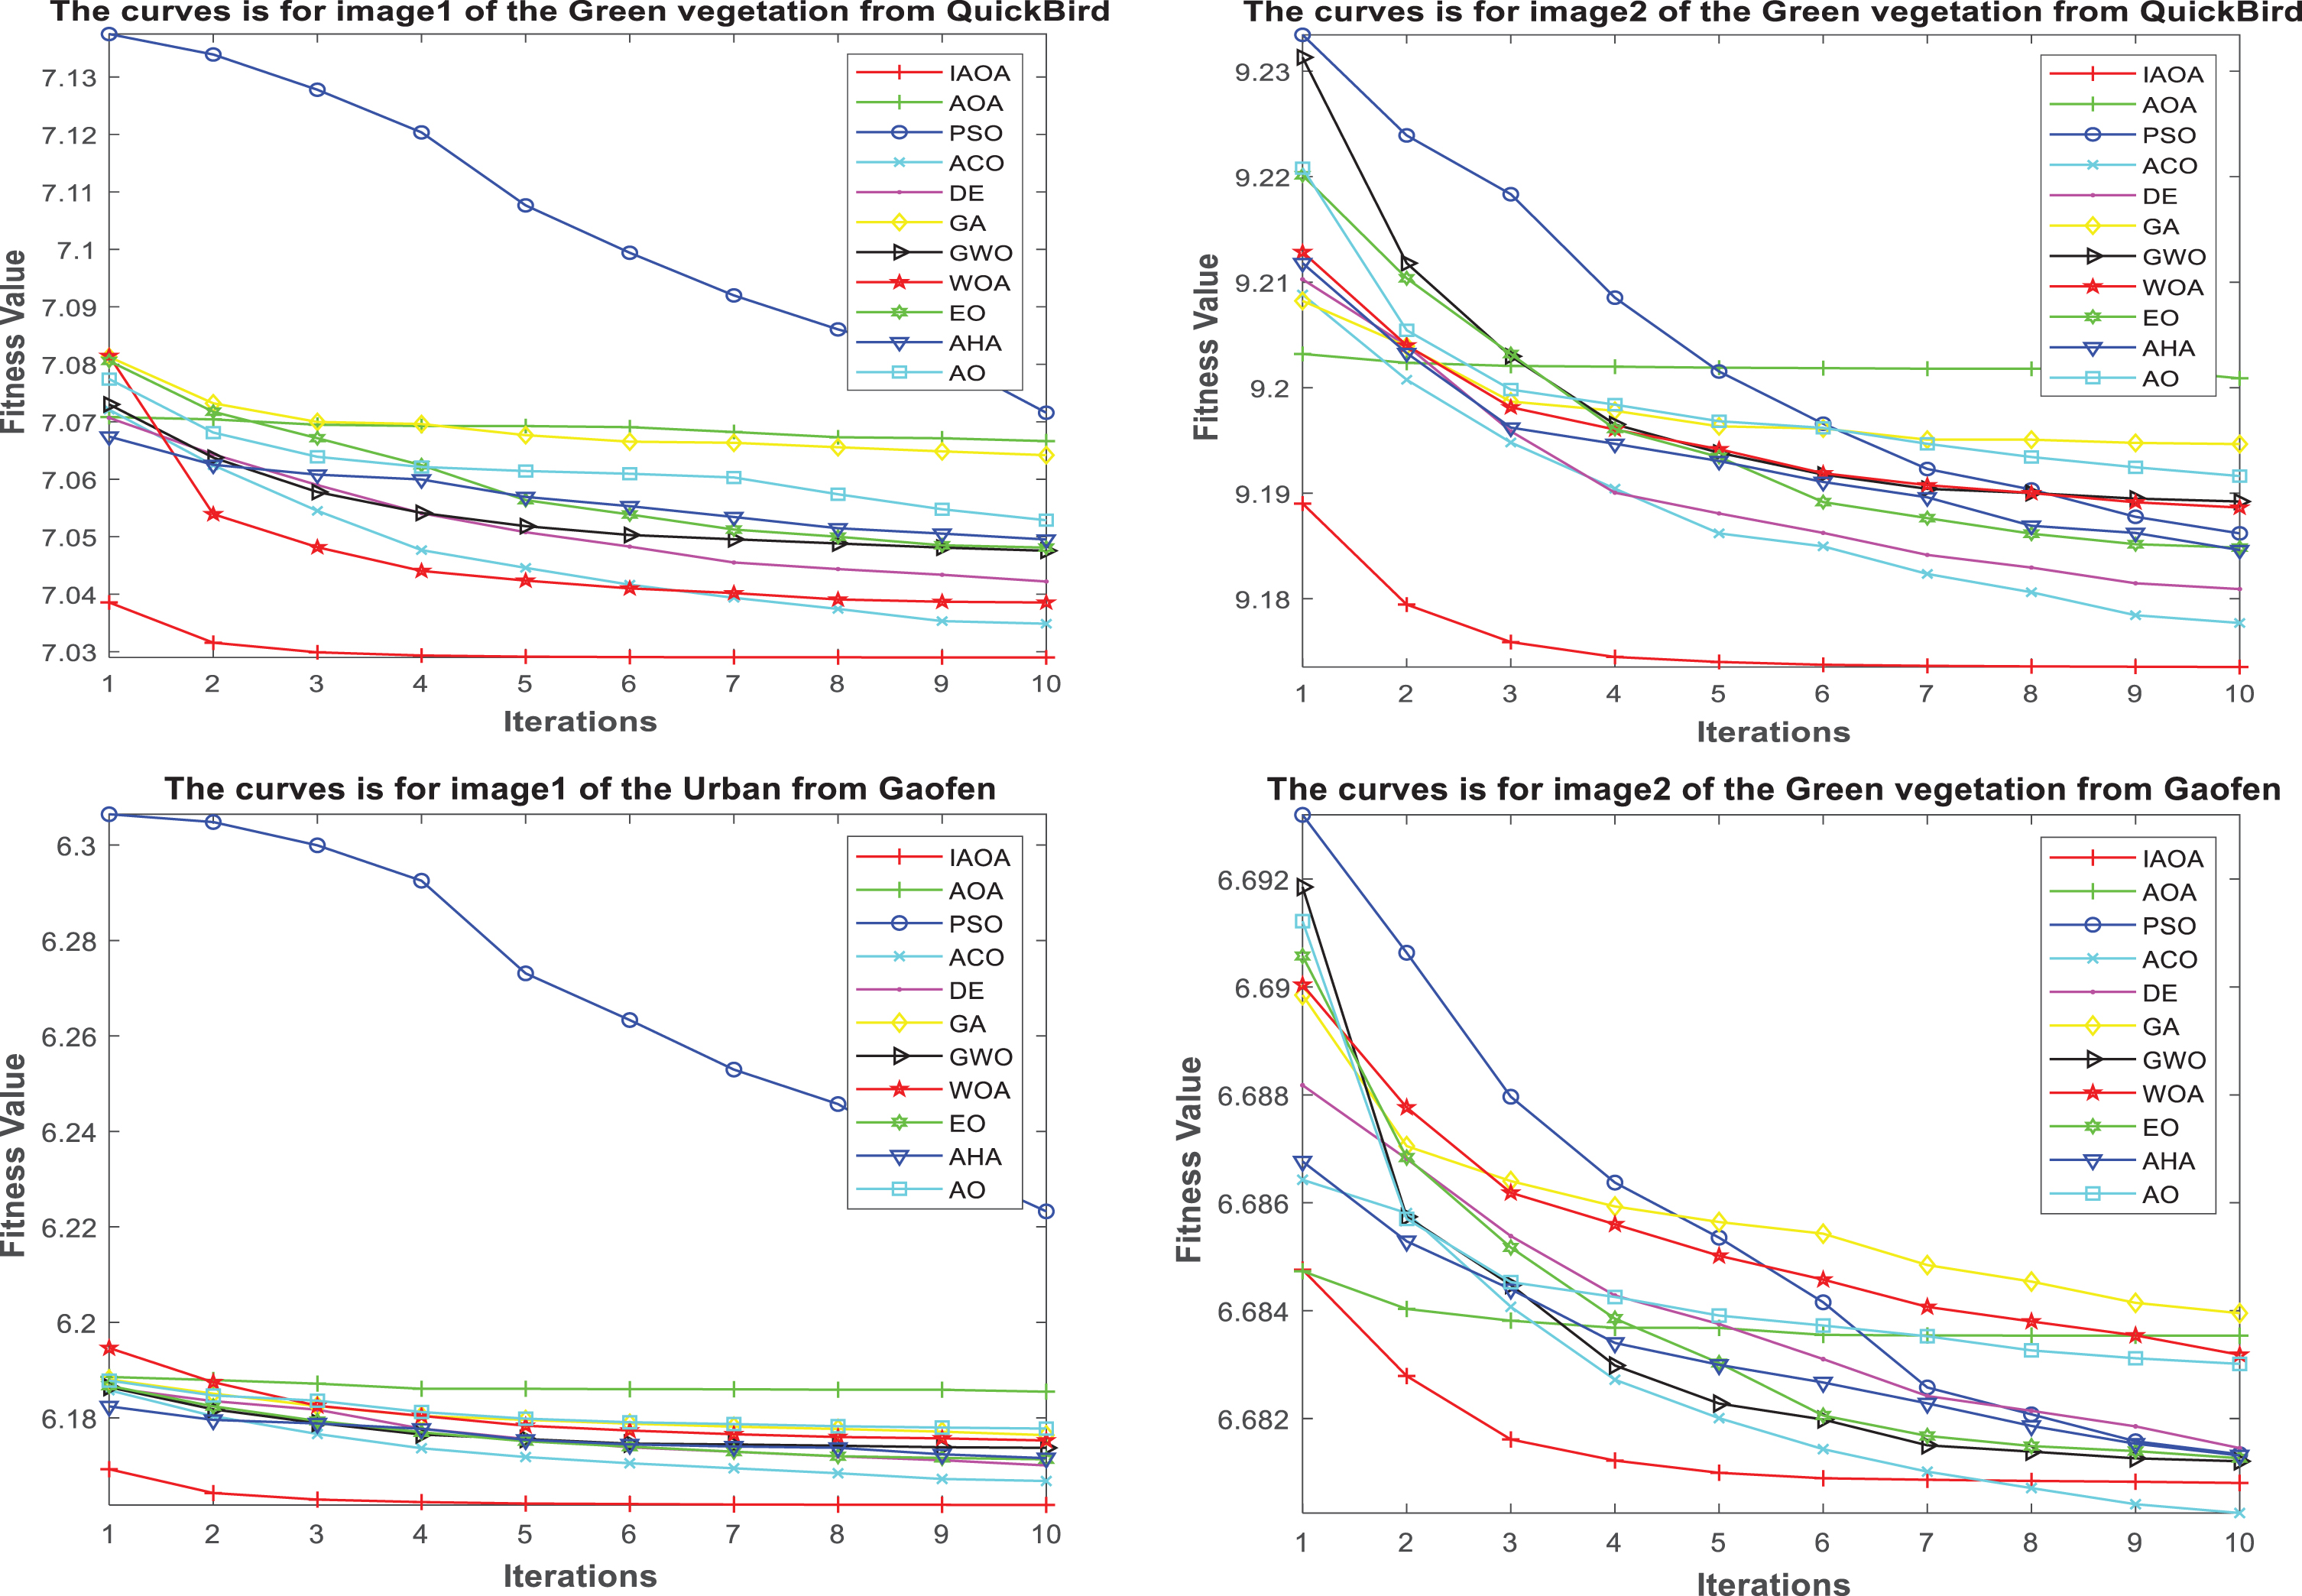
The Convergence curves of different algorithms for green vegetation.
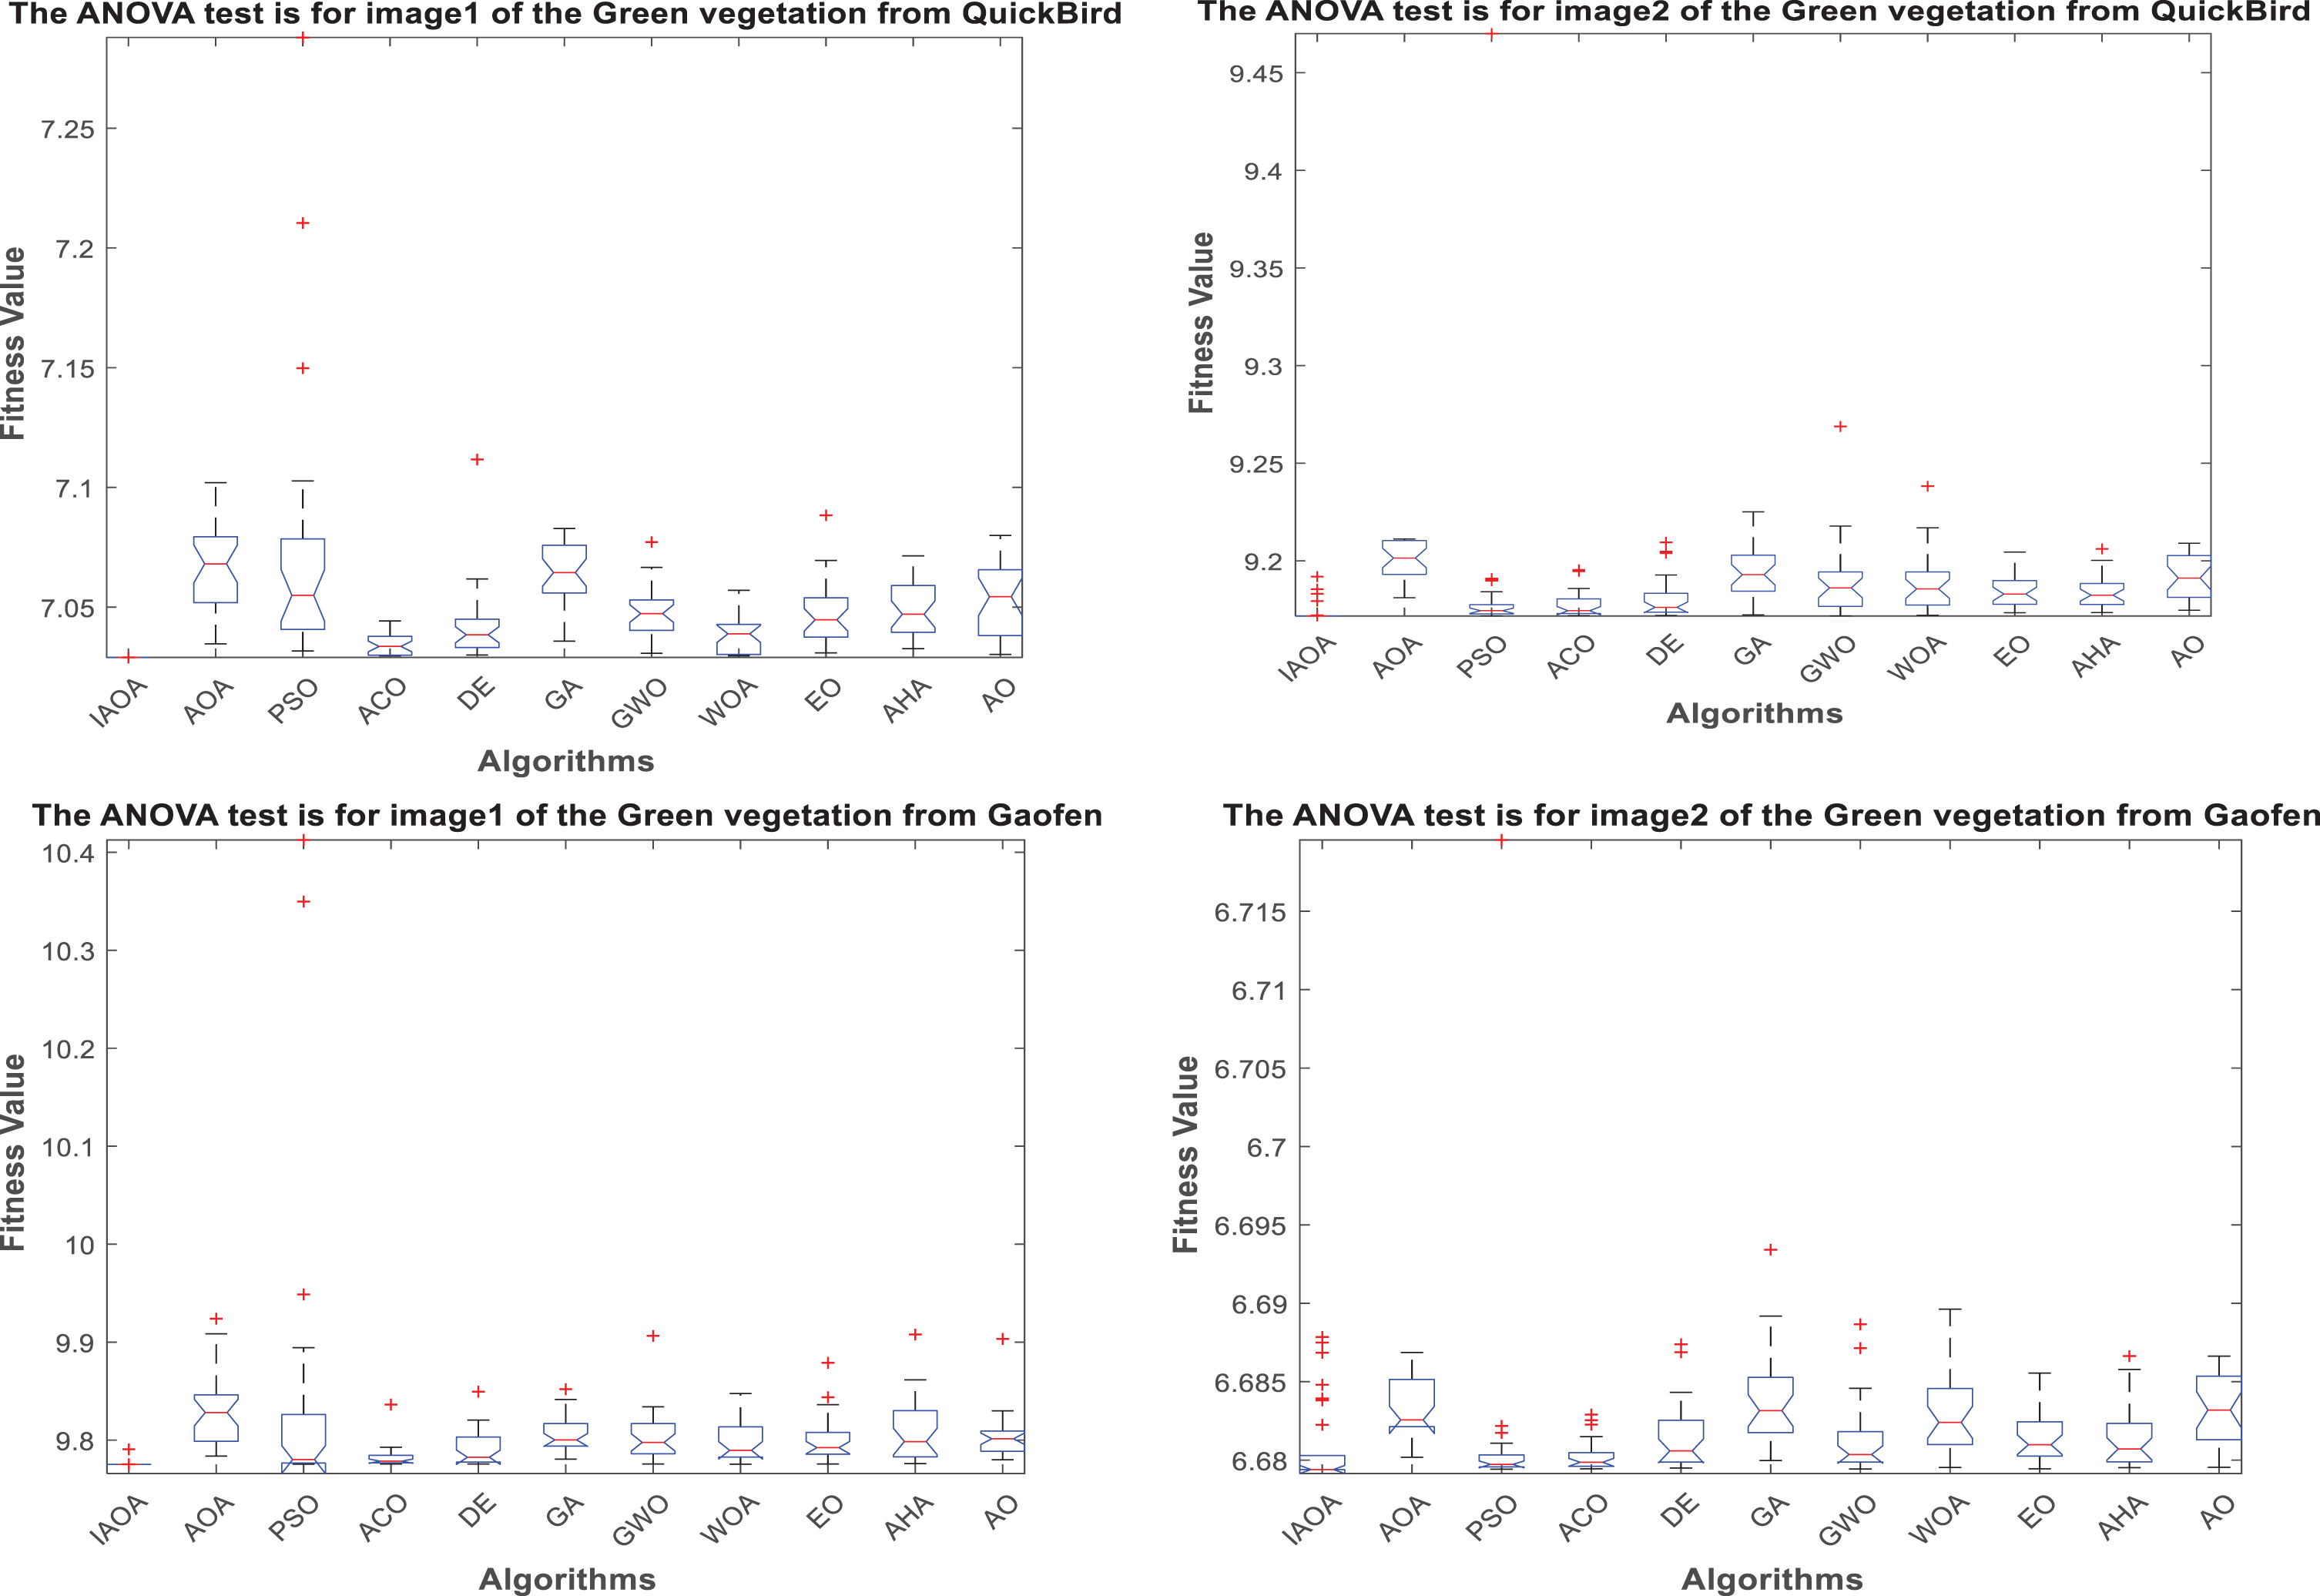
The ANOVA test of different algorithms for green vegetation.
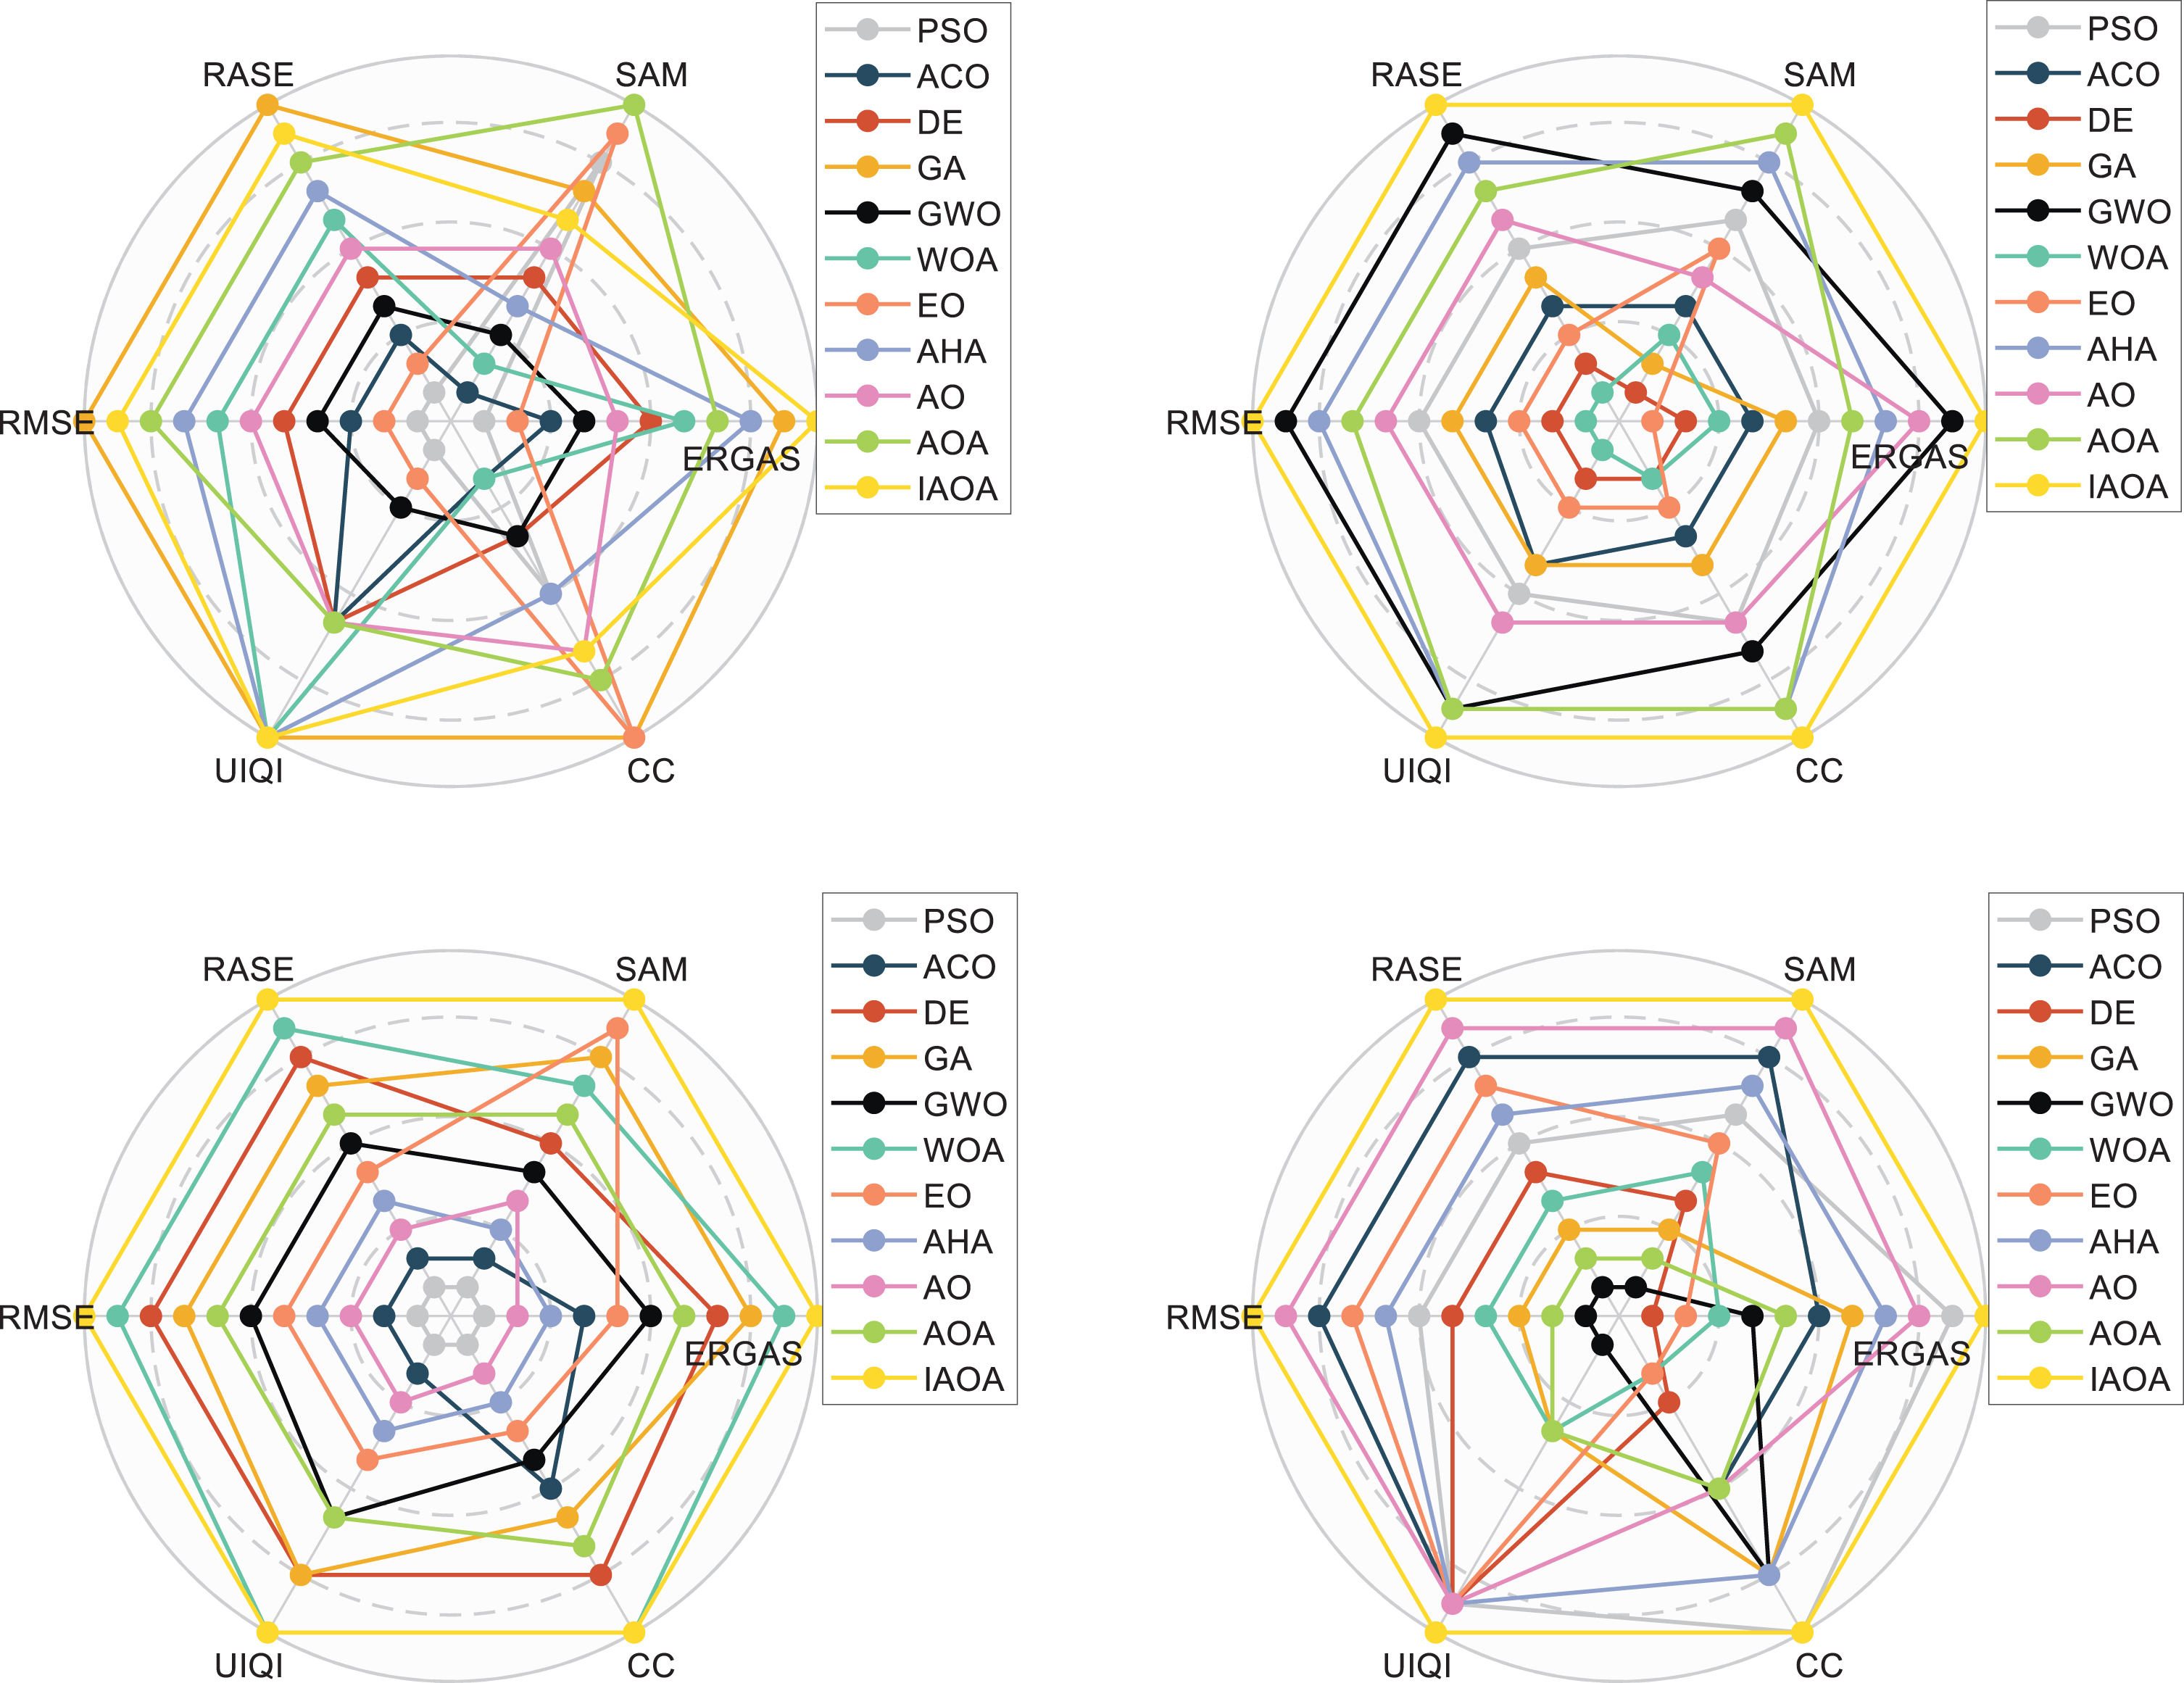
The radar map of different algorithms for green vegetation.

Visual assessment for marked region in green vegetation dataset
The fusion results of 10 different algorithms are compared in the green vegetation scene. The results can be clearly obtained, in the fusion results of the QuickBird image 1, it can be clearly seen that IAOA performs better in ERGAS and UIQI metrics but other metrics are inferior to other algorithms which is important because of the special background of the green vegetation, whereas all the metrics are better than the other algorithms in the other imaging image.
IAOA leads most algorithms in terms of the measure of correlation between the sharpening result and the reference image, the degree of difference between the reconstructed and original images, the absolute value of the spectral angle between the fusion result and the reference vector, and the average performance within the spectral bands, with only the first image data being less capable than GA in the test of the four green vegetation species. The reason for this has a lot to do with the dataset itself as well, but of course more to do with the fact that GA possesses greater reconstruction and distortion handling capabilities for this type of dataset. Because the meta-heuristic algorithm also suffers from a certain amount of randomness, the IAOA is considered to have a better performance capability all things considered.
In image 1 of the GF, only the UIQI and CC metrics are on par with the WOA, while the other metrics outperform all the algorithms. However, the fusion result of IAOA in the other image 2 outperforms the other algorithms. This proves the feasibility of the improved results. All the algorithms are run independently for 30 times, and the convergence speed of IAOA is shown to be better than other algorithms in Fig. 7. The stability of IAOA is also relatively better as can be obtained in Fig. 8.
Experiments in water scenarios
Results of the experiment
In this section, water scenes are used as tests. The water scene includes imaging data from two detectors, GF and QuickBird, respectively. The performance metrics of different algorithms for different fusion results are demonstrated by comparison in Table 6, where black bold indicates the optimal results.
Experimental results of eleven algorithms for water scenarios
Experimental results of eleven algorithms for water scenarios
Figure 11 shows the convergence curves of different algorithms, and Fig. 12 shows the variance of ERGAS metrics of different algorithms in water image fusion for reflecting the stability of the algorithms. Figure 13 clearly shows the radar chart of different algorithms ranked in different metrics, and finally the fusion results of IAOA in water scenario are compared by showing in Fig. 14.

The Convergence curves of different algorithms for water scenario.

The ANOVA test of different algorithms for water scenario.

The radar map of different algorithms for water scenario.
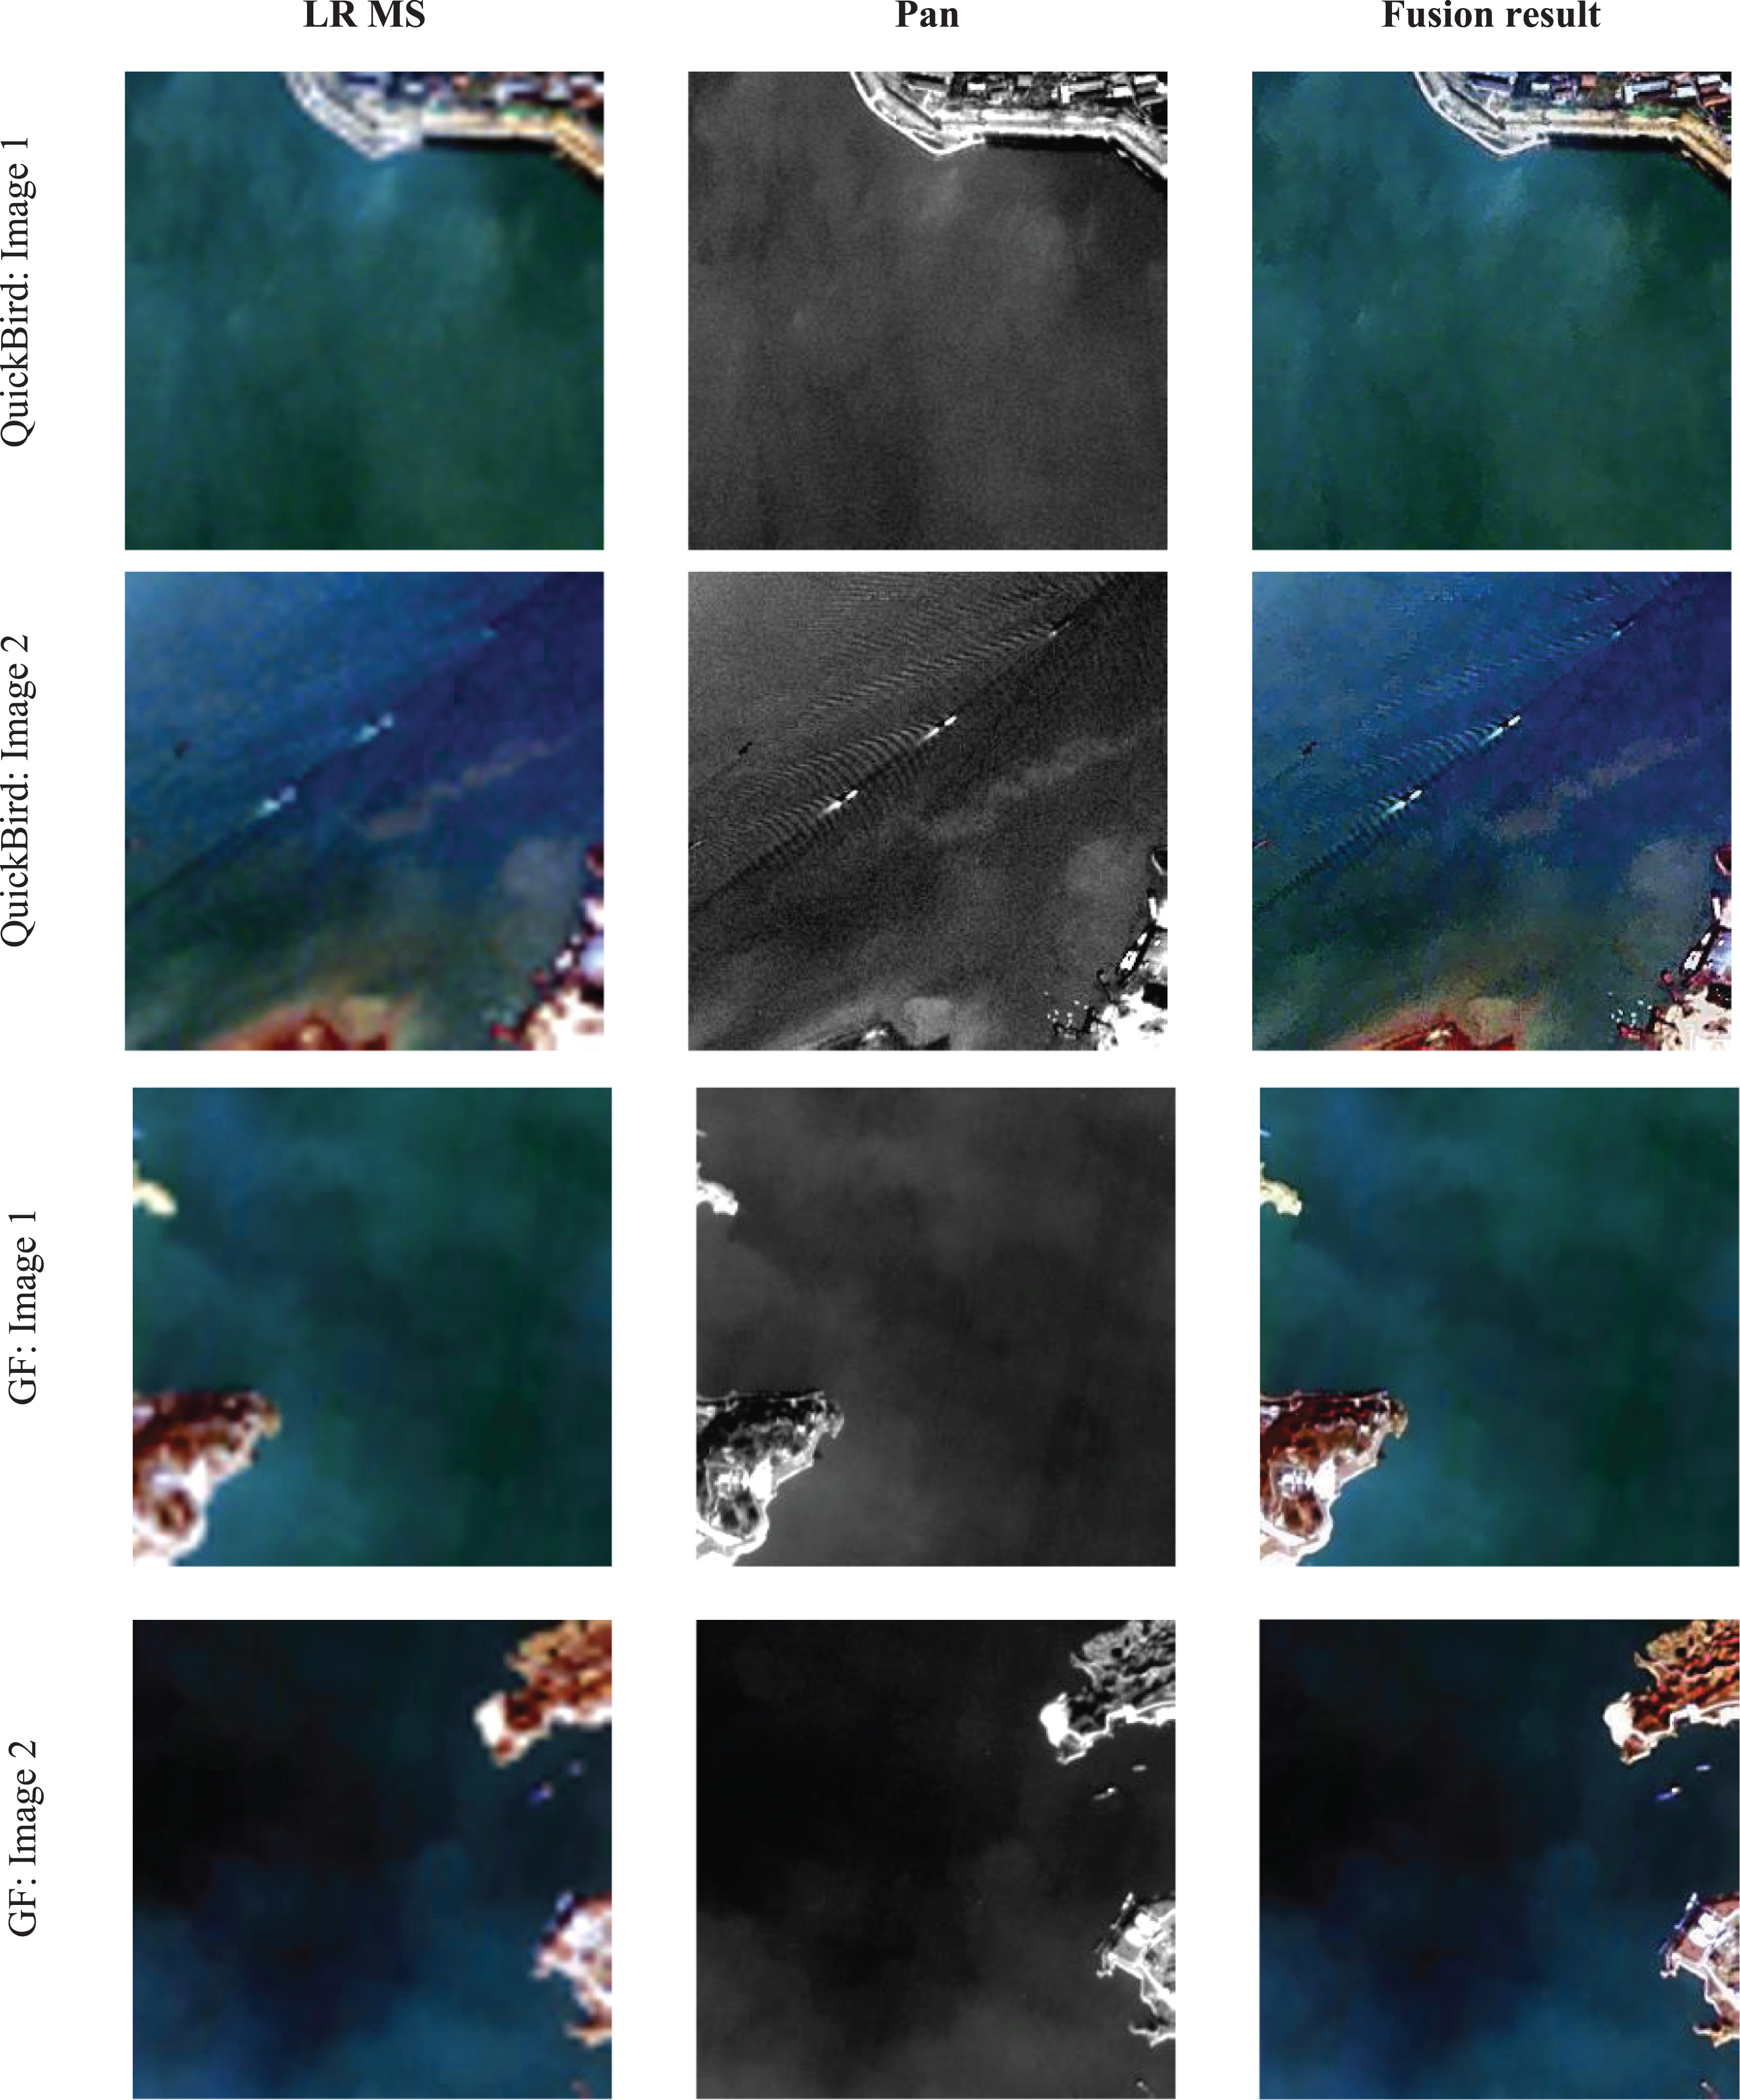
Visual assessment for marked region in water scenario dataset.
The fusion results of 10 different algorithms are compared in the water scene. The results can be clearly obtained, in the fusion results of the QuickBird image 1 it can be clearly seen that IAOA does not perform as well as GA in ERGAS metrics but all other metrics are better than other algorithms, and in the image 2 of the QuickBird the obtained performance reaches the optimum.
After comparing the fusion results of four image datasets from two different satellites, it is clearly seen that the IAOA algorithm is leading in the water scene. Although the best results may not be achieved in a small number of detail metrics, this is related to the stochastic nature of the meta-heuristic algorithm. In water scenes, the comprehensive quality assessment metric ERGAS is usually used to measure the overall quality of the sharpening results. Since the detail parts such as water surface ripples and underwater transmissibility have important impacts on the sharpening results, they may affect the results more. The GA algorithm is able to cope better with the complex water surface ripples and underwater imaging details through its unique genetic characteristics. However, the IAOA algorithm has outperformed the other algorithms in most cases in the comprehensive comparison. In short, the IAOA algorithm is ahead of most other algorithms in terms of comprehensive performance through the fusion comparison of image data in water scenes, although there may be cases where it is not as good as other algorithms in a few detail metrics.
This proves the feasibility of the improved results. All the algorithms are run independently for 30 times, and the convergence speed of IAOA is shown in Fig. 11 to be better than the other algorithms. The OBL operator introduced in the IAOA algorithm improves the search capability through a competitive mechanism. The game between competitors enables the algorithm to better explore the solution space and find a better solution. Such a competitive mechanism effectively avoids the algorithm from falling into the dilemma of local optimal solutions. This is the reason why it can jump out of the local optimal ability. In addition, the introduction of DRST operator allows the algorithm to maintain a balance between local and global search. By introducing randomness, the algorithm is able to jump out of the local optimum and continue the global search, thus avoiding falling into the local optimum. Such a balanced search strategy significantly improves the convergence speed of the algorithm. As shown in Fig. 11, it is able to find the optimal solution faster in most cases compared to other algorithms. The stability of IAOA can be obtained in Fig. 12.
Experiments in coastal scenarios
Experiments in coastal scenarios
In this section, the coastal scene is used as a test. The coastal scene includes imaging data from two detectors, GF and QuickBird, respectively. Eleven different meta-inspired algorithms are put together for adaptive multi-spectral image fusion. And the performance metrics of different algorithms for different fusion results are shown in Table 7, where black bold indicates the optimal results. Figure 15 shows the convergence curves of different algorithms and Fig. 16 shows the metrics variance of different algorithms for ERGAS in coastal image fusion used to reflect the stability of the algorithms. Figure 17 clearly shows the radar chart of different algorithms ranked in different metrics, and finally the fusion results of IAOA in coastal scenes are compared through Fig. 18.
Experimental results of eleven algorithms for coast scenarios
Experimental results of eleven algorithms for coast scenarios

The Convergence curves of different algorithms coast.

The ANOVA test of different algorithms for coast.

The radar map of different algorithms for coast.

Visual assessment for marked region in coast dataset
The fusion results of 10 different algorithms are compared in the coastal scene. The results can be clearly obtained, in the fusion results of QuickBird image 1 it can be clearly seen that IAOA’s performance in UIQI metrics is on par with PSO and ACO, but all other metrics are better than the other algorithms, and the SAM metrics in the other imaging data map are not as good as the AHA but ahead of the other algorithms, and the other metrics are the optimal results. In image 1 of the GF detector, IAOA’s SAM, RASE, and RMSE performance metrics are not as good as other algorithms because of the complexity of the coastal scene. Among them, SAM is commonly used to measure the absolute difference in spectral angle between the fusion result and the reference vector. RASE is commonly used to indicate the average performance within a spectral band. RMSE is a commonly used metric to measure the degree of difference between the reconstructed image and the original image in order to assess the quality of the reconstructed image. All these metrics are effective in demonstrating the dissimilarity and completeness of image fusion. But in another imaging data map IAOA achieves the optimal results in all metrics.
In the coastal scenario, the complex details of the urban and water scenarios are integrated and belong to the integrated application scenario. A comprehensive evaluation of the algorithm will be more in-depth. Although some of the metrics in the GF Image1 dataset have not reached optimal values, this is somewhat related to the dataset itself and the size of the IAOA algorithm for the size of the building complexes in the neighboring sea cities. However, in most cases, the IAOA algorithm has outperformed most other algorithms. This proves the feasibility of the improved results.
All the algorithms are run independently for 30 times, and the convergence speed of IAOA is better than the other algorithms as shown in Fig. 15. It is thus known that the introduction of these improved operators enables the IAOA algorithm to better explore the solution space during the search process and avoid falling into local optima, which accelerates the convergence of the algorithm. The stability of IAOA can be obtained in Fig. 16. In short, the IAOA algorithm is ahead of most other algorithms in terms of overall performance by comparing the fusion of image data from coastal scenes, although it may be inferior to other algorithms in a few detailed metrics.
Running time of the experiment
This section quantitatively compares the runtimes of 11 different algorithms using four datasets with different topics and analyzes the balance between time and fusion effectiveness. Figure 19 illustrates the average running time of different algorithms. The results show that IAOA has a longer runtime than AOA, in all scenarios. However, IAOA outperforms AOA and leads most other algorithms in fusion performance metrics for all topics.

Running time of different algorithms.
Analyzing the improved algorithms by computational complexity, it is found that the running time does not increase exponentially. It is observed that this runtime is acceptable in domains such as remote sensing image processing, and thus the improvement effect can be shown to be effective as long as the runtime permits.
In image fusion problems, the commonly used fixed weights lead to local artifacts and local pseudo-details, while the existing methods perform poorly in terms of image sharpness, contrast and color accuracy. In addition, image fusion techniques are not limited to single modality but can also be used for multimodal data fusion. However, existing methods have limitations in preserving multimodal information and improving target detection performance. In practical applications, image fusion techniques need to be real-time and efficient. Traditional methods may have low processing speed due to the computation based on deterministic solutions. To address these issues, in this study, we use a combination of adaptive weight tuning band coefficients and edge preserving filters to improve spectral fidelity and improve the performance of the detail map fusion results by linearly combining MS images with PAN images. In addition, a meta-heuristic algorithm is used in this study to balance the fusion results with the computation time. With these improvements, image clarity, contrast, and color accuracy can be improved while preserving details and multimodal information, and a faster processing speed can be achieved.
Improvements are made to the original algorithm with respect to its convergence speed as well as search accuracy. By introducing the OBL and DRST operators, the IAOA algorithm does improve the search capability and avoids falling into local optimal solutions, thus speeding up the convergence speed. These improved techniques allow the algorithm to show better performance on several metrics. The OBL operator increases the diversity of the search by introducing competitors. These competitors play games with the current solution and improve the search capability by selecting a better solution as a new candidate solution, which effectively motivates the algorithm to better explore in the solution space. At the same time, we also introduce the DRST operator as a dynamic stochastic search operator, which introduces randomness in the search process and increases the diversity of the algorithm’s search. In this way, even if the algorithm falls into local optimums in some local regions, there is still a chance to jump out of these local optimums through random search and continue to explore better solutions, thus avoiding falling into local optimums and improving the global search capability of the algorithm. The introduction of these improved operators enables the IAOA algorithm to better explore the solution space during the search process and avoid falling into local optimal solutions, thus accelerating the convergence speed and improving the convergence accuracy of the algorithm.
After employing the least squares method to calculate the initial detail image, a refined image is obtained by utilizing a linear combination of gradients from the PAN and MS images. The weights of the gradients are compared using both the IAOA and classical algorithms. Experimental results are obtained by comparing the six metrics and convergence graphs are used to verify the effectiveness of the improvements made.
The IAOA algorithm is able to find the global optimal solution faster than other algorithms by improving the search characteristics and the ability to avoid falling into local optima, improving the performance of the algorithm on most metrics. However, this advantage also comes with additional runtime consumption. The next step of our work will aim to improve the AOA algorithm to achieve a balance between convergence ability and runtime. Meanwhile, we will apply the improved algorithm and image fusion method to real engineering problems to further verify its effectiveness.
The fused images are finally analyzed for comparison. The experimental results are discussed and their advantages and disadvantages are analyzed. The experimental results demonstrate the feasibility and effectiveness of the proposed improved algorithm. In the future, IAOA will be further investigated to overcome the shortcomings and applied to research problems in last mile distribution, thermoelectric scheduling and path planning problems.
Fundings
This work was supported by the National Natural Science Foundation of China under Grant Nos. U21A20464, 62066005.
Conflicts of interest
The authors declare that they have no conflicts of interest.
Author contributions
XM: Investigation, experiment, writing-draft; QL: Writing—review and editing. YZ: Supervision, Algorithm design, writing-review.
Ethical and informed consent for data used
This article does not contain any studies with human participants or animals performed by any of the authors.
Data availability and access
The original contributions presented in the study are included in the article; further inquiries can be directed to the corresponding authors.