
Abstract
BACKGROUND:
The increased depletion of ground water resources poses the risk of higher moisture stress environment for agriculture crops. The rapid increase in the moisture stress situation imposes the need of efficient agricultural research on determining the impact of moisture stress on variety of crops.
OBJECTIVE:
The prime objective of the proposed work is building an IoT based Plant Phenotyping Device for moisture stress experimental study on variety of crops with deep learning model for stress response detection.
METHODS:
In this work, IoT technology is used for building a proposed system for conducting the moisture stress experiments on plants and adopting the image processing and convolution neural network based model for stress prediction.
RESULTS:
The accuracy of the proposed system was experimentally evaluated and empirical results were satisfactory in maintaining the desired level of moisture stress. Performance analysis of LeNet, AlexNet, customized AlexNet and GoogLeNet CNN models were carried out with hyper-parameters variations on the leaf images. GoogLeNet achieved a better validation accuracy of 96% among other models. The trained GoogLeNet model is used for predicting the moisture stress response and predicted results were matched with manual observation of stress response.
SIGNIFICANCE:
The affirmative results of proposed system would increases its adoption for in-house precision agriculture and also for conducting various moisture stress experiments on variety of crops. The confirmative detection of moisture stress tolerance level of plant provides knowledge on minimum level of water requirement for plant growth, which in-turn save the water by avoiding excess watering to plants.
Introduction
Moisture stress has been one of the most common abiotic stresses affecting variety of crops across the world [1, 2]. The rapid increase of dry land and shortage of water poses new challenges for handling the drought stress in a better way to minimize crop loss [3]. Agricultural researchers around the world are conducting drought stress related experiments on variety of crops to get a better insight into drought stress to mitigate the stress induced diseases. The early detection of moisture stress responses on plants using farmer affordable technology has been a need of the hour.
The depletion of water sources push the need of growing crops by providing the adequate level of water and avoiding the over-supply of water to plants. Moisture stress tolerance level characteristic of a plant need to be carefully analyzed to identify the minimum water requirements of a plant and accordingly supply adequate water. The significance of the need of analyzing the moisture stress tolerance of plant is illustrated by considering the following scenario of assuming Plant A is having a higher moisture stress tolerance level compared to another plant B. Due to the higher moisture stress tolerance level of Plant A, a lesser water would be enough for Plant A compared to Plant B. Even-though variation in water supplies to plants, if the both the plants provides similar level of yield, then the problem statement arises on effective identification of moisture stress tolerance level plant and providing minimum required water and consequently save the water. The cost effective & precised water supply system to grow plant by providing adequate water has been a challenging task.
The moisture stress tolerance plant gene identification has been a requirement of the farmers of drought affected areas. The usage of non-stress tolerance plant gene would cause huge loss to farmers of drought affected areas. The lack of low cost device for précised mode of moisture stress experimental study poses the further risk of wrong determination of plant genes for stress tolerance.
IoT (Internet of Things), is a next level of WSN (Wireless Sensor Network) technology, which is comprised of an internet connected micro-controller attached with sensors, which in turn pushes the sensed data to the central data repository. In recent days, the ease of use and popularity of IoT and WSN technologies have increased its scope in precision agriculture [4–7]. Efficient technology based plant phenotype devices has been a need of agricultural scientists across the world to carryout various abiotic stress experiments on plants to assess the stress responses [8, 9].
Even though there are considerable technological advancements, the lack of problem specific automation for a précised way for conducting drought stress experiments leads to erroneous results. The advancement of the Internet of Things and Wireless Sensor Network technologies have opened up a space for innovative solutions for conducting scientific experiments with high precision [10]. The scientific study of moisture stress on plants needs a precised way of maintaining the moisture stress at a desired level, which is a laborious work in manual mode [11]. In contrast to this, latest technologies like IoT/WSN technology can be employed for maintaining the desired level of moisture stress and also automated way of collecting the stress responses in real time [12].
DCNN (Deep learning based Convolution Neural Network) has been a promising technology for remote monitoring of plant growth and a non-destructive way of assessing plant disease or stress responses [13–16]. In order to carry out the moisture stress experiment, different plants need to be kept at different levels of moisture stress such as highly stressed, moderate stressed and unstressed.
Hence, the precised way of conducing scientific experiments on moisture stress on plants needs a versatile device for automated pumping of water to maintain the desired level of moisture stress and real - time measurement of moisture stress, plant growth parameters and stress responses. In addition to maintaining the desired level of moisture stress, the sensor data needs to be analyzed for extracting deeper insights on stress behavior and building a possible data analytics based prediction model for stress response [17].
Even though IoT systems are in discussion for its adoption to agriculture purposes, one of the major issues in realization IoT for field deployment depends on providing non-interrupted regulated power supply. The fluctuating power supply would cause an erroneous sensor reading and poses the risk of reducing the accuracy of the system [18, 19]. Another major requirement is the need for an efficient IoT platform for plotting the real time graph of continuous data and central data repositories for data analytics.
Convolution neural network based deep learning models emerged as one of the non-destructive way of determining leaf diseases [20, 21]. Plant stress prediction has been a challenging issues and many researches were carried out using Deep learning approaches for predicting the plant stress in non destructive way [22]. Many comparative analysis based work is carried out on applying various Deep learning based CNN models for predicting the biotic stress on paddy crop [23]. The recent research study of preparing the dataset to apply deep learning models to predict the water stress on maize crops highlighted the use of DCNN for abiotic stress response prediction & provided a scope for possible improvisation [24].
This work discusses the design and development of an IoT based plant phenotyping device for conducting moisture stress experiments in a precised way with predictive analytics support. The proposed system adopts the Deep learning based Convolution Neural Network model for stress response assessment along with IoT platform for remote data access support.
The structure of the paper is as follows, the Section 2 deals with providing literature survey of existing work related to the proposed system. The Section 3 provides the overall architectural diagram & details of the proposed system. The Section 4 provides the detailed description about experimental setup carried out to conduct the experiment in précised way. The Section 5 discusses the results & discussion of the experimental work carried out in this work.
Related work
The following Table 1 depicts the related work carried out on building IoT based plant Phenotyping system with description about the various approaches used and experimental study carried out.
Related work on IoT based plant phenotyping system
Related work on IoT based plant phenotyping system
In-line to the above related works the primary survey clarifies that most of the work carried out either on building a IoT enabled plant phenotyping system excluding Deep Learning CNN based stress detection or vice versa. Also limited emphasis is given on providing the cost efficient end product for experimental study on moisture stress. Hence the design and development of low cost IoT based Deep Learning CNN enabled plant phenotyping setup for drought stress experimental study has been considered as the primary research focus in this work.
Figure 1 shows the architectural block diagram of the proposed system of WSN based IoT device for plant phenotyping for moisture stress experiment with IoT Platform and DCNN model for stress response assessment.
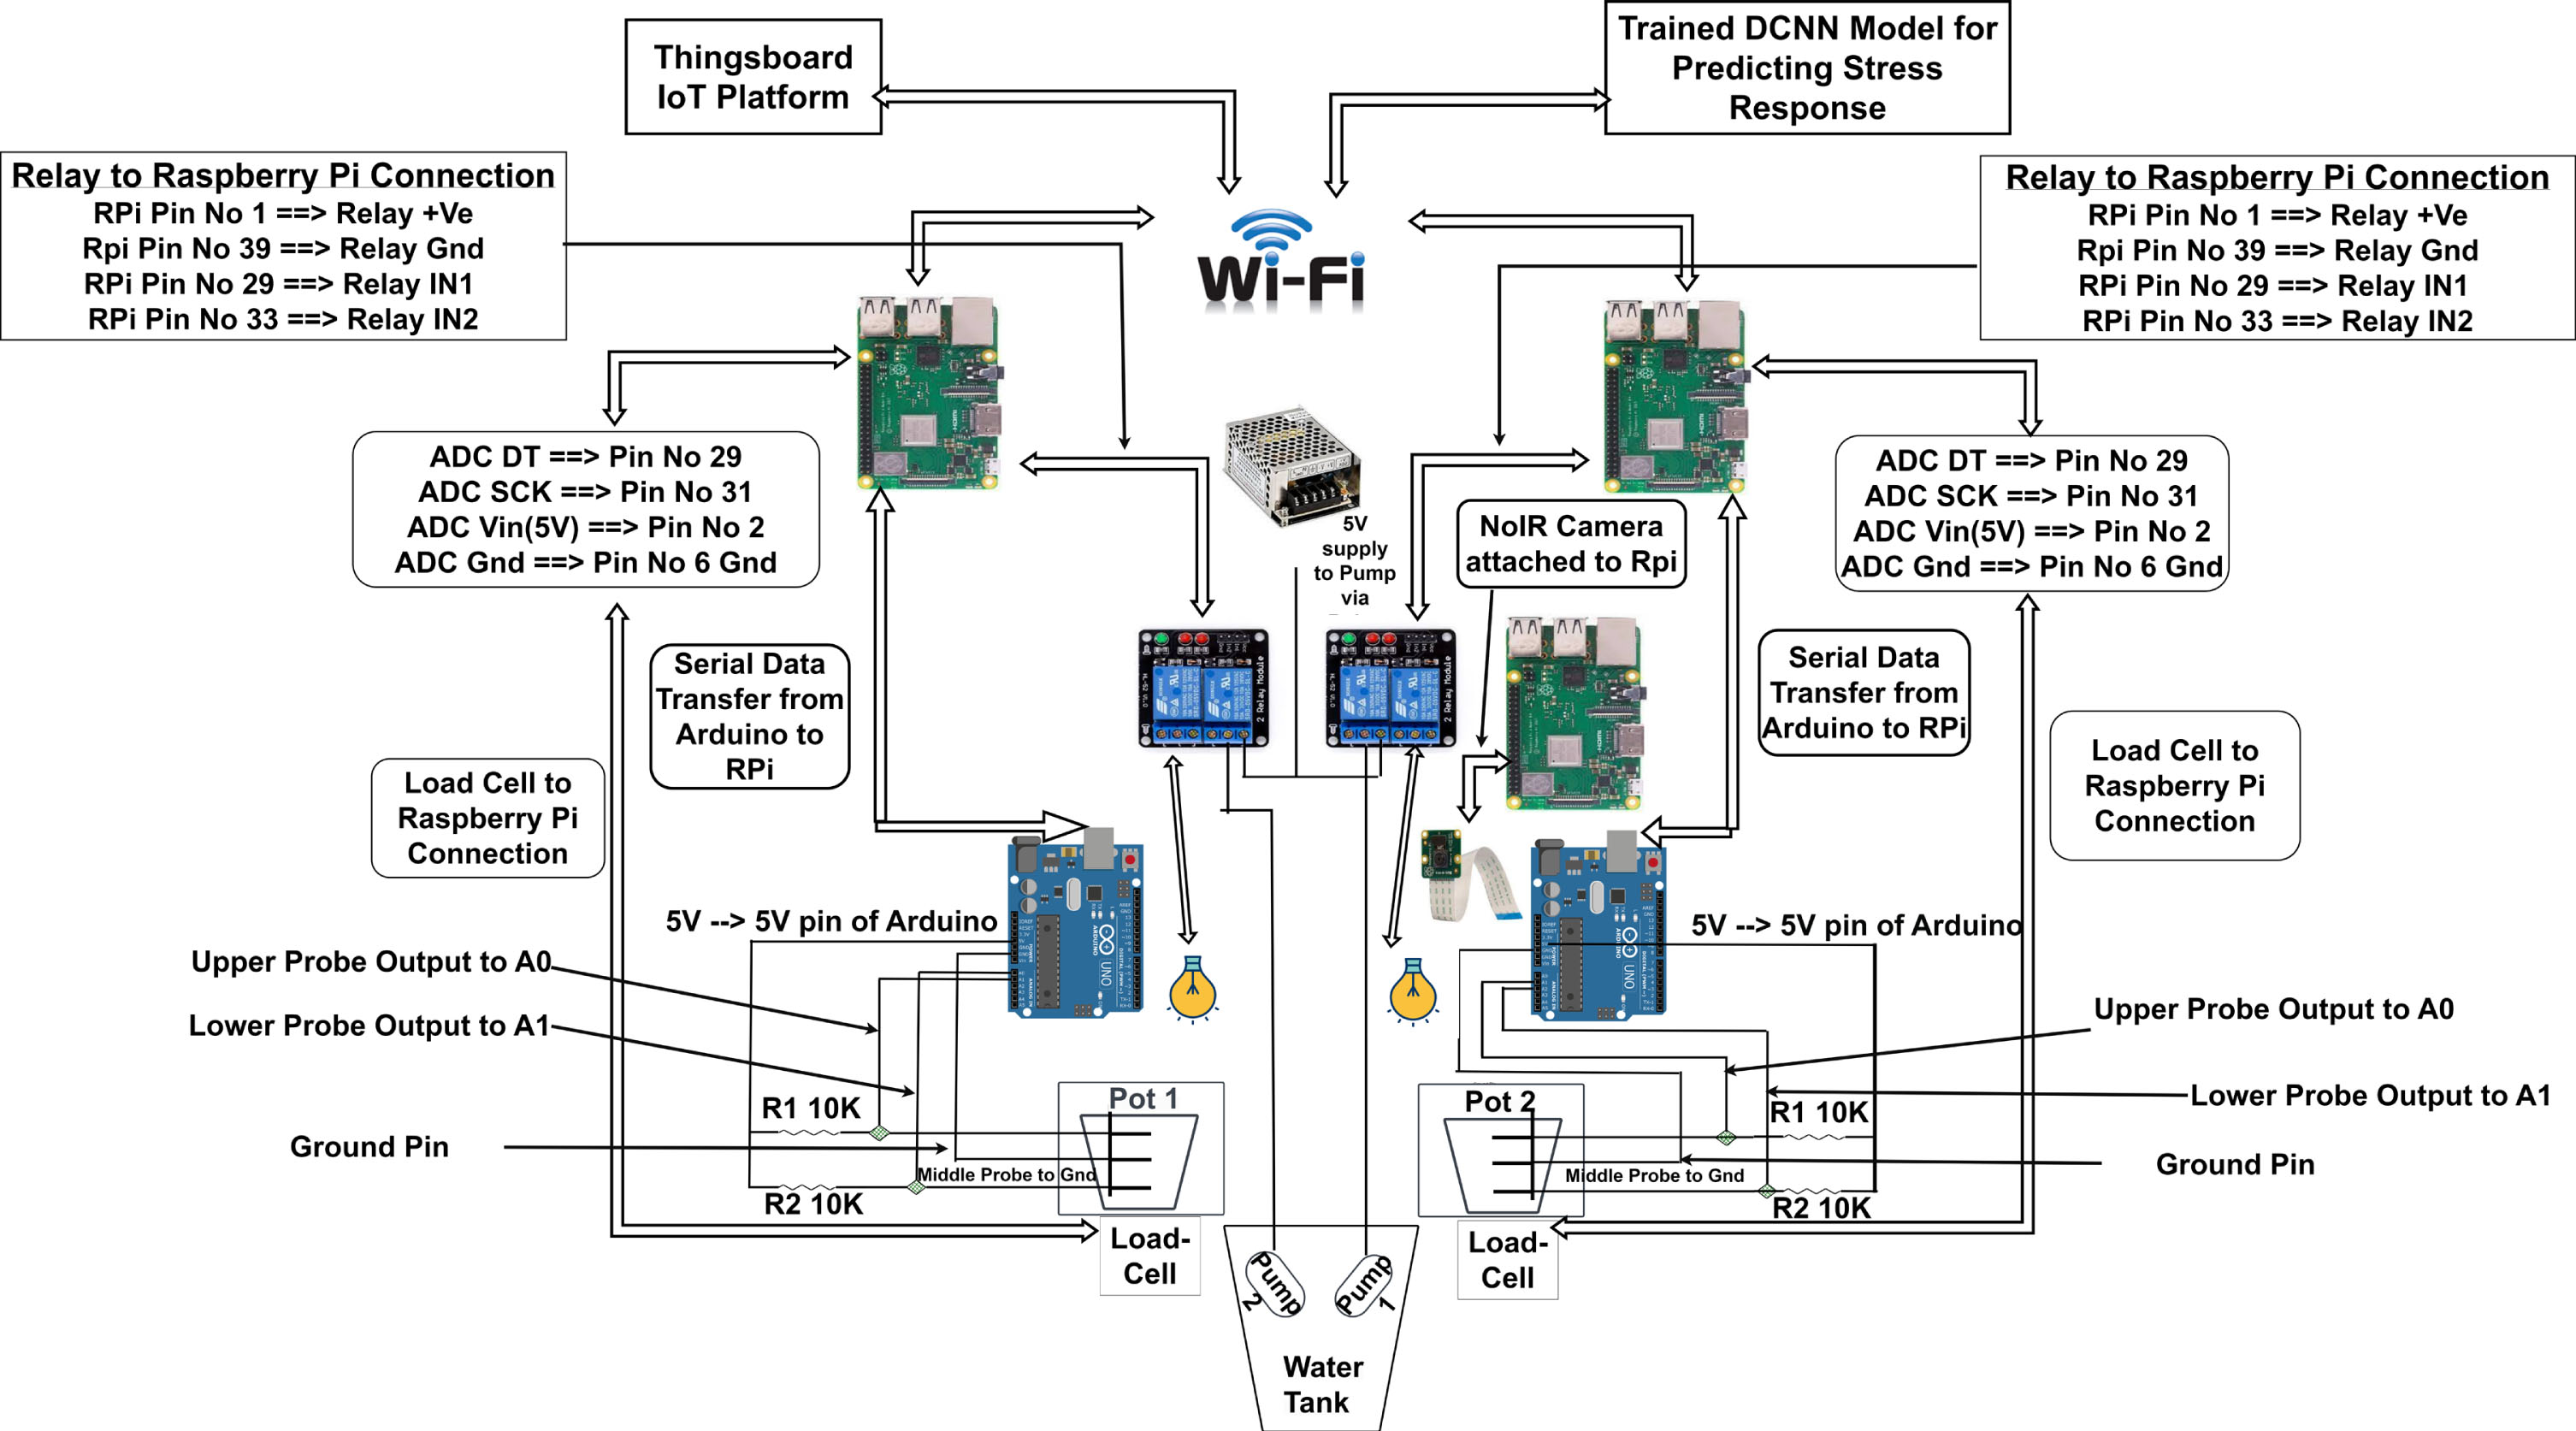
Architectural block diagram of proposed system.
The proposed system uses three methods for measuring the moisture content of the soil, gravimetric approach using weight sensor, commercially available capacitance soil moisture sensor, Low cost in-house built multi-probe resistive based soil moisture sensor. The results obtained in three methods are compared. The low cost multi-probe sensor has outperformed commercially available capacitance sensor. The result obtained by multi probe sensor is in line with the gravimetric approach. For real time application gravimetric approach cant applied to a field, where as low cost multi-probe can be used. In the proposed system, the Raspberry pi microcontroller is programmed for reading the load-cell value for measuring the weight of pot using python language. Due to the non-availability of an analog pin in raspberry pi, the arduino microcontroller is used to connect to the soil moisture sensor as shown in Fig. 1. The arduino microcontroller is programmed using embedded c programming to measure the soil moisture readings. The readings of the arduino were pushed to raspberry pi using serial port due to the non-availability of WiFi module in arduino. Each raspberry pi is programmed to receive the soil moisture sensor reading via serial input from arduino and load cell value via hx711 ADC. Also, each raspberry pi is programmed to push the received data to the ThingsBoard platform for obtaining real time data visualization and a copy to a MYSQL database server for further data analysis. Before pushing data to server, each raspberry pi programmatically verify the current level of moisture content based on the weight value and actuates the water pump accordingly to maintain the desired level of moisture stress.
The Raspberry pi NOIR V2 RGB camera module is used to capture real-time images of a plant and its leaves. The python application is deployed in Raspberry Pi attached with a camera for the remote access to capture real-time images. The captured images were given as input to the DCNN based trained model running on NVIDIA DIGITS Web Application Framework for stress response assessment.
The proper functioning of the proposed system is tested by conducting the moisture stress experiment on plant and capturing the data accordingly for verification. The hot air oven approach is used to dry the soil and gravimetric approach is used to measure the soil water holding capacity of soil. The procedures used in this experimental study are as follows The Hot air oven is used to dry the soil at 95 degree temperature for a duration of 48 Hours The weight of the dry soil is Obtained, represented as D_Weight (Dry_Soil_Weight) The empty pot weight, represented as EP_Weight (Empty_Pot_Weight) Measuring the Pot Plate weight, represented as Pl_Weight(Plate_Weight) The dry soil is poured to empty Pot and measuring the weight of the dry soil withpot, represented as DSP_Weight
Water is added to the pot until the soil becomes complete wet, correspondingly the amount of water added is noted down represented as Water_added. The excess water from the pot is drained out depending upon its water holding capacity, the amount of water obtained in drain, represented as Water_drain
Now Water holding capacity, Once the soil reaches the maximum water holding capacity, measuring the wet soil weight at 100% moisture level is represented as, WSP_Weight_100 %
Pot weight at 50% of Soil Moisture level is represented as Pot weight at 70% of Soil Moisture level is represented as
Upon computing the WHC_Weight _ 50 % & WHC_Weight_Weight _ 70 %, the pots are kept on the proposed device and sensors are attached accordingly. The respective raspberry Pi microcontroller of the proposed device programmatically verifies the weight to the desired level of weight for maintaining the desired level of soil moisture content level. If the current weight is less than the WHC _ weight _ 50 % in the first device, then the automatic pumping of water would be done to bring back the weight to maintain the 50% of soil moisture level. Similarly, if the current weight is less than the WHC _ weight _ 70 % in the second device, then the automatic pumping of water would be carried out to bring back the weight to maintain the 70% of soil moisture level.
The proposed device is comprised of two Raspberry Pi and two arduino micro-controllers, which are programmed to measure the real time weight, soil moisture level and actuate the pump for watering to maintain the desired level of moisture stress. The Embedded C program is written for arduino programming to read the upper & lower probe voltage analog reading and to push the same to raspberry pi via serial connection. The Python program is written for raspberry pi to measure the Load Cell weight value, and to measure the reading via arduino serial connection for upper & lower probe voltage of soil moisture. The measured weight value, Upper & lower probe voltage readings are pushed to the Thingsboard IoT Platform and the copy is stored in Mysql Database running on local server. Raspberry Pi device is also programmed to Turn-On grow lights at 9.00 AM and Turn-Off at 10.00 PM every day and also a python based web application is developed for turning On/Off the pump in manual mode. The plant images were captured using a camera connected to Raspberry pi and preprocessed using a graph cut segmentation process for extracting the individual leaf images. The segmented leaf images were fed into a CNN based trained model to detect the Moisture Stress response on plants.
Two experimental studies were carried out; the first one with the leafy vegetables and the second experiment is carried out on a tomato plant to evaluate the accuracy of the proposed device to maintain the desired level of stress and predict the stress response.
Dataset
The GoogLeNet CNN (Convolution Neural Network) based Deep Learning model is trained with leafy vegetables and tomato leaf images to predict stress response and disease detection. In this study, the appearance of disease symptoms on plant leaves is considered as an early indication of stress response.
The author [15] generated a image dataset of stressed and healthy soybean leaflets comprised of 65,760 images in their work of applying DCNN model for predicting the plant stress. In this work, author Sambudda Ghosal et al. generated dataset is downloaded from https://github.com/SCSLabISU/xPLNet and used for first experimental study of predicting the stress response on leafy vegetable crop. The dataset consists of 9 categories as shown in Fig. 2(a).

(a): Leafy vegetables Leaf Images with different catego-ries of diseases (b): Tomato plant leaf images with different categories of diseases leaf images.
The leafy vegetables and tomato plants were grown in the proposed device under 50% and 70% stress and raspberry pi connected camera is used to capture the real - time images. The captured images were fed into trained CNN Model for detecting the moisture stress response.
The plantvillage tomato leaf dataset is used for building the DCNN model for predicting the stress response as occurrence of diseases. The dataset comprised of 10000 images, categorized into 9 categories as shown in Fig. 2(b). The dataset is downloaded from below kaggle website link https://www.kaggle.com/datasets/charuchaudhry/pla ntvillage-tomato-leaf-dataset. The captured plant images were processed using a Graph Cut segmentation algorithm using Matlab tool to segment the individual leaf image out of the entire plant image. The extracted leaf image is fed into the trained CNN Model for detecting the Moisture Stress Response on plants.
Figure 3(a) shows the in-house built proposed system in accordance with the architectural diagram given in Fig. 1. The proposed system comprises of 2 IoT devices for plant phenotyping for maintaining the moisture stress level of 50% and 70% respectively. Figure 3(b) shows the experimental set-up under grow light conditions.

Proposed system setup.
The proposed system uses an IoT enabled in-house fabricated weighing scale for adopting a gravimetric approach for precisely maintaining the desired level of moisture stress as shown in Fig. 4(a). The in-house fabricated weighing scale is comprised of 20KG Load-cell with ADC HX711 attached to raspberry pi. Figure 4(c) shows the low-cost in-house built resistive based multi-probe soil moisture sensor for detecting the soil moisture at multiple depths of a soil [33].
The multi-probe soil moisture sensor is used for experimental evaluation is cost effective and can be deployable in field for conducting moisture stress experiments. Accordingly, Fig. 4(b) shows the use of a multi-probe sensor along with a capacitance sensor and gravimetric approach for comparative analysis. In accordance to the set-up shown in Fig. 4(b), the experimental study was carried out to detect the non-precise reading of moisture level in a commercially available capacitance soil moisture sensor.

(a) - In-house built Weighing scale of 20KG load-cell with hx711 ADC controlled by Raspberry Pi, (b)Installation of multi-probe sensor & commercial capacitance soil moisture sensor along with gravimetric approach for comparative study, (c) low cost in-house built resistive based soil moisture sensor for detecting moisture at different depth of soil.
Inline to this experimental study, the water is poured into pot from the top and an increase in weight value and soil moisture value were noticed. Correspondingly, as shown in Fig. 5(a), the weight of soil with pot reaches 1722 grams upon reaching the 100% water holding capacity, which is a 100% moisture state based on gravimetric approach. In contrast to the above, upon reaching the weight of around 1425 grams, capacitance soil moisture sensor reading shows the 100% moisture due to water accumulation around the sensor probe even though water is not there in the lower bottom surface of the soil.
Figure 5(b) shows the results of in-house built resistive based soil moisture sensor for detecting moisture at different depths of a soil. The upper and lower probe voltage values are the indicators of the presence of moisture in the soil in the probe level. As shown in Fig. 5(b), the sensor is able to detect the moisture level only at the upper surface of thesoil upon pouring 100 ml of water. Results also verify the moisture level at the bottom surface of the soil upon pouring another 200 ml of water and confirming the status of water reaching the bottom surface of the soil.
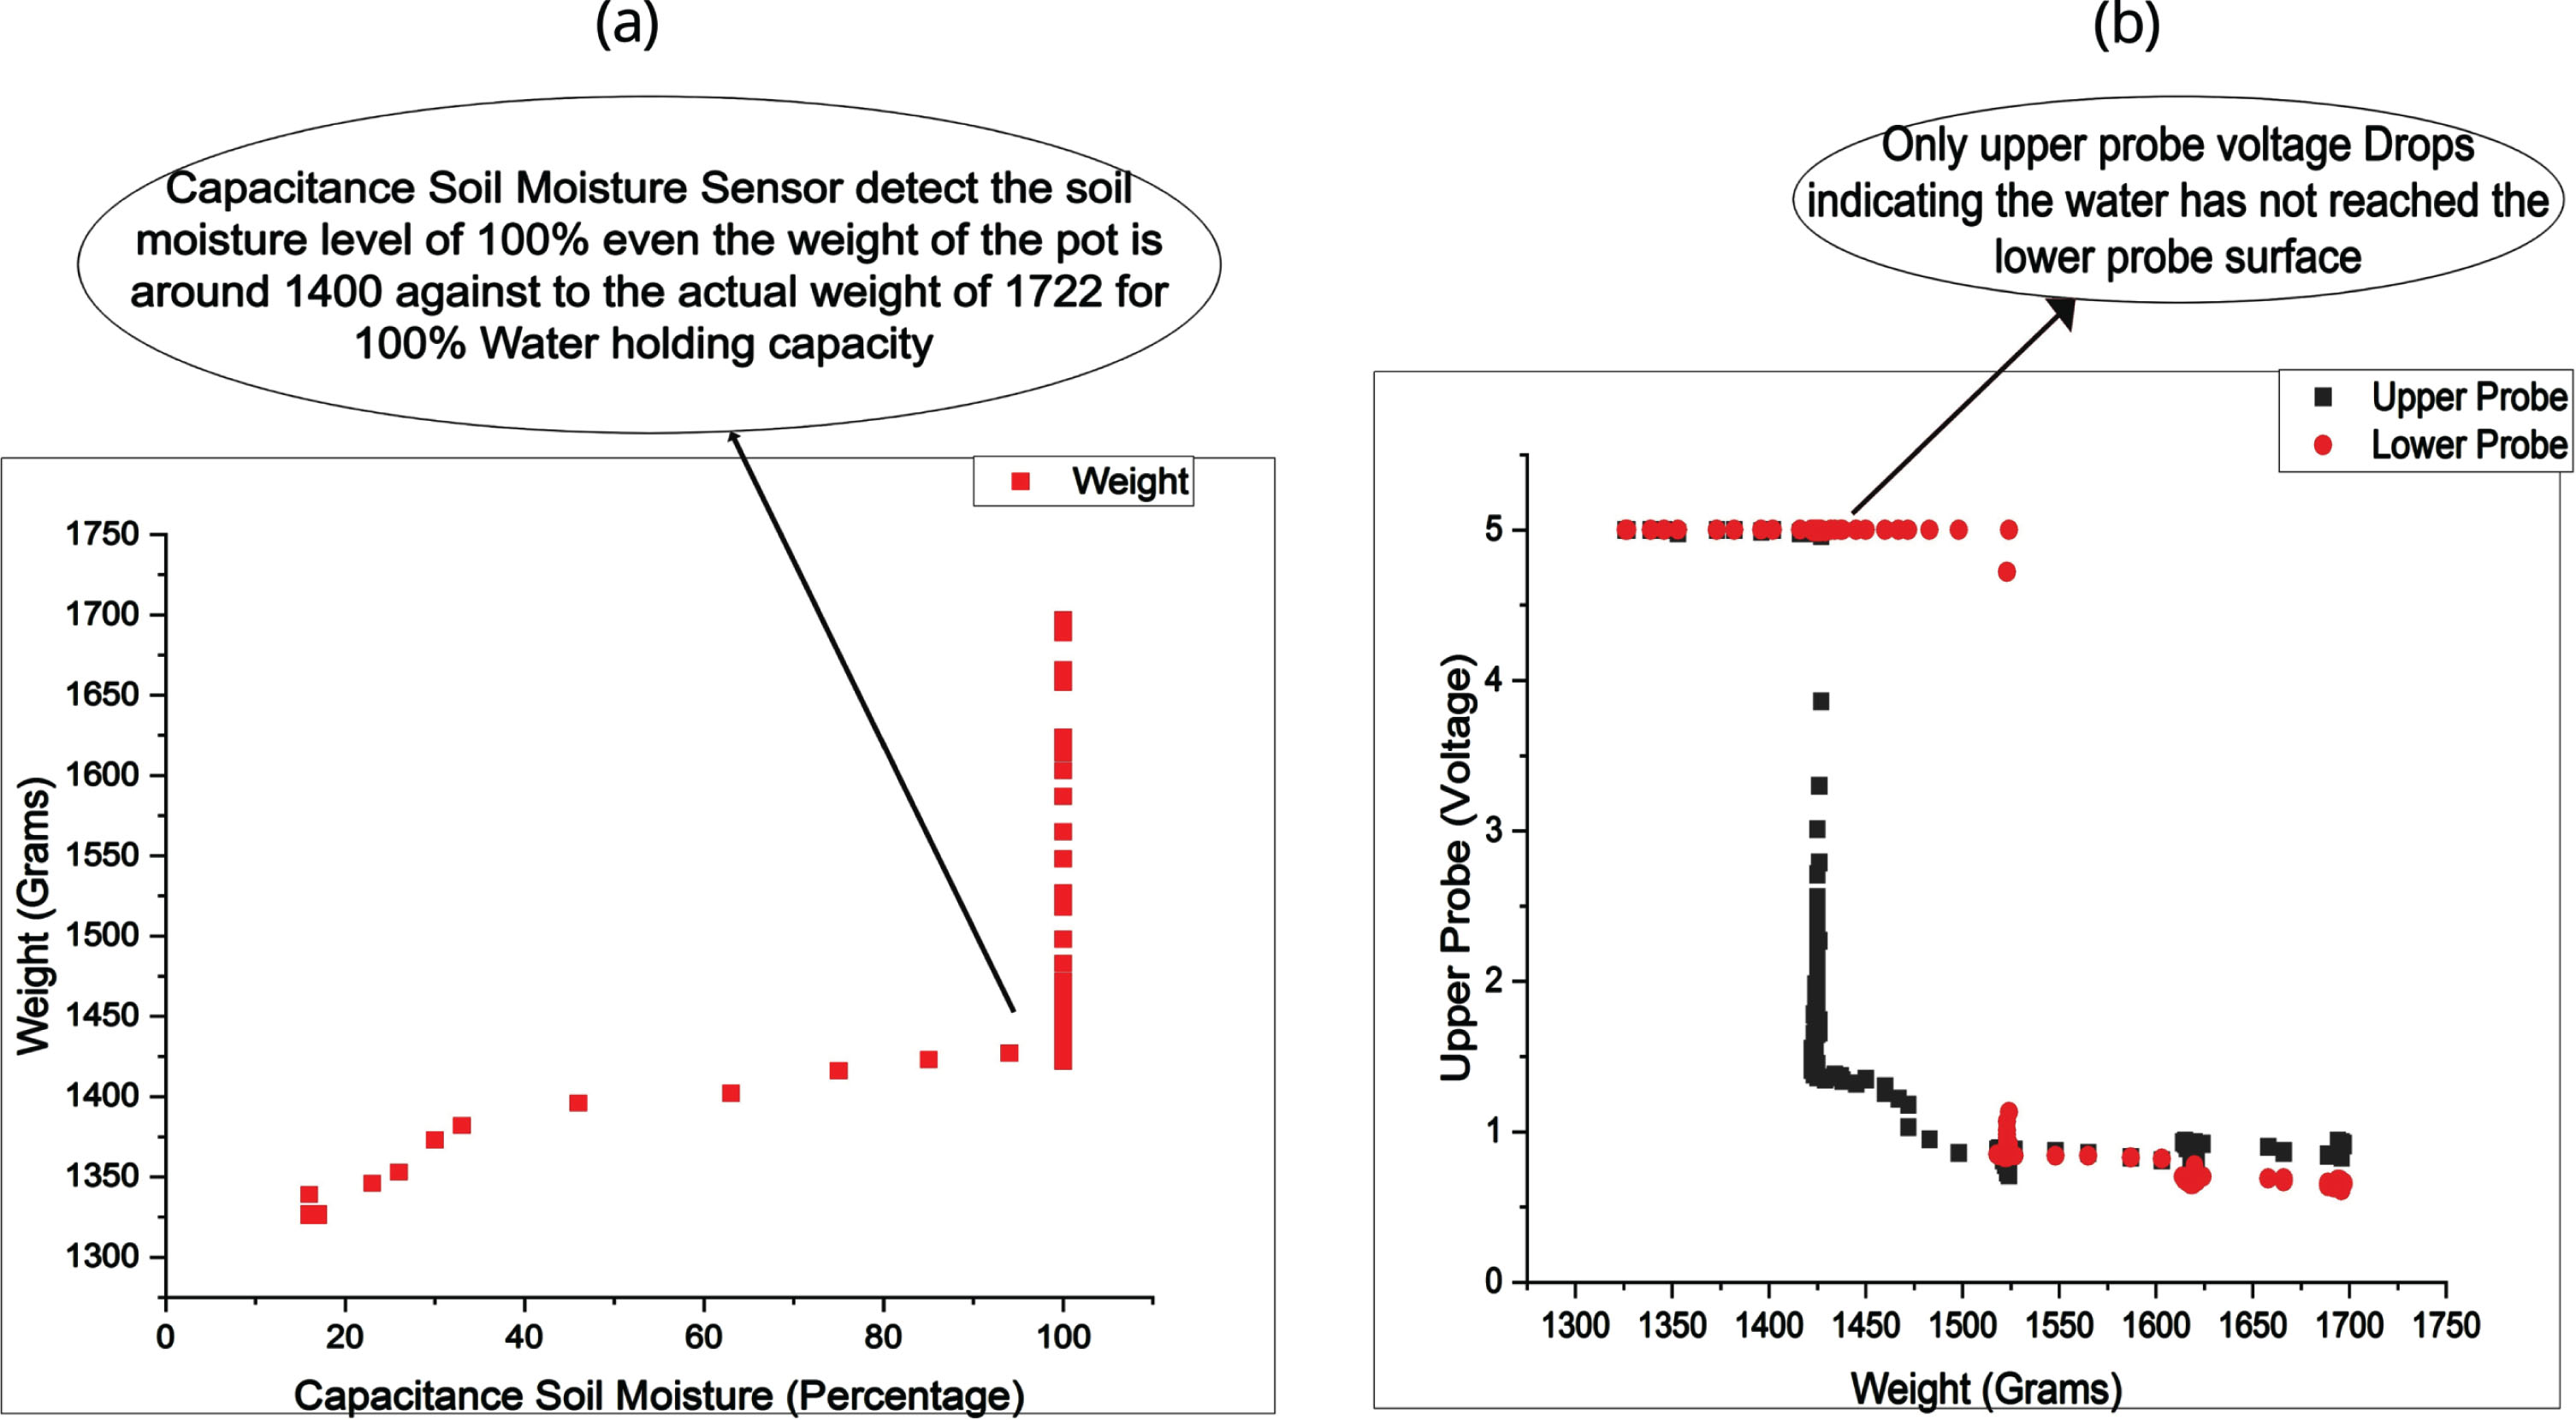
(a) Non-precise readings of Capacitance Soil Moisture Sensor determination of wrong measurement of 100% moisture level; (b) Upper & lower probe voltage of multi-probe sensor readings with respect to pot weight readings.
Figure 6(a) shows the real time weight (in Grams) of soil with Pot 1 placed on the proposed IoT Device, which shows real-time moisture stress level with respect to gravimetric approach. In accordance to the Equation (4), the computed weight to maintain the 50% moisture stress level for soil with Pot 1 was around 1170 Grams. The result in Fig. 6(a) shows the increase in weight due to automated pumping of water upon decrease in weight value below the threshold value of 1170 grams. The experimental results confirm the accuracy of the device in maintaining the desired weight level of around 1170 grams for 50% moisture stress with obtained mean weight of 1177 grams. Correspondingly, Fig. 6(b) shows the status of the Pump goes automatically to the On Status in accordance to the drop of 50% Moisture stress and Pump goes automatically to the Off status upon reaching the threshold weight of 1170 grams. Similarly Fig. 7(a) shows real-time weight (Grams) of soil with Pot 2 kept on the proposed IoT Device and Fig. 7(b) shows the pump On/Off status to maintain the weight of 1028 Grams for a desired moisture stress level of 70%. Thingsboard open-source IoT platform is used for getting the real time graph of the moisture level, pump status. The mysql database is used for data storage for futurist data analytics. This experimental setup is used to measure the moisture consumption by plants for its growth. The results in Fig. 6(b) and Fig.7(b) provides the data about the total amount of water consumed by the respective plant, which could be further analyzed to determine the optimal water requirements for the plants. The determination of optimal water requirement would provide a scope of intelligence for avoiding the supply of excess amount of water, which in turn saves the water without compromising the crop yield.
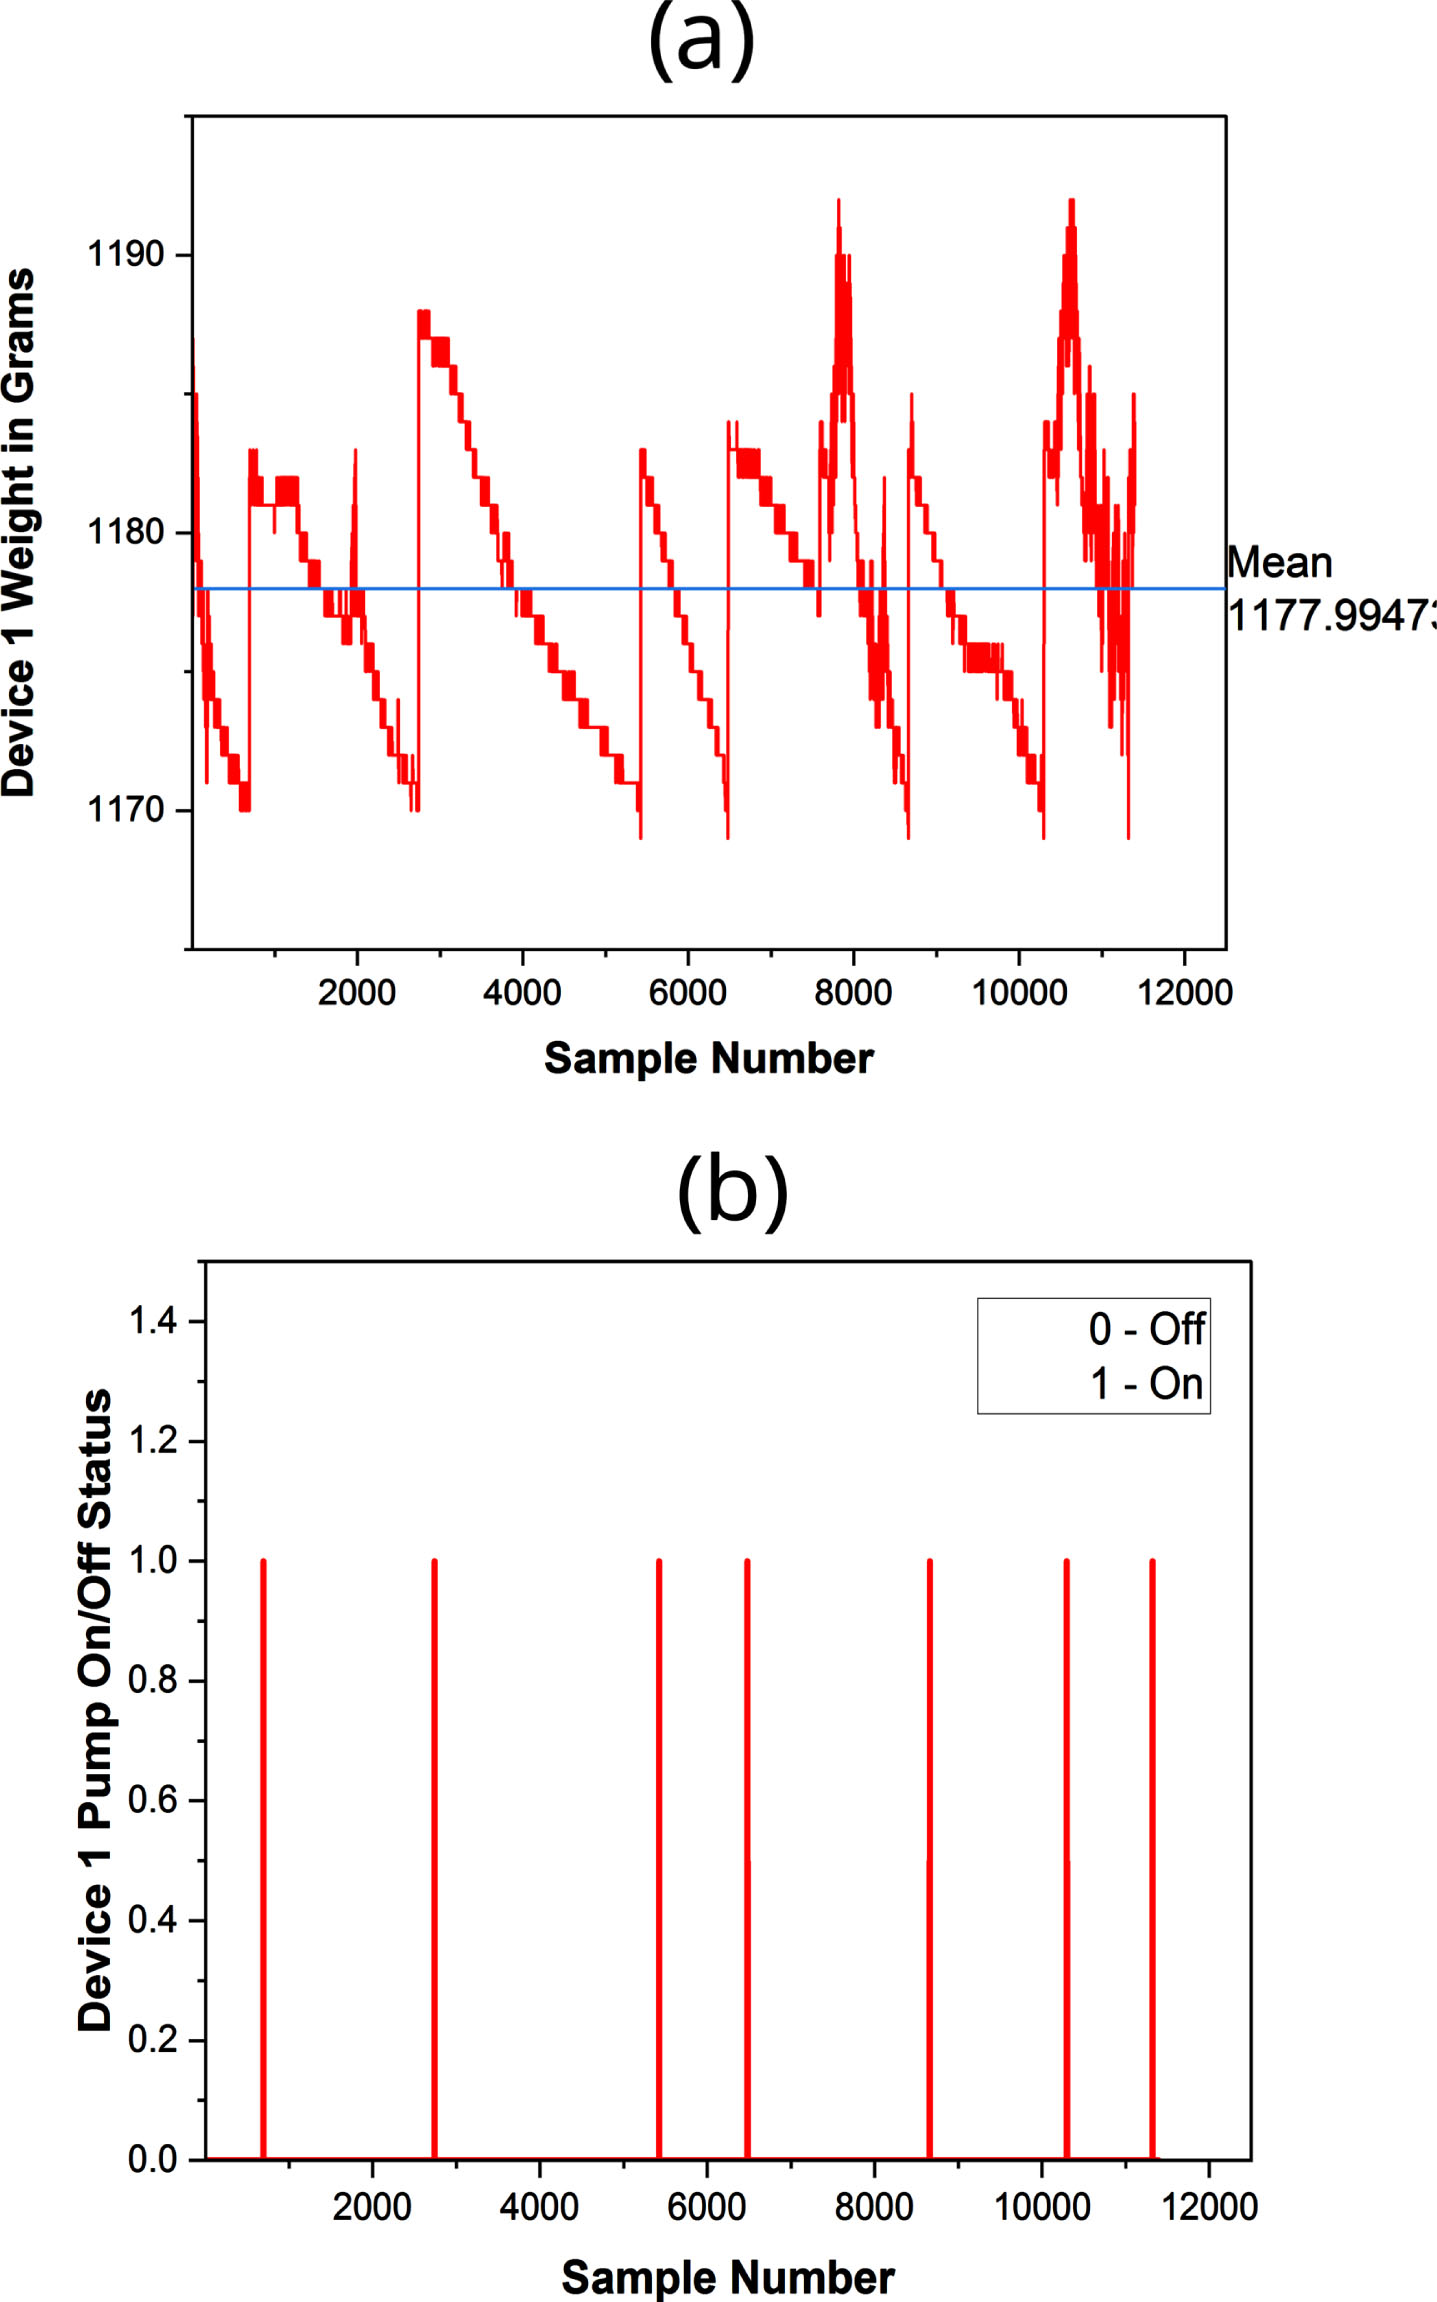
(a). Device 1 Weight in grams indicating the Moisture content level with respect to gravimetric approach and mean weight of ∼1177 confirms the maintenance of 50% Water holding capacity weight of 1170 Grams; (b) Device 1 Pump ON/OFF Status to maintain 70% stressed plant.
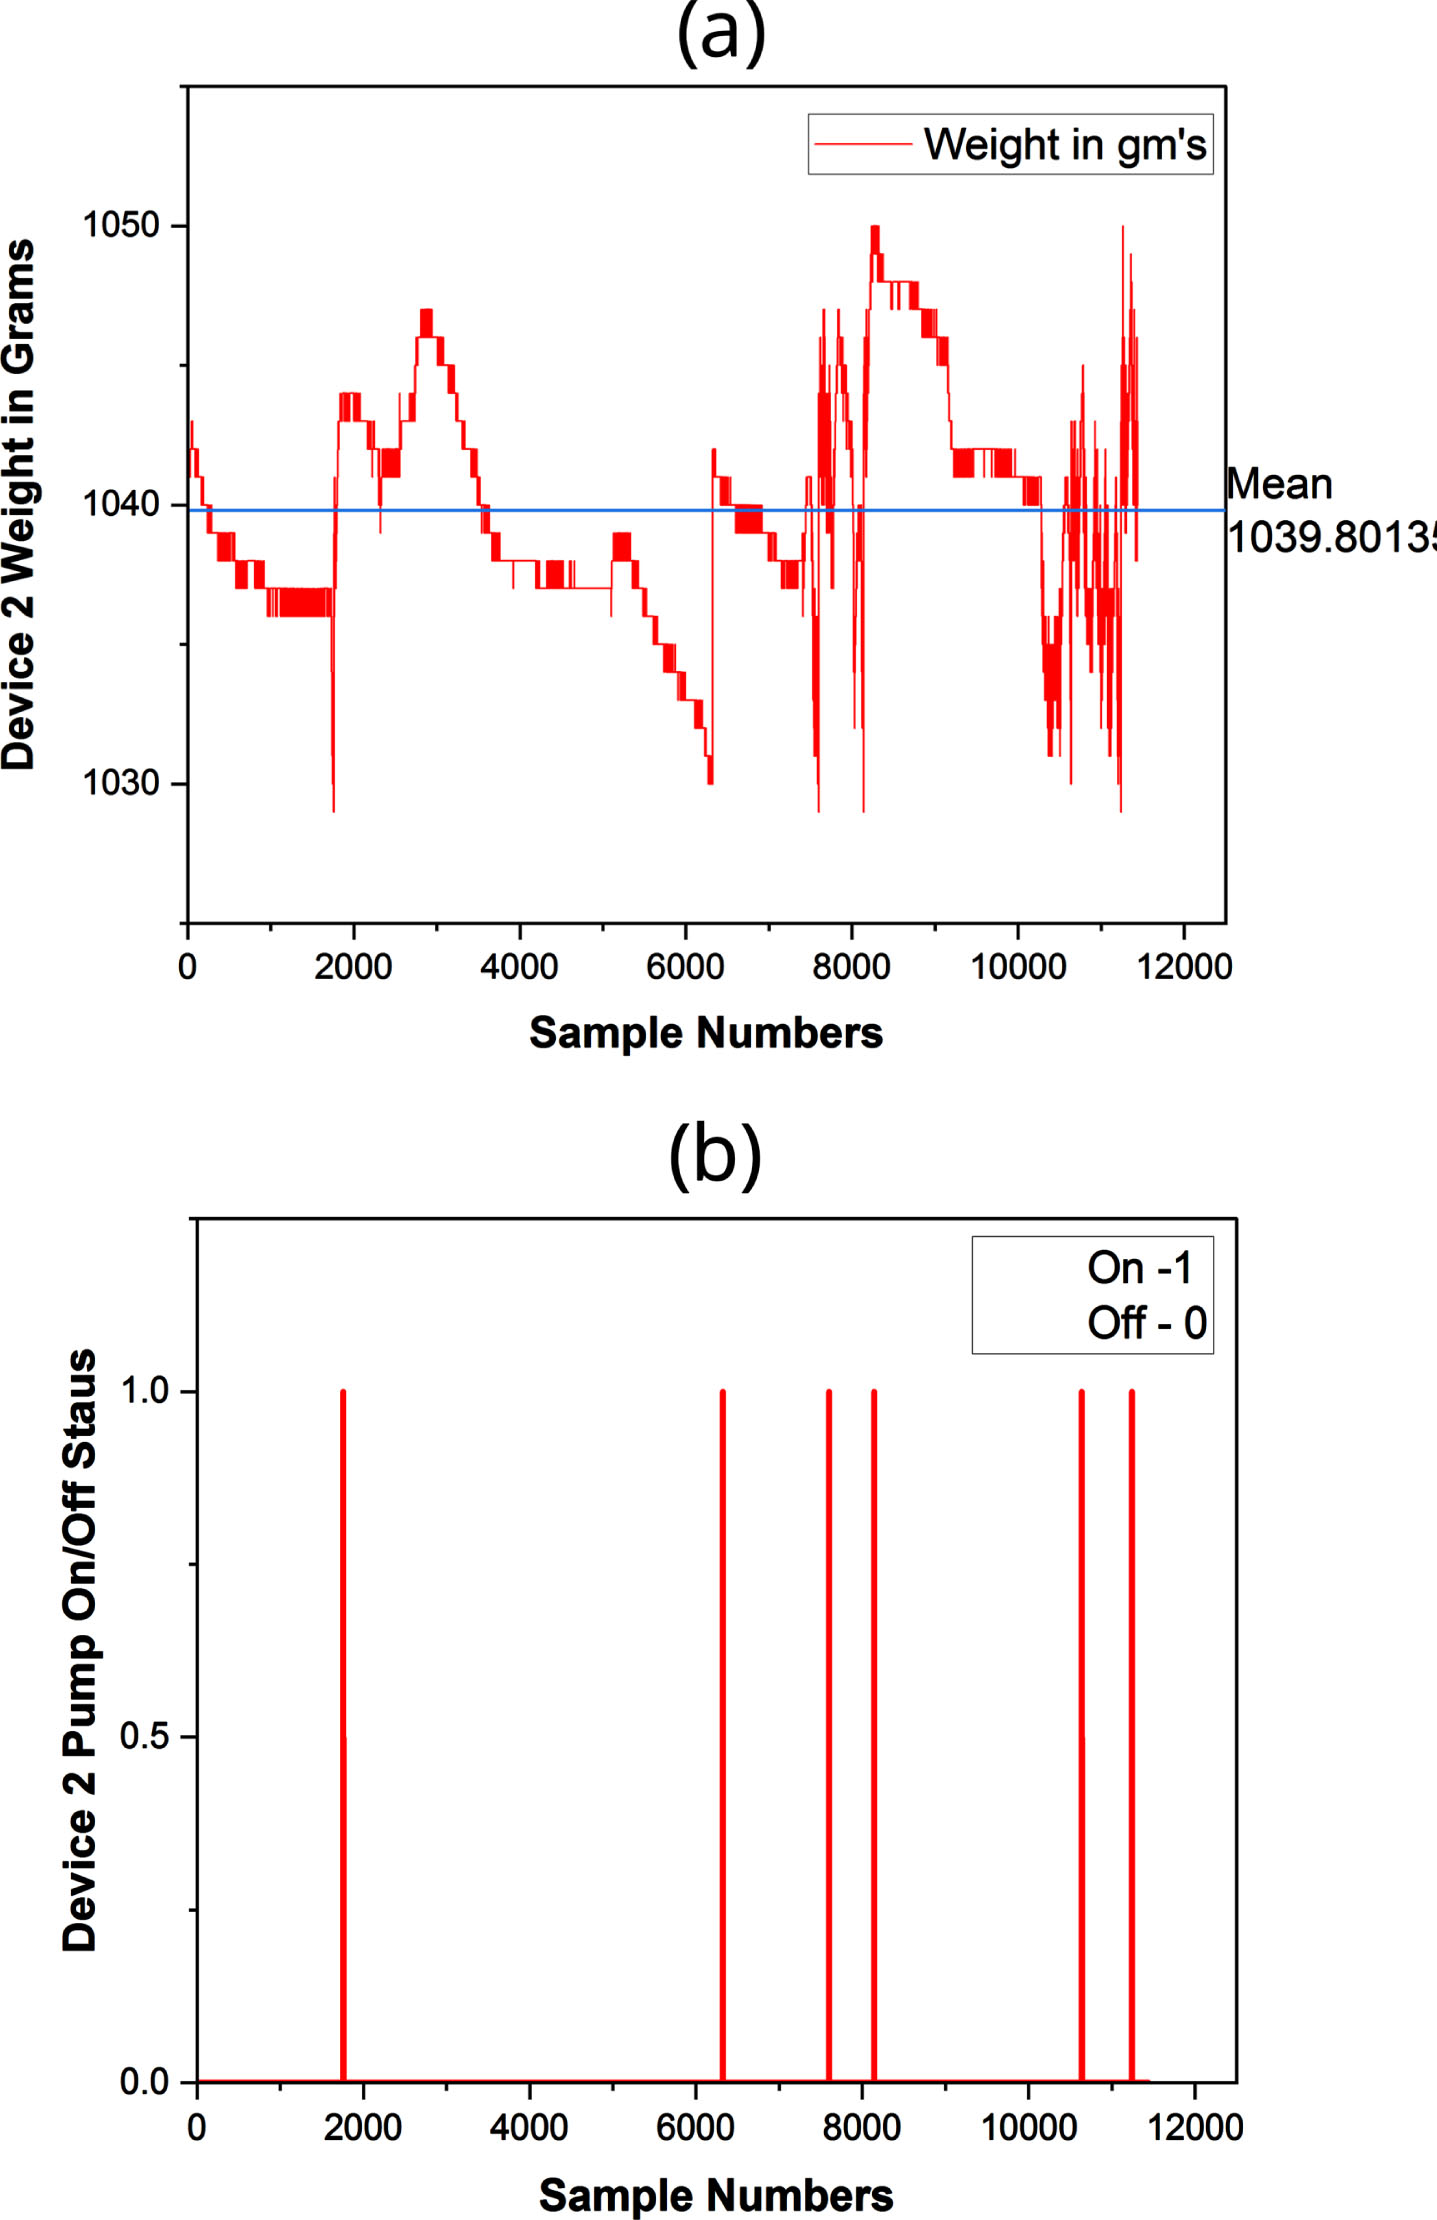
(a). Device 2 Weight in Grams indicating the Moisture content level with respect to gravimetric approach and mean weight of ∼1039 confirms the maintenance of 50% Water holding capacity weight of 1028Grams; (b) Device 2 Pump ON/OFF Status to maintain 70% stressed plant.
Figure 8 shows the real time images of 50% and 70% stressed leafy vegetables plants respectively captured via remote access enabled camera, which is attached to the proposed system
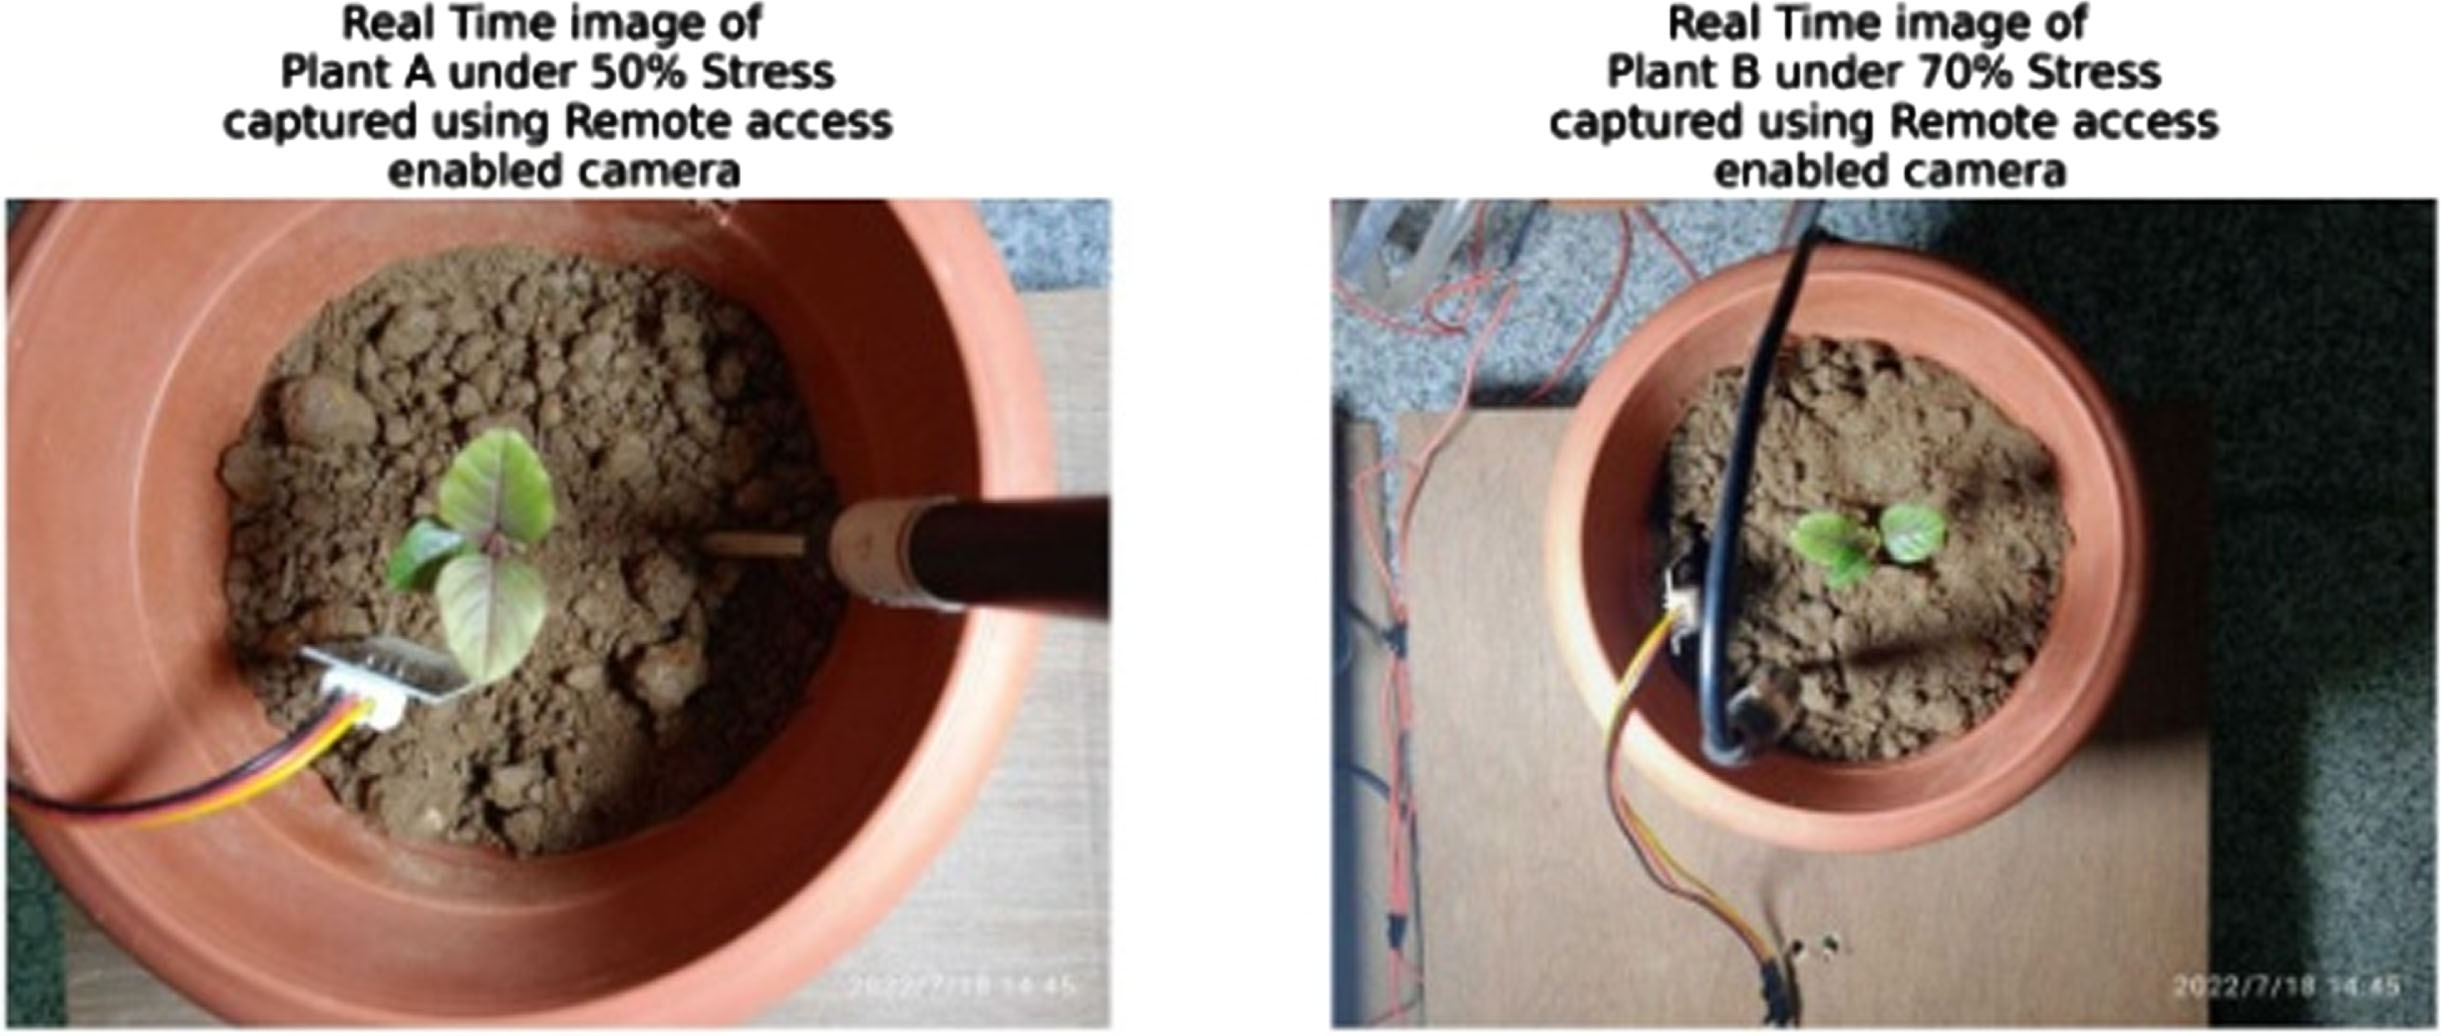
Images of 50% and 70% Stressed plants captured via remote access enabled Raspberry Pi attached NoIR Camera.
The comparative analysis of various state of the art CNN models are evaluated using the plant leaf stress dataset comprised of 44391 training and 14793 validation images, which is comprises of eight different categories of stressed leaf images and one category of healthy leaf images as shown in Fig. 2(a). The experimental evaluation of validation accuracy for different CNN Models with respect to hyper-parameter adjustment is shown in Table 2. The hyperparameters such as learning rate & optimizer is tuned to obtain the better accuracy. The base learning rate is set to 0.01 & 0.001 with a step down decay of 33% of total number of epochs and gamma value of 0.1 as multiplication factor for step down decay. All the models are trained for 30 epochs. The small jump in the loss value after 10 epochs in LeNet and AlexNet boosted for further tuning of Alexnet with different combination of tuning as shown in Table 2. The GoogleNet with a constant learning rate of 0.01 achieved an accuracy of 93%, which boosted for trying the step down decay of 33% with base learning rate as 0.01& resulting in increasing the accuracy of 96% as shown in Fig. 9.
CNN Model validation accuracy with varying Learning rate and optimizer using xPLNet leaf stress dataset
The accuracy is computed by using the following equation

GoogLeNet CNN trained model accuracy tested on xPLNet Leaf dataset.
The extracted leaf image is given to the DCNN trained Model in the NVIDIA DIGITS framework for classification of leaf stress.
Table 3 shows the efficacy of CNN models used in this with hyper-parameters tuned over the other customized CNN model built and trained with same xPLNet soyabean leaf images dataset for stress detections. Even though CNN models are trained with soyabean leaf images for stress detection, the stress features out of leaf texture extracted in CNN model was affirmative for the trained model to determine the stress response on leafy crop leaflets used in this work.
Comparative performance analysis of proposed system used CNN models for leafy crop stress detection with other existing work CNN model used on same dataset
The real time captured images of plant under stress is preprocessed using graph cut segmentation to extract the leaf portion of the plant image and the result of the segmentation as shown in Fig. 10.
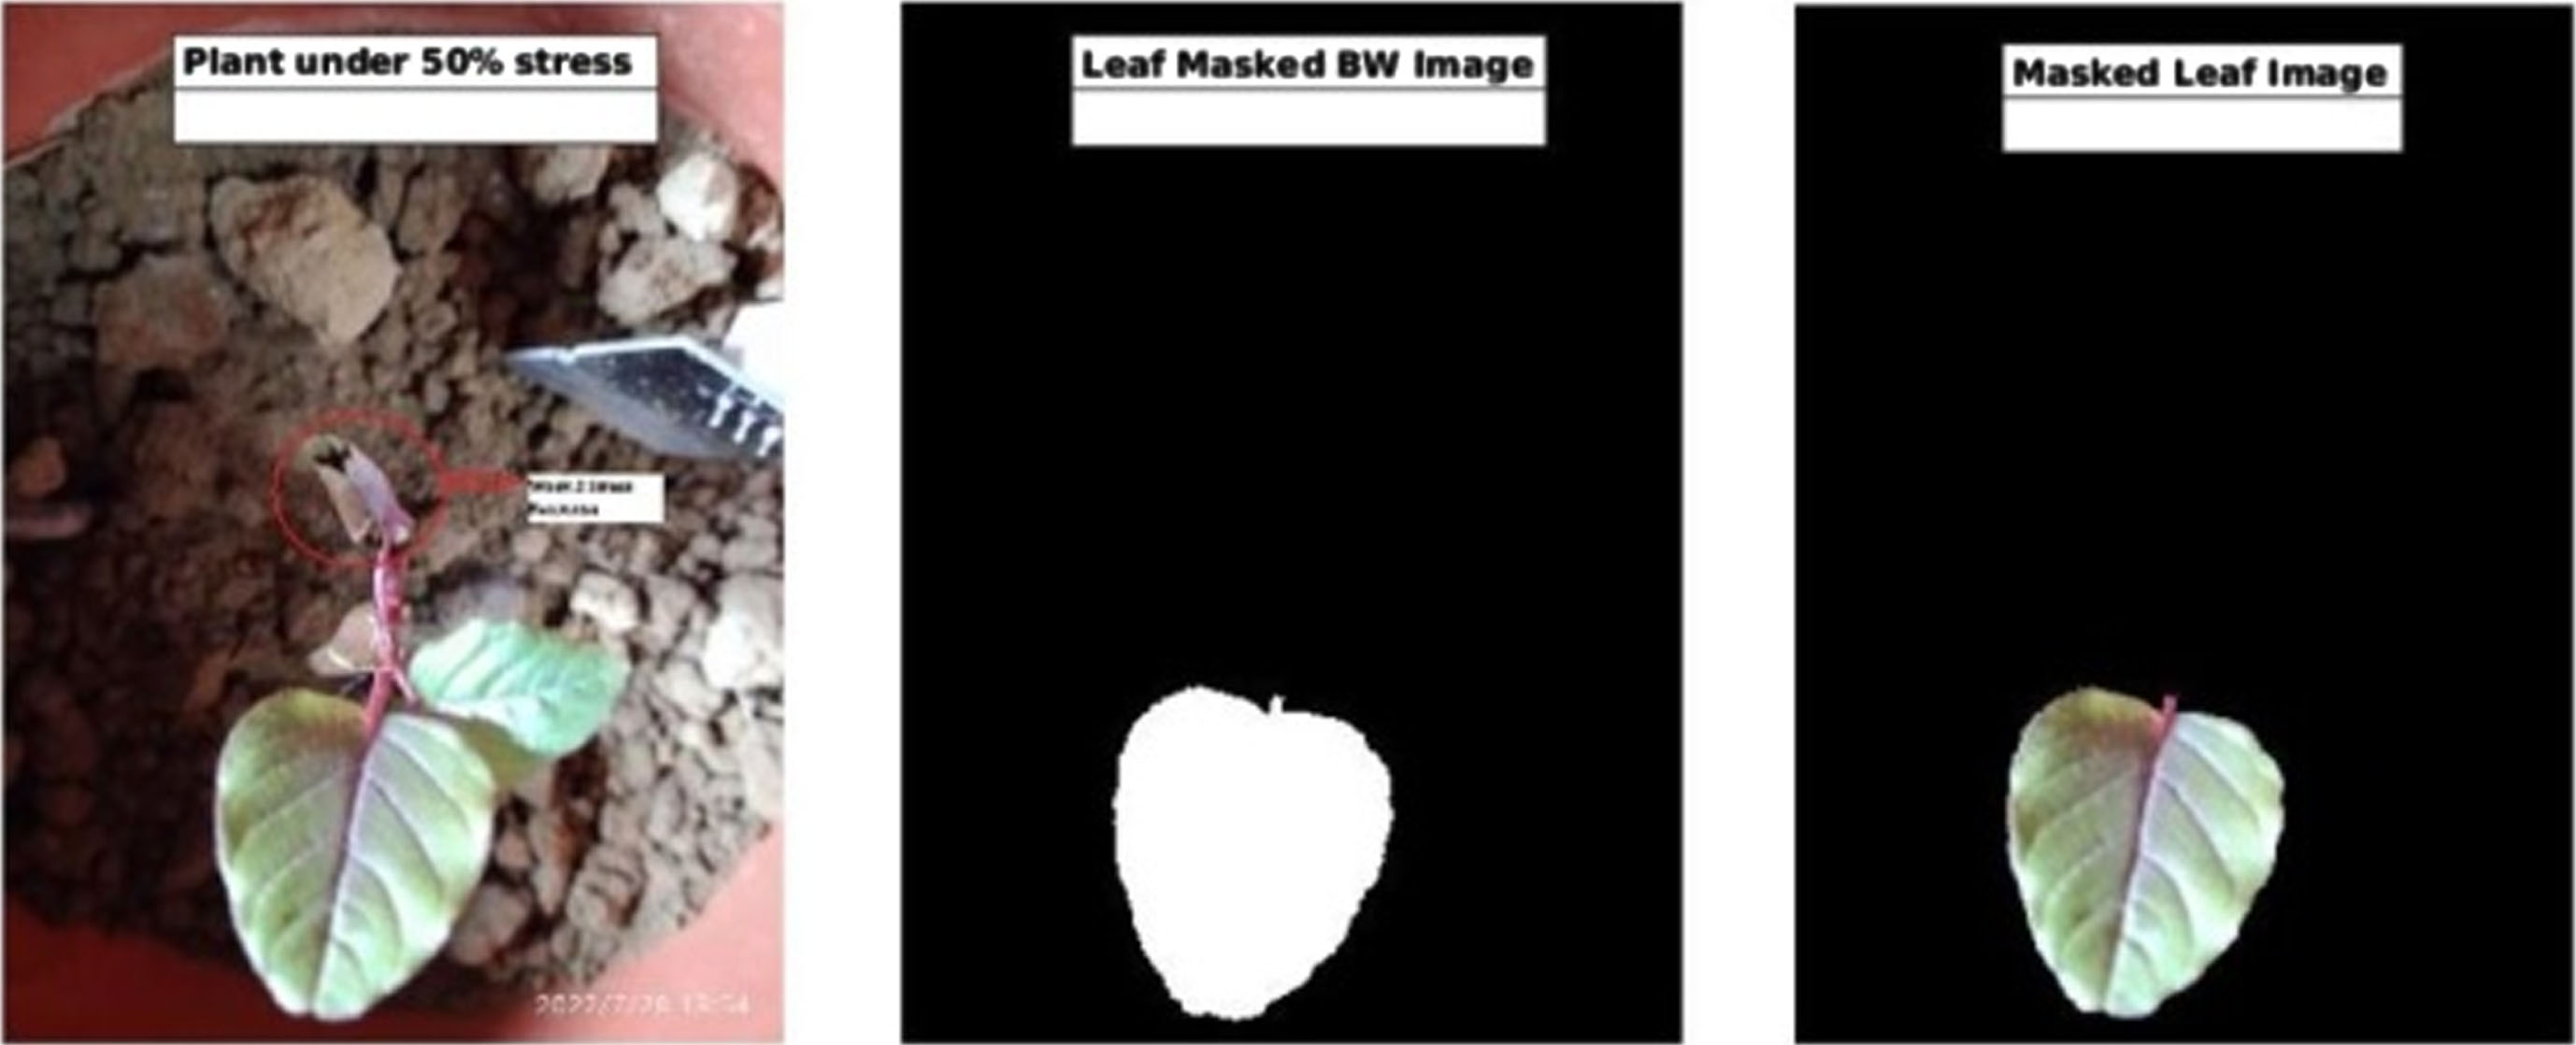
Image segmentation for extracting the leaf portion of an image.
As shown in Fig. 11 DCNN classifies the given leaf image into non healthy leaf category and confirms the stress response on plant. Also the real time plant images are used to note down the plant growth rate parameters as number of leaf.

Classification of 50% stressed plant leaf image using DCNN.
Figure 12(a) shows the complete dry leaf curl after 8 days of stress accumulation on 50% stressed plant. Similarly Fig. 12(b) shows the mid stage of leaf curl stress response after 8 days of stress accumulation on 70% stressed plant. Figure 12(c) & Fig. 12(d) shows the progress in stress response in week 3 and confirms the reliability of proposed device in persevering the desired stress level of 50% and 70% moisture stress respectively.

Leafy Vegetable plant under 50% and 70% moisture stress showing the stress responses in week 2 and week3 of experimental study.
The second experiment was conducted on tomato plant, where in 2 plants are taken. Plant A is grown under 50% stress and Plant B is grown under 70% Stress. The IoT based plant phenotyping device was able to maintain the stress on plants. The stress response were noticed and its shown in Figs. 13 and 14.

Tomato plants under 50% stress experimental study and observed stress responses.
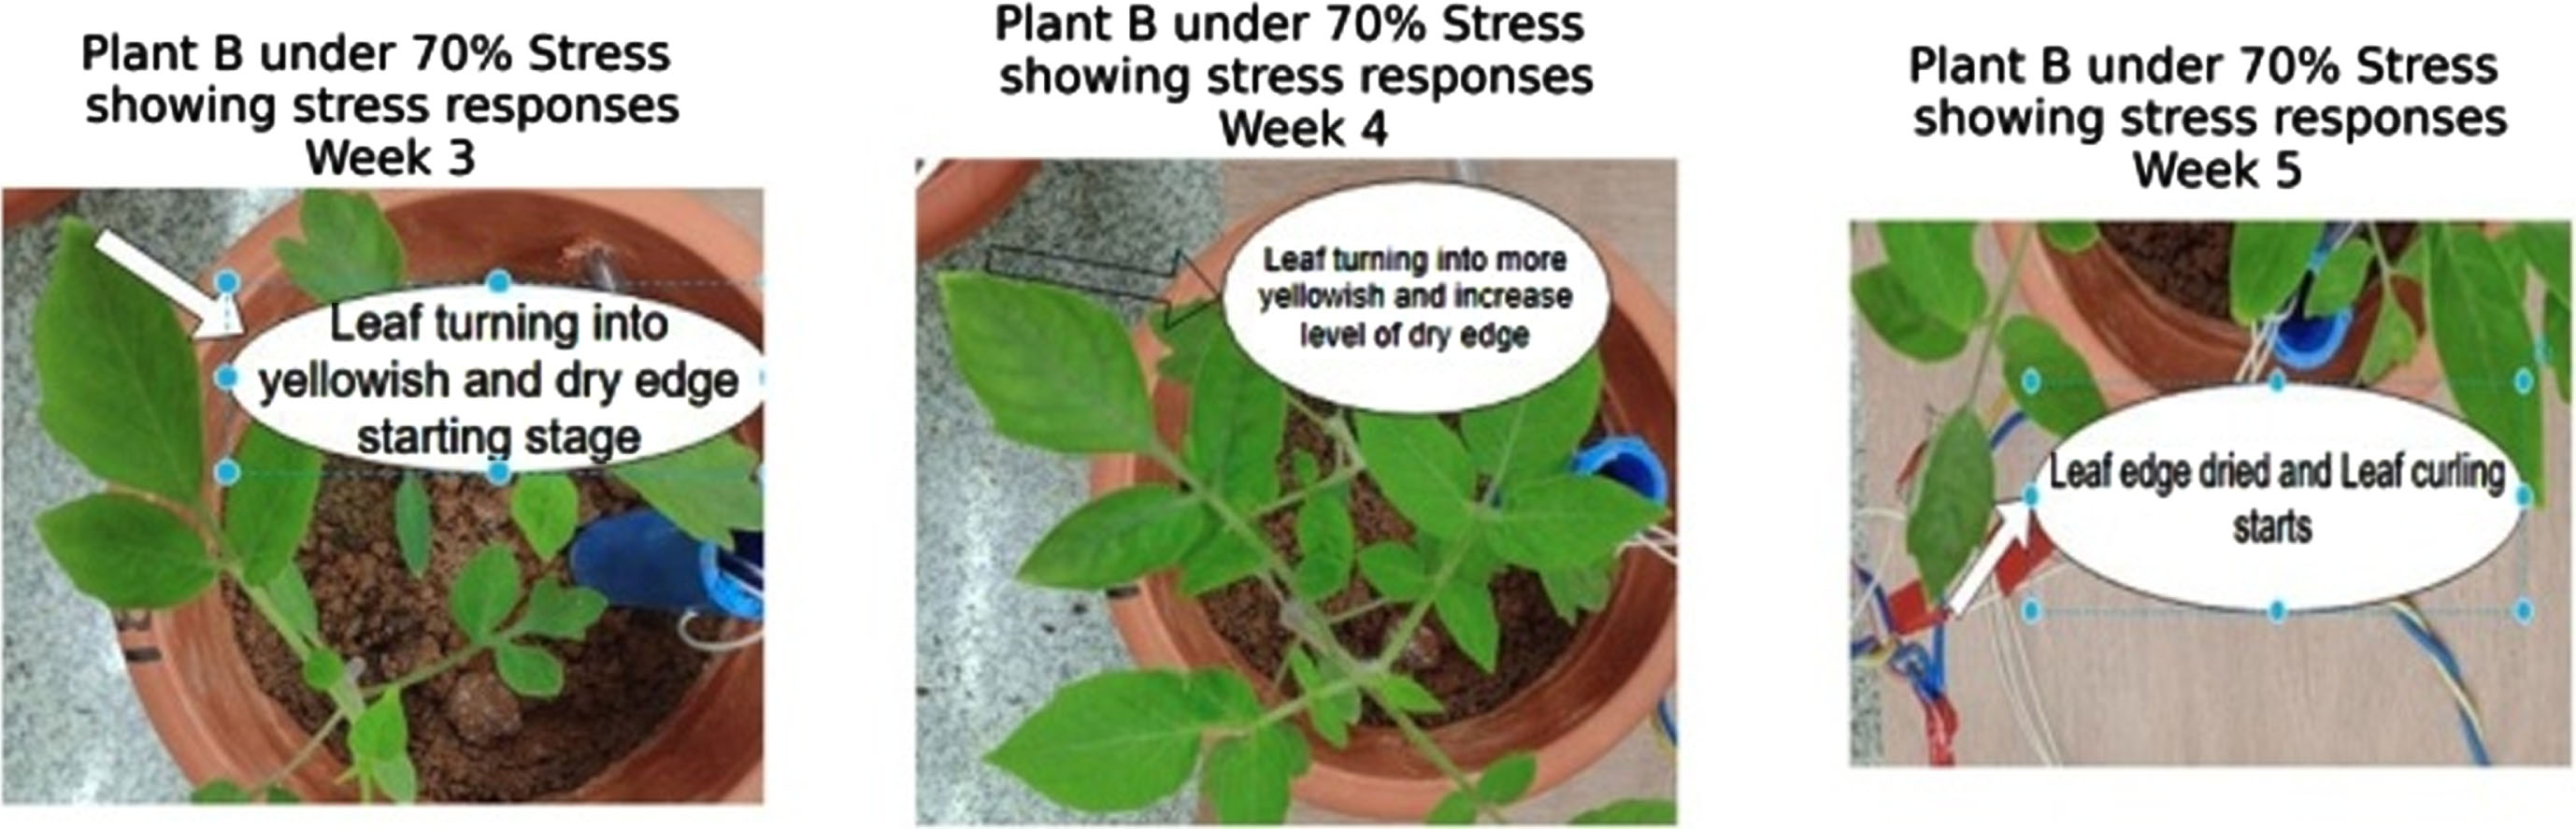
Tomato plants under 70% stress experimental study and observed stress responses.
Figure 15(a) and (b) shows the output of the Graph cut based segmentation of the 50% moisture stressed plant A and 70% moisture stressed plant B respectively. The segmentation output of binary & masked image clearly shows the number of leaf in plant A is fewer than the Plant B.

(a). Graph Cut applied segmented image of plant A during week 3; (b) - Graph Cut applied segmented image of plant B during week 3.
Figure 16 shows the number of leaf count during the experimental study and observed higher reduction of leaf count in 50% stressed plant compared 70% stressed plant further concludes the accuracy of the proposed system on maintaining the stress level.
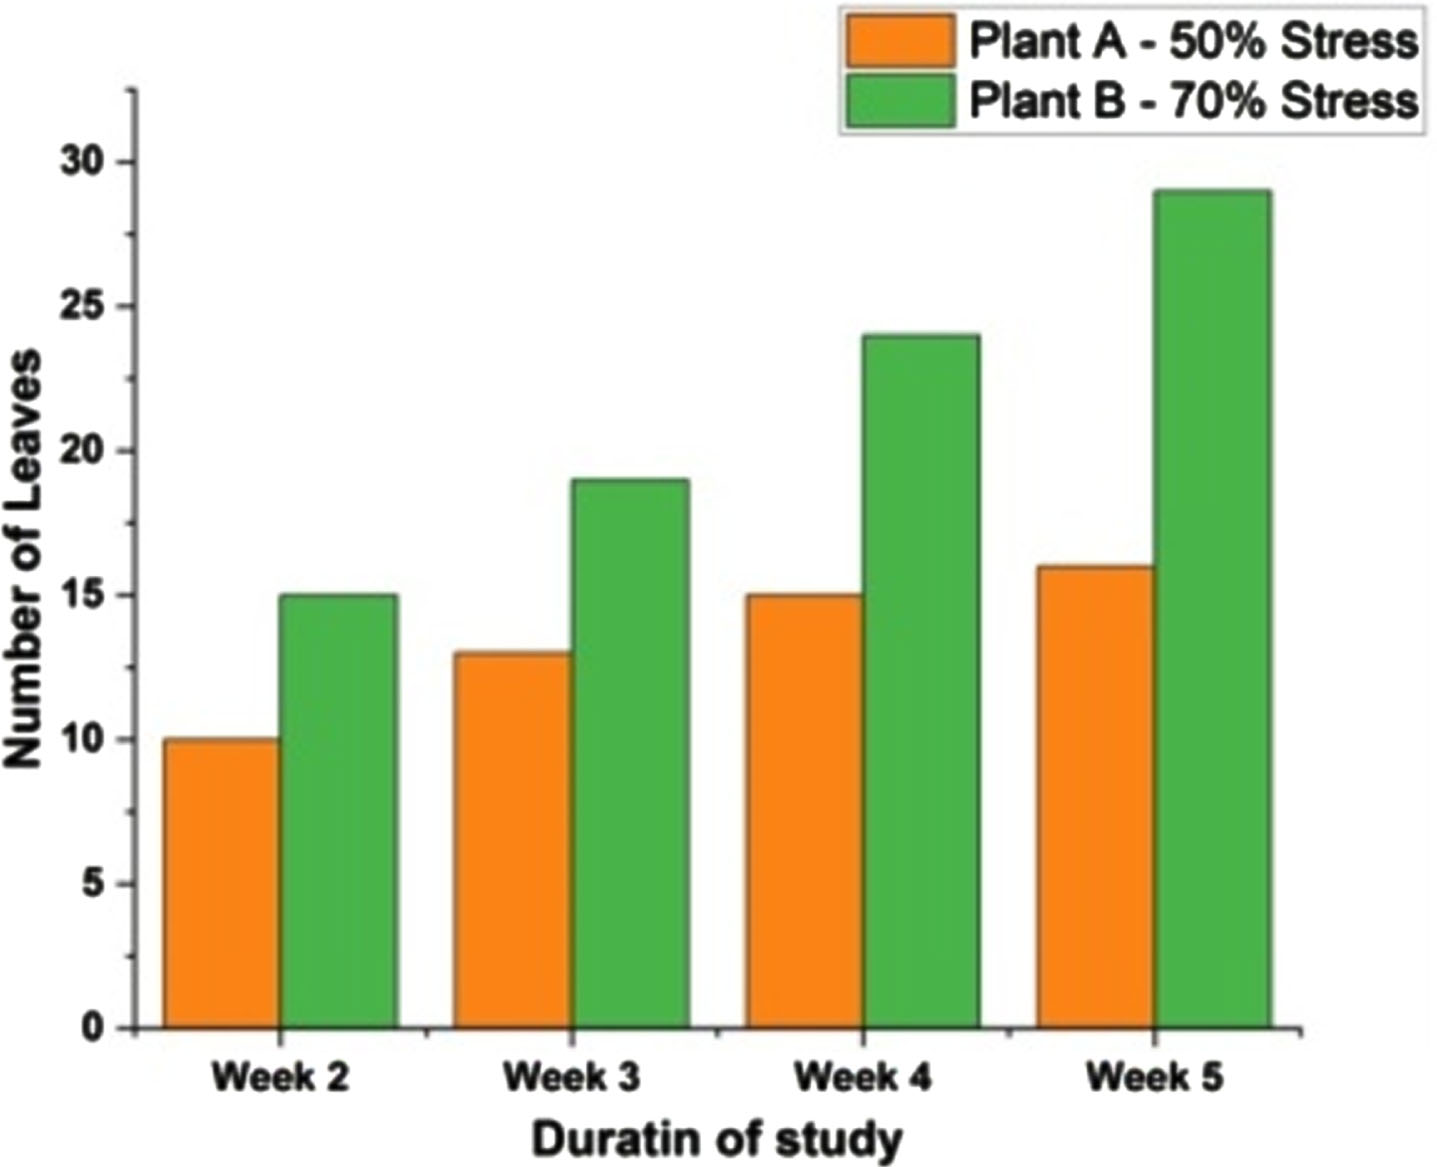
Number of leaves count in plant A and Plant B during experimental study.
Figure 17 shows the thermal images captured of Plant A and Plant B along with RGB images in the 3rd week after maintaining the stress level of 50% & 70% respectively.
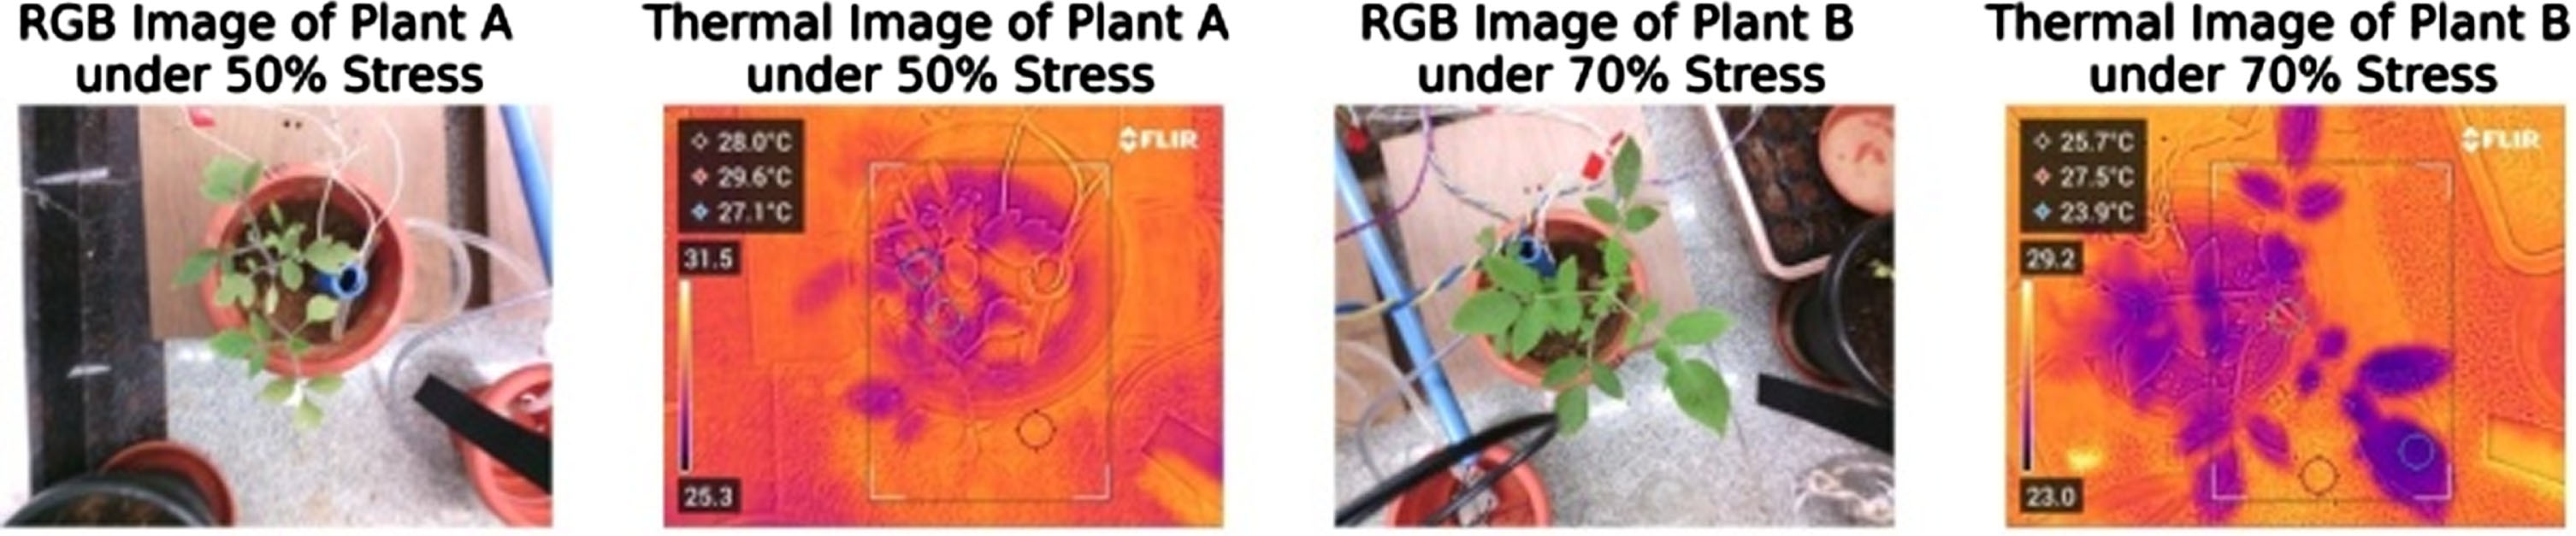
Plant RGB Images and corresponding Thermal Images.
Table 4 shows the thermal images with higher temperature value of around 29 Degree in the plant A compared to plant B temperature of 27 Degree. This shows that, the system is able to maintain the desired stress level
Observed Elevated Temperature in plant leaf due to automated maintenance of moisture stress using proposed system
GoogLeNet DCNN model is trained with tomato leaf disease dataset comprised of 10000 trained images and 1000 validation images categorized into 10 categories as shown in Fig. 2(b). The trained GoogLeNet DCNN Model achieved a promising accuracy of 97% as shown in below Fig. 18 and trained model is used for predicting the stress response on tomato plants.

GoogLeNet Deep learning trained model accuracy tested on Plant-Village Tomato disease dataset.
The comparison Table 5 shows the efficacy of the CNN model used in this work. Even though third approach accuracy is near to the approach used in this work, CNN approach used in this study is better suitable due to its less complexity and less number of parameter compared to third approach.
Comparative performance analysis of proposed system used CNN models for tomato crop stress detection with other existing works CNN models used on same dataset
Comparative analysis of proposed IoT based plant phenotyping device with other existing works
Figures 19 and 20 shows the stress response predicted upon feeding the stressed plant leaf images into trained DCNN models at different weeks. Figure 19(a) and (b) shows the moisture stress prediction by DCNN model by classifying the 50% stressed plant leaf images into 5 th category, which is a non healthy category of a leaf. Similarly the Fig. 20(a) & (b) shows 70% stressed plant B’s leaf classified into non healthy category. The result shows the DCNN model classification of leaf images into non healthy category proves the presence of moisture stress response. The experimental results conclude the accuracy of proposed system on maintaining the desired level of stress and validate the accuracy of trained model to detect the presence of stress response. The trained model would be useful in predicting the stress response and engaging the necessary actions well in advance to mitigate the progress of stress to entire plants.
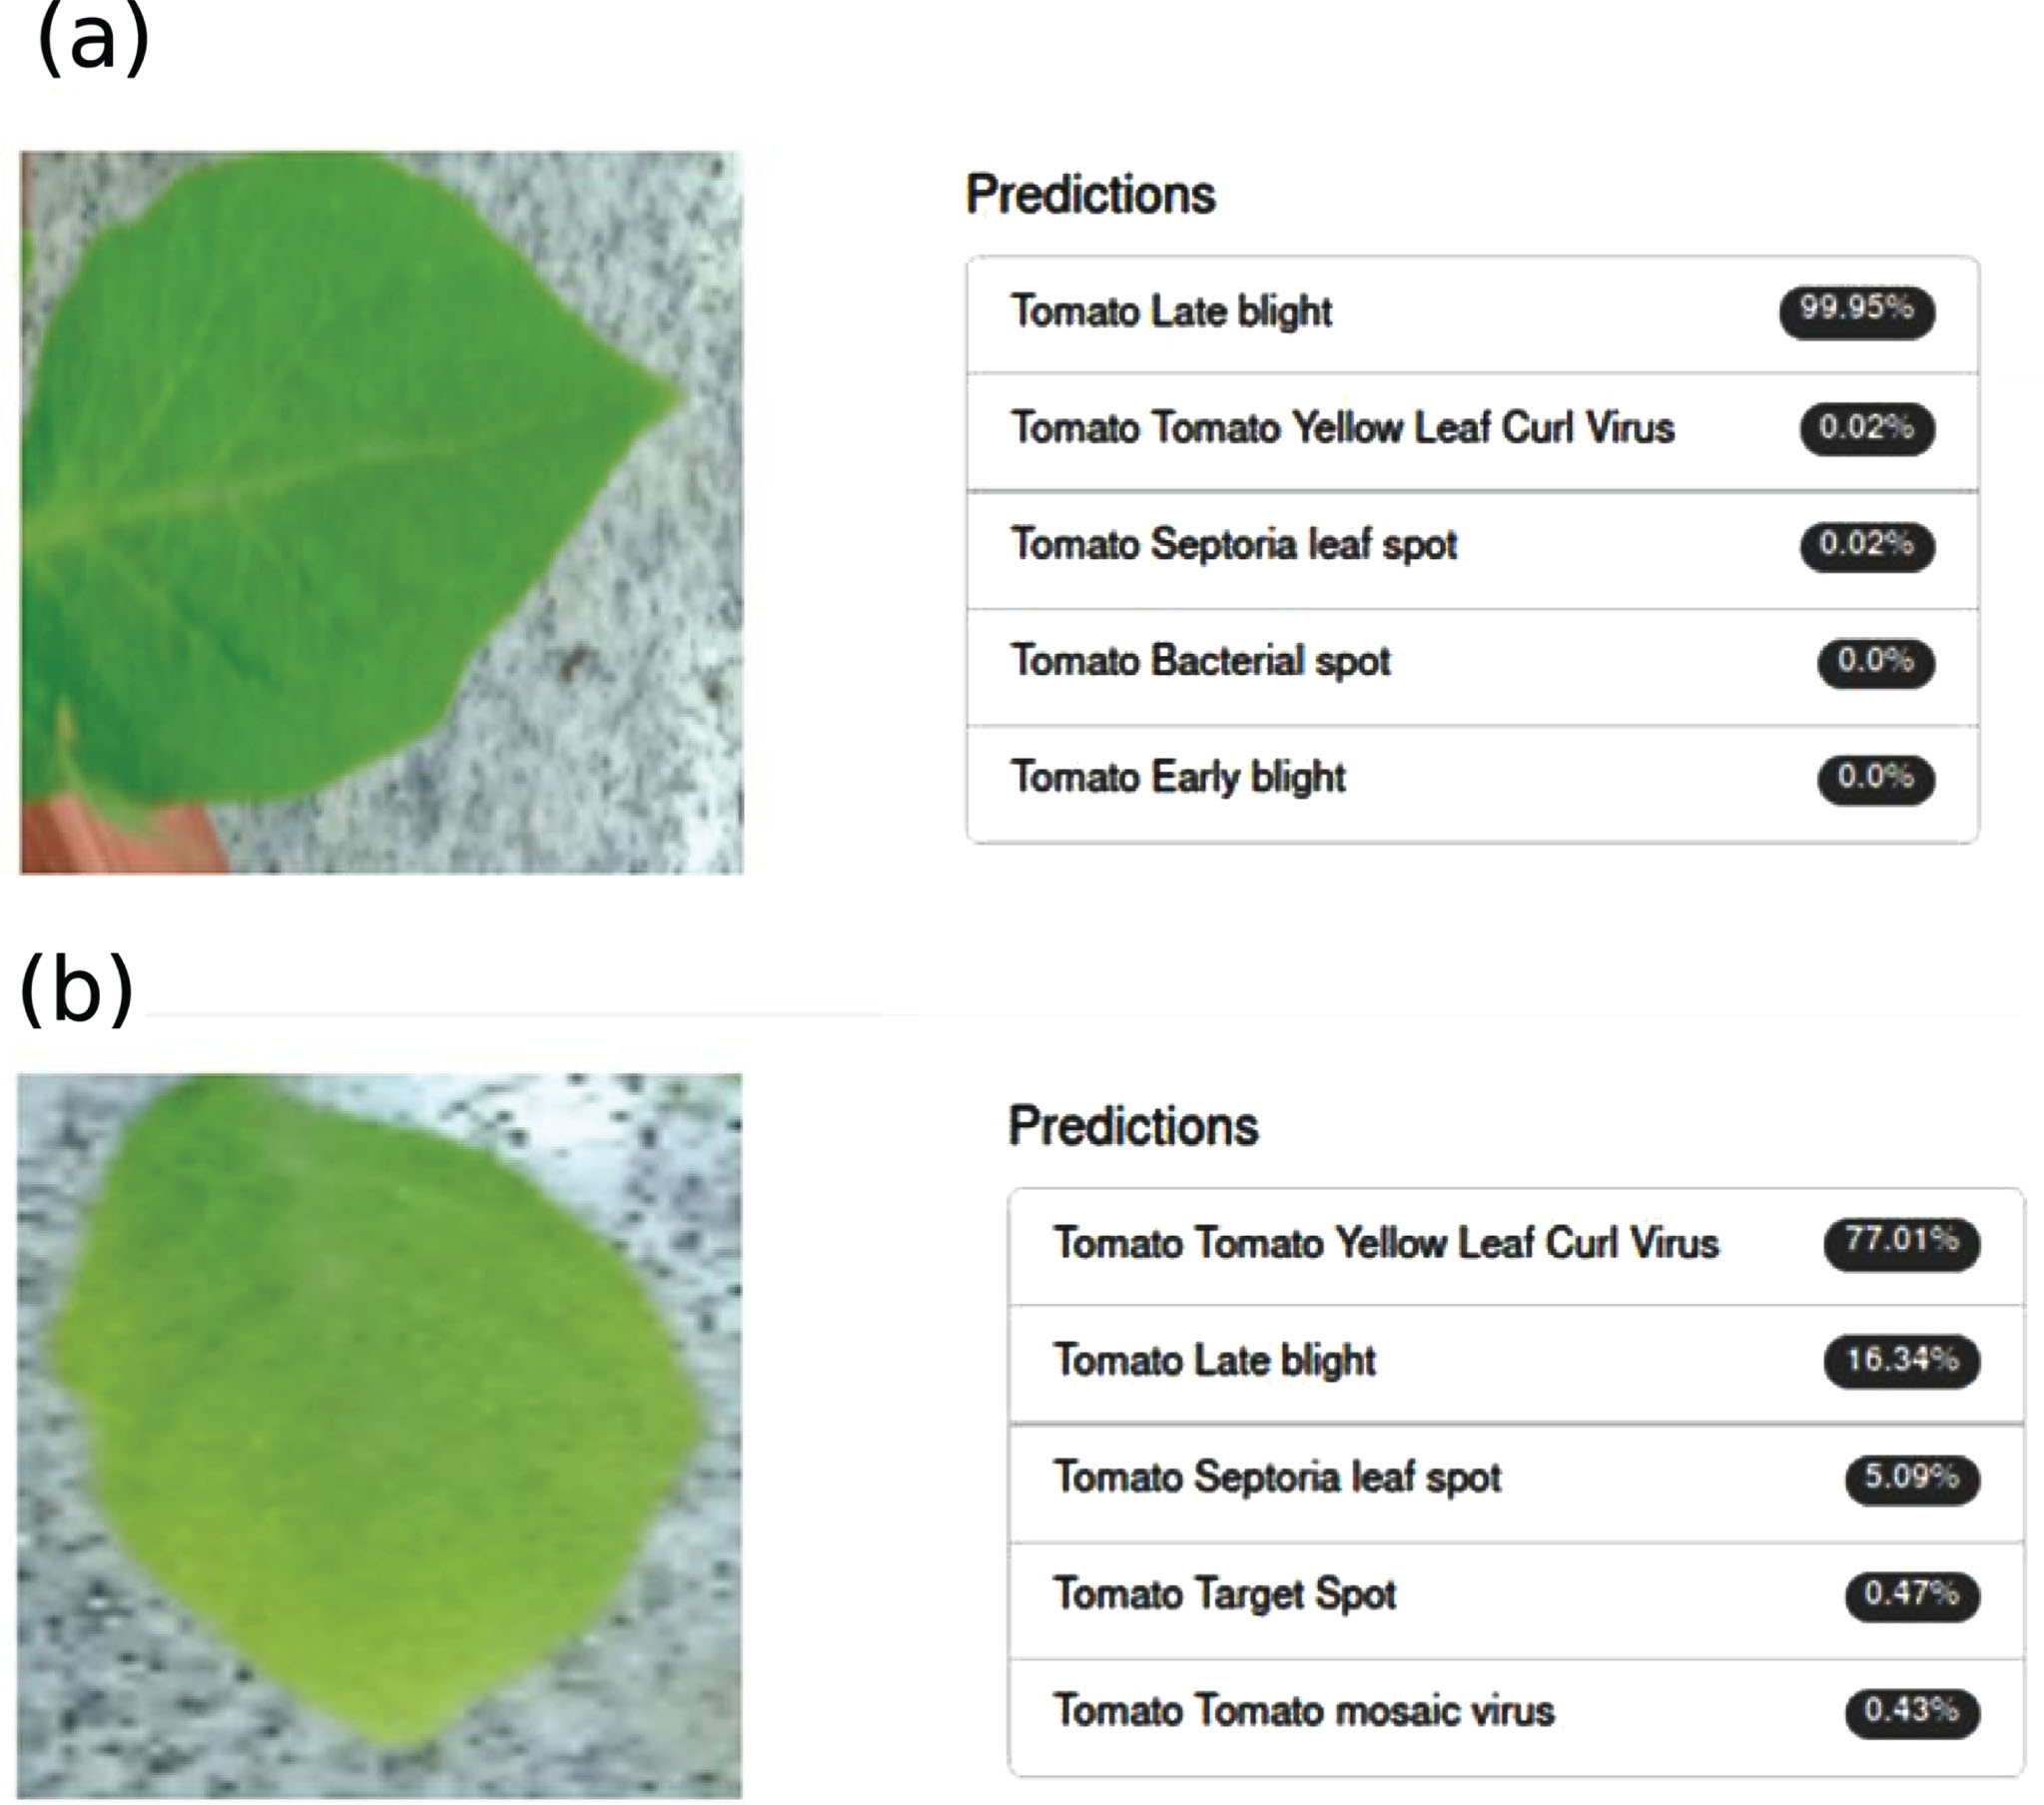
Plant A under 50% Stress prediction using GoogLeNet trained model. (a) Plant A stress classification in week 3 Tomoto new disease caffe Googlent image classification model. (b) Plant A under 50% stress predication using GoogLeNet trained model.
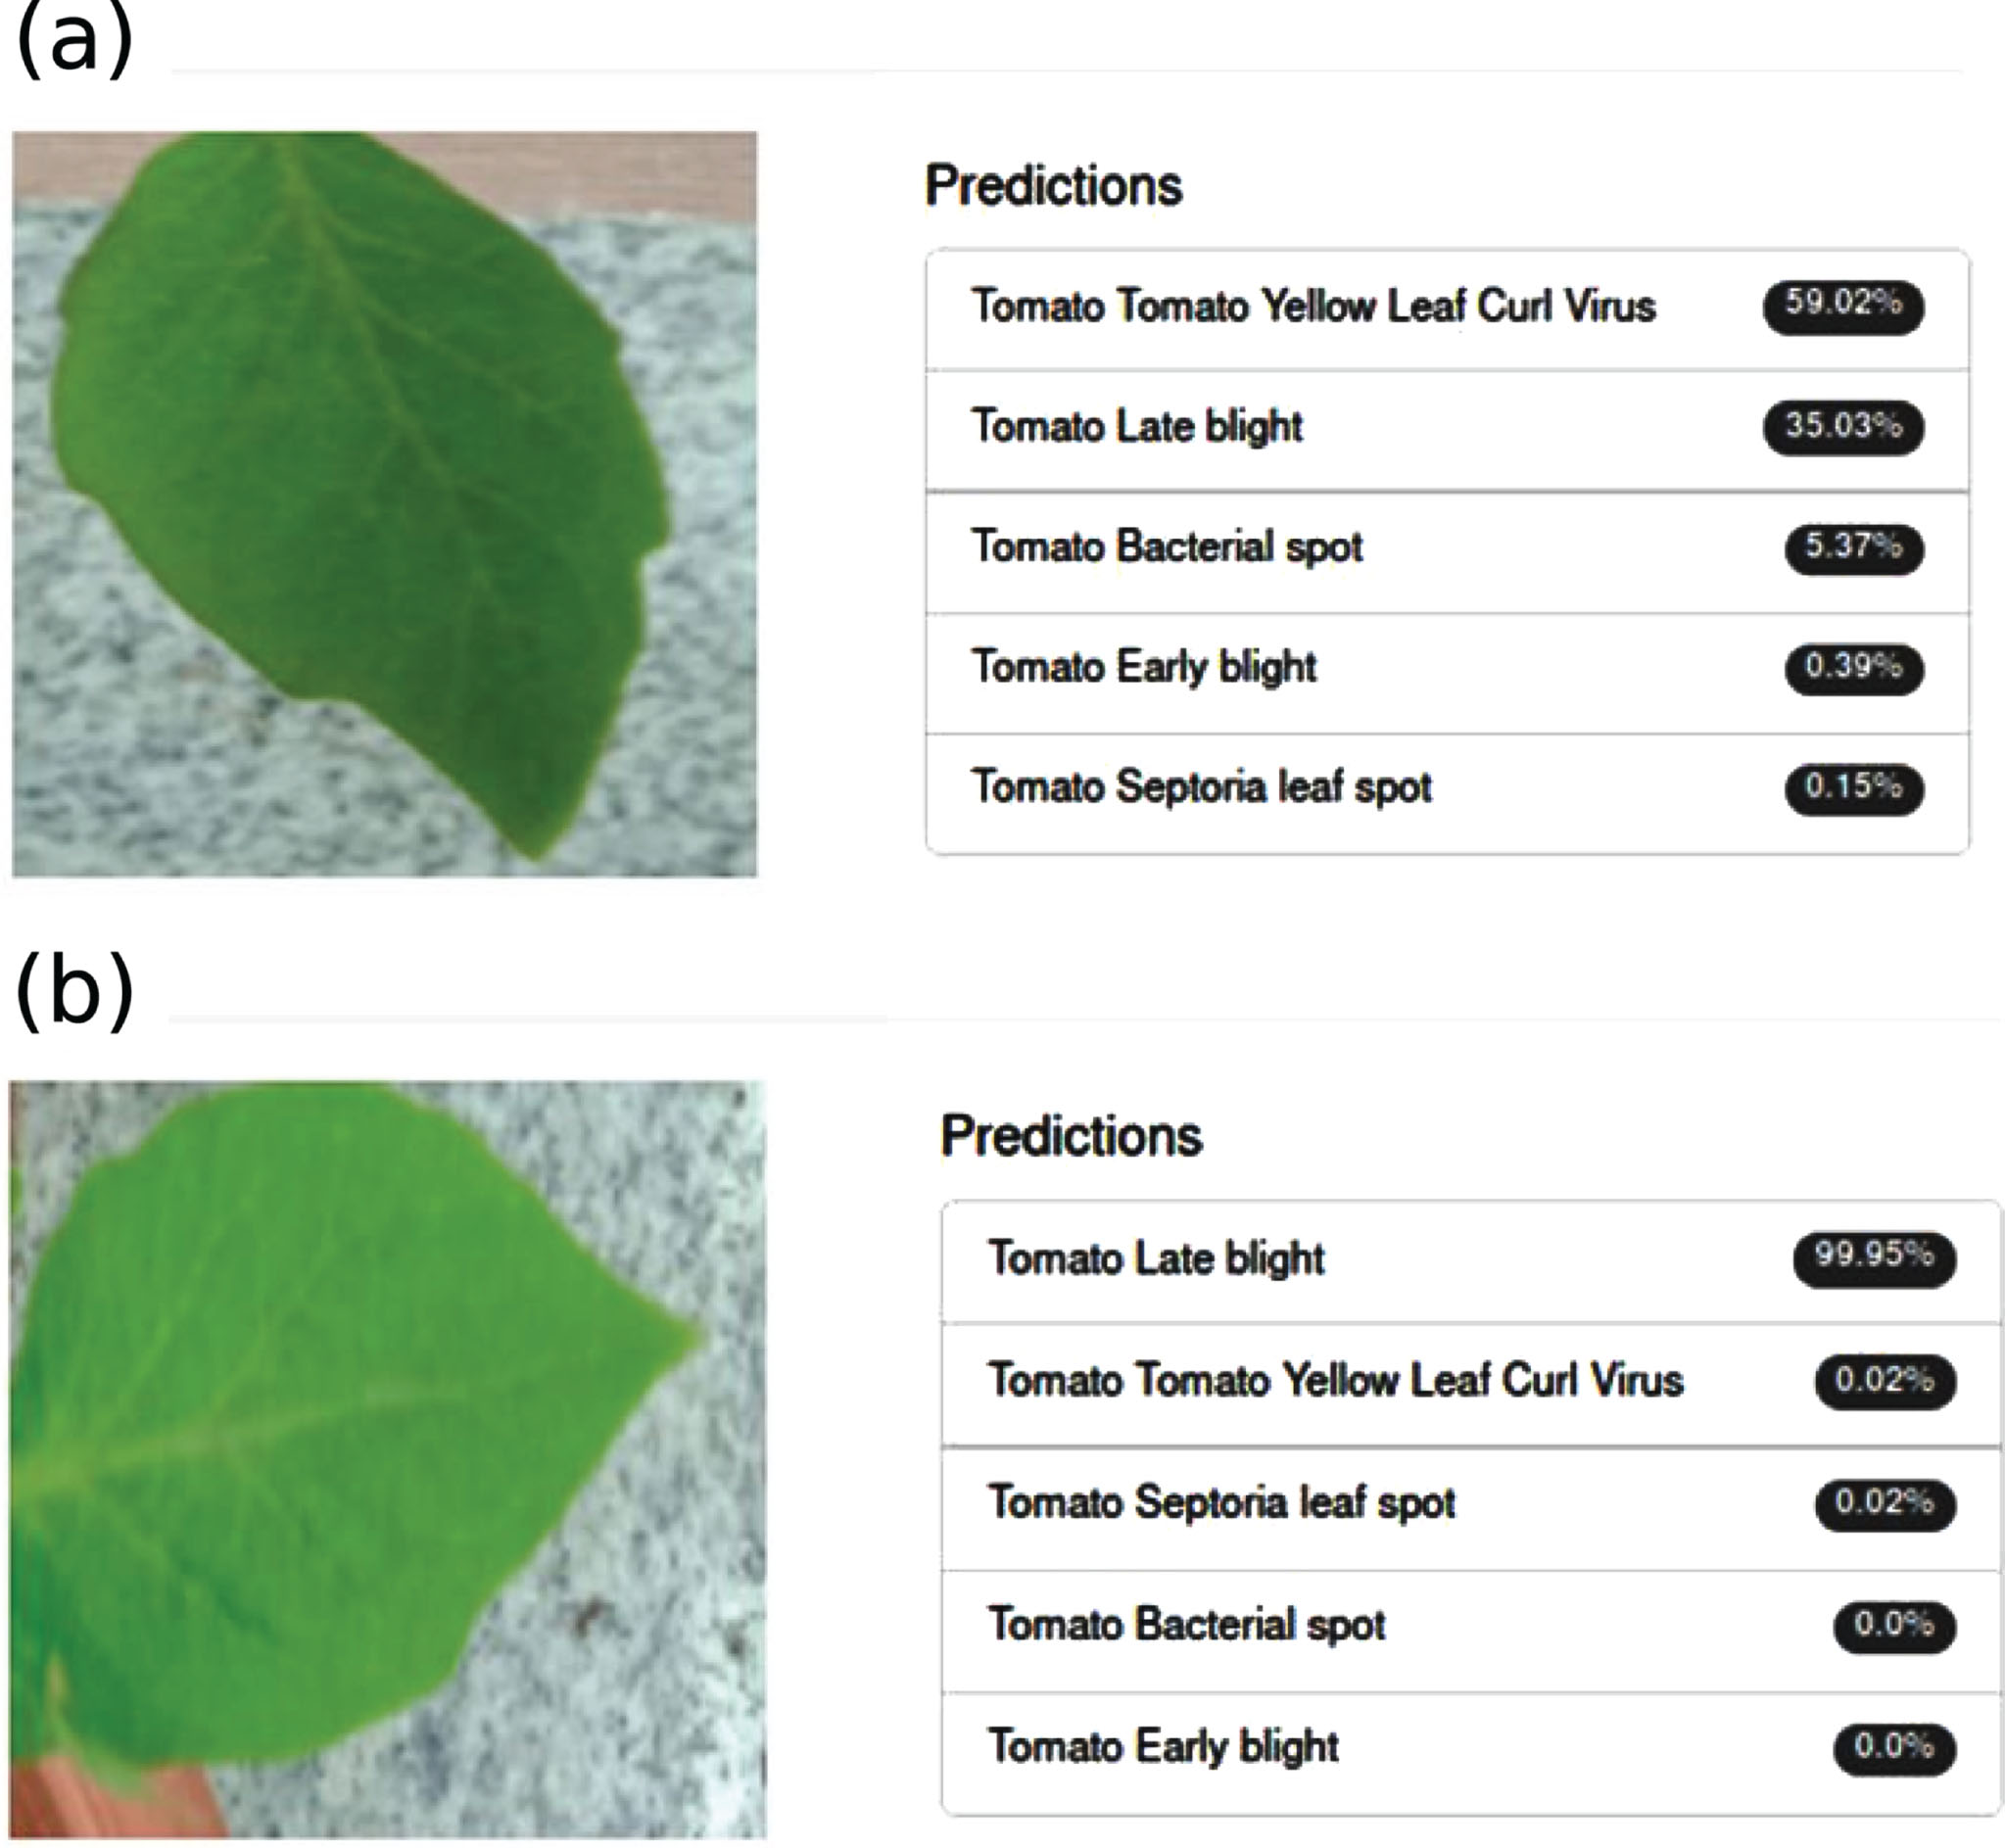
Plant B under 70% Stress prediction using GoogLeNet trained model. (a) Plant B stress classification in week 3 Tomoto new disease caffe Googlent image classification model. (b) Plant B stress classification in week 4 Tomoto new disease caffe Googlent image classification model.
Table 6 shows the comparative analysis of the proposed IoT based plant phenotyping system with other existing related system. The proposed device outperforms existing work in terms of maintaining the moisture stress in précised level and provides low cost setup combining both IoT and Deep learning based CNN technology for ease of stress response detection.
Due to lack of low cost précised device for moisture stress experimental study, the study of moisture stress tolerance level of a plant and early detection of moisture stress has been a challenging task. The major challenge of maintaining the plant under desired level of drought stress has been a difficult task. Also the feasible solution for early detection of moisture stress response is the need of the hour due to rapid increase of drought land. The précised way of conducting the moisture stress experimental study is important for determining the correct plant genes with various level of moisture stress tolerance.
In this work, low cost IoT enabled plant phenotyping device is designed and developed to conduct the moisture stress experimental study and response detection using deep learning. The built device was able to maintain the desired moisture stress level of 50% to a Plant A and 70% for another Plant B respectively for the complete duration of experimental study. IoT capability of a built device provided features of remote access and monitoring of data. The various state-of-the-art Deep Learning models were trained with hyperparameter tuning to obtain the trained model for early detection of stress response. Among the trained models, the GoogLeNet CNN Model achieved a validation accuracy of 96%.
Further research on leaf dataset used for building the CNN models, the remote accessible camera may provide the future scope of work for generating leaf image dataset for variety of crops and building the higher efficient CNN models.
Author contribution
Acknowledgements
Authors like to thank VGST, Department. of IT, BT, and S&T, Government of Karnataka, Bangalore, for sanctioning research grant for the Department of Computer Science and Engineering, Mangalore Institute of Technology and Engineering, Moodabidri, under KFIST= L2" grant schema vide GRD No. 339 for setting up an advanced research lab to conduct this research work. Authors also would like to thank the management of Mangalore Institute of Technology and Engineering for providing the infrastructure facility to carry out this research.