
Abstract
Smart farming is revolutionizing agriculture by integrating advanced technologies to enhance productivity, efficiency, and sustainability. This paper proposes a novel, 5G-enabled Pest and Disease Detection and Response System (PDDRS) that synergizes environmental sensor data with image analytics for comprehensive Plant Disease Detection (PDD). By leveraging the high bandwidth and ultra-low latency capabilities of 5G, our integrated system surpasses traditional communication technologies, facilitating real-time data analytics and immediate intervention strategies. We introduce two Machine Learning (ML) models: an image-based Mask R-CNN with FPN, which achieves a precision of 91.1% and an accuracy of 95.1%, and an environmental-based FFNN + LSTM model, evaluated for ACC, AUC, and F1-Score, showing promising results in disease forecasting. Our experiments demonstrate that the PDDRS significantly enhances throughput and latency performance under various connected devices, showcasing a scalable, cost-effective solution suitable for next-generation smart farming. These advancements collectively empower the PDDRS to deliver actionable insights, enabling targeted applications such as precise pesticide deployment, and stand as a testament to the potential of 5G in agricultural innovation.
Introduction
Smart farming transforms agriculture by harnessing emerging technologies to boost productivity and sustainability. Internet of Things (IoT) sensors, drones, and Artificial Intelligence (AI) have enabled farmers to monitor agricultural conditions in real-time, thereby improving yields and reducing waste. In particular, Plant Disease Detection (PDD) has emerged as a critical field where timely and accurate identification of diseases is crucial for effective intervention [1]. Leveraging AI and Machine Learning (ML) for early symptom detection and utilizing remote sensing for precise treatment applications exemplify the adopted proactive strategies. These advancements are increasingly integrated into cohesive systems that enhance the monitoring and management of crop health [2, 3].
ML is gaining traction in agriculture, showing promising applications in areas such as plant disease classification using Convolutional Neural Networks (CNNs) and pest prediction through Long Short-Term Memory (LSTM) networks [4]. These methods and Deep Learning (DL) techniques for object segmentation are paving the way for more sophisticated and integrated approaches to PDD. However, the full potential of these technologies can only be realized when combined with environmental data, as standalone image analysis does not account for critical factors like climate and soil conditions [5]. A comprehensive system that marries image-based diagnostics with real-time environmental insights promises to revolutionize PDD, offering precise and timely agricultural interventions.
As smart farming technologies advance, the shortcomings of current communication systems like Wireless Sensor Networks (WSN), LoRa, Zigbee, and 4G become increasingly evident [6]. These networks struggle with limited coverage, high latency, and inadequate bandwidth, presenting significant challenges in applications such as plant disease monitoring and precision agriculture [7]. In contrast, 5G technology emerges as a transformative solution, addressing these challenges with ultra-low latency and high bandwidth capabilities. These features are crucial for real-time data processing and rapid decision-making in agriculture. 5G’s reliability and scalability surpass those of 4G and 3G, allowing for a higher density of connected devices and more efficient data handling [8]. This makes 5G an indispensable technology for smart farming, enhancing the performance of IoT sensors, drones, and AI-based systems. The integration of 5G thus represents not merely an upgrade but a fundamental shift towards more efficient, responsive, and sustainable agricultural practices, offering a significant leap forward from the limitations of previous network generations [9].
Despite the promising advantages of 5G technology in enhancing smart farming, its implementation faces several challenges. First, the initial investment for 5G infrastructure, including deploying new cell towers and upgrading existing ones, can be substantial, posing a significant hurdle, especially in rural and remote farming areas. Second, the energy demands of 5G networks are higher, which could be a limiting factor in areas with restricted power resources [10]. Additionally, the operation and maintenance of 5G networks require technical expertise, potentially creating a skill gap in agricultural regions. Integration with existing agricultural technologies also presents a challenge, necessitating adaptive strategies for seamless technology transition. Lastly, data privacy and security emerge as critical concerns, given the increased data transmission capabilities of 5G [11]. These factors collectively highlight the need for a balanced approach in adopting 5G for agricultural advancements, considering both its transformative potential and the practicalities of its implementation in diverse farming environments [12].
The motivation for this research stems from the need to enhance agricultural productivity and sustainability. Traditional farming faces challenges in efficient plant disease detection and management. The emerging 5G technology and advancements in machine learning present an opportunity to address these challenges. This research explores the integration of 5G and machine learning in smart farming, focusing on improving Plant Disease Detection. The goal is to bridge the gap between advanced technology and agricultural practices, aiming to transform farming methods for better efficiency and sustainability.
This work introduces an advanced, multi-tiered approach to smart farming by leveraging existing communication and sensor technologies. This proposed Pest and Disease Detection and Response System (PDDRS) is an innovative, multi-tiered smart farming solution that harnesses the synergy of cutting-edge communication and sensor technologies. At its core, PDDRS is engineered to exploit the advanced capabilities of 5G, such as its unprecedented speed and reduced latency, to amplify the efficacy of existing WSNs and LoRa systems. In the field, an array of environmental sensors and high-resolution imaging devices gathers critical data, which is funnelled through LoRa-based modules to a central Master Unit (MU). This unit acts as the nerve center, collating the data before it is propelled to the Cloud Control Unit (CCU) for intricate analysis facilitated by the robust 5G M2M interface. The CCU is the analytical brain of the system, where two specialized ML models process the incoming data: one home in on image-based plant disease markers, while the other scrutinizes environmental parameters to forecast disease presence. The insights extracted from this dual analysis are pivotal as they inform the MU to initiate precise, real-time interventions. For instance, they direct smart sprayers to administer pesticides exactly where needed. This integrated approach augments the precision of disease management and is meticulously designed to dovetail with current farming infrastructures. It offers a pragmatic and economically sensible route towards realizing the next frontier in smart farming, where 5G’s role is not supplementary but rather foundational to the system’s intelligence and responsiveness.
The paper’s structure is outlined as follows: Section 2 delves into the literature survey, Section 3 covers the chosen study location and crop selection, Section 4 introduces the proposed methodology, Section 5 elucidates the data collection model, Section 6 details the experimental analysis, and Section 7 provides the concluding remarks.
Related works
A thorough review exploring the advantages and challenges of IoT technology has been offered, as cited in studies by [13]. [14] created an ontology-based expert system aimed at managing cotton diseases and pests. In this setup, cotton farmers enter their questions, and the system helps. The system has demonstrated that it can address complex inquiries and solve challenging questions. [15] introduced a Recurrent Neural Networks (RNN) system that identifies pests and diseases based on varying weather conditions. The system features a large-scale network with short-term memory capabilities. The predictive outcomes generated by this proposed network are highly accurate, successfully identifying various diseases and pests. [16] introduced an IoT-based framework that employs motion detection sensors for insect identification, followed by automated, drone-targeted spraying as a response. The proposed approach includes the utilization of drones for enhanced field observation, followed by introducing a predictive algorithm based on decision-making theory for a pest detection response system. [17] integrated advanced AIoT technology with DL techniques to apply them in the context of intelligent agriculture. In their work, DL with YOLOv3 was employed for image recognition to pinpoint the locations of Tessaratoma papillosa. Concurrently, environmental data from weather stations was analyzed through LSTM algorithms to forecast pest occurrences.
Numerous studies that offer network solutions for sensor-based environments have been available. For instance, [18] detail the XDK sensor from Bosch. [19] discuss a Zigbee-enabled wireless sensor platform, although its capabilities are constrained by data rate and range. Additionally, [20] outlines a prototype for a wireless sensor device focused on water monitoring. [21] explore wireless sensor platforms that utilize Bluetooth or Wi-Fi for data transmission from sensors. [22] delve into the design of a multi-sensor platform integrated with 5G to adhere to industrial standards. The study elaborates on the processes for developing an industrial-grade sensor platform and provides an in-depth explanation of its technical architecture. [23] discuss how smart farming can enhance agricultural management, highlighting the advantages of employing a 5G mobile network in creating intelligent systems. They emphasize the network’s high data transfer speed (up to 20 Gbps) and capability to connect numerous devices within a square kilometer. The study [24] offers a snapshot of Colombia’s existing 5G technology landscape and cites potential 5G/IoT applications that could be adopted in Colombian agriculture. The findings indicate that deploying 5G technology could pave the way for establishing smart farms in Colombia, thereby enhancing productivity and operational efficiency.
Crop and location selection for the study
For this research, we selected the cotton plant, scientifically known as Gossypium spp., as the focal crop to investigate. Cotton is a significant cash crop with global importance, contributing to the textile industry and providing seed oil and other by-products. Its versatility and economic value make it a compelling subject for agricultural studies. Cotton production in China has indeed seen remarkable growth thanks to the adoption of advanced farming technologies and practices. However, like all agricultural enterprises, cotton production faces challenges related to pests and diseases that can severely hamper crop yields and quality.
Cotton Bollworm (Helicoverpa armigera): One of the most devastating pests, the cotton bollworm can cause extensive damage to cotton bolls, reducing the quality and yield. Aphids: These pests suck the sap from cotton leaves and secrete a sticky substance that can attract other pests and facilitate mold growth. Spider Mites: They attack cotton leaves, leading to a reduction in photosynthetic efficiency and overall yield. Whiteflies: Known to suck juices from the plant, whiteflies also transmit cotton leaf curl disease. Thrips: They cause the leaves to curl and reduce the lint quality.
Verticillium Wilt: Caused by the fungus Verticillium dahliae, this disease affects the vascular system of the plant, causing wilting and death in severe cases. Fusarium Wilt: Another wilting disease that affects cotton is caused by Fusarium oxysporum. Root Rot: Typically caused by fungi like Rhizoctonia solani, this disease can severely impact young cotton plants. Bacterial Blight: Caused by Xanthomonas axonopodis, this disease leads to leaf spots, boll rot, and other severe symptoms. Cotton Leaf Curl Disease: Transmitted by whiteflies, this disease causes the leaves to curl and affects overall plant health. Grey Mildew: Caused by Ramularia areola, this disease leads to discolouration and can impact cotton yields if not managed on time.
Historically, pests like the cotton bollworm (Helicoverpa armigera) have caused significant economic losses, leading to the evolution of pest management strategies. Presently, these pests and diseases continue to challenge farmers, impacting yield and quality and thus affecting the economic stability of the cotton industry. The traditional management practices for these challenges have ranged from chemical pesticides to biological controls. However, the efficacy and environmental impact of these methods vary, highlighting the need for advanced, sustainable solutions.
For this research, we selected Hubei Province, located in central China, which offers a subtropical humid climate that poses both challenges and opportunities for cotton cultivation. The region is characterized by fertile alluvial soils well-suited for various crops, including cotton. However, high humidity levels require vigilant pest and disease management strategies to maintain healthy cotton crops. While Hubei may not be as prominently recognized for cotton production as other regions, it has made strides in modernizing its agricultural practices. The area offers a unique research ground for studying the challenges of cotton farming in less-than-ideal climatic conditions, including the effective management of pests and diseases prevalent in more humid environments.
In Hubei Province, the subtropical humid climate exacerbates the prevalence and impact of these biological threats, making it a critical region for studying and implementing innovative pest and disease management strategies. The unique climatic conditions of Hubei and its evolving agricultural practices provide a pertinent case for applying our proposed 5G-enabled system. This system, tailored to the specific needs and challenges of the region, promises not only to enhance pest and disease management but also to serve as a model for other areas with similar agricultural contexts.
Finally, introducing 5G technology in this context offers transformative potential. Its application in Hubei’s cotton farms could lead to more precise, real-time monitoring and management of these pests and diseases, potentially revolutionizing agricultural practices in the region and setting a benchmark for global cotton production. With the help of advancements in technology and increasing investments in research and development, Hubei is emerging as a key player in exploring sustainable and efficient practices for cotton cultivation. We chose a farmland cultivated with cotton for 3.6 hectares for our experiments.
Proposed methodology
This work’s employed model for detecting plant diseases leverages Mask R-CNN [38], a refined version of the Faster R-CNN object detection model [39]. Mask R-CNN enhances the capabilities of Faster R-CNN by adding a third branch for predicting pixel-level masks, complementing the existing branches for object classification and bounding box adjustments. The framework proves particularly beneficial for this application for two main reasons. First, it utilizes a Region Proposal Network (RPN) to scrutinize the input image and identify potential regions containing plant diseases. Second, it enhances these identified regions by conducting disease classification, adjusting bounding boxes, and, notably, generating pixel-level masks that accurately define the diseased portions of the plant.
The Mask R-CNN framework consists of multiple essential elements: a backbone network, an RPN, a module for object classification, another for bounding box refinement, and a mask segmentation module, as depicted in Fig. 1. The backbone network is fundamentally a standard CNN, processes the input image to produce a feature map. This feature map is pivotal, particularly in isolating areas of the plant that may be afflicted with disease. Subsequently, the RPN examines the generated feature map to identify potential areas, referred to as “anchor boxes,” that could encompass diseased plant sections. The anchor boxes are generated in many sizes and aspect ratios, each receiving a confidence score. A high score suggests that the anchor box will enclose a diseased plant segment. The RPN subsequently fine-tunes these anchor boxes for a more accurate delineation of the plant’s affected areas.
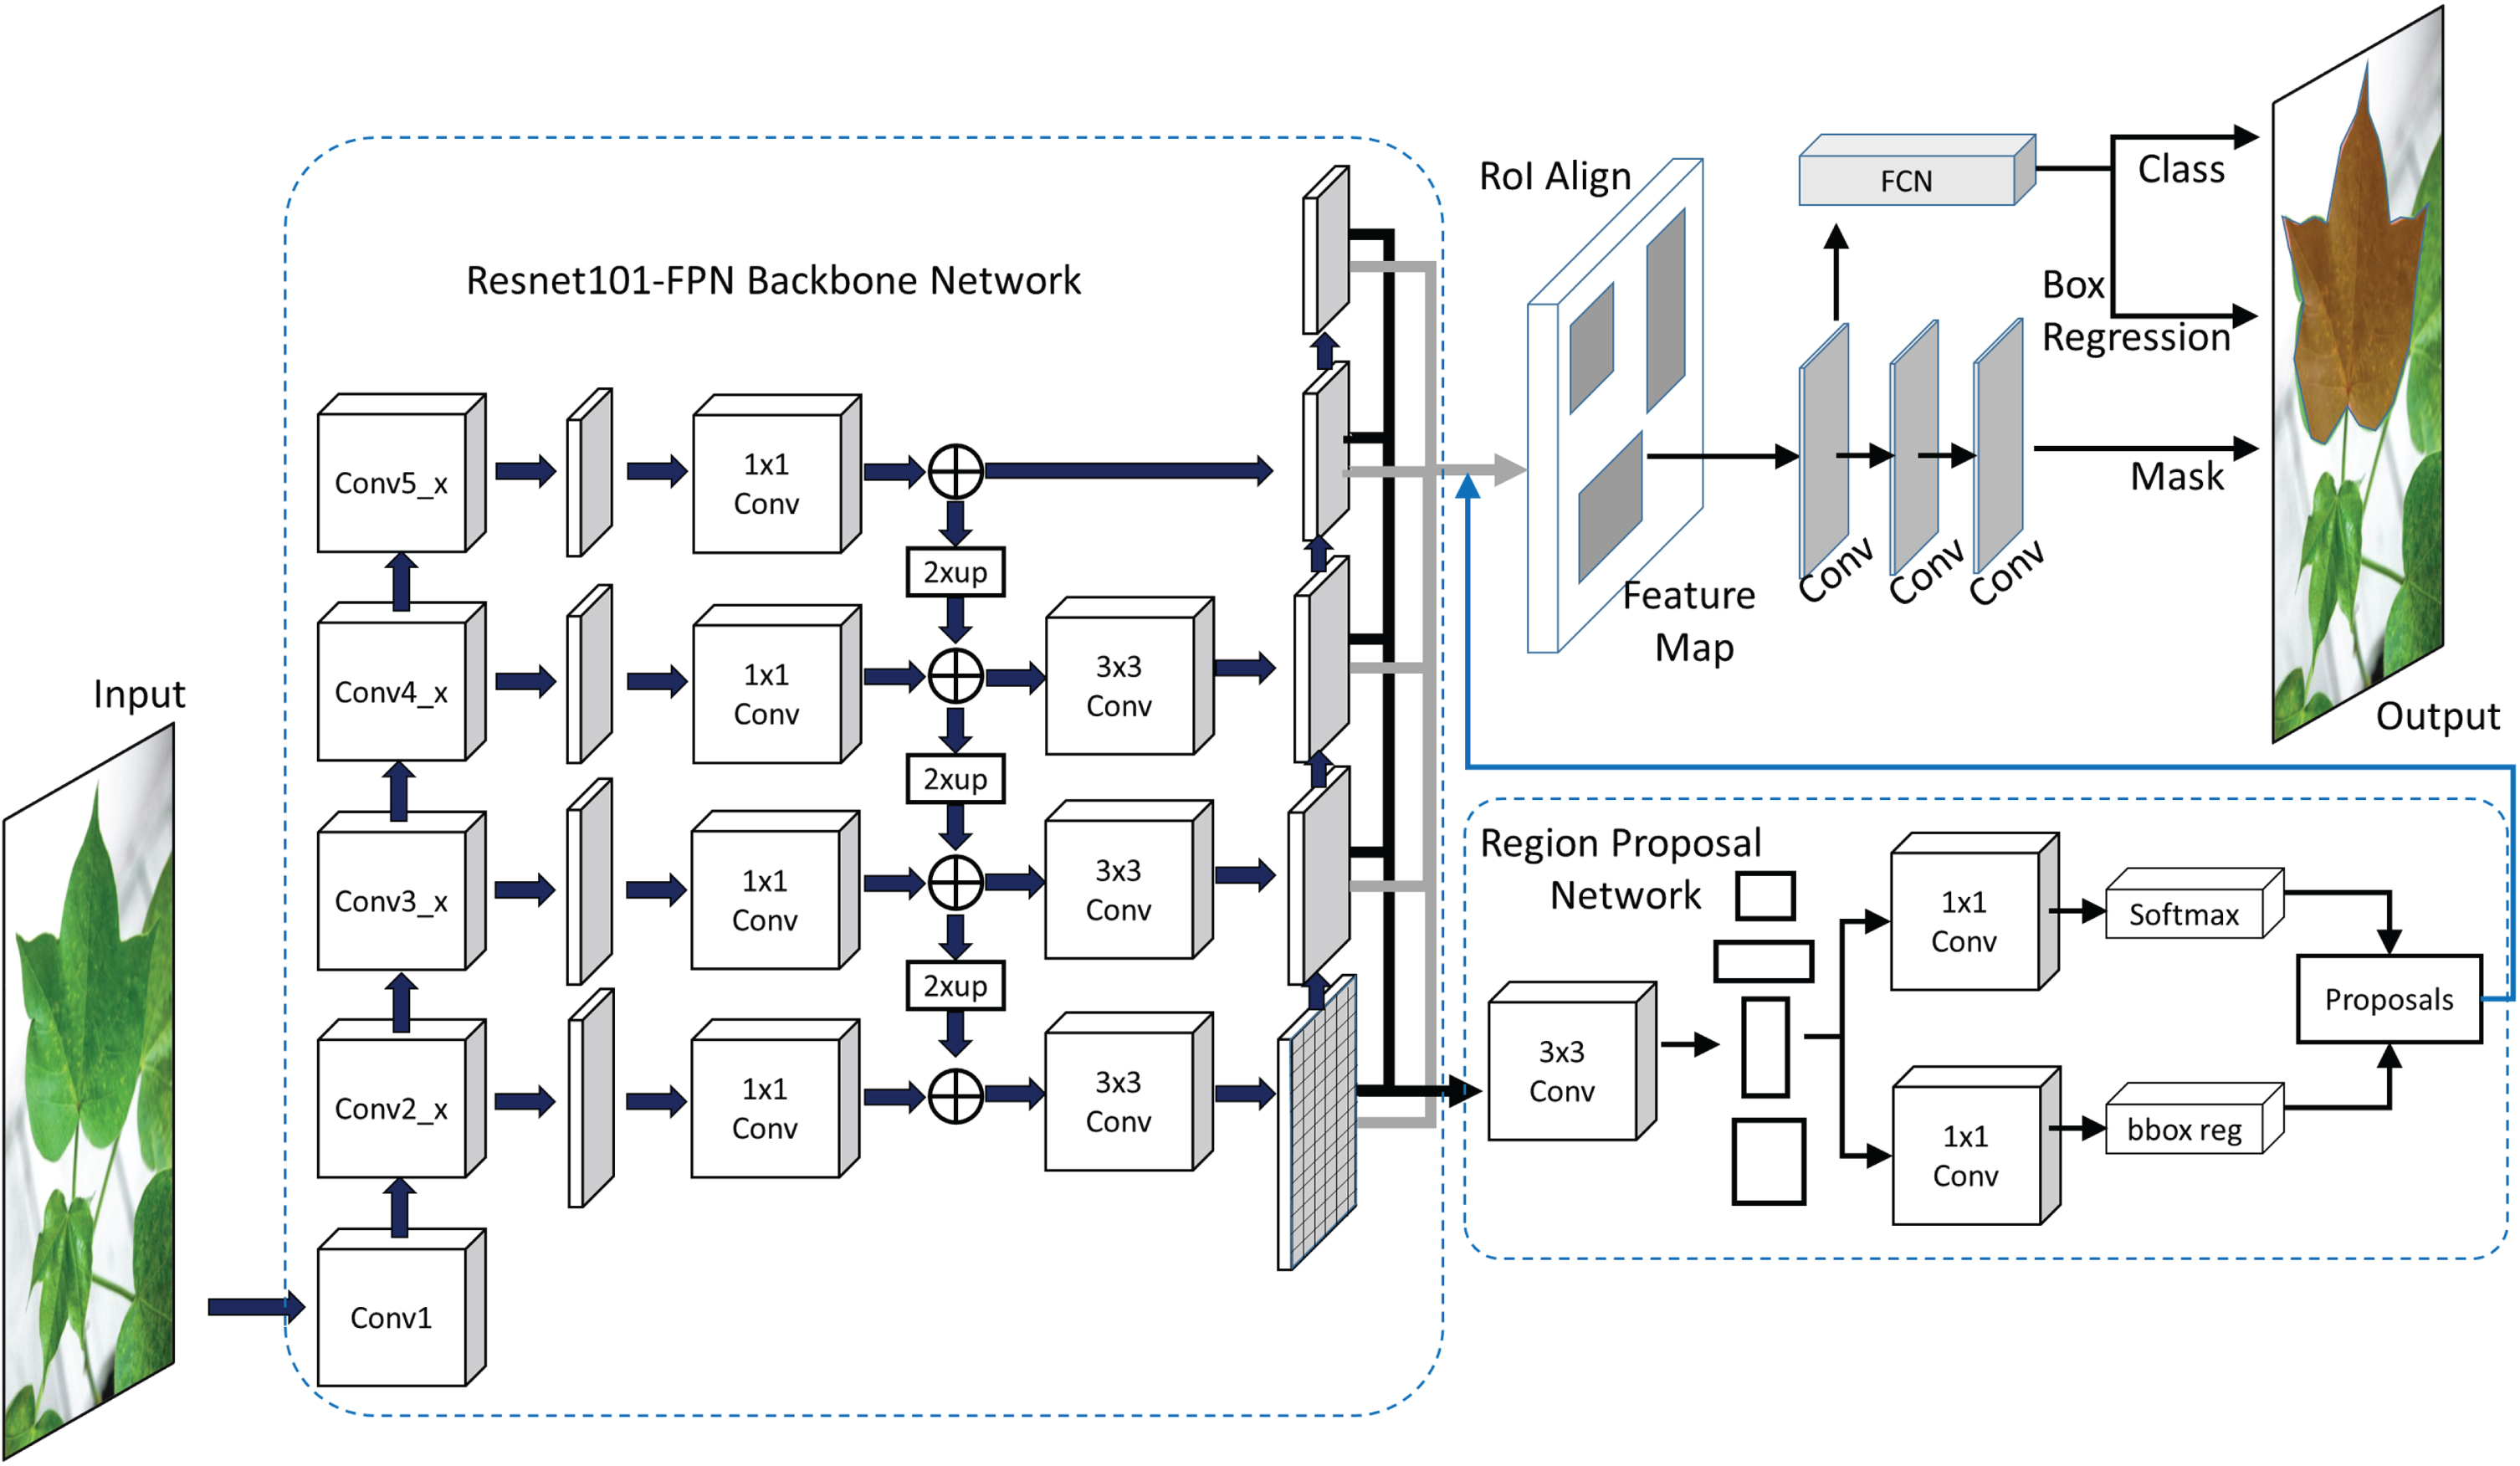
Mask R-CNN with FPN backbone Architecture.
The anchor box acts as an initial screening mechanism to pinpoint regions that may suggest the presence of disease. Once these regions are identified, two subsequent modules come into play: the object classification module and the bounding box adjustment module. Unlike the RPN’s primary division of areas into foreground or background, the object classification module uses a more nuanced classification system. It categorizes regions into n + 1 classes, where ‘n’ represents the number of distinct classes and the additional ‘1’ accounts for the background class. An essential element in the Mask R-CNN framework is the mask segmentation module. Although it bears functional resemblances to the bounding box refinement performed by the RPN, this module adds a heightened degree of accuracy. This enhanced precision is invaluable for precisely outlining diseased areas of the plant, which frequently display irregular geometric characteristics. As a result, the areas identified as ‘foreground’ by the object classification module undergo further segmentation via detailed masking. This added level of specificity proves crucial for the application in question, facilitating the accurate isolation and classification of the plant tissue’s diseased regions.
Although the approach follows the Mask R-CNN framework as detailed in the original work, modifications have been made to the backbone network to align it with the goals of PDD. In particular, a Feature Pyramid Network (FPN) is employed. The FPN is structured to include a bottom-up pathway for initial Feature Extraction (FE) from raw images of plants, a top-down pathway to create feature maps of compatible sizes, and lateral connections that combine the feature maps generated from both pathways. The advantage of employing FPN in PDD stems from its capacity to preserve robust semantic features across multiple resolutions. This characteristic is vital for pinpointing diseased regions, which can differ in size and texture. An FPN built on the ResNet-101 architecture is used in this model, with RPN weights that have been pre-trained on the ImageNet dataset. The chosen anchor box scales and aspect ratios are remarkably fine-tuned to accommodate the wide range of variability often observed in symptoms of plant diseases. This setup has demonstrated its efficacy by notably enhancing the detection rates for more minor but crucial diseased zones. It enables the accurate identification and framing of these specific areas within the complete image of the plant.
The architecture of the model is presented in Fig. 1, and the following algorithm 1 shows the detailed steps involved in the proposed Mask R-CNN with the FPN Learning model:
Algorithm 1: PDD using Mask R-CNN with FPN backbone
Input:
The image depicts a potentially diseased plant. Pre-trained models with weights for ResNet-FPN and RPN.
Output:
Bounded boxes and pixel-level masks identify diseased areas in the original plant image. Disease classification labels for each identified diseased area.
Step 1: Initialization
Load pre-trained ResNet-FPN based on ResNet-101 architecture. Load pre-trained RPN weights
Step 2: Preprocessing: Read the input plant image from the source.
Step 3: Feature Extraction (Backbone Network): Pass the input image through the ResNet-FPN to obtain a feature map.
Step 4: Region Proposal (RPN)
Use the RPN to scan the feature map. Generate candidate regions, known as “anchor boxes.” Anchor boxes should come in predefined scales (64×64, 128×128, 256×256, 512×512) and aspect ratios (1:2, 1:1, 2:1). Assign confidence scores to each anchor box.
Step 5: Anchor Box Refinement: Apply confidence scores to anchor boxes to improve fit around diseased areas.
Step 6: Object Classification
Pass the refined anchor boxes through the object classification module. Classify each box into ‘n + 1’ categories, where ‘n’ is the number of disease types and ‘1’ is for the background.
Step 7: Bounding Box Adjustment: The bounding boxes should be classified and resized to fit around diseased plant areas.
Step 8: Mask Segmentation
The mask segmentation module generates A pixel-level mask for each disease bounding box. This mask should precisely outline the diseased areas within the bounding box.
Step 9: Post-processing: Collect the identified diseased areas and their classifications and pixel-level masks.
Step 10: Output
Return or display the original image with annotated bounding boxes and pixel-level masks. Include disease classification labels for each identified diseased area.
To address the complexity and variability in PDD, we introduce a novel hybrid DL model that seamlessly integrates Feedforward Neural Networks (FFNN) and LSTM networks. This architecture leverages environmental data and temporal patterns to offer a nuanced, context-rich model beyond mere symptomatic analysis to provide highly accurate PDD. The initial layer of the model is an input layer designed to intake a comprehensive set of environmental parameters, including but not limited to Max/Min Temperature, Max/Min Humidity, and Relative Air Moisture (RA). In addition, the model ingests temporal sequences of historical environmental variables to identify long-term trends or seasonality that might influence disease onset and progression. In the described architecture, two neural networks work in tandem to analyze real-time and historical environmental data on PDD and their severity. The FFNN is the primary processing stage for incoming real-time ecological data. The FFNN is precisely engineered with a topology with three hidden layers containing 256, 128, and 64 neurons, respectively. This architecture is chosen to capture complex spatial and environmental variances. The Rectified Linear Unit (ReLU) is employed as the activation function, adding the element of non-linearity, which enables the network to learn intricate patterns in the data effectively. After processing, the FFNN outputs a 128-dimensional feature vector that encapsulates critical spatial and environmental information, capturing variances and dependencies among different variables.
Concurrently, historical or temporal environmental data is processed through an LSTM network. The LSTM comprises two layers, each containing 64 units, designed to capture complex temporal patterns over sequences of historical data. It is particularly effective at learning long-term dependencies, essential for understanding the intricate relationships embedded in environmental factors over time. The LSTM network generates a 64-dimensional feature vector encapsulating these known temporal sequences. After processing through their respective networks, the feature vectors generated by both the FFNN and LSTM are concatenated, forming a unified 192-dimensional feature vector. This combined feature vector is passed through a Fully Connected (FC) layer of 64 neurons. The SoftMax activation function converts the neural network outputs into a probability distribution. This distribution represents the likelihood of various PDDs occurring and indicates their potential severity. The Adam optimizer is employed for optimizing the weights in the neural network and is renowned for its efficiency in handling large datasets and high-dimensional spaces.
The architecture of the FFNN + LSTM model is presented in Fig. 2, and the following algorithm 2 gives the detailed steps involved in the proposed FFNN + LSTM Learning model:

FFNN + LSTM Learning model.
Algorithm 2 for Hybrid DL Model for PDD
Input:
Dataset D of sensor detected environmental parameters. Historical dataset D
h
Training labels Y
Output: Probability distribution P over possible PDD
Data Preparation: Normalize and standardize D and D h
Split D, D h , and Y into training and testing sets
Initialize Networks
Initialize FFNN Initialize LSTM network
Configure FFNN
Add hidden layer H1 with 256 neurons, activation: ReLU Add hidden layer H2 with 128 neurons, activation: ReLU Add hidden layer H3 with 64 neurons, activation: ReLU
Configure LSTM
Add LSTM layer L1 with 64 units, return sequences = True Add LSTM layer L2 with 64 units
Feature Extraction
Compute feature vector V
f
using FFNN Compute feature vector V
l
using LSTM Concatenation Concatenate V
f
and V
l
to form the hybrid feature vector V
h
FC Layer: Add a fully connected layer with 64 neurons. Apply SoftMax activation to output P
Model Compilation and Training: Use loss function categorical cross-entropy. Use Adam optimizer. Train the model backpropagation.
Evaluation: Evaluate model performance on the testing set.
The architecture for the 5G-enabled PDDRS is outlined in Fig. 3. This integrated system consists of an Onsite Monitoring and Data Collection Unit (OMCU), MU, and CCU. The OMCU is the frontline data collection unit with field sensors and cameras. It employs a LoRa interface component to facilitate communication with these sensors and channels the collected data to the MU via LoRaWAN. The MU is the central hub and contains two critical sub-units: the Gateway Unit (GU) and the Response Unit (RU). The GU is responsible for transmitting the aggregated data to the CCU in the cloud, which employs the learning models and analyzes the data. At the same time, the RU receives analytical insights from the CCU. The MU is equipped with both LoRa transceivers for interfacing with the OMCU and a 5G module to enable advanced features via M2M communication. Data from the CCU is sent to the MU’s RU, which alerts farmers and guides innovative pesticide sprayers to treatment sites. The 5G-compatible architecture integrates with 4G and lower-tier communication models. Current infrastructure should be adapted to avoid higher costs in dealing with the agricultural economy.

Proposed PDDRS Architecture.
In collaboration with local farmers, a test bed was established on the selected farm site, covering an area of 1.2 hectares (130,120 square feet). This area was divided into 24 equal-sized grids, each measuring 72×75 feet (about 5,400 square feet).
Each grid is designated by coordinates such as (a,1),(a,2),..(a6),(b,1),(b,2), . . . (b,5),...(d,1),(d,2),..(d5)
OMCUs are installed in each grid, along with a pole-mounted 360° camera, as depicted in Fig. 4. The cameras capture high-resolution images of plants and their leaves and transmit these images to the MU using built-in Wi-Fi. The OMCUs comprise a sensor network that measures various environmental parameters, including temperature, humidity, moisture, and soil conditions. These sensors are strategically placed within each grid and send data in real-time through a wireless network. The data gathered by these sensor modules is then aggregated and sent to a cloud database through a MU for subsequent analysis and calculations. The architecture of OMCU is shown in Fig. 5.
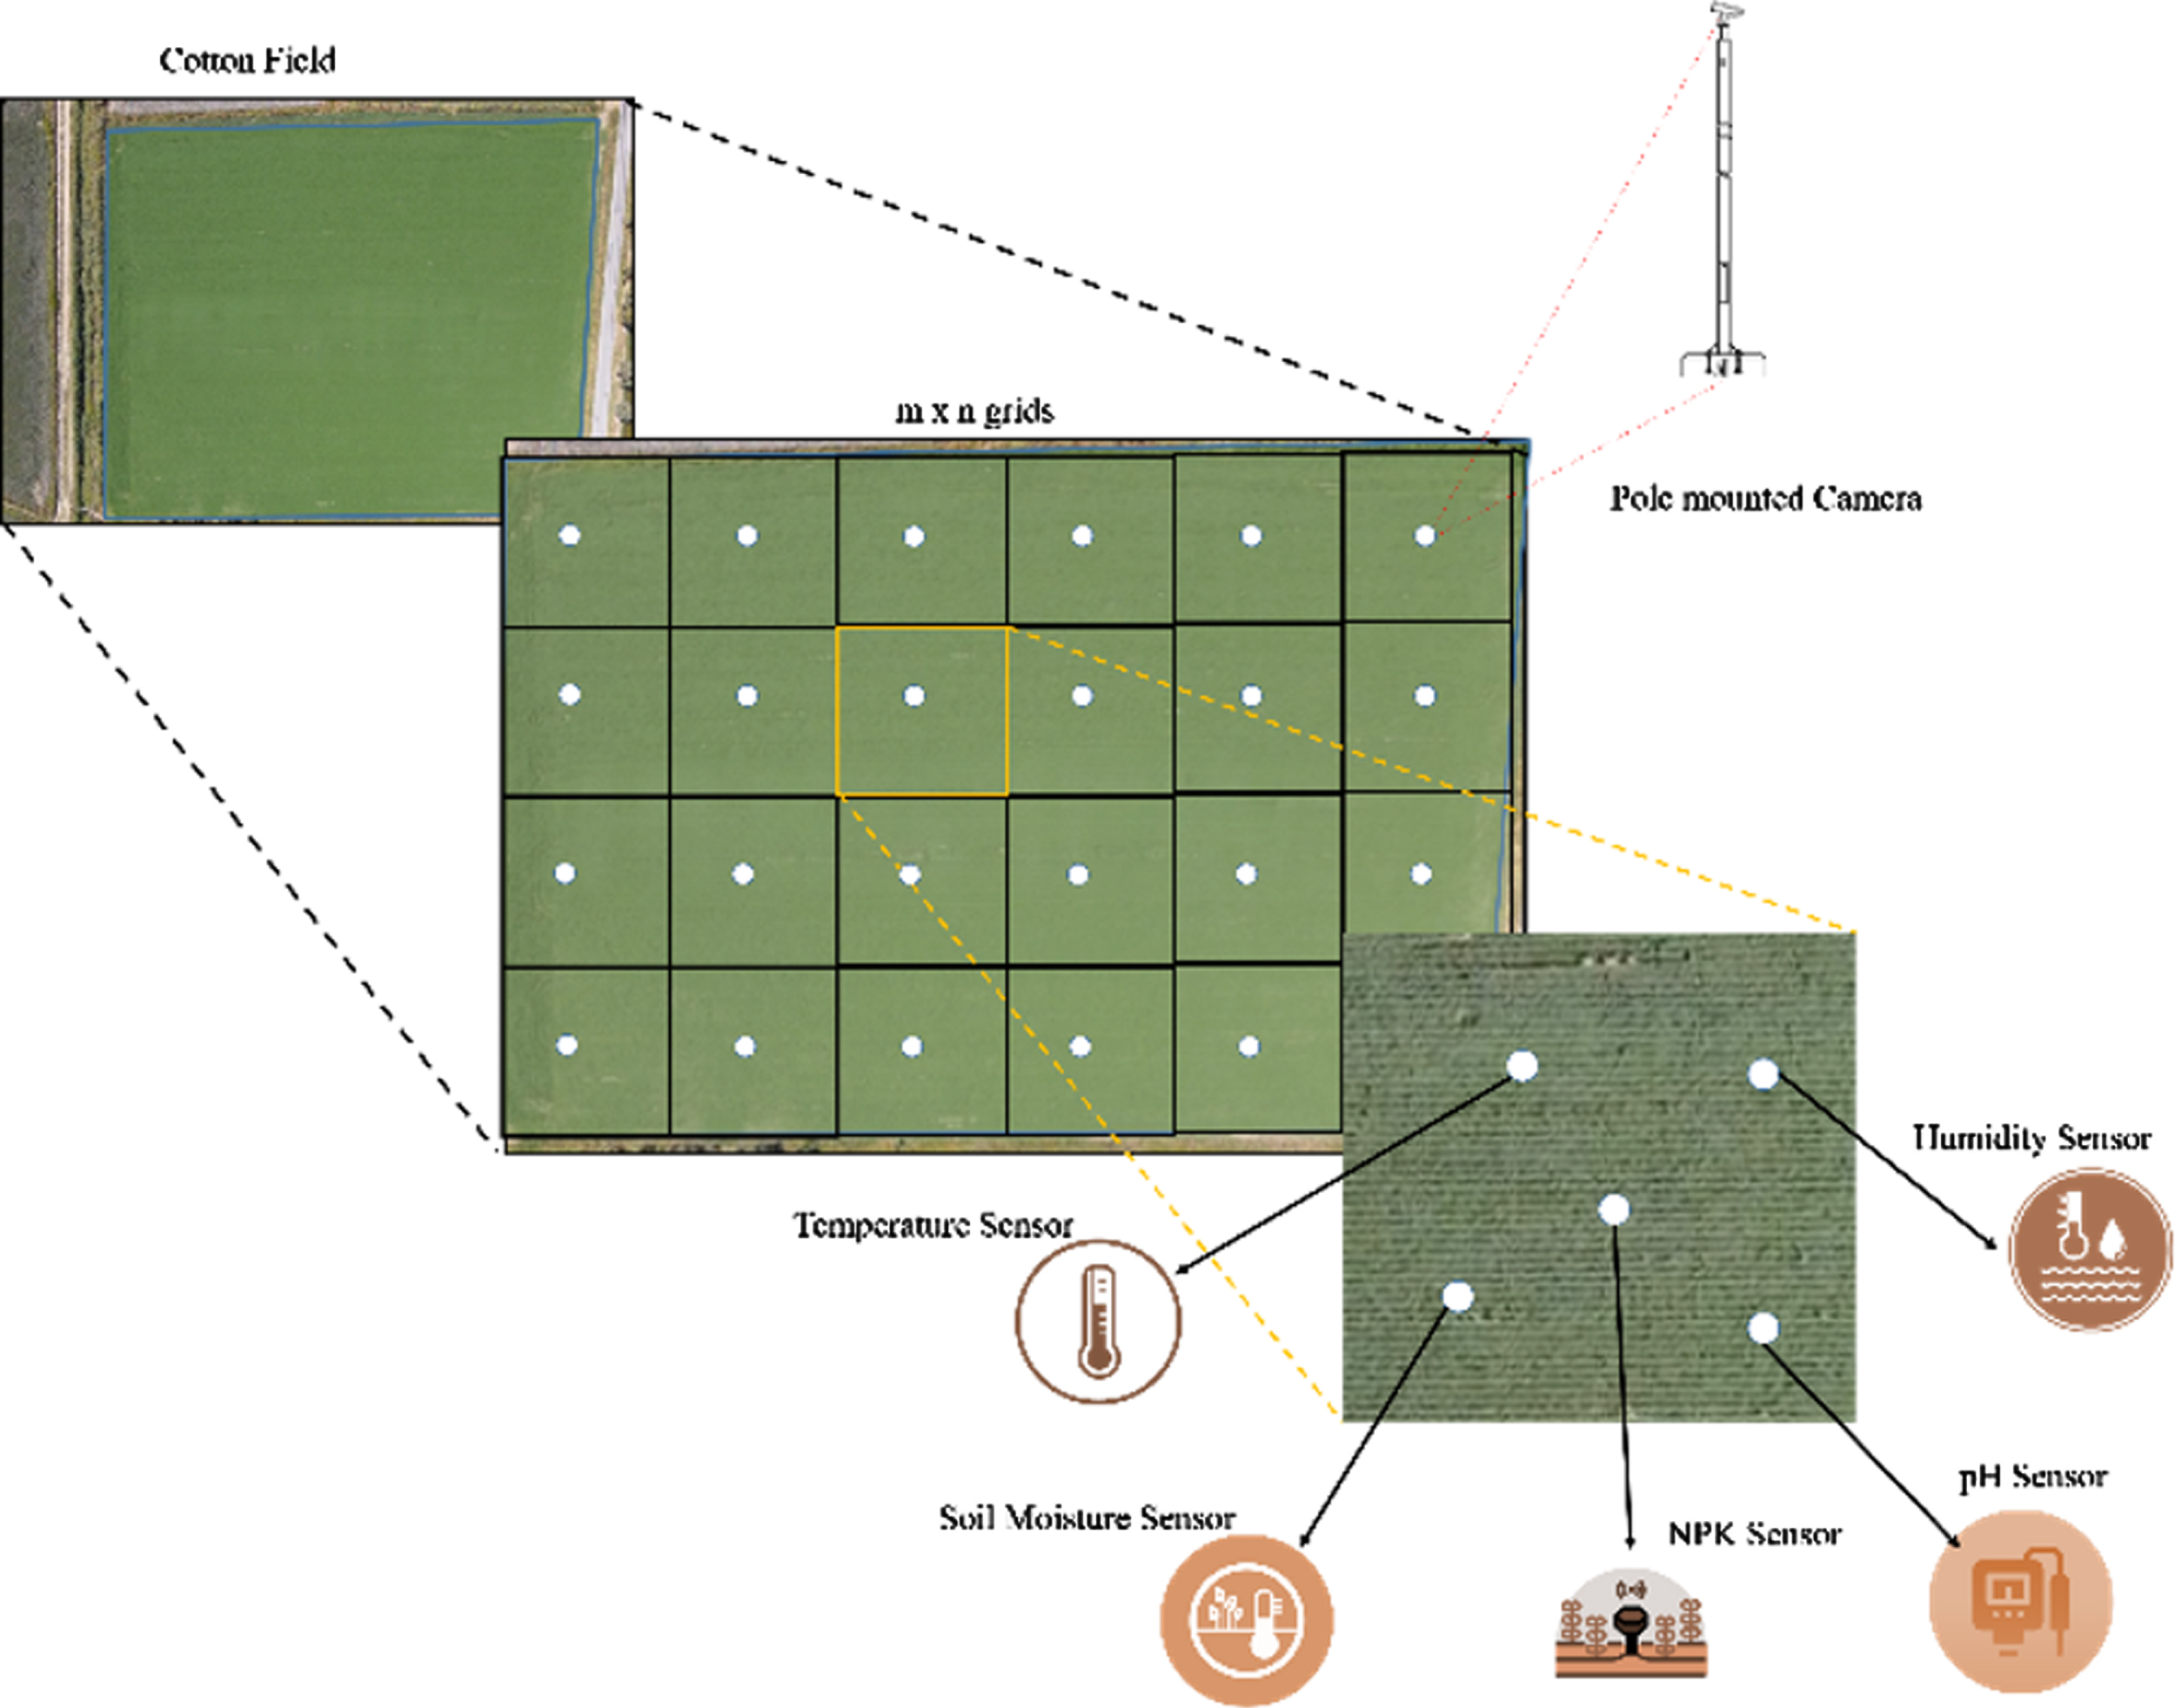
OMCU and camera deployment in the field.

STM32L412KBU6 microprocessor-powered OMCU.
The OMCUs consist of a STM32L412KBU6 microprocessor, various monitoring sensors (including a DSB18B20 temperature sensor, an HR202 humidity sensor, a JXCT soil sensor, a Sen0161 pH sensor, and an I2C soil moisture sensor), and a LoRa transmission module. The STM32L412KBU6 microprocessor processes the data collected by each sensor node and transmits it to the gateway node via the LoRa module.
The OMCU employs the STM32 microcontroller series from STMicroelectronics for sensor data collection in the field. The STM32L412KBU6 model, part of the STM32 L4 series, was selected for its exceptional ultra-low power capabilities. This unit features an ARM Cortex-M4 core that operates at a maximum CPU frequency of 80 MHz and has a voltage supply range of 1.65 V to 3.6 V, making it adaptable to various power sources. It provides 256 KB of Flash memory and 64 KB of SRAM, ensuring robust data storage and processing capabilities. The microcontroller also has a comprehensive set of peripherals such as GPIO, UART, and SPI, enabling precise data collection and easy integration into the existing sensor network. Additional features like a Real-Time Clock (RTC) for accurate timekeeping and a True Random Number Generator (TRNG) for enhanced security make the STM32L412KBU6 a principal component.
The OMCU further integrated the SX1280/1 transceiver from the LoRA family to enhance connectivity and communication capabilities. Operating within the 2.4 GHz band, these transceivers offer extended-range communication that is robust and resistant to interference, a critical factor in agricultural environments. These transceivers provide multiple physical layers and modulations optimized for long-range communication, particularly suitable for transmitting data from remote field sensors to our central processing unit, which features the STM32L412KBU6 microcontroller. This integration enables the transmission of data over long distances, which is crucial for monitoring and responding to plant health conditions in expansive agricultural areas.
The MU consists of two critical components: the GU and RU. The GU is the data aggregator, pulling information from multiple OMCUs and relaying it to the cloud. Equipped with an STM32L071RBT6 microprocessor, a LoRa communication module, and an embedded ST4SIM-201 SIM card, the GU is designed for robust, secure, and efficient data transmission. This Gateway node not only uploads environmental data to the CCU in real-time but also facilitates data analysis and retrieval. Upon receiving the analytical outputs from the CCU, the GU directs this information to the Response Unit (RU). The RU, in turn, activates the boom sprayers based on the received coordinates, guiding them to the specified grid locations for targeted pesticide application. This tightly integrated system ensures that pest control measures are both precise and data-driven.
The connection between the 5G module and the gateway is established through an external interface, requiring specific design considerations for waterproof connections suitable for field deployments. Accurate time synchronization is paramount for the proposed architecture, as the ultimate goal is to aggregate real-time data within the field. Due to the ongoing development of 5G synchronization features during the project timeline, the ST4SIM-201 embedded SIM (eSIM) for M2M communication was chosen. This embedded SIM conforms to the most recent standards for accessing 5G networks and ensuring M2M security. Additionally, it provides versatile features for remote provisioning and management. The ST4SIM-201 fully complies with ETSI/3GPP release 16, providing versatile connectivity options. It can connect with 5G standalone (SA) networks and 3G and 4G networks. Furthermore, it exhibits compatibility with Low-Power Wide-Area (LPWA) technologies like Long-Term Evolution for Machines (LTE-M) and Narrowband Internet of Things (NB-IoT).
The CCU within the Cloud Service Provider (CSP) receives sensor data and images from the MU. This data is then assessed through two pipelines (Fig. 6). The first pipeline utilizes the MaskRCNN with the FPN learning model to classify diseases. It does so by analyzing images obtained from pole-mounted cameras. Meanwhile, the second pipeline employs our proposed FFNN + LSTM classification model to detect pests and diseases. This is accomplished by processing the data gathered from field sensors. The results of these analyses are subsequently relayed back to the primary unit, aiding in determining the necessary response. Additionally, these details are conducted on the user app. Upon reception of the analysis, the primary unit offers guidance to the boom sprayer, directing it to the precise location within the grid where pesticide application is required.
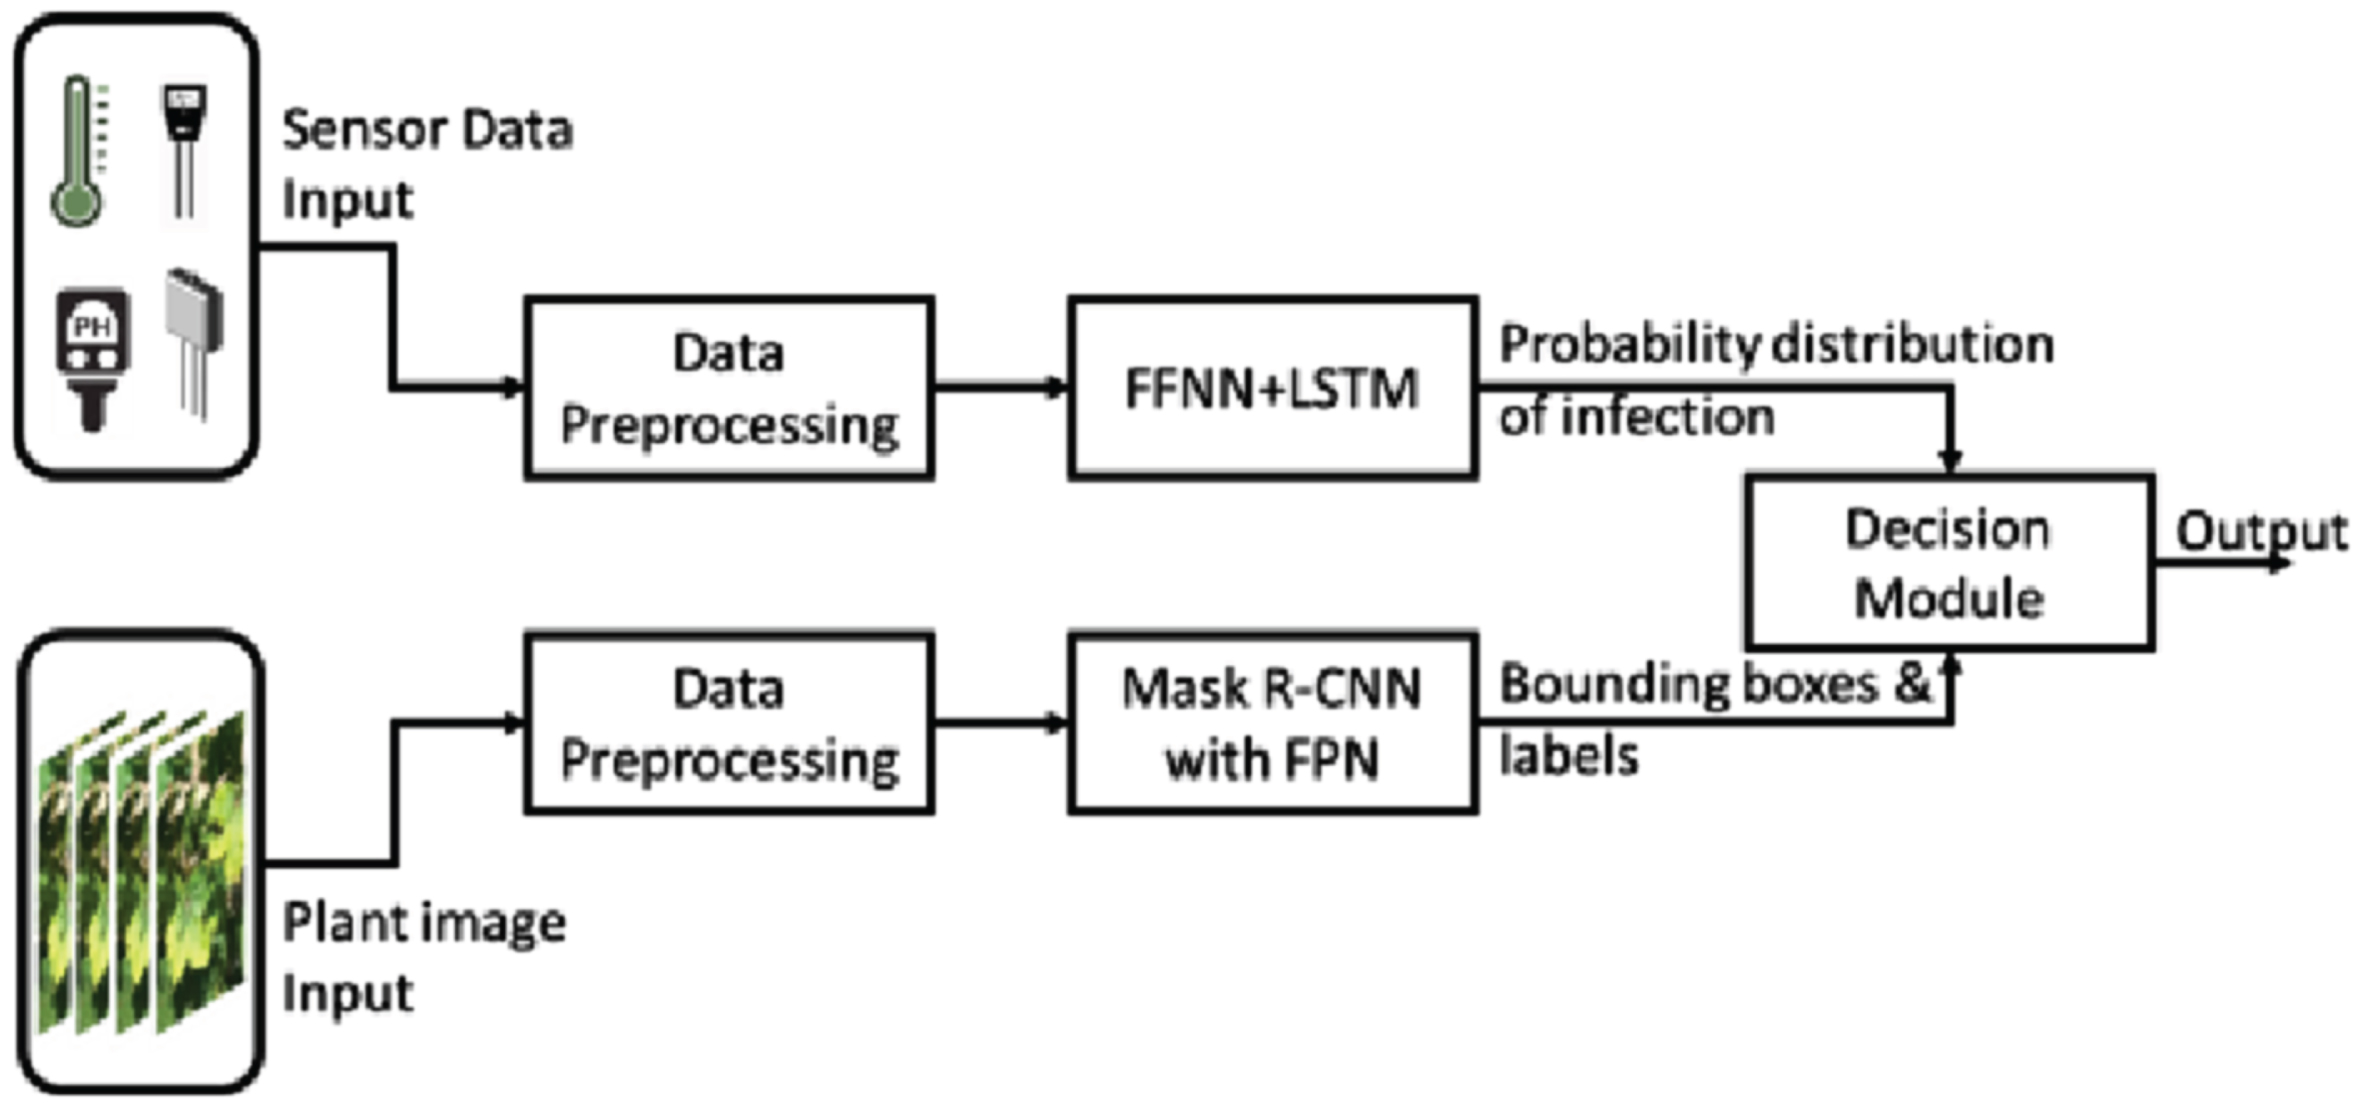
CCU System Flow diagram.
Plant disease image dataset (PDID)
For this research, two devices were employed to capture images of cotton leaves: a smartphone and a digital camera. The image collection process occurred in the field between June and August 2022. The researcher employed purposive, also known as judgmental, sampling techniques for this investigation. This involved deliberately selecting four infected and one healthy sample from the population, using a non-probabilistic approach. During the data collection phase, a total of 3088 images were captured. These images were then categorized into five distinct classes: Verticillium dahliae, Fusarium wilt, Curl virus, Bacterial blight, and Healthy. The images were distributed among these classes to create a balanced dataset for training purposes. Table 1 displays the images of each class:
Images of cotton leaves corresponding to each class
Images of cotton leaves corresponding to each class
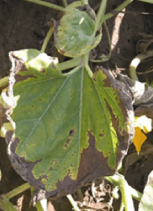


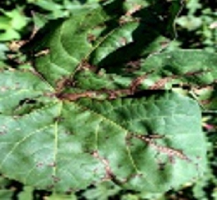
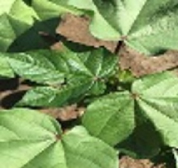
Table 2 shows the initial distribution of cotton leaf images across various disease classes and healthy leaves, revealing a significant class imbalance: 78 images of Verticillium dahliae, 89 of Fusarium wilt, 236 of Curl virus, 645 of bacterial blight, and 1126 of healthy leaves. To address this, several preprocessing steps were employed. Any corrupt or incomplete images were initially purged, and metadata was verified for consistency. All images were then resized to a standard dimension of 32×32 and normalized to a pixel range of [0, 1]. The class imbalance was statistically analyzed before implementing image augmentation techniques such as rotation, random color adjustments, and horizontal flipping. These techniques were applied more intensively to minority classes like Verticillium dahliae, Fusarium wilt, and Curl virus. Post-augmentation, as illustrated in Table 3, the dataset was shuffled and split into a 70 : 30 ratio for training and test sets using stratified sampling. The resulting allocation consisted of 207 training and 89 testing images for Verticillium dahliae, 218 training and 93 testing for Fusarium wilt, 305 training and 131 testing for Curl virus, 452 training and 194 testing for bacterial blight, and 788 training and 338 testing for healthy leaves.
Sampled dataset description
Sampled dataset description
Augmented PDID dataset
A total of six sets of environmental sensor information were gathered, spanning June to August 2022. Data was retrieved from every environmental sensor module at intervals of one hour. Four data sets containing real-time ecological factors, including temperature (maximum and minimum), humidity levels in the morning and evening, and soil moisture, are collected from the field sensors. Further, rainfall and wind speed have been sourced from the China Meteorological Data Service Center. The collected dataset contained a total of 2,960 sets of environmental data. Various variables influence the correlation between cotton pests and environmental factors, though the intricate interconnections among these elements add complexity. The construction of the training dataset involved utilizing cotton pest datasets from the Crop-Pest-Disease-Weather Database. The datasets show ten insect pests and their weekly environmental conditions on cotton plants. Time series help predict pests and diseases.
Let us assume that X represents the collection of environment feature records as a vector set, while Y signifies the presence of disease or pests in the plant. Given the feature vectors
Interval range for each environmental factor
Applying the generated rules, a comprehensive classification of four categories of cotton pests and a “no pest” class is established for the PDEFD dataset. The specifics of these classifications are outlined in Table 5.
PDEFD dataset description
This study sought to assess the effectiveness of two proposed learning models. These tests were run on a computing setup powered by a 64-bit Intel® Core™ i7 processor with a clock speed of 2.30 GHz with 12 GB of RAM. The experiments were conducted on a Windows 10 operating system. Using Python 3.8 as the programming language and employed a range of libraries and frameworks, including TensorFlow 2.4, sci-kit-learn 0.24, NumPy 1.19, and pandas 1.2. The learning models Mask RCNN with FPN and FFNN + LSTM models are trained using the hyperparameters shown in Table 6 and Table 7, respectively.
RCNN + FPN Mask learning model hyperparameters
RCNN + FPN Mask learning model hyperparameters
Hyperparameters for the FFPN + LSTM learning model
This study initialized the weights of the ResNet-FPN backbone using He normal initialization, which is optimal for ReLU-activated layers, to preserve activation and gradient variance during initial training phases. The RPN and Mask R-CNN layers benefited from ImageNet pre-trained weights, harnessing transfer learning to bolster generalization and expedite convergence. Our optimization leveraged the Adam optimizer for its adaptive learning rate advantages, initiating with a learning rate of 0.001, subject to a decay by an order of magnitude every 30 epochs to refine weight adjustments as training advanced. We incorporated a weight decay of 0.0001 to regularize and forestall overfitting. Categorical cross-entropy was the loss function for classification and mask prediction, fitting this work task’s multi-class nature. The training was conducted over 100 epochs with a batch size of 16, a choice informed by computational efficiency and gradient stability. To further counteract overfitting, we applied dropout within the fully connected layers and enriched the training data variability through augmentation.
The confusion matrix of the proposed model is displayed in Fig. 7. It indicates the distribution of predicted labels versus the true labels for a classification model that has five classes: ‘Verticillium dahliae’, ‘Fusarium wilt’, ‘Curl Virus’, ‘bacterial blight’, and ‘Healthy’. Each cell in the matrix shows the number of observations predicted for a given class compared to the true class, with the diagonal cells indicating correct predictions (True Positives (TP) for each class).
Confusion matrix.
Due to the initial class imbalance in the image dataset, specialized performance metrics like Accuracy (%), F1-score, Precision, and Recall were selected over simple accuracy metrics. Two baseline models, VGG-16 and ResNet-152, were used to compare the performance of the object detection model. The prediction loss and accuracy are shown in Fig. 8. The Mask RCNN + FPN model consistently achieves the lowest and most stable loss values across 100 epochs, making PDD based on leaf images practical. The performance of three ML models for accuracy was tracked over 100 epochs. VGG-16 started at 52.48% accuracy, improving to a peak of 90.49%. ResNet-152 began at 63.55% and peaked at 95.98%, though it showed some instability. Mask RCNN + FPN had the highest peak accuracy of 97.23%. Among the three, Mask RCNN + FPN demonstrated the most consistent and highest performance over time.

Prediction loss and accuracy comparison.
In evaluating the performance of the proposed ML model, Mask RCNN + FPN, it stands out as a strong performer across various key metrics, as shown in Table 8. The model achieves an accuracy of 95.1%, indicating its high overall reliability in correctly classifying objects. Additionally, it scores an F1-score of 93.2%, further underlining its balanced performance in precision and recall. Its precision score is 91.1%, suggesting that the model minimizes false positives. The recall is lower at 85.7%, indicating room for improvement in reducing False Negatives (FN). Overall, the Mask RCNN + FPN model offers a robust and balanced performance, making it a strong choice for applications requiring high accuracy and reliability.
Performance comparison of different models
In evaluating the various ML models designed for predicting plant pests using the PDEFD dataset, our proposed model, FFNN + LSTM, demonstrates superior performance across all key evaluation metrics, as shown in Fig. 9. The model achieves an accuracy (ACC) of 90.36%, significantly outperforming the other models, such as LSTM at 83.93%, KNN at 81.35%, Random Forest at 84.23%, and SVM at 74.85%. This high accuracy indicates that FFNN + LSTM is reliable in making correct predictions. The model also scores an AUC (Area under Curve) of 0.894, which is much higher than the AUC scores of the other models. A higher AUC suggests that the model can distinguish between the presence and absence of pests. Lastly, FFNN + LSTM obtains an F1-score of 0.7812, further indicating its balanced performance in terms of precision and recall, whereas the closest competitor, Random Forest, only has an F1-score of 0.6861. Overall, the FFNN + LSTM model is highly effective and reliable, making it an excellent choice for predicting pests in plants using environmental factors as inputs.

FFNN + LSTM performance for different metrics against different models.
This paper employs Network Simulator and Emulator (NetSim) to conduct simulations for evaluating the network architecture’s performance. NetSim is a leading industry tool, particularly for its 5G NR technology capabilities. It has gained widespread recognition from over 400 reputable organizations. To our understanding, NetSim ranks among the top tools for assessing communication technology performance across various related metrics. Additionally, it supports event-level debugging for inspecting different facets during discrete event simulations. NetSim offers comprehensive support for hardware and software control within the simulation environment. In our simulation, we have utilized NetSim to implement the 5G NR architecture, incorporating components like UE, gNB, ng-eNB, NG, and Xn, which are readily available within the NetSim framework. Beyond these functionalities, NetSim grants industry professionals and researchers access to the physical, data link, and network layers, making it a versatile environment for experimental purposes.
Throughput quantifies the overall volume of data transferred between a source and a destination within a specified time limit. In this evaluation, we adopt the throughput formula defined for 5G NR by 3GPP technical specification 38.306 to determine the maximum achievable throughput. This formulation can be articulated as follows:
Where,
j: count of aggregated carrier components,
f(j): scaling factor
OH(j): overhead
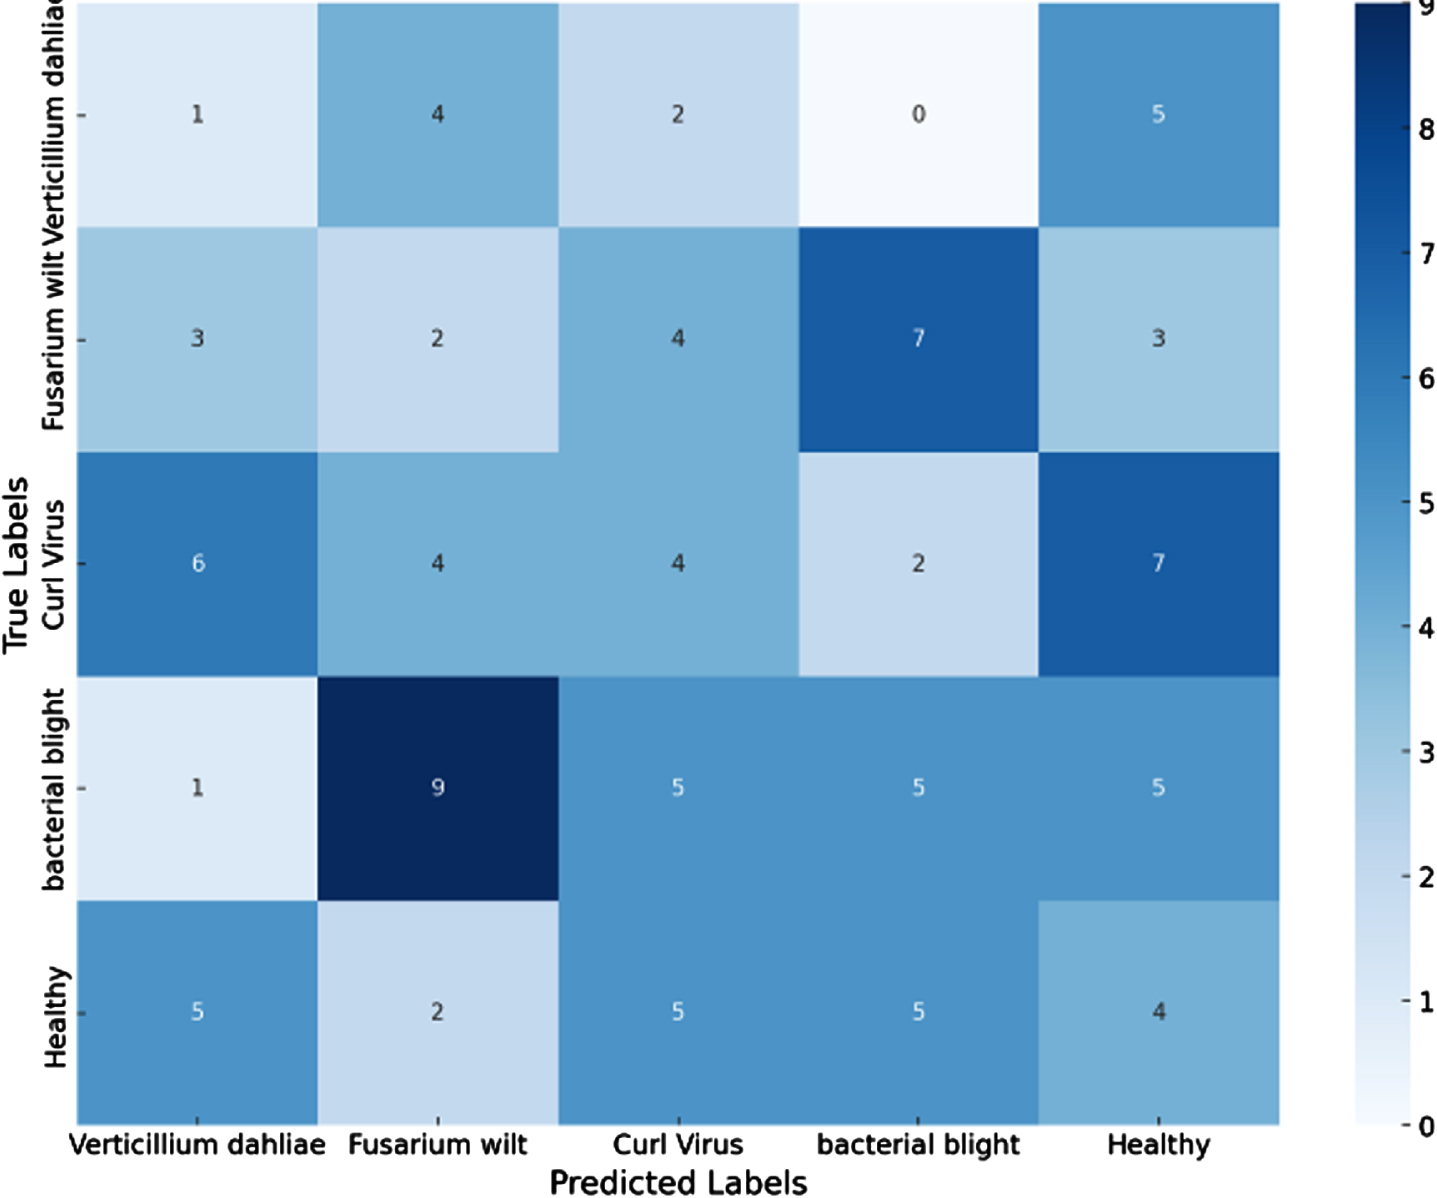
Within 5G NR, two distinct frequency ranges are accessible: 4800–4990 MHz, termed the Low-Frequency Range (LFR), and 37–43.5 GHz, known as the High-Frequency Range (HFR). A grid environment spanning 1000 meters was configured to elucidate this disparity to enable communication between a gNB and a UE. In order to furnish real-time outcomes, the decision was made to depict the throughput graph against the Signal-to-Noise Ratio (SNR), as shown in Fig. 10. This parameter is influenced by various network factors, including path loss and received power. Across various SNRs, the LFR displayed a robust and consistently improving throughput, reaching a peak at 4221.131926 units at 20 dB SNR. This starkly contrasts the HFR, which showed improvement with higher SNRs but only reached a maximum throughput of 456.3312258 units at 20 dB. Especially at lower SNRs, the HFR’s throughput was significantly inferior to that of the LFR. Based on this analysis, it becomes evident that for applications like our pest detection model, where high throughput may be crucial, the 4800–4990 MHz frequency range is more reliable and efficient within a 5G setting.
A study examines 5G throughput at different SNR levels in the lower (4800–4990 MHz) and higher (37–43.5 GHz) frequency ranges.
The study evaluates the performance of 4G and 5G technologies in an environment with numerous real-time noise sources, focusing on optimal throughput and low latency. It evaluates throughput based on SNR and diverse carrier aggregation interfaces, as shown in Fig. 11. For lower device counts, such as 20 and 40, both 4G and 5G showed comparable throughputs, with 5G having a slight edge. However, as the number of connected devices increased to 60, 80, and 100, the difference in throughput became increasingly pronounced. While 4G throughput did improve initially, it started to plateau around 154.48 Mbps at 80 devices and saw only a modest increase to 157.5 Mbps at 100 devices. In contrast, 5G throughput continued to scale more effectively, reaching 196.72 Mbps at 80 devices and significantly outpacing 4G with 254.05 Mbps at 100 devices. 5G provides superior scalability and is better suited for network-intensive applications like our pest detection system, as it can handle more connected devices without compromising throughput. Conclusively, a comparison is made between the average latency of 4G and 5G across various counts of connected devices, highlighting a notable divergence in performance observed between the two networks, as shown in Fig. 11. For 4G, as the number of connected devices increased from 20 to 100, the average delay experienced a dramatic escalation, rising from 4221.75 ns at 20 devices to a whopping 19019.19 ns at 100 devices. This suggests that 4G struggles with latency issues as the network load increases. On the other hand, 5G demonstrated remarkable resilience to increased network load. Starting at an exceptionally low average delay of 597.01 ns for 20 connected devices, the latency increased modestly to 980.81 ns even when 100 devices were connected. This represents a much smaller increase in delay relative to 4G and confirms 5G’s capability to maintain low-latency performance even under heavier load conditions. For applications like our pest detection system, where timely data processing is crucial, 5G appears far more suitable than 4G due to its consistently lower latency.
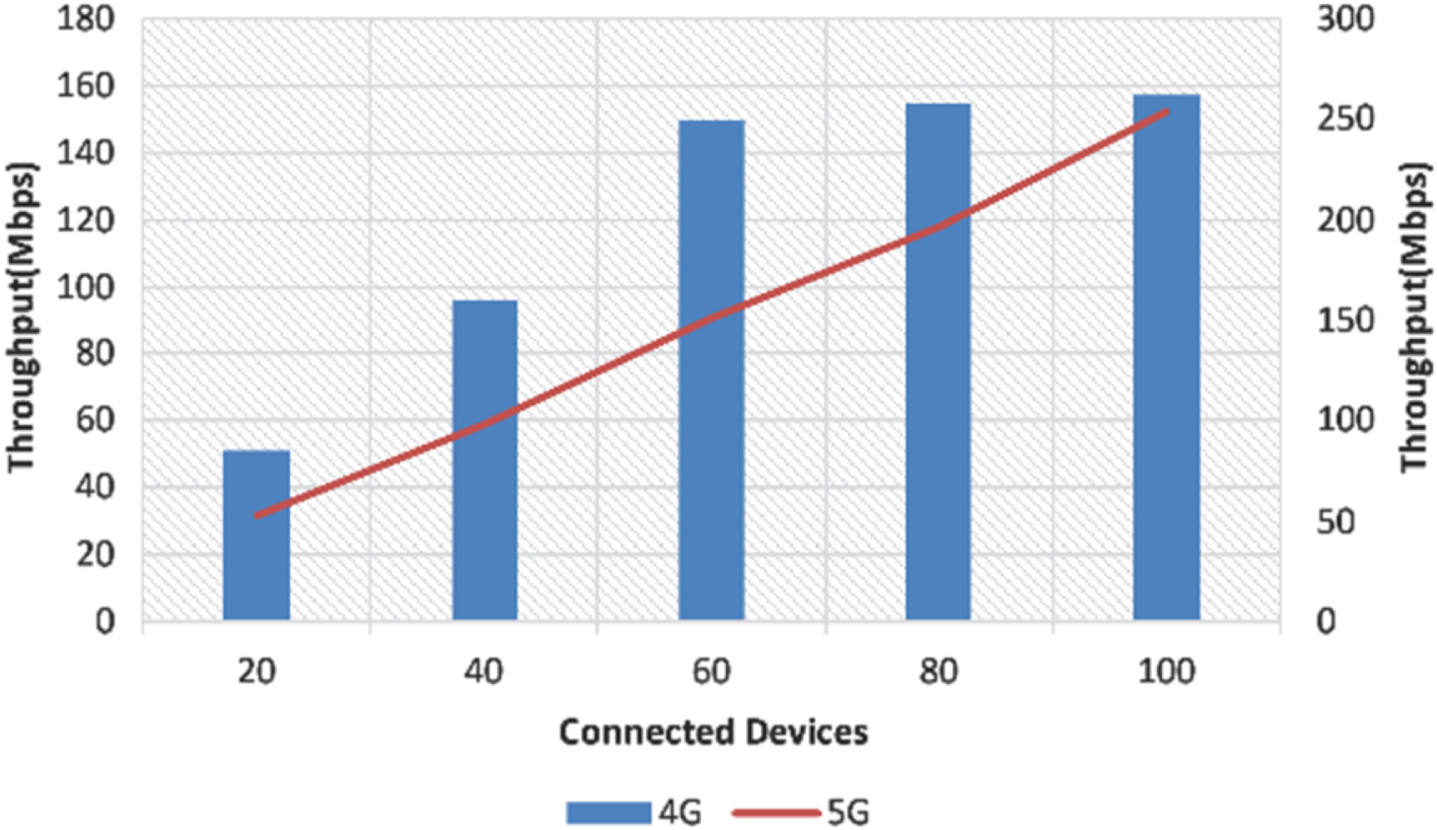
Throughput comparison.
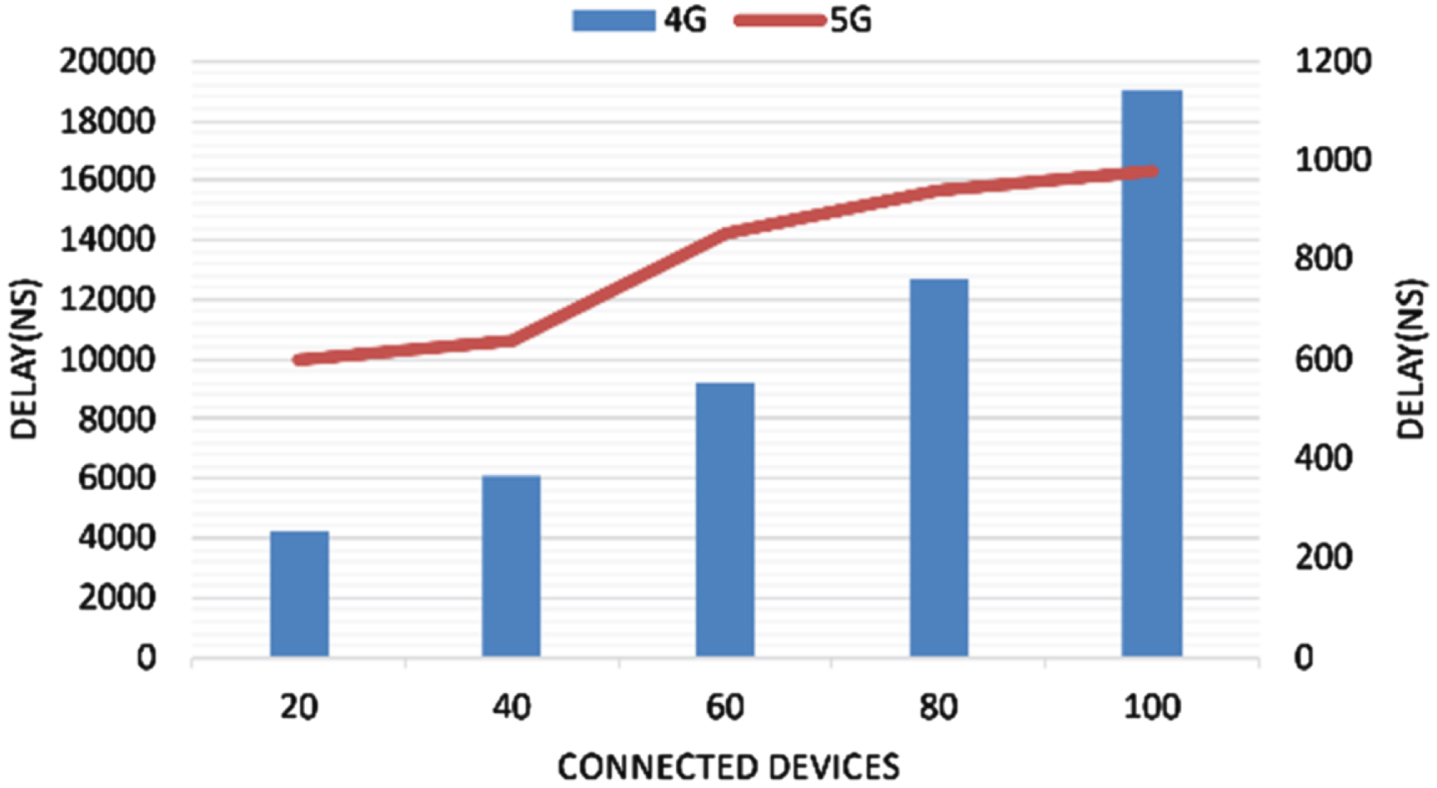
Latency comparison.
In summary, the rapidly evolving landscape of smart farming presents both opportunities and challenges. Integrating Internet of Things (IoT) sensors, drones, and Artificial Intelligence (AI) has already had a transformative impact on agriculture, from real-time monitoring to predictive analytics. However, there is a growing realization that these technologies can achieve their full potential only when used in an integrated, multi-modal system. Our Pest and Disease Detection and Response System (PDDRS) is a significant leap in this direction. The PDDRS utilizes a 5G-enabled architecture to combine environmental sensor data and image analytics seamlessly. It overcomes the limitations posed by traditional communication infrastructures like Wireless Sensor Networks (WSNs) and Long Range (LoRa) networks by capitalizing on the ultra-low latency and high bandwidth of 5G technology. With two distinct Machine Learning (ML) models, one focused on image-based disease identification and another on environmental factor-based PDD. PDDRS offers a comprehensive and real-time analysis of crop health. It enhances efficiency in disease detection and provides actionable insights for targeted interventions, such as pesticide applications. Significantly, the PDDRS model was implemented in China, specifically targeting the cotton crop. During the implementation, two specialized datasets were developed—one for image-based diagnosis and another for environmental factors. Both ML models exhibited commendable performance, outperforming other baseline models in accuracy and efficiency.
Furthermore, we conducted experiments on the 5G network to test its throughput and latency capabilities against a 4G network, primarily focusing on the performance when multiple devices were connected. The 5G network demonstrated superior performance, affirming its suitability for real-time, high-data-volume tasks.
Declarations
Declaration of competing interest
No CoI.
Data availability
Not Applicable
Funding acknowledgement
Changzhou Sci & Tech Program, Key Technologies and Equipment of 5G Edge Intelligent Fruit Harvesting Multi-Robot Cooperative System, Grant No. CE20212025. Key Laboratory of Changzhou College of Information Technology, Future Intelligent Network (TSTIRNet), Grant No. KYPT202102Z.