
Abstract
In recent years, the establishment of competitive markets has led researchers to pay more attention to the subject of supply chain design and competition in their studies. In this research, a multi-objective mathematical model is proposed for the design of a dynamic, integrated network in a competitive, sustainable, and resilient closed-loop supply chain for perishable goods under disruptions. In this model, competition between two chains is examined with a focus on economic, environmental, social, and resilience considerations. To solve this competitive model, a two-stage approach is used. In the first stage, game theory is employed to determine equilibrium values in competitive decisions, and considering the complexities of the model, the Multi Objective Particle Swarm Optimization (MOPSO) and Non-dominated Sorting Genetic Algorithm (NSGA-II) metaheuristic algorithms are used to solve the supply chain design problem. To evaluate the efficiency of the model and the proposed solution approach, the performance of each algorithm is analyzed based on five criteria: computation time, distance, average distance from the ideal solution, diversity, and the number of solutions examined, using random numerical examples. The results are analyzed graphically and statistically. In comparison to the NSGA-II algorithm, the MOPSO algorithm demonstrates better performance in terms of all criteria, with average improvements of 36.5% in distance, 33.9% in average distance from the ideal solution, 20.8% in diversity, and 79.6% in the number of solutions examined. The results indicate the effectiveness of the proposed approach and model in designing sustainable and resilient supply chain networks under competition for perishable goods.
Introduction
Designing a sustainable supply chain network for perishable goods is a critical decision with long-term consequences. The competitive nature of the global market, customer expectations, and technological advancements have made supply chains increasingly complex. Researchers have started considering the competitive future and its effects when designing supply chain networks. Economic decisions, such as pricing, significantly impact the attractiveness and market share of supply chains. However, the topic of competition among supply chains itself is less explored in the literature.
A sustainable supply chain must address social, environmental, and economic goals [1]. Sustainable development aims to balance these aspects. Efficient supply chain design can reduce operational costs but may also increase vulnerability to unforeseen events. The COVID-19 pandemic has disrupted sustainable supply chains, leading to negative effects on sales, income, customer health, logistics, and overall performance [2].
In today’s competitive world, supply chains face various risks, including natural disasters, cyber-attacks, sanctions, and disruptions in supply, production, and distribution systems. Supply chain managers and decision-makers are continuously seeking ways to manage disruptions and develop strategies to mitigate their impact.
The absence of a proper disruption management system can have irreversible consequences, such as damage to brand reputation and customer satisfaction. Research on resilient supply chain design focuses on identifying potential disruptions, implementing proactive and reactive flexibility strategies, and developing effective resilience strategies. Given the likelihood of disruptive events, industries should adopt strategies to enhance supply chain flexibility and responsiveness. Resilience strategies have emerged as a way to minimize the impact of unprecedented events.
Therefore, this article focuses on the issue of designing a sustainable and resilient supply chain network for perishable goods with sensitivity to time decay. It explores the pricing factor as an economic competitive element in a competitive scenario between two supply chains. Unlike previous models, this model designs a closed-loop competition between two supply chains based on game theory for time-sensitive perishable goods, including raw materials and final products, and calculates the pricing for customers and the purchase price of returned goods. These prices serve as inputs to metaheuristic algorithms. Due to the limitations and complexity of the model, the performance and behavior of the model are evaluated and examined using the NSGA-II and MOPSO metaheuristic algorithms.
In this article, Section 2 reviews related literature on supply chains, sustainability, competition in supply chains, and resilience. Section 3 provides an overview of the model. Section 4 presents the solution approach for the proposed model. Section 5 evaluates the performance of the proposed model with multiple random numerical examples, and finally, Section 6 concludes and suggests future research directions.
Literature review
To address the objectives of sustainability, resilience, and competition between disrupted supply chains for perishable goods, we have categorized and examined relevant articles into two categories: “Resilient and Sustainable Supply Chain for Perishable Goods” and “Resilient and Sustainable Supply Chain under Competition.”
Resilient and sustainable supply chain for perishable goods
Manufacturing organizations require more flexibility to maintain a competitive advantage as well as to operate in a dynamic environment. As the complexity increases, uncertainty and levels also increase in the supply chain [3]. Recent years have seen an increased focus on the economic aspects of supply chains in the context of resilience, sustainability, and perishability. However, there has been relatively less attention given to environmental issues by both researchers and industries. Consequently, events and disruptions have prompted researchers to focus on prediction to manage conditions, mitigate impacts, and increase the flexibility and resilience of supply chains. Saif and Elhedhli [4] suggested a method for creating an eco-friendly supply chain by utilizing simulation-based optimization. By examining various factors and costs (including those for perishable items), they found that sustainable practices could reduce environmental impacts by about 1% without increasing overall expenses in Canada. Banasik, et al. [5] conducted research on the agricultural supply chain and developed a two-objective model. The study specifically focused on the two-tier mushroom supply chain, however, the perishability of products was not considered. Sharifi, et al. [6] introduced a novel multi-objective mixed-integer linear programming model for integrating sustainability, flexibility, and responsiveness elements in the design of the Canadian wheat supply chain. The model concentrates on minimizing total cost, CO2 emissions, total waste, and maximizing job opportunities as sustainability factors. In an innovative approach, this study integrates the concepts of responsiveness and resilience within a comprehensive framework. Lotfi, et al. [7] proposed a model based on data envelopment analysis that accounts for the interdependencies of production between desirable and undesirable outputs in a supply chain. Their proposed model was used to evaluate the sustainability of a wheat supply chain.
Table 1 presents the categorization and analysis of research studies on resilient-sustainable supply chains for perishable goods.
Relevant research on the resilient-sustainable supply chain for perishable goods
Relevant research on the resilient-sustainable supply chain for perishable goods
In designing a flexible and resilient supply chain, pricing and finding the optimal production level in competitive conditions are crucial. Ghavamifar, et al. [14] studied multi-objective, two-level programming for the design of a supply chain network in a competitive region. Chen and Chen [16] propose a new powerful optimization model for the two-stage distribution design problem with probabilistic uncertainty constraints, aiming to design a resilient supply chain. Through a robust optimization approach, they illustrate that decision-makers can make rational decisions for designing a resilient supply chain under uncertain probability distributions with uncertain demand. Table 2 provides a detailed overview of studies conducted in the area of supply chain design for perishable goods.
Relevant research on competitive resilient-sustainable supply chain
Relevant research on competitive resilient-sustainable supply chain
The literature review identifies a significant gap in the design of supply chain networks that can effectively handle disruptions while incorporating sustainability, resilience, and competitiveness with other supply chains. Competitive pricing plays a crucial role in enhancing competitiveness and sustainability, as well as ensuring the resilience and survival of the supply chain. Despite the considerable focus on modeling efforts for designing resilient and sustainable supply chains, there has been limited attention given to the joint consideration of flexibility, sustainability, and competitiveness, particularly for perishable goods. Therefore, it is imperative to address this critical gap by designing a resilient and sustainable supply chain network for perishable goods that takes into account disruptions, sustainability, flexibility, and competitiveness.
Problem definition
This article presents a multi-objective model that proposes the design of an integrated, dynamic, closed-loop, sustainable, and resilient supply chain network for perishable goods within a competitive environment. As depicted in Fig. 1, in addition to the desired supply chain, there exists another supply chain referred to as the rival supply chain in the market, engaging in competition for the sale and purchase of products. These two supply chains compete in terms of product sales prices, striving to capture a larger market share during direct logistics. In reverse logistics, the competition between the two supply chains revolves around the price of purchasing consumable products from customers. The model takes into account the interdependencies between tactical and operational decisions and the strategic decisions associated with the design of the supply chain network.

Configuration of inter-chain competitive supply chain network.
It encompasses short-term and medium-term decisions concerning the future performance of the supply chain in a comprehensive manner, while also incorporating strategic decisions related to facility location. To ensure the design of a dynamic and flexible supply chain network, the model considers a multi-period long-term planning horizon as a fixed strategic decision across the periods. However, the structure of the supply chain may evolve throughout the planning horizon in response to market conditions.
Therefore, the supply chain network design problem is examined in multiple strategic periods, with multiple tactical and operational periods in each strategic period. In addition, the model focuses on the effects of the product life cycle on perishable goods by paying attention to periods in this problem. This problem is based on several assumptions, which include: There are various potential locations for supply chain facilities, such as manufacturers, distribution centers, collection centers, recycling centers, and disposal centers. Once a facility becomes active during a period, it must remain operational in the subsequent planning period. Apart from the two existing supply chains, there are no other competitors in the market, and neither of the supply chains holds any superiority over the other. The demand for products by customers solely depends on the sales prices offered by the two supply chains. The number of collected products from customers by each supply chain is determined by the prices of purchasing consumable products by that supply chain and its rival supply chain. The capacity of production and distribution centers can be increased. Shortage can occur during the selling state. Perishable goods and raw materials have a limited lifespan. All parameters of the problem will be examined in a deterministic space.
The following notation, parameters, and decision variables used in the proposed mathematical model are stated:
Model formulation
In this section, we will first present the economic, environmental, social, and resilience objective functions for the supply chain network design problem. Following that, we will describe the constraints of the problem.
Objective functions
In this problem, we have investigated the closed-loop supply chain network design. The first objective function (OF1) of the network design problem is to maximize the profit from selling final products in forward logistics and recycled products in reverse logistics. In Equation (1), we have considered the revenue from selling products to end customers and the revenue from recycled materials. To calculate the supply chain cost, we have taken into account the cost of purchasing raw materials, the cost of producing each product at production centers, the cost of activating each of the existing facilities in the supply chain, the cost of storing products at distribution centers, the cost of dealing with shortages to meet customer demand, the cost of purchasing buy from customers, the cost of increasing capacity at production centers and distribution centers to improve resilience and deal with potential disruptions, the cost of recycling waste products, and the cost of moving products between each of thefacilities.
In order to establish a green supply chain, we have also investigated the environmental index alongside the economic objective of the supply chain network design problem. To evaluate the environmental impacts of supply chain activities, such as establishing facilities, transporting products between different members of the supply chain, and producing and recycling products, we have considered the amount of pollution and energy consumption resulting from these activities. Thus, the environmental objective function (OF2) in the problem is calculated according to Equation (2).
The value and social justice are evaluated based on the number of job opportunities created in a specific area, and creating job opportunities in an area is deemed to have a higher social value. The objective of this problem is, therefore, to maximize the level of social responsibility and commitments in the supply chain. By activating each facility, more job opportunities can be created for individuals. In this model, we have considered the job opportunities created as a result of the operation or construction of each of the suppliers, production, distribution, collection, recycling, and disposal centers. This objective is the social objective function (OF3) and can be calculated according to Equation (3).
Equation (5) shows that each production center purchases the necessary raw materials for producing the final product from the supplier center.
Equation (6) indicates that all the products produced by each production center, along with the recycled products imported from the recycling centers to the production center, are immediately sent to the distribution centers.
Equations (7) and (8) indicate that the inflow to a distribution center is balanced with its outflow so that the incoming goods to the distribution centers are transferred to the customers.
Equation (10) shows that the sum of the supplied demand and the shortage of products for customers is equal to the total market share of the supply chain.
Equation (11) indicates the balance of the flow of consumed and returned goods at collection centers so that a portion of the collected goods is transferred to recycling centers. In contrast, the portion that cannot be recycled is sent to disposal centers for disposal.
Equations (12) and (13) show the number of recycled goods that are transferred to production centers so that the portion of goods that cannot be recycled or lose their functionality during the recycling process is sent to disposal centers for disposal.
Equation (14) indicates that the number of goods transferred from collection centers to recycling centers equals the number of returned customer products.
Equations (15) to (18) show that the activated facilities must remain active until the end of the active planning horizon.
Equations (19) and (20) make the performance of each producer and distribution center subject to the maximum capacity of the facilities.
Equation (21) shows that the purchased raw materials from suppliers must be transformed into finished products within their lifespan, and the system must be planned so that there is no waste or loss of products.
Equations (23) and (24) indicates the maximum capacity of production and distribution centers.
Equations (25) and (26) show that the number of goods sent from production and distribution centers exceeds their maximum capacity.
Equation (27) specifies the type of variables in the problem.
The competition between the two supply chains is influenced by economic factors such as product selling prices in direct logistics and the prices of used goods for collecting products in reverse logistics. Therefore, the level of customer demand in a competitive space between supply chains is dependent on the performance of its competitors in the market. Various demand functions have been proposed in the literature on competitive supply chains. In this problem, we have used one of the most commonly used demand functions to model the competition between the two supply chains. According to this type of demand function, there is a linear relationship between the level of customer demand and product selling prices in each supply chain. Equation (28) shows the demand function dependent on selling prices for supply chain l. In this equation,
In addition to competition in direct logistics, another type of competition arises in the economic factor of price between the target supply chain and its rival supply chain in reverse logistics. Therefore, in this problem, we have modeled economic competition in reverse logistics based on the function of collecting goods that is dependent on the prices of used and consumed goods. Supply chains must purchase consumer goods from customers to collect them and thus improve environmental indicators. Equation (29) shows the collection function of the final products of the first supply chain, which is dependent on purchase prices.
In this equation,
The approach proposed for solving the model mentioned above consists of two stages. In the first stage, we examine the competition between the supply chains and determine the competitive decision variables using a game theory approach. In the second stage, based on the results obtained from the first stage and considering the complexity of the problem, we use a multi-objective metaheuristic algorithm to solve the problem. Figure 2 illustrates the steps of the proposed solution approach and the decision variables of interest in each stage.
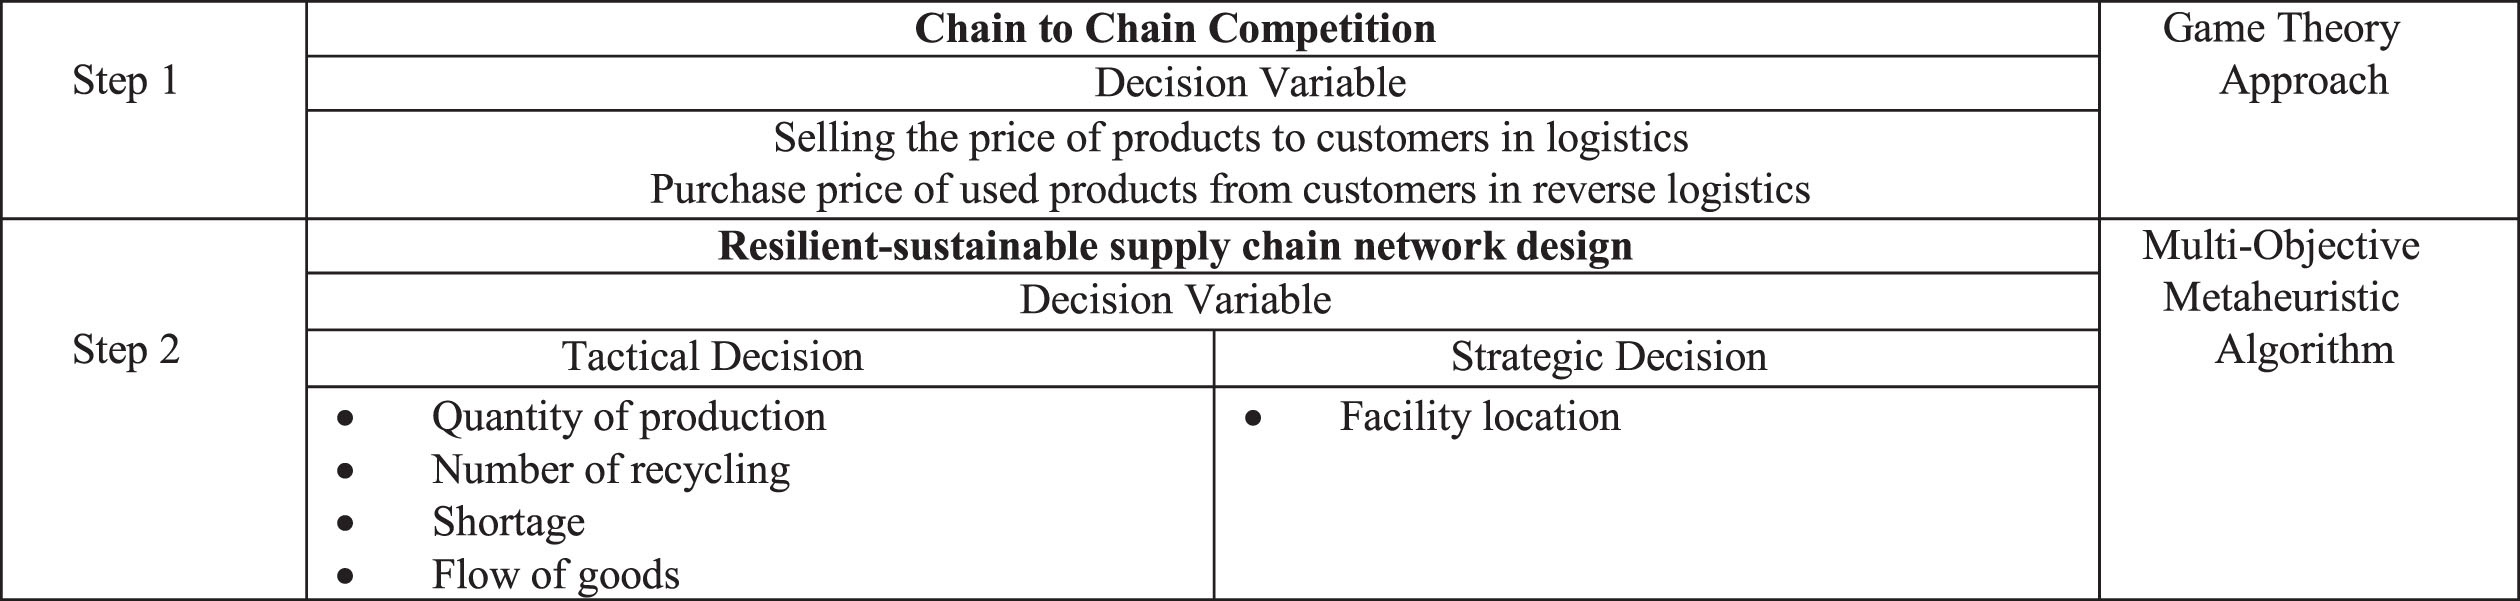
The steps of the proposed solution approach.
This problem involves the simultaneous competition between two supply chains in both direct and reverse logistics. In direct logistics, each supply chain determines the selling prices of its products to influence market share and profitability. In reverse logistics, the supply chains compete in setting purchase prices for reusable goods, which affects buybacks and competitive profitability. Game theory is employed to address the competitive aspect of this problem, as it is a commonly used method for modeling competitive scenarios. In this approach, each player strives to make rational decisions that align with their own interests while considering the actions of other players (competitors). It is assumed that rival supply chains can adjust their competitive characteristics when a new supply chain enters the market. The Nash equilibrium is used to determine the optimal values of competitive decision variables due to the dynamic competition between supply chains and the lack of dominance between the players. These decision variables include selling prices in direct logistics and purchase prices in reverse logistics. Equation (30) serves as the foundation to determine the concavity of the competitive profit function with respect to these decision variables. The first derivatives of the competitive profit function with respect to selling and purchase prices are calculated using Equations (31) and (32)respectively.
The Hessian matrix of the competitive profit function concerning selling and purchase prices can be calculated as shown in Equation (37).
The matrix derived from Equation (37) is strictly negative, indicating the concavity of the competitive profit function with respect to selling prices in direct logistics and purchase prices of buy back in reverse logistics. Consequently, the optimal values for these prices can be determined by setting the first derivatives of the competitive profit function with respect to them equal to zero. Solving the resulting system of two equations with two unknowns will yield the desired optimal values.
These optimal values are denoted by Equations (38) and (39), respectively. The optimal values obtained for selling and purchase prices through Equations (38) and (39) should be regarded as the optimal values for these decision variables in competitive scenarios. Subsequently, these optimal values can be utilized as inputs in the suggested mathematical model, as outlined in Equations (1) to (27) [21].
Once the optimal values of selling and purchase prices are calculated and substituted into the model, it leads to a non-linear mixed-integer programming model. However, since the multi-objective network design problem is known to be NP-hard, a multi-objective optimization method will be used to solve the resulting model. This approach will facilitate the concurrent optimization of multiple objectives that are often in conflict with each other, such as maximizing benefits while minimizing environmental impact.
Non-dominated sorting genetic algorithm
The genetic algorithm is a problem-solving algorithm inspired by biological models of populations. It improves the characteristics of a population by generating new populations through the combination of previous ones, with the values of objective functions representing these characteristics. The Non-dominated Sorting Genetic Algorithm (NSGA-II) is a multi-objective variant of the genetic algorithm. It assigns ranks to individuals based on their non-dominance and proceeds to re-rank the remaining individuals without considering the effect of ranking on the population.
In the initial stage of NSGA-II, lower-ranking individuals replace their parental counterparts and undergo sorting based on their crowding distance. The population resulting from crossover and mutation, along with the initial population, is categorized by rank, and individuals with lower ranks are removed. In the subsequent stage, the remaining population is sorted within each front based on their crowding distance. Figure 3 provides an illustration of this process.

Pseudo code of non-dominated sorting genetic algorithm.
The Multi-Objective Particle Swarm Optimization (MOPSO) algorithm is a dynamic optimization technique utilized for solving multi-objective optimization problems. Each particle in the algorithm represents a point in a multi-dimensional space. The algorithm aims to generate the optimal set of parameters by evaluating metrics such as Euclidean distance, polynomial distance, and Hawking distance between points. These metrics help determine the optimality of a point in the objective space, which is the multi-dimensional space representing the objectives. The algorithm calculates the optimality score for each point based on the defined metrics for different objectives. Parameters such as population size, number of generations, memory size, and particle movement direction are optimized within the MOPSO algorithm to search for optimal solutions. The steps of this algorithm are as follows [22]:
Generate an initial population randomly and evaluate them. Calculate the value of the objective function for each particle until the termination conditions are met. Calculate X
ibest
and X
gbest
for each particles. Update the velocity and position vectors for all particles.
The termination conditions are: Reaching an acceptable level of performance and checking a specific number of iterations. Exceeding a specific number of iterations/time without observing significant performance improvement.
The constraint handling policy in both proposed algorithms involves generating feasible solutions, and if an infeasible solution is generated, a new solution is produced and checked for feasibility.
Numerical study
To evaluate the model and the proposed solution approach, we employ randomly generated problems. Consequently, the problem parameters are randomly generated using uniform distribution functions. The key features of these generated problems, such as the quantity of facilities in various layers of the target supply chain, are presented in Table 3. By using randomly generated problems, researchers can test the robustness and performance of the proposed model and solution approach under various conditions.
Characteristics of production problems
Characteristics of production problems
The results obtained from solving the competitive stage, including sales prices, purchase prices, demand levels, and returns for each numerical example using the proposed optimization approach, are presented in Table 4. To solve each numerical example using the proposed optimization approach, competitive decision variables such as sales prices in direct logistics and purchase prices in reverse logistics are initially considered. The game theory approach is used to solve this stage of the model, which determines the competitive sales and purchase prices for each product and at each demand point for eachperiod.
Competitive stage results
Since these values are calculated for different tactical periods, products, and demand points, their average values are presented in the table. By substituting the values obtained from the competitive stage into the proposed multi-objective model, a new model is derived for the sustainable and resilient design of an integrated supply chain network. To solve this model, the second stage of the optimization approach mentioned in sections 4.2 can be used. To accurately solve the multi-objective model, the closed-loop supply chain design problem for the test problem (3) is considered. To determine the maximum and minimum values for each of the four objectives of the model, each objective is considered separately. This involves first considering all the minimization objectives and then the maximization objectives. The network design problem mentioned above is formulated as a multi-objective model according to Equations (1)–(27).
The GAMS 25.1 software is used to solve the resulting MILP model, and the CPLEX solver is considered for solving the proposed model. To solve the problem on a larger scale, two multi-objective optimization algorithms discussed in Sections 4.2.1 and 4.2.2 have been used. It should be noted that to compare the performance of the two metaheuristic algorithms in this problem, five standard indicators are used, including computation time, number of solutions (the number of solutions that are in the optimal Pareto front of the algorithm, which naturally should be higher), diversity (the extent of the spread of solutions in the Pareto front), ideal distance (measuring the average distance of optimal Pareto front solutions to an ideal point), and distance (measuring the standard deviation of the distance between Pareto solutions) [23].
Furthermore, The Taguchi method is used to optimize algorithm parameters, reducing the impact of noise. Each problem is solved ten times with both algorithms to minimize objective functions. The “smaller-the-better” criterion is selected. Minitab software is used to adjust parameter levels for MOPSO and NSGA-II.
MATLAB software is utilized to solve the problems, and Table 5 presents the results of the multi-objective evaluation indicators for all problems and both algorithms discussed in the study. To statistically compare the two proposed algorithms based on the multi-objective indicators, analysis of variance (ANOVA) is employed for all test problems. First, the normality of the distribution of the results obtained from the algorithms is examined using the Minitab software.
Results related to evaluation indices
Table 6 presents the results of the normality test, and Table 7 shows the results of the analysis of variance for the algorithms based on various metrics. For example, the number of solutions generated by the MOPSO algorithm compared to the NSGA-II algorithm is evident. The MOPSO algorithm outperforms NSGA-II in terms of the number of solutions (NOS) and produces a greater number of solutions compared to NSGA-II. This provides decision-makers with a wider range of options to choose from. Additionally, it can be observed that the two algorithms exhibit similar performance in terms of response time and average distance from the ideal solution. However, the NSGA-II performs better in terms of the distance metric, while the Multi-Objective Particle Swarm Optimization algorithm creates a higher level of diversity compared to the NSGA-II.
Normality test of indices
Analysis of variance (ANOVA) test
Table 8 displays the optimal values of the objective functions for all solutions available at the Pareto front level for the two proposed algorithms. It can be observed that none of the solutions obtained using the MOPSO algorithm are dominated by the solutions obtained using the NSGA-II algorithm. However, some of the solutions obtained using the NSGA-II algorithm are dominated by some of the solutions obtained using the MOPSO algorithm.
Pareto solutions for random problem number 6
Table 9 presents the results obtained for the objective functions of each random problem. By utilizing GAMS, researchers can obtain more precise and reliable results for the objective functions of the problems, allowing for a more accurate comparison of the two metaheuristic algorithms.
The responses from the GAMS software for random problems
*The GAMS software did not find a solution within 10,000 seconds.
This article examines the challenges involved in constructing a durable and sustainable supply chain network for perishable goods in the presence of competition and disruptions. The study proposes a design model that incorporates economic, environmental, social, and resilient variables, with pricing as a key competitive component. A multi-objective mathematical model is developed specifically for perishable products within the supply chain design framework. The model is addressed using a two-stage approach. In the first stage, a competitive model based on game theory is employed to determine customer demand, pricing, and the number of returned goods. The output of this stage is then incorporated into the mathematical model, which is solved using MOPSO and NSGA-II algorithms. Numerical examples are used to evaluate the proposed solution approach. The results show that MOPSO outperforms NSGA-II in terms of various performance indicators. The findings highlight the effectiveness of the proposed approach and model in designing resilient and sustainable supply chain networks for perishable goods under competition. Additionally, the study emphasizes the practical implications of integrating resilience and sustainability in supply chain design, enabling companies to offer reliable and sustainable solutions while minimizing costs and risks. The research contributes to the theoretical understanding of resilience and sustainability in supply chain management and provides decision-making frameworks for practitioners and researchers. Further research should consider uncertain outcomes to enhance the reliability of the results. Overall, the study underscores the importance of considering competitive factors and utilizing game theory and metaheuristic algorithms in designing resilient and sustainable supply chain networks.