
Abstract
The Zebra Optimization Algorithm (ZOA) mimics the social behavior of zebras and is susceptible to the interference of local optimal solutions, leading to poor optimization and premature convergence. In this paper, we propose an improved zebra optimization algorithm (IZOA) that integrates several advanced strategies to overcome these problems. First, IZOA introduces a Lévy flight strategy in the foraging phase of the zebra population to expand the search range and improve the quality of individuals. At the same time, the “PZ” mechanism updates the other individuals based on the value of the leading zebra in each generation, which accelerates the optimization process and improves the searching ability. In addition, IZOA integrates a nonlinear convergence factor based on the COS function, which improves the convergence speed and balances the exploration and development phases. A Cauchy variation strategy is used to enhance the global search capability and help the population escape from local extremes. In CEC2017 and CEC2022 benchmarking and rolling bearing design applications, IZOA is compared with 12 mainstream and improved ZOA algorithms (CZOA and IIZOA), and shows better performance. Finally, IZOA is combined with LSTM network for wind power prediction to show its application advantages in real engineering design problems.
Keywords
Introduction
Optimization problems involve finding the optimal value of an objective function and its corresponding solutions under certain constraints, and are prevalent in fields such as engineering, economics, and planning [1]. As society and technology evolve, optimization problems become increasingly complex, high-dimensional, and nonlinear, making them difficult to solve with traditional mathematics. Therefore, researching and finding new solution methods has become a continuously developing field.
Meta-heuristic algorithms [2] are a type of stochastic algorithm proposed in recent years for solving complex optimization problems. They are widely used due to their simplicity, flexibility, and ability to avoid local optima, in various fields including industrial manufacturing, energy optimization, and urban planning. These algorithms aim to quickly find solutions close to the optimum by continuously iterating and adjusting initial candidate solutions until a satisfactory solution or standard is met. The core of meta-heuristic algorithms lies in balancing exploration and exploitation during iterations to optimize performance.
Researchers have created numerous meta-heuristic algorithms by simulating natural phenomena, animal behavior, physical concepts, and human and other evolutionary processes. Based on the motivating behavior, meta-heuristic algorithms can be classified into four types: algorithms based on natural evolution (EA), those based on physical principles and chemical laws (PhA), those based on human behavior, and those based on group behavior [3]. Among the many types of meta-heuristic algorithms, swarm intelligence algorithms, with their unique way of simulating group behaviors in nature, have particularly caught the interest of researchers. These algorithms typically mimic the group behaviors of organisms in nature, such as schools of fish, flocks of birds, and colonies of ants, utilizing simple rules and interactions among individuals to achieve complex swarm intelligence behaviors, thereby solving optimization problems. Many researchers have conducted in-depth studies on swarm intelligence algorithms. The Particle Swarm Optimization (PSO) algorithm proposed by Eberhart and Kennedy, which simulates the group trajectories of fish and birds gathering material energy in natural environments, is one of the most classic swarm intelligence algorithms [4]. Particles move within the feasible solution space, adjusting their direction and speed by combining their own experience and the behavior of surrounding particles to update their positions and find optimal solutions. Although the algorithm performs well in multiple fields, it is prone to getting stuck in local optima, especially in high-dimensional problems. Therefore, scholars have proposed various improved models of Particle Swarm Optimization (PSO) to address these issues and apply them to practical optimization tasks. Dorigo and others proposed the Ant Colony Optimization (ACO) algorithm [5], drawing on the behavior of ants releasing pheromones on the ground to mark favorable paths for other colony members to follow during nest searching and foraging. The perception among ants is conveyed through the concentration of pheromones, with shorter paths that more ants traverse leaving more pheromones, thus increasing the likelihood that other ants choose this path; over time, the pheromone concentration on other paths decreases, eventually leading the ant colony to converge on the optimal path. The Ant Colony Optimization (ACO) algorithm has limitations such as premature convergence, time-consuming pheromone deposition, and getting stuck in local optima. Laith Abualigah and colleagues proposed the Aquila Optimizer (AO) algorithm, based on the hunting behavior of eagles in nature. The Aquila algorithm mimics the eagle’s hunting strategy in four phases: (1) Global search: simulating the eagle soaring high to lock onto prey; (2) Local search: simulating the eagle circling to hunt low-flying prey; (3) Global exploitation: simulating the eagle flying low to gradually capture prey; (4) Local exploitation: simulating the eagle diving to snatch ground-based prey. This algorithm has strong global optimization capabilities, but weaker local search abilities, and it suffers from reduced population diversity and poor stagnation resistance in later iterations. Malik proposed the Chameleon Swarm Algorithm (CSA) in 2021 [6], mainly simulating the dynamic behavior of chameleons searching for food near trees, deserts, and swamps. Heidari and others were inspired by the three phases of the Harris hawk’s predatory behavior—exploration, transition from exploration to exploitation, and exploitation—to propose the Harris Hawks Optimization (HHO) algorithm [7]. Apart from the above algorithms that mimic predator behavior, there are many that simulate foraging and nutrition-seeking behaviors, such as the Fruit Fly Optimization Algorithm (FOA) proposed by Pan in 2012 [8], which mimics the fruit fly’s foraging behavior, using olfaction to locate food and vision to confirm the optimal food position, guiding the population towards the optimal location. This algorithm converges quickly, but struggles with problems where the optimum value is negative and performs poorly in complex, high-dimensional optimization tasks, often getting trapped in local optima. All the aforementioned algorithms are proposed based on the foraging behaviors of species groups, with the common feature of mimicking the species’ exploration and exploitation phases, exploring all areas within the feasible domain as much as possible and exploiting the feasible solutions in explored areas to the greatest extent.
The table below lists some of the latest swarm intelligence optimization algorithms, providing their sources of inspiration, advantages and disadvantages, and the overall complexity of the algorithms [9].
It is evident from summarizing existing research on metaheuristic algorithms that while these algorithms are simple and have strong optimization capabilities, they face limitations when addressing high-dimensional, multimodal complex problems, such as insufficient search capabilities, propensity to converge to local optima, long convergence times, large computational overhead, inability to precisely locate the optimal solution, and inadequate balance between exploration and exploitation. As a result, current metaheuristic algorithms struggle with more complex, higher-dimensional, non-linear optimization problems. Furthermore, according to the No Free Lunch (NFL) theorem [10], each algorithm has its limitations and performs differently on various optimization problems; no metaheuristic algorithm can solve all optimization problems. Therefore, ongoing research into new algorithms and improvements to existing ones is essential to meet the demands of optimization problems. In 2022, EVA TROJOVSK and colleagues proposed a new metaheuristic algorithm named the Zebra Optimization Algorithm [11], inspired by zebra foraging behavior and their defense strategies against predators in nature. Compared to other mainstream algorithms, it shows superior convergence speed and search precision but also shares the aforementioned shortcomings when dealing with high-dimensional, multimodal problems. Vikram Kumar Kamboj [12] developed a new algorithm (CZOA), enhancing the randomness and diversity of candidate solutions by incorporating a chaotic Chebyshev map into the base ZOA. Shang Shang [13] introduced an improved algorithm (IIZOA), which enhances the quality of candidate solutions by averaging fitness values and manipulating elite sets, and accelerates the optimization process in the defensive phase by introducing adaptive thresholds. Both have made significant improvements to the ZOA algorithm, implementing strategies that enhance its optimization capabilities.
The remainder of this paper is organized as follows: Section 2 provides a detailed explanation of the principles and mathematical model of the Zebra Optimization Algorithm. Section 3 discusses the proposed improvement strategies and methods. Section 4 conducts a performance analysis and ablation study on the IZOA algorithm, comparing it with 12 other mainstream optimization algorithms, as well as CZOA and IIZOA, on the CEC-2017 and CEC-2022 test sets. Section 5 applies the IZOA algorithm to a real-world engineering problem and compares it with other optimization algorithms. After that combines the IZOA algorithm with an LSTM network for wind power prediction. Section 6 summarizes our work and outlines future prospects.
Zebra optimization algorithm
Algorithmic inspiration
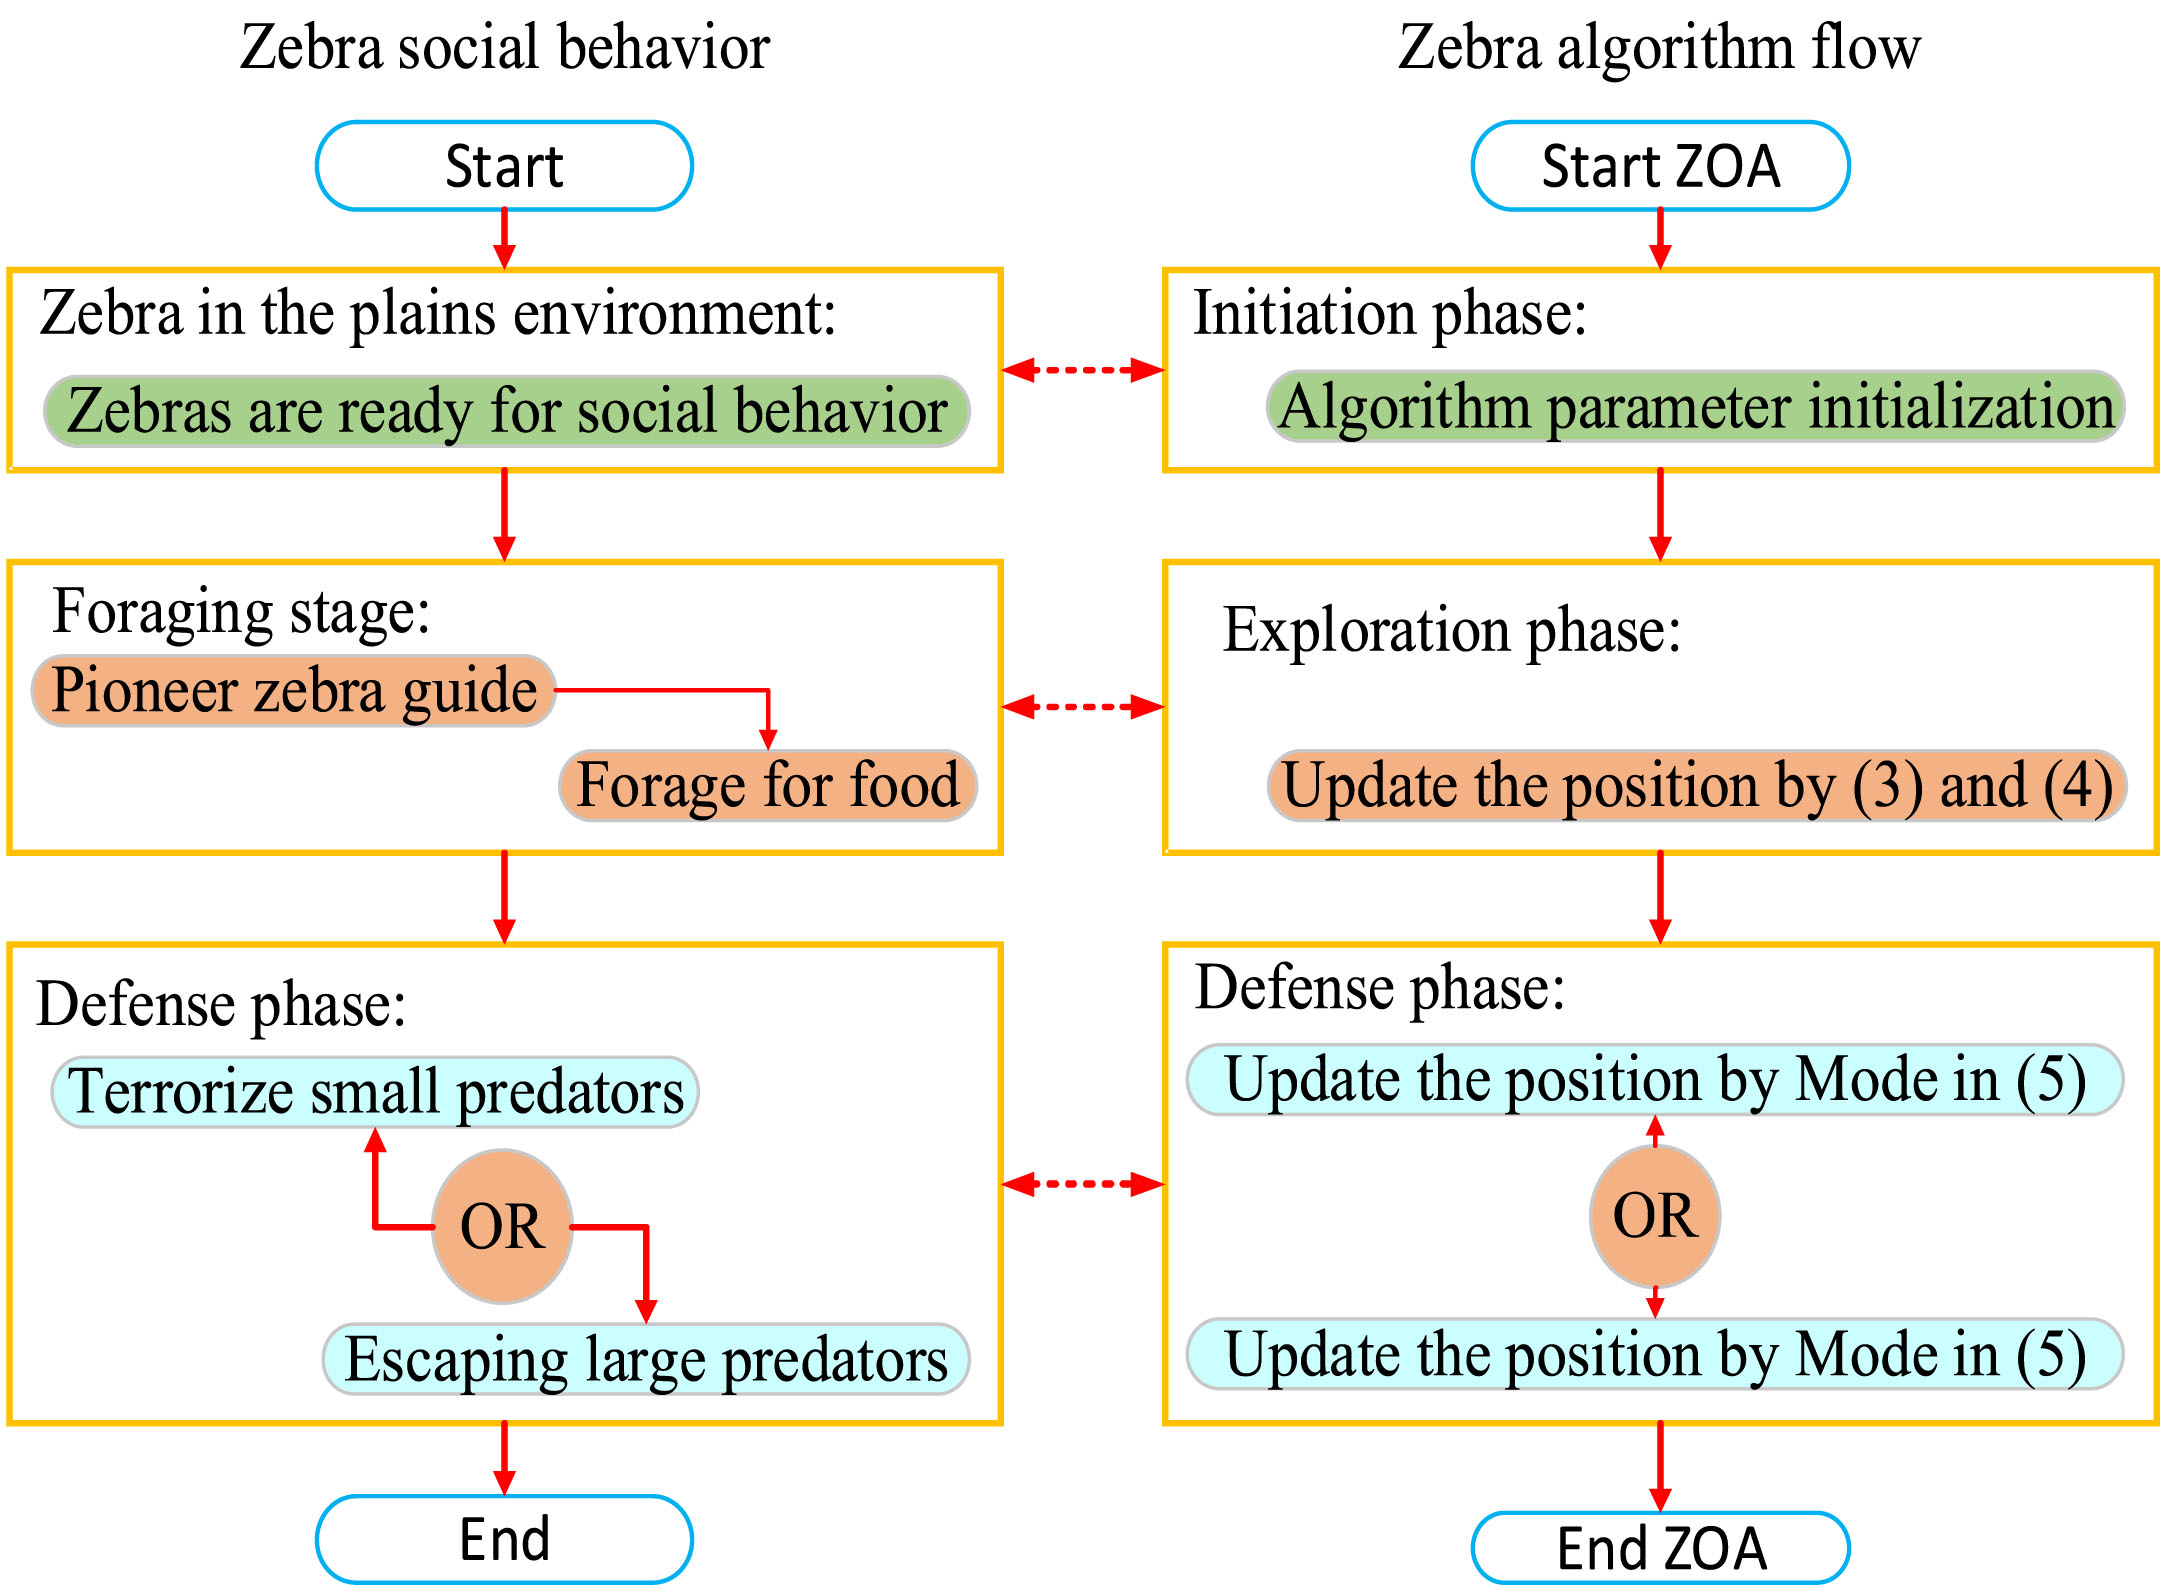
Zebras, originating from Eastern and Southern Africa, are herbivorous animals characterized by their long necks, facilitating grazing on ground-level grass, and slender legs, enabling rapid running to evade predators. The two most significant social behaviors in zebra populations are foraging and predator defense, as depicted in Fig. 1. Figure 1(a) illustrates foraging behavior, while Fig. 1(b) and (c) demonstrate predator defense tactics. During foraging, pioneer zebras lead the path, with others foraging and feeding nearby, thus guiding the movement of the herd across the savannah. In defense against predators, zebras adopt zigzag escape patterns or random lateral movements when confronted with large predators like lions, while they form groups to intimidate or confuse smaller predators such as hyenas and dogs. The Zebra Optimization Algorithm is inspired by these two intelligent behaviors of zebras. The exploration phase of the algorithm corresponds to the zebra’s foraging behavior, while the exploitation phase aligns with the predator defense tactics. The correspondence between the Zebra Optimization Algorithm and zebra behaviors is depicted in Fig. 2.

Foraging and defense in zebras.
Zebra behavior flowchart.
Initialization process
The population-based optimizer ZOA features individual zebras as its population members. Mathematically, the plains inhabited by the zebra population represent the feasible solution space of the problem, with each zebra within the population symbolizing a potential solution to the optimization problem. The position of each individual determines the values of the problem’s variables. In ZOA, each individual in the population is represented by a single vector, where the elements of this vector correspond to the values of the problem variables. The initial positions of the zebra population are randomized. The herd can be modeled using a matrix representation, with the ZOA population expressed as shown in Equation (1).
In this context, X represents the zebra population, where X i denotes the ith zebra. Xi,j is the value of the jth problem variable proposed by the ith zebra. N is the number of members (zebras) in the population, and m represents the number of parameters in the problem.
Each individual zebra in the population represents a candidate solution for the optimization problem. The value of the objective function for each candidate solution can be evaluated and calculated, which is expressed by Equation (2).
In this framework, F represents the vector of objective function values, where F i is the objective function value for the ith zebra. By comparing the objective function values, the quality of their corresponding candidate solutions is analyzed, thereby selecting the best candidate solution for a given optimization problem. In minimization problems, the zebra with the smallest objective function value represents the best candidate solution; conversely, in maximization problems, the zebra with the largest objective function value is considered the best candidate solution. The positions of the zebras and the values of the objective function are updated in each iteration of the algorithm, necessitating the identification of the best candidate solution in every iteration.
During the exploration phase of ZOA, the population members update their positions by simulating the behavior of zebras searching for food. Consequently, the pioneer zebra, being the best member of the ZOA population, leads the other members towards better positions within the search space. The position update of the population during the foraging phase can be modeled using Equations (3) and (4).
In this context,
In this phase, the positioning of individuals within the feasible region of the ZOA population is updated by simulating the defense strategies of zebras against predator attacks. As previously mentioned, zebras adopt different defense strategies in response to attacks from various predators. For instance, in the face of large predators, zebras may employ zigzagging escape tactics or random sidestepping movements. Conversely, when confronted by smaller predators such as hyenas and dogs, zebras tend to form herds as a means to intimidate or confuse the predators. In the ZOA model, it is assumed that these two types of defense scenarios occur with equal probability.
The evasion strategy of zebras when attacked by large predators like lions can be modeled using the pattern S1 in Equation (5). When smaller predators such as hyenas and dogs attack an individual zebra, other zebras in the population move towards the attacked zebra, intending to establish a defense to confuse and intimidate the predator. This strategy is mathematically modeled using the S2 pattern in Equation (5). When updating the position of a zebra, if the new position offers a better value for its objective function, then the zebra will accept the new location. This update condition is modeled using Equation (6).
In this context,
The ZOA process flowchart is as illustrated in Fig. 3.
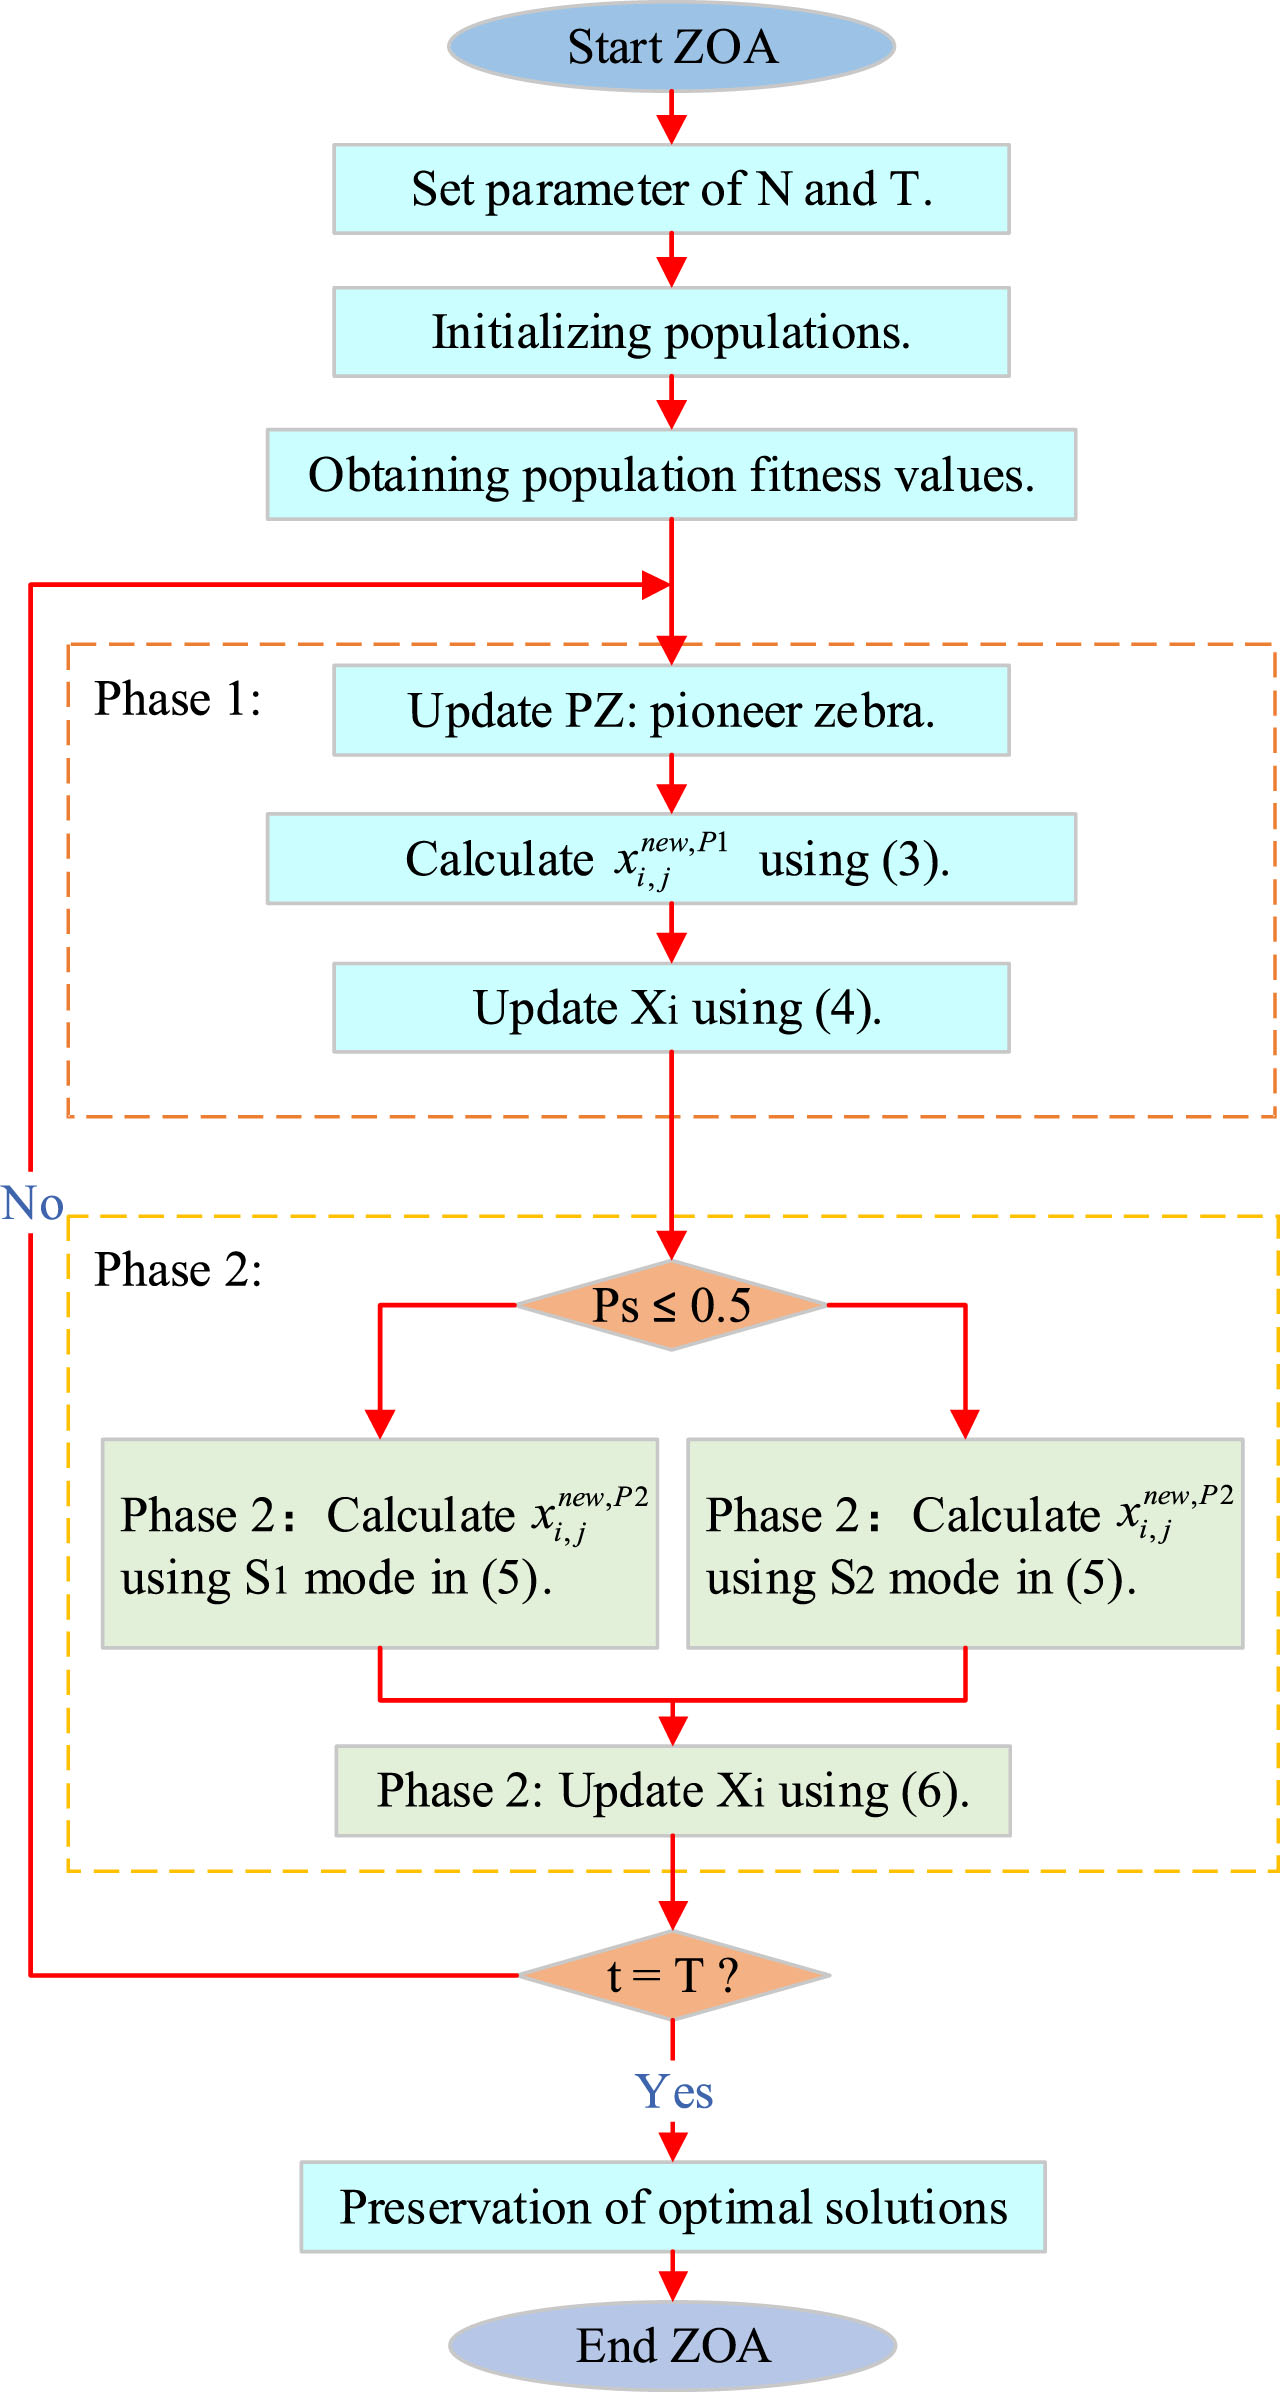
ZOA Flow Chart.
From the preceding text, it is understood that the core optimization aspects of the Zebra Optimization Algorithm (ZOA) encompass three areas: first, the optimization of the foraging process of the zebra population; second, the optimization of zebras’ strategies to evade large predators; and third, the optimization of zebras’ strategies to intimidate smaller predators. Therefore, to enhance the overall performance of the algorithm, this chapter introduces three different improvement schemes targeting the deficiencies in each of these three stages. Firstly, to address the issue of individual quality variation and limited foraging space in the ZOA’s foraging phase, a Lévy flight strategy is introduced along with “PZ”, which represents the optimal position of each zebra individual in every iteration, thus improving the new exploration formula. Secondly, in the phase of evading large predators, where the distance between the zebra and the predator changes linearly, a non-linear convergence factor is introduced to address the inadequacy in handling non-linear changes. Lastly, during the phase of intimidating smaller predators, the tendency of the zebra population to cluster and prematurely converge on local optima is mitigated by introducing a Cauchy mutation strategy.
Lévy flight exploration strategy
According to Equation (3), in the foraging process stage of the zebra population, iterative updates are based on the distance between the best individual position in the population and the current individual position. In this equation, factors r and I, which represent the difference in distances, have a relatively small influence on the fluctuation range, resulting in a smaller leap range for the next generation’s values. This leads to limitations in the foraging space of zebra individuals and variations in individual quality. To address this issue, this paper introduces the Lévy flight strategy [14] and “PZ”. Firstly, the Lévy flight is incorporated to replace the random number factor r in Equation (3). By adjusting the distance difference between r and I through Lévy flight, the leap range of the next generation of zebra individuals is increased, thereby expanding the foraging space of the zebra individuals and allowing the algorithm to have a broader search solution space. Secondly, “PZ” replaces the value of the previous generation’s individuals, updating the positions of other members of the population based on the position of the pioneering zebra in each iteration. This approach allows the zebra individuals to get closer to the best position based on the optimal position in each iteration, thus enhancing their optimization capability and facilitating a quicker approach to the optimal position. The formula for updating the position of population individuals is shown in Equation (7).
In this context, Levy (D) represents the Lévy flight function, which is depicted as shown in Equation (8).
In this formulation, s is a fixed constant set to 0.01, and η is another fixed constant valued at 1.5. u and v are random numbers within the interval [0,1] and follow a normal distribution. The calculation formula for σ is as shown in Equation (9):
In the equation, the value of η is also 1.5, and Λ represents the Gamma function.
In the original Zebra Optimization Algorithm (ZOA), zebras employ strategies of either fleeing or confusing the predator to avoid attacks. According to Equation (5), the hunting distance R between the zebra and the predator changes linearly during escape. This linear change results in suboptimal performance of the ZOA in nonlinear search processes of complex optimization problems, leading to premature convergence and trapping in local optima during iterations. To address this issue, this paper proposes a nonlinear parameter reduction strategy based on the cosine function. This strategy introduces a nonlinear convergence factor as the coefficient affecting the hunting distance R. The value of this nonlinear factor varies at different stages of iteration, influencing the adjustment of R differently, thereby better addressing nonlinear optimization problems. Furthermore, the introduction of this factor allows the range of the hunting distance R to decrease nonlinearly from large to small throughout the algorithm’s iteration process. This contributes to a balance between exploration and exploitation phases of the algorithm, preventing premature convergence into local optima, enhancing convergence speed, and improving the global search capability. The convergence factor (CF) is shown in Equation (10), and its incorporation is demonstrated in Equation (11).
In this context, CF represents the convergence factor, T is the maximum number of iterations, t denotes the current iteration number, and R is the hunting distance between the zebra and the predator.
To validate the enhancement of the Zebra Optimization Algorithm’s (ZOA) optimization capabilities during the iteration process through the nonlinear convergence factor, an experimental comparison was conducted between two convergence strategies. The results are depicted in Fig. 4. It is evident that ZOA’s linear convergence maintains a constant rate throughout the iteration process. This leads to the algorithm not fully exploring the entire feasible solution space in the early stages, making it prone to falling into local optima. In the later stages, the algorithm fails to sufficiently exploit the potential optimal feasible solution area, resulting in premature convergence. The nonlinear convergence strategy does not exhibit significant convergence in the initial phase. This stage primarily allows the population individuals to thoroughly explore the entire search space while also developing areas with high potential for optimal solutions, preventing the algorithm from converging prematurely into local optima. In the middle phase, the curve sharply declines, indicating that the algorithm accelerates its convergence speed upon identifying areas with potential for optimal solutions within the search space. In the latter stages of iteration, the curve’s descent slows significantly and tends towards convergence, signifying the algorithm’s gradual approach to the optimal solution and enhancement in precision. Compared to ZOA’s original convergence strategy, the nonlinear convergence strategy significantly reduces the number of iterations, substantially increases the speed of convergence, and further improves the precision of the algorithm.
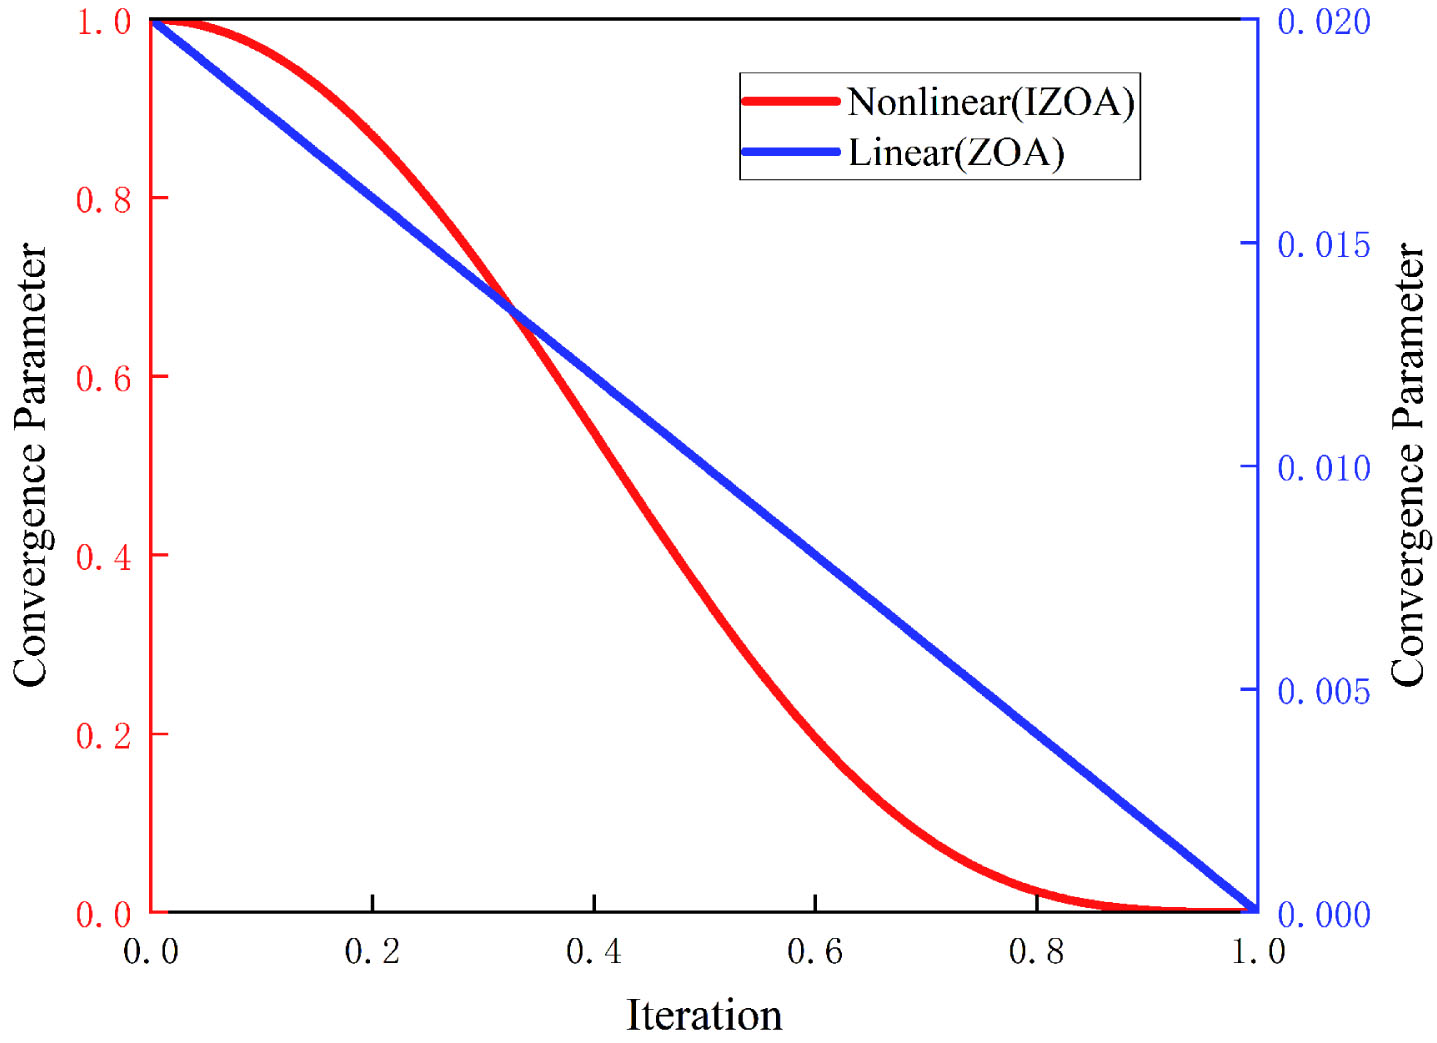
Convergence effects of different convergence strategies.
In the previous chapter, it was mentioned that when facing smaller predators, zebras adopt a strategy of clustering and intimidating the predator, with the position update of each individual based on the location of the attacked zebra. Existing zebra individuals move towards the attacked individual based on their relative positions. However, this strategy tends to make the population susceptible to local optima. At the start of the algorithm iteration, the rest of the zebra individuals quickly converge towards the attacked individual to intimidate the predator. However, in doing so, they often neglect exploring the rest of the search space, causing some of the population to be restricted to the vicinity of the currently attacked individual and limited to the current local optimum. To address this, the Cauchy mutation strategy [15] is introduced at this stage. Utilizing the smaller peak characteristic of the Cauchy distribution function, this strategy reduces the time that group individuals spend clustered together after mutation. This disperses the clustering zebra population, allowing for thorough searching around the attacked zebra and enhancing the global search capability at this stage. Additionally, the Cauchy distribution function can produce random perturbations, meaning it can generate random numbers with a wide range. This results in variable distances between some zebra individuals and the attacked individual, enhancing the population’s ability to rapidly escape local optima. Therefore, employing Cauchy mutation for random perturbation helps increase population diversity, thereby preventing the algorithm from getting trapped in local optima. Consistent with the zebra evasion phase, a nonlinear convergence factor is also employed in this stage for better optimization of nonlinear problems. The mutation process is carried out using Equations (12) and (13), with the Cauchy mutation distribution function illustrated in Fig. 5.
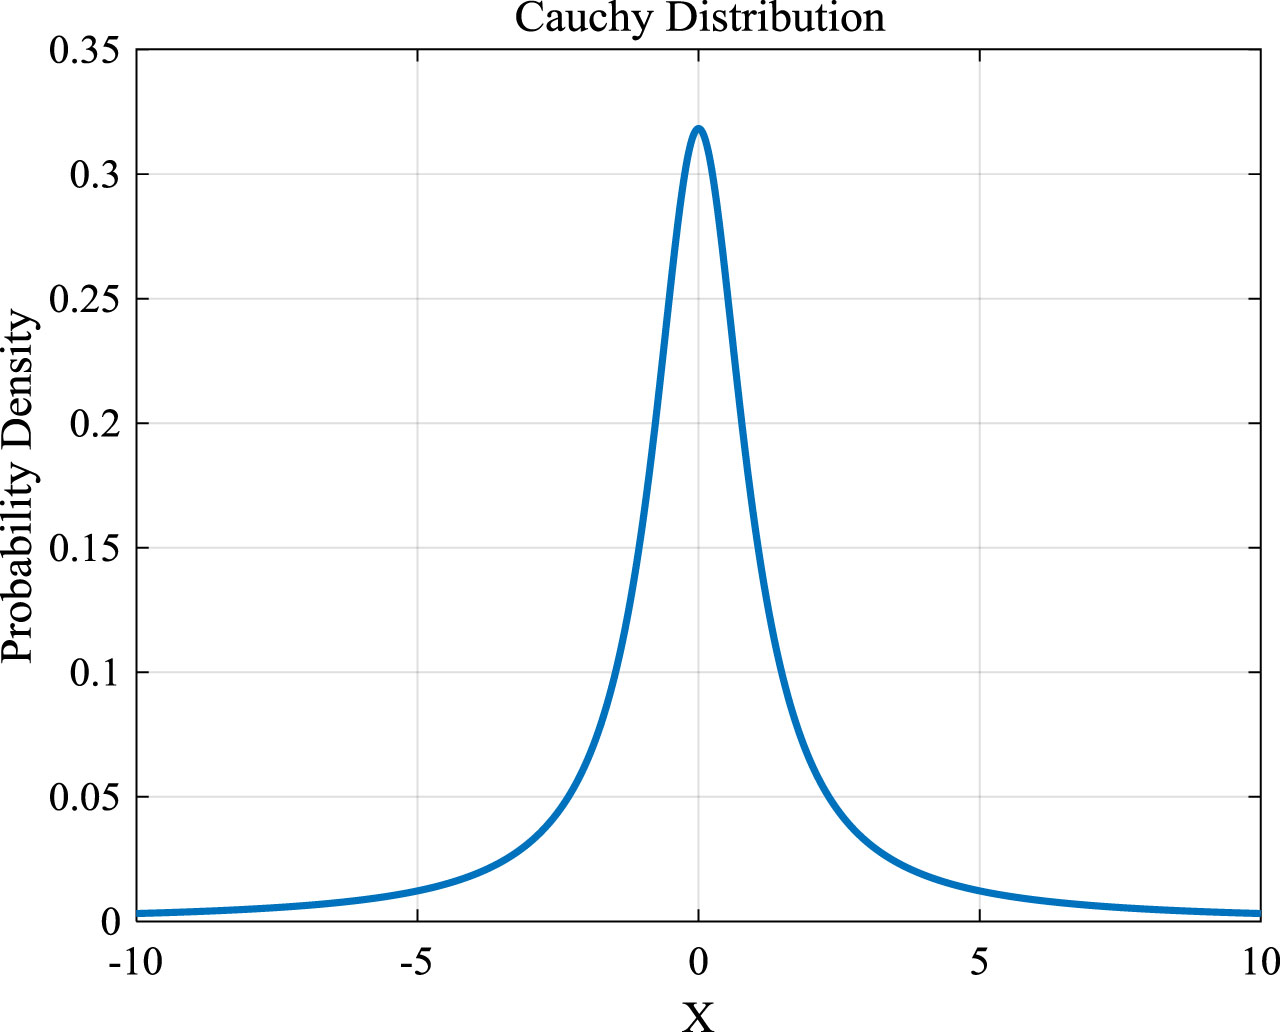
Cauchy distribution map.
Different algorithms require varying amounts of optimization time for the same optimization problem. The computational complexity of an algorithm is an important measure for assessing its execution time. This paper uses Big O notation to compare the time complexity of the ZOA and IZOA algorithms. Assuming a zebra population size of N, dimensionality of Dim, and maximum number of iterations T, with the population initialization complexity of O(N), the complexity of ZOA is calculated as O(T×N) + O(T×N×Dim). Since IOZA and ZOA have the same number of iterations, the complexity of IOZA is also calculated as O(T×N) + O(T×N×Dim).
Analysis of experimental results
This section will introduce the IZOA algorithm and the experimental test results of the comparative algorithms on the test set. Through analysis and comparison of the experimental results, the performance of IZOA and its effectiveness in finding optimal solutions in optimization problems will be evaluated. Subsequently, a rank-sum test analysis will be conducted to assess the overall performance and differences between the IZOA algorithm and other algorithms. All experiments were conducted on a desktop computer with a 13th Intel(R) Core(TM) i5-13400 (16 CPUs), ∼2.5 GHz, and 16 GB RAM, using the MATLAB 2020a platform.
Algorithm improvement performance analysis
In this section, to verify the effectiveness of four improvement strategies, these strategies were sequentially integrated into the algorithm to assess whether they progressively amend the deficiencies of ZOA [16]. The sequentially layered strategies resulted in the following algorithms: CFZOA (improved nonlinear weight convergence factor), CauchyZOA (improved nonlinear weight convergence factor and Cauchy mutation), EZOA (improved nonlinear weight convergence factor, Cauchy mutation, and enhanced exploration formula), and IZOA. The four improved algorithms were compared with ZOA using 30-dimensional CEC-2017 test functions, with some results illustrated in Fig. 6. Following the improvement of the nonlinear weight convergence factor, there was a notable performance enhancement in multimodal nonlinear optimization problems such as F26 and F27, evident before reaching 50 iterations. After improving the Cauchy mutation, the iteration curves of CauchyZOA were closely aligned with those of CFZOA, demonstrating certain improvements in some optimization problems. The introduction of the enhanced exploration formula led to significant improvements in the convergence arc of the EZOA iteration curves across various optimization problems. The optimal fitness values showed varying degrees of reduction compared to those of CauchyZOA, particularly noticeable within the first 100 iterations, with rapid convergence benefits that tended towards stable convergence by 300 iterations. This demonstrates that the “PZ” introduced in the enhanced exploration formula significantly improved optimization performance during iterations. Lastly, it is evident from the figures that the IZOA algorithm not only performed better compared to EZOA but also optimized to obtain the optimal values within 250 iterations. This suggests that the Lévy flight strategy has enhanced the global search capability of the zebra population, as well as its optimization capability, enabling the improved optimization algorithm to quickly converge to the optimal values. The analysis above indicates that IZOA, with the four layered improvement strategies, achieves faster convergence speed and precision compared to other algorithms.

Improved strategy comparison experiment.
The test functions include the commonly used function suites CEC-2017 [17] and CEC-2022 [18]. Both suites comprise four types of functions: unimodal, multimodal, hybrid, and composite functions. CEC-2017 consists of 30 test functions, as shown in Table 1. CEC-2022 includes 12 test functions, as depicted in Table 2.
CEC-2017 test functions
CEC-2017 test functions
CEC-2022 test functions
Competitive algorithms and parameterization
This section tests and compares IZOA with 12 advanced algorithms and other ZOA improvement algorithms on CEC-2017 and CEC-2022 to verify their effectiveness. The algorithms compared include AVOA [19] (African Vultures Optimization Algorithm), DBO [18] (Dung Beetle Optimizer), GSA (Gravitational Search Algorithm), GWO (Grey Wolf Optimizer), AO (Aquila Optimizer), MFO [20] (Moth-Flame Optimization Algorithm), WOA (Whale Optimization Algorithm), HHO (Harris Hawk Optimization), SCSO [21] (Sand Cat Swarm Optimization), CPSOGSA [22], CSA (Crow Search Algorithm), ZOA (Zebra Optimization Algorithm), CZOA, IIZOA, and IZOA. The parameter settings for each algorithm are shown in Table 3.
Parameterization of the contrast algorithm
Parameterization of the contrast algorithm
To test and compare the performance of IZOA and 12 other algorithms in solving high-dimensional complex problems, experiments were conducted at 100 dimensions using CEC2017. The experimental results are shown in Appendix 1, and the results curves for some functions are depicted inFig. 7.
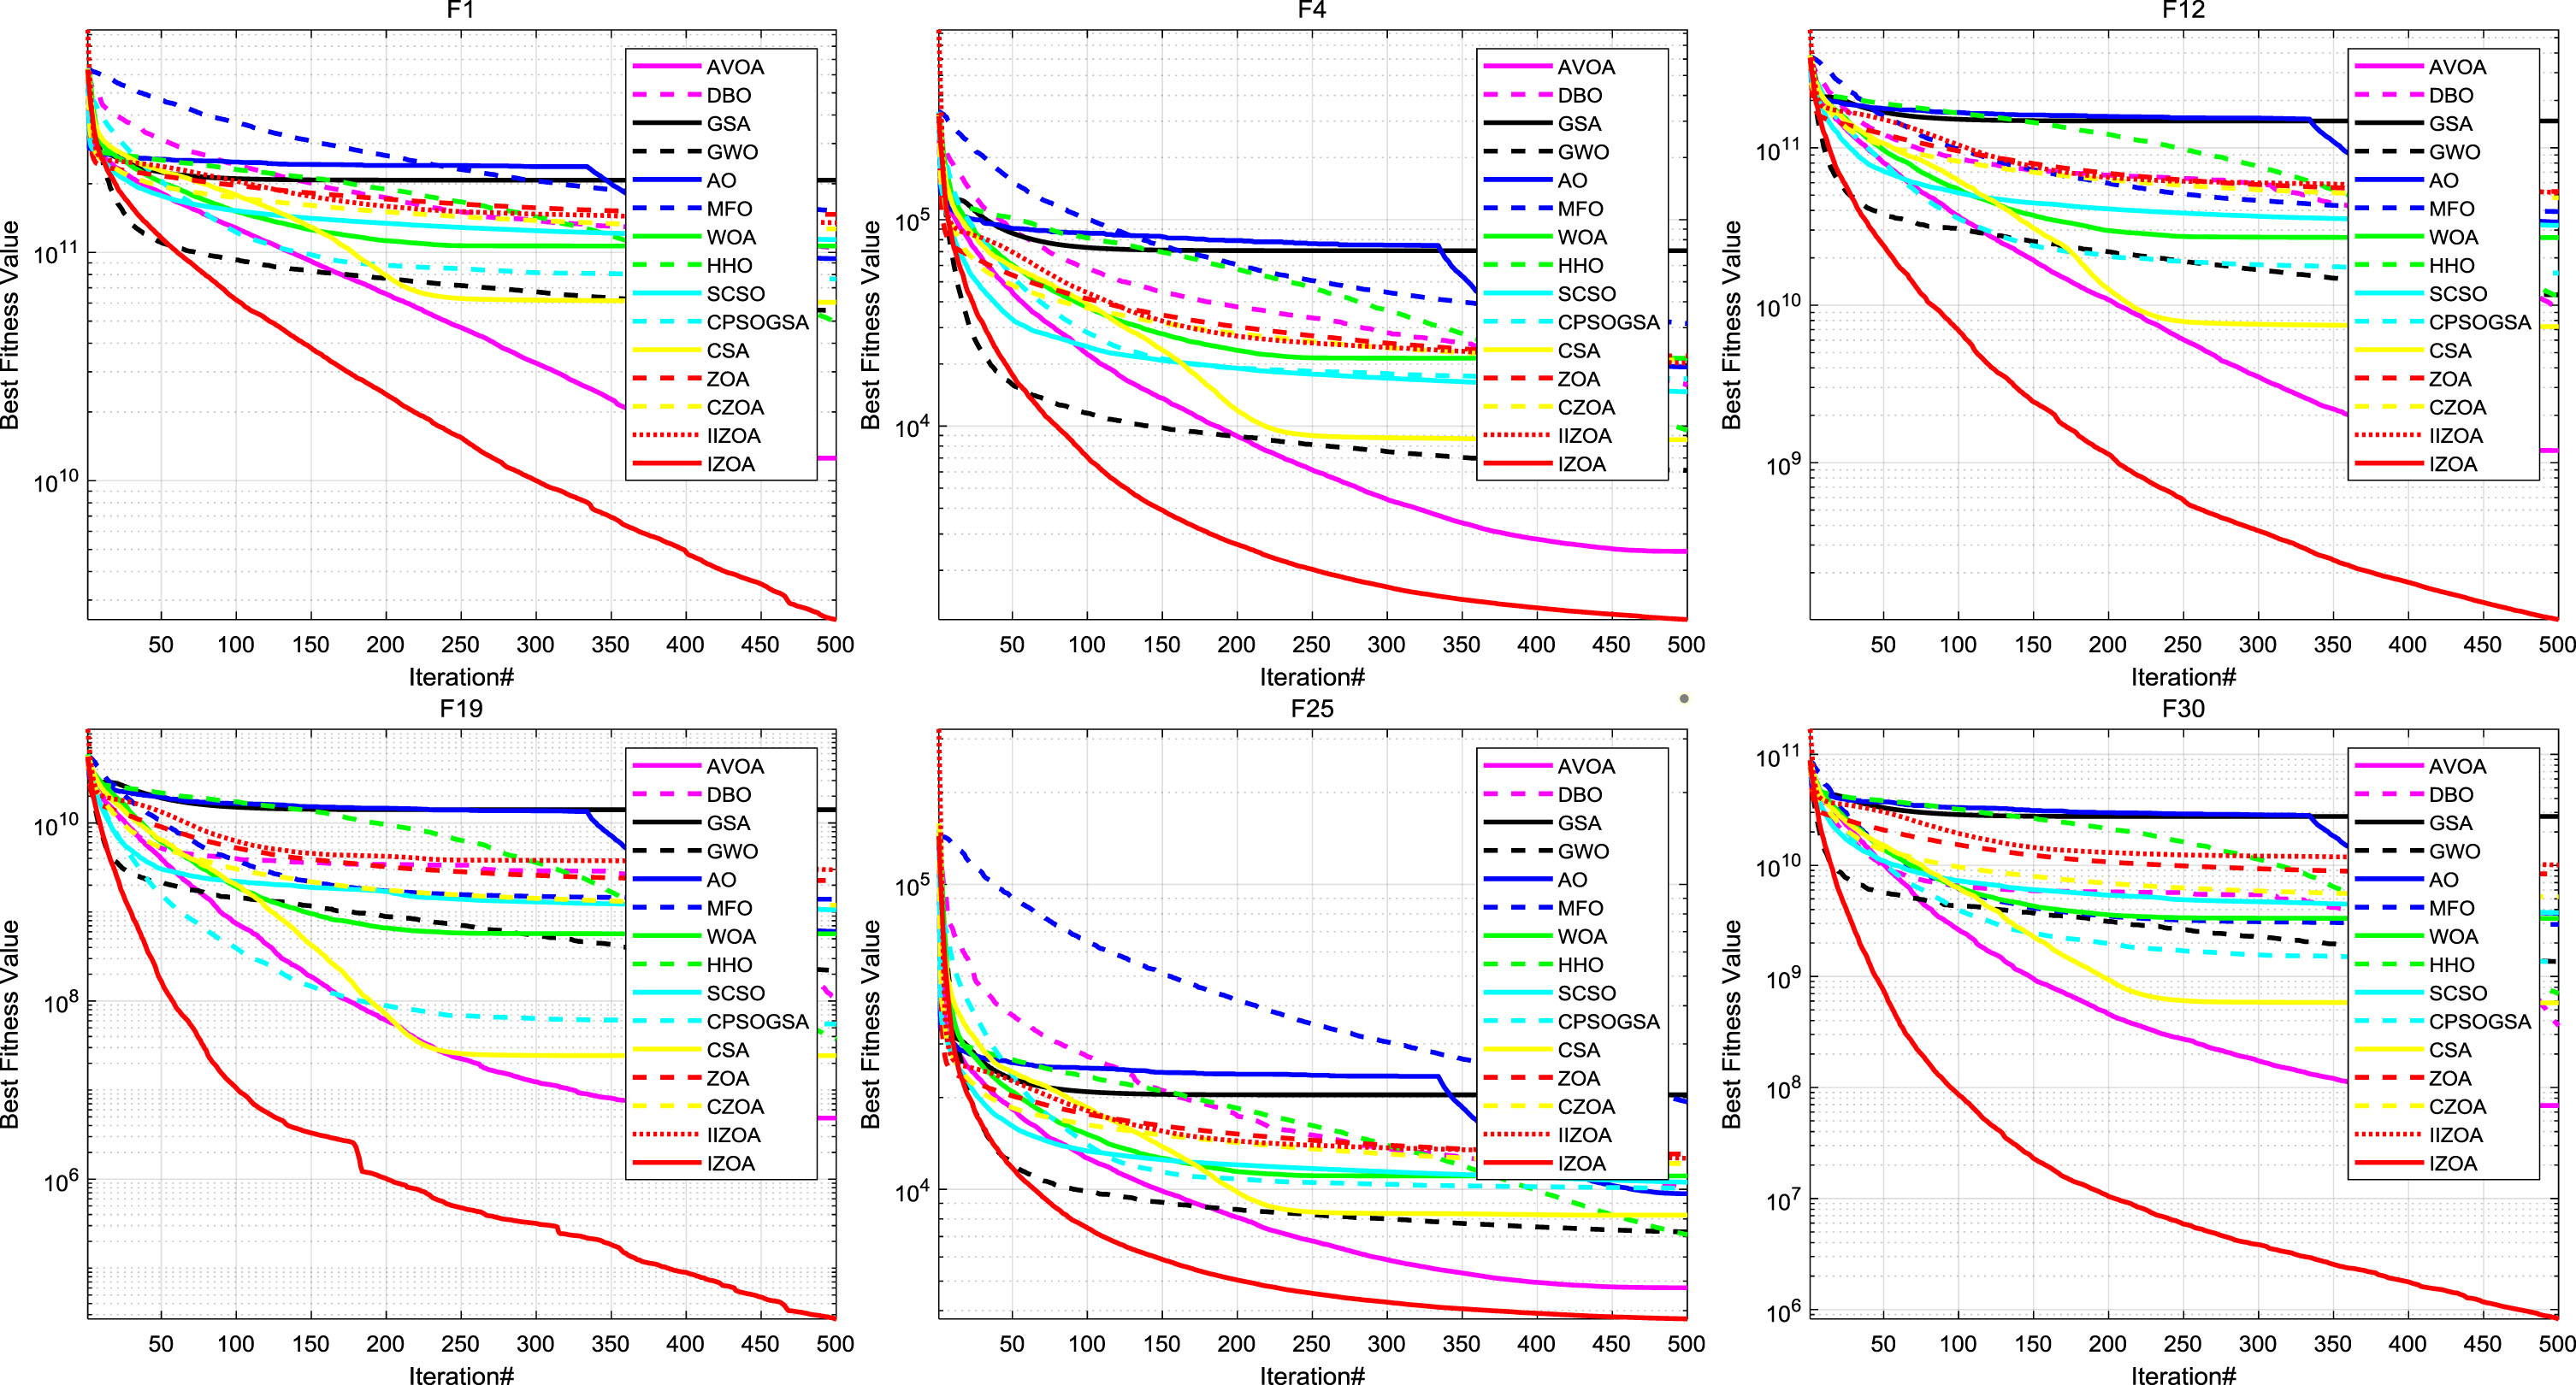
CEC-2017 test function comparison curve (Dim = 100).
According to the experimental data in Appendix 1, in the 100-dimensional tests, IZOA ranked first in the average results for 17 functions and second for 8 functions. This demonstrates IZOA’s excellent optimization capability, surpassing other mainstream algorithms. It performed particularly well on functions F21 to F30. This indicates that IZOA can effectively address both low-dimensional and high-dimensional complex multimodal optimization problems, exhibiting broad applicability and stable performance.
As evident from Fig. 7, the convergence speed of ZOA is at a medium level. After improvements, IZOA’s convergence speed has significantly increased, surpassing the other 12 algorithms and existing improvements to the ZOA algorithm. It exhibits superior optimization capabilities, avoiding local optima in most test functions. Although it briefly encountered local optima in functions like F12 and F19, it quickly escaped to reach the global optimum. Clearly, by incorporating improvement strategies into ZOA, IZOA has achieved faster convergence speeds, stronger global optimization capabilities, and higher convergence precision.
The performance results of all algorithms were statistically analyzed to visually discern their ranking differences. Rankings were categorized into five groups: best average ranking, second best, third, other average rankings, and worst average rankings, as shown in Fig. 8. From Fig. 8, it is evident that compared to other algorithms, IZOA achieved better ranking results, with the highest number of top average rankings and no functions ranking worst on average.
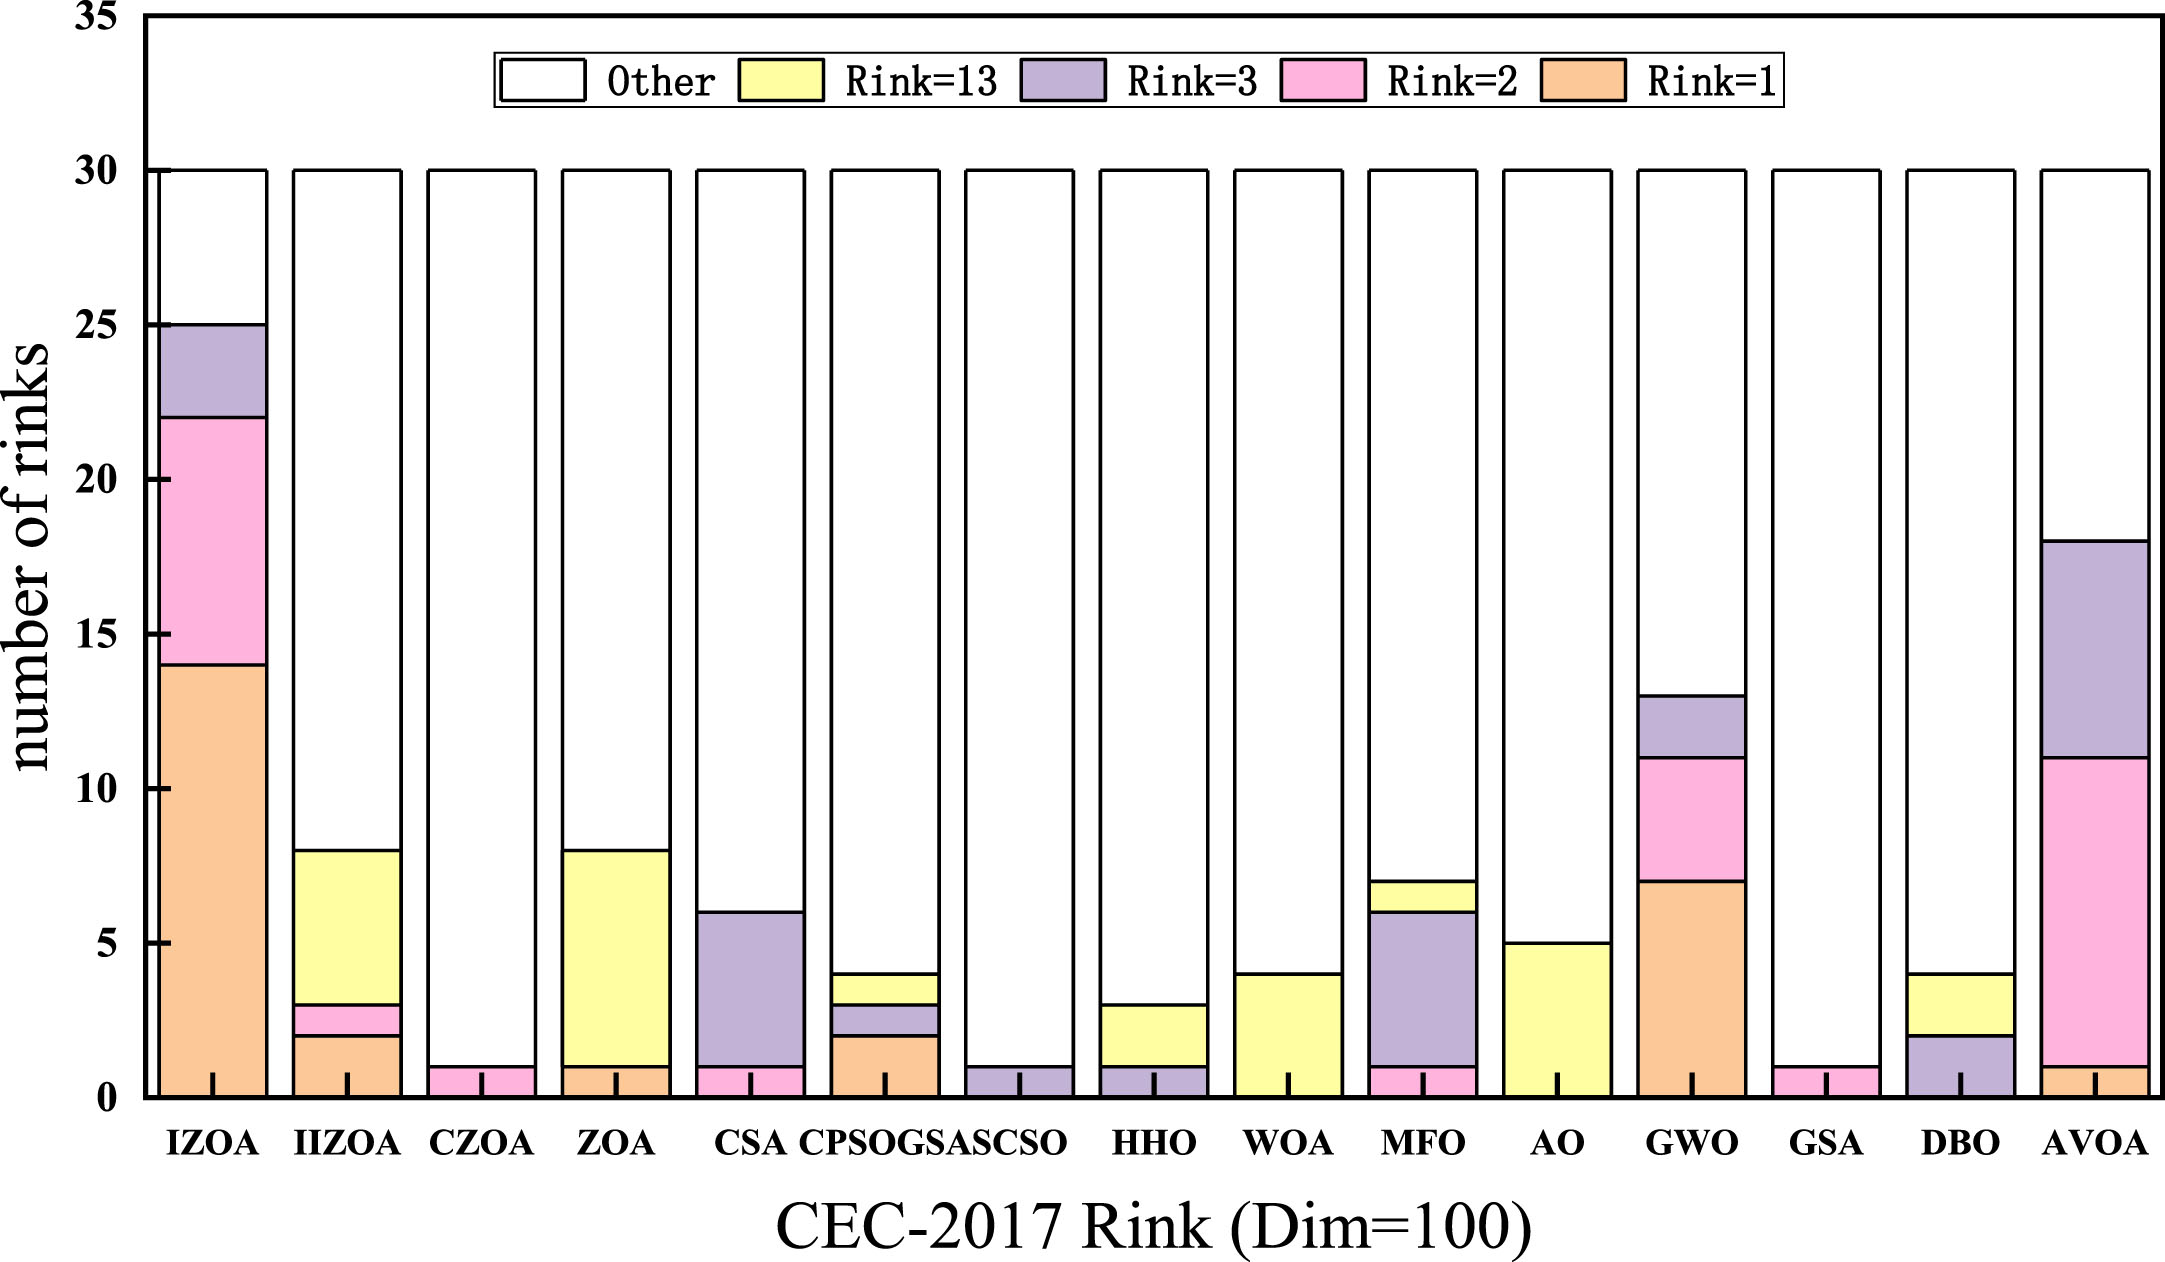
Ranking statistics of different algorithms to optimize CEC-2017 test function results.
This section conducts 20-dimensional experiments and compares the afore-mentioned 13 algorithms using the CEC-2022 test function set. The experimental data are shown in Appendix 2, and some convergence curves are depicted in Fig. 9. In the 12 test functions, IZOA ranked first on average in 4 functions, second in 4, and third in 2, with no functions ranking worst. From the experimental results, it is clear that IZOA exhibits superior optimization performance on CEC-2022, with faster convergence speed, higher precision, and better global optimization capabilities.
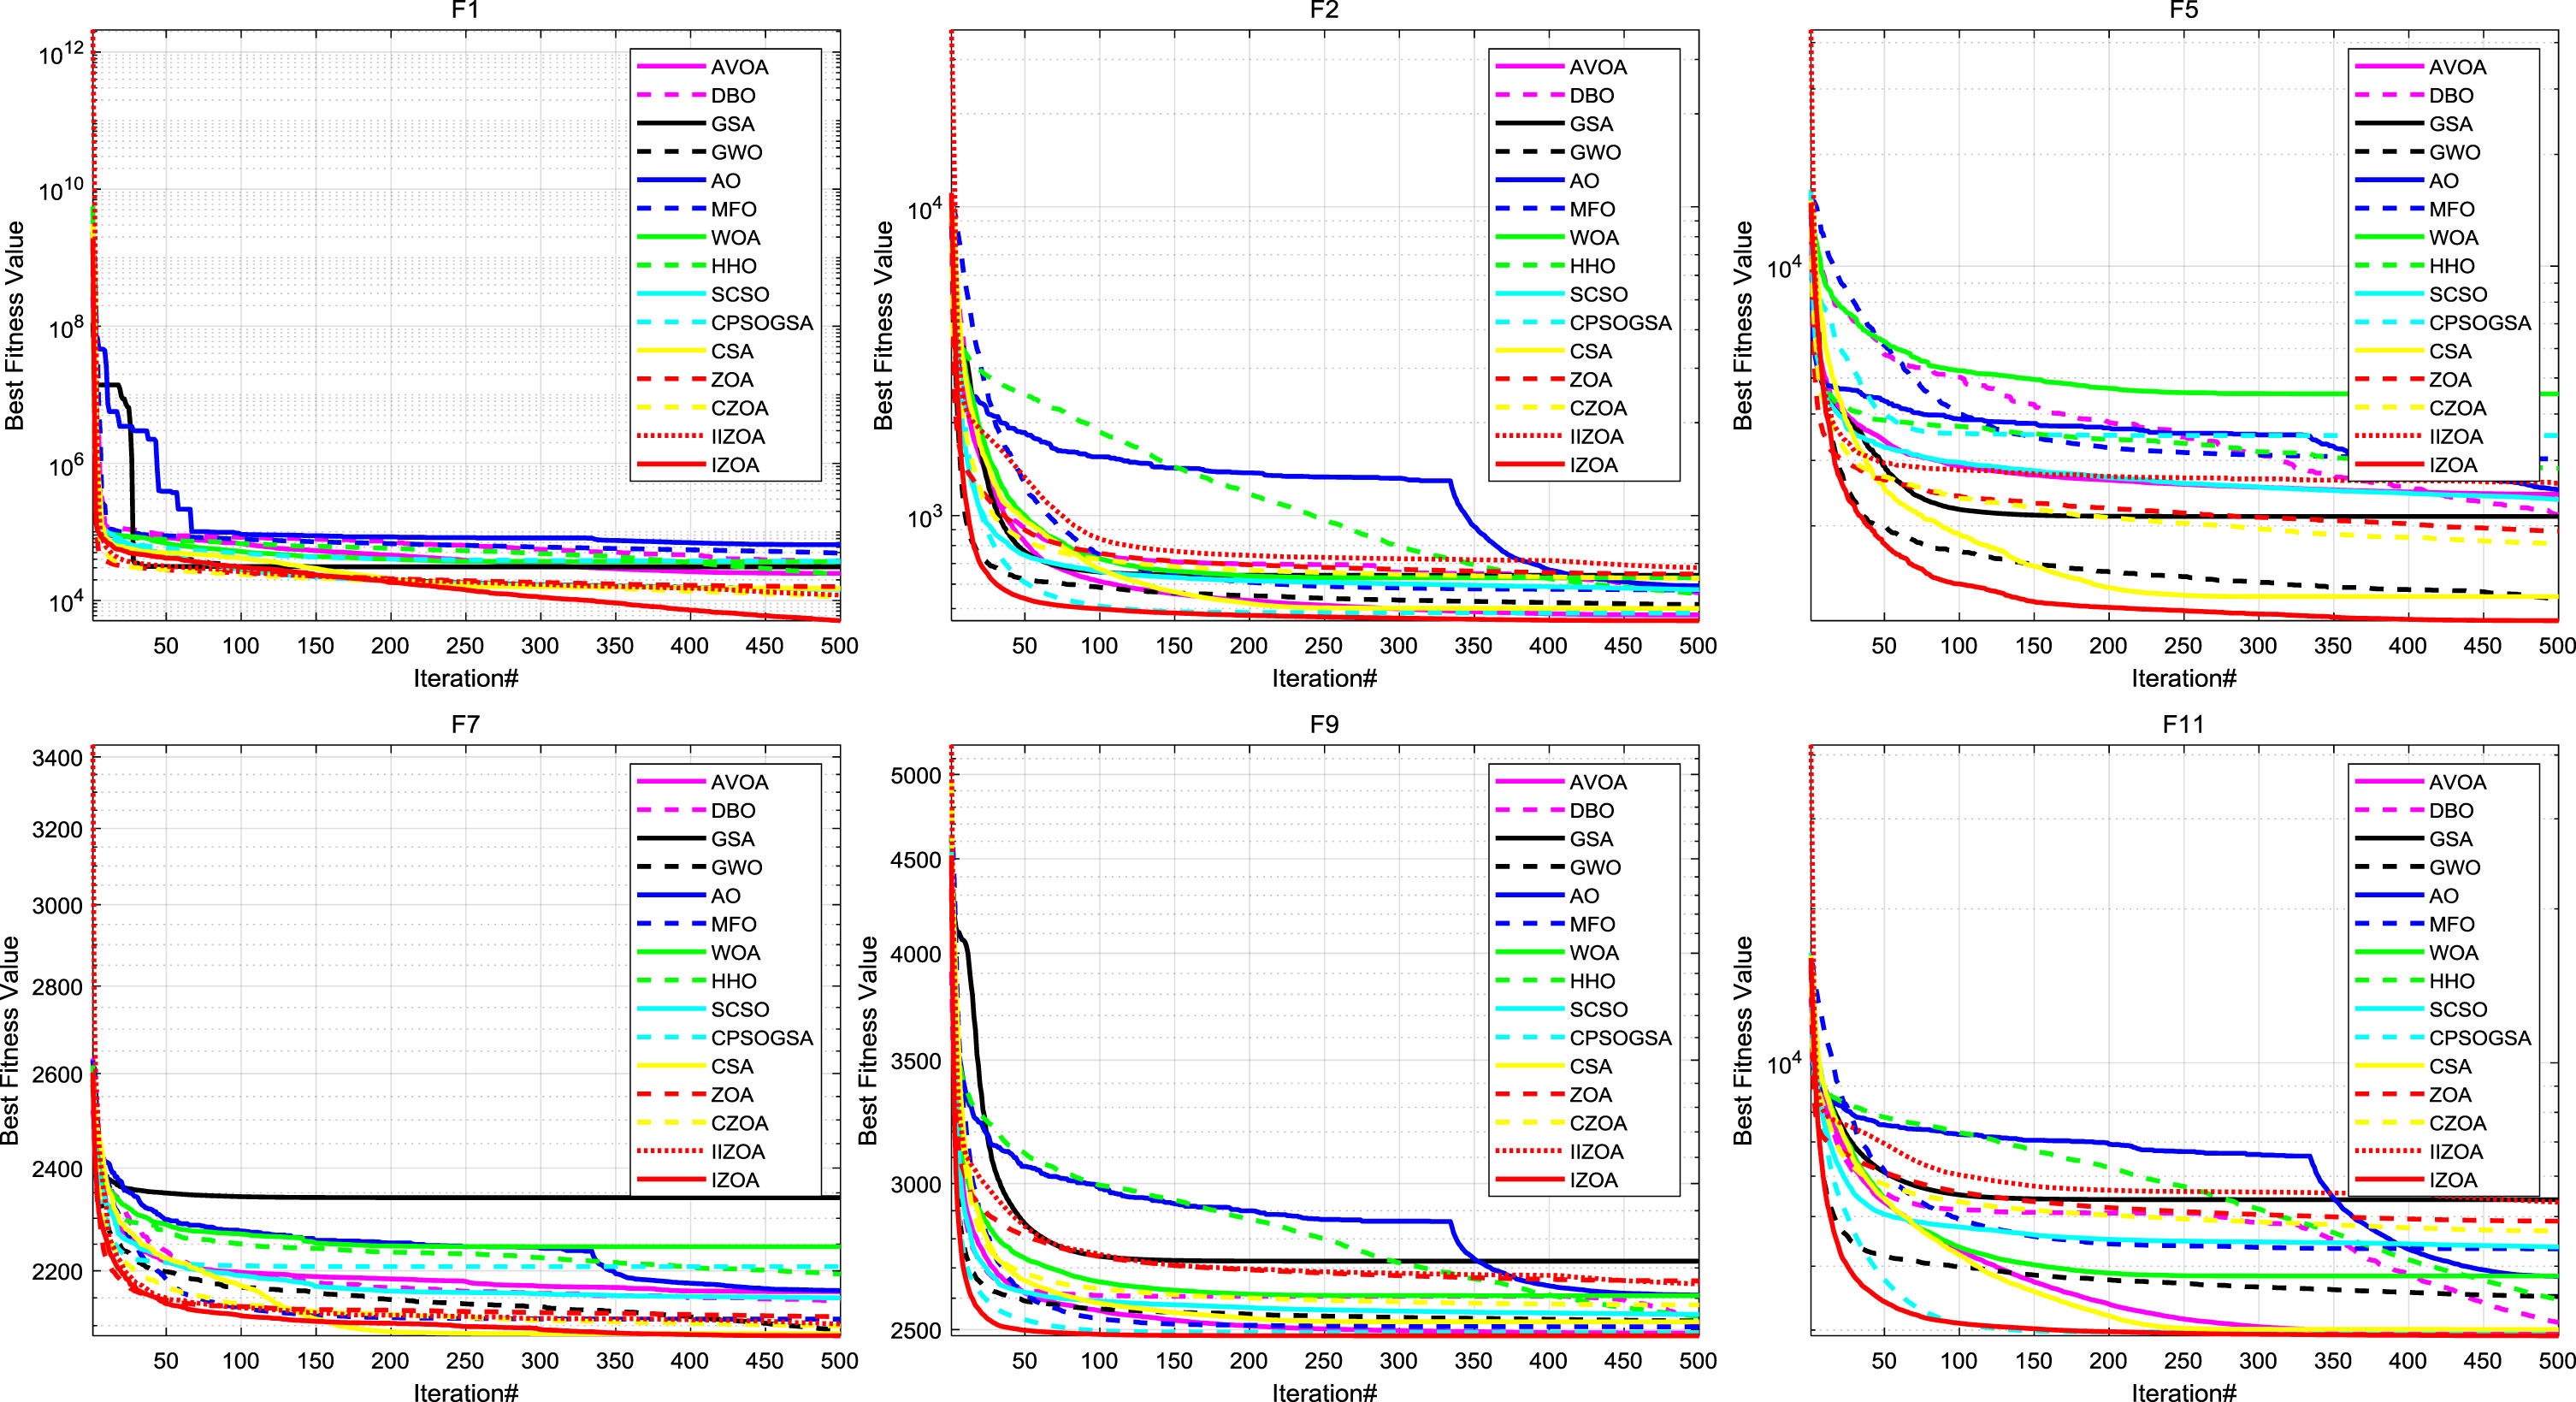
CEC-2022 test function comparison curve (Dim = 20).
The performance results of all algorithms were statistically analyzed to visually display their ranking differences. The rankings were categorized into five levels: best average ranking, second best, third, other average rankings, and worst average rankings, as shown in Fig. 10. As illustrated in Fig. 10, compared to other algorithms, IZOA achieved better ranking results, with the highest number of best average rankings and no functions ranking worst onaverage.
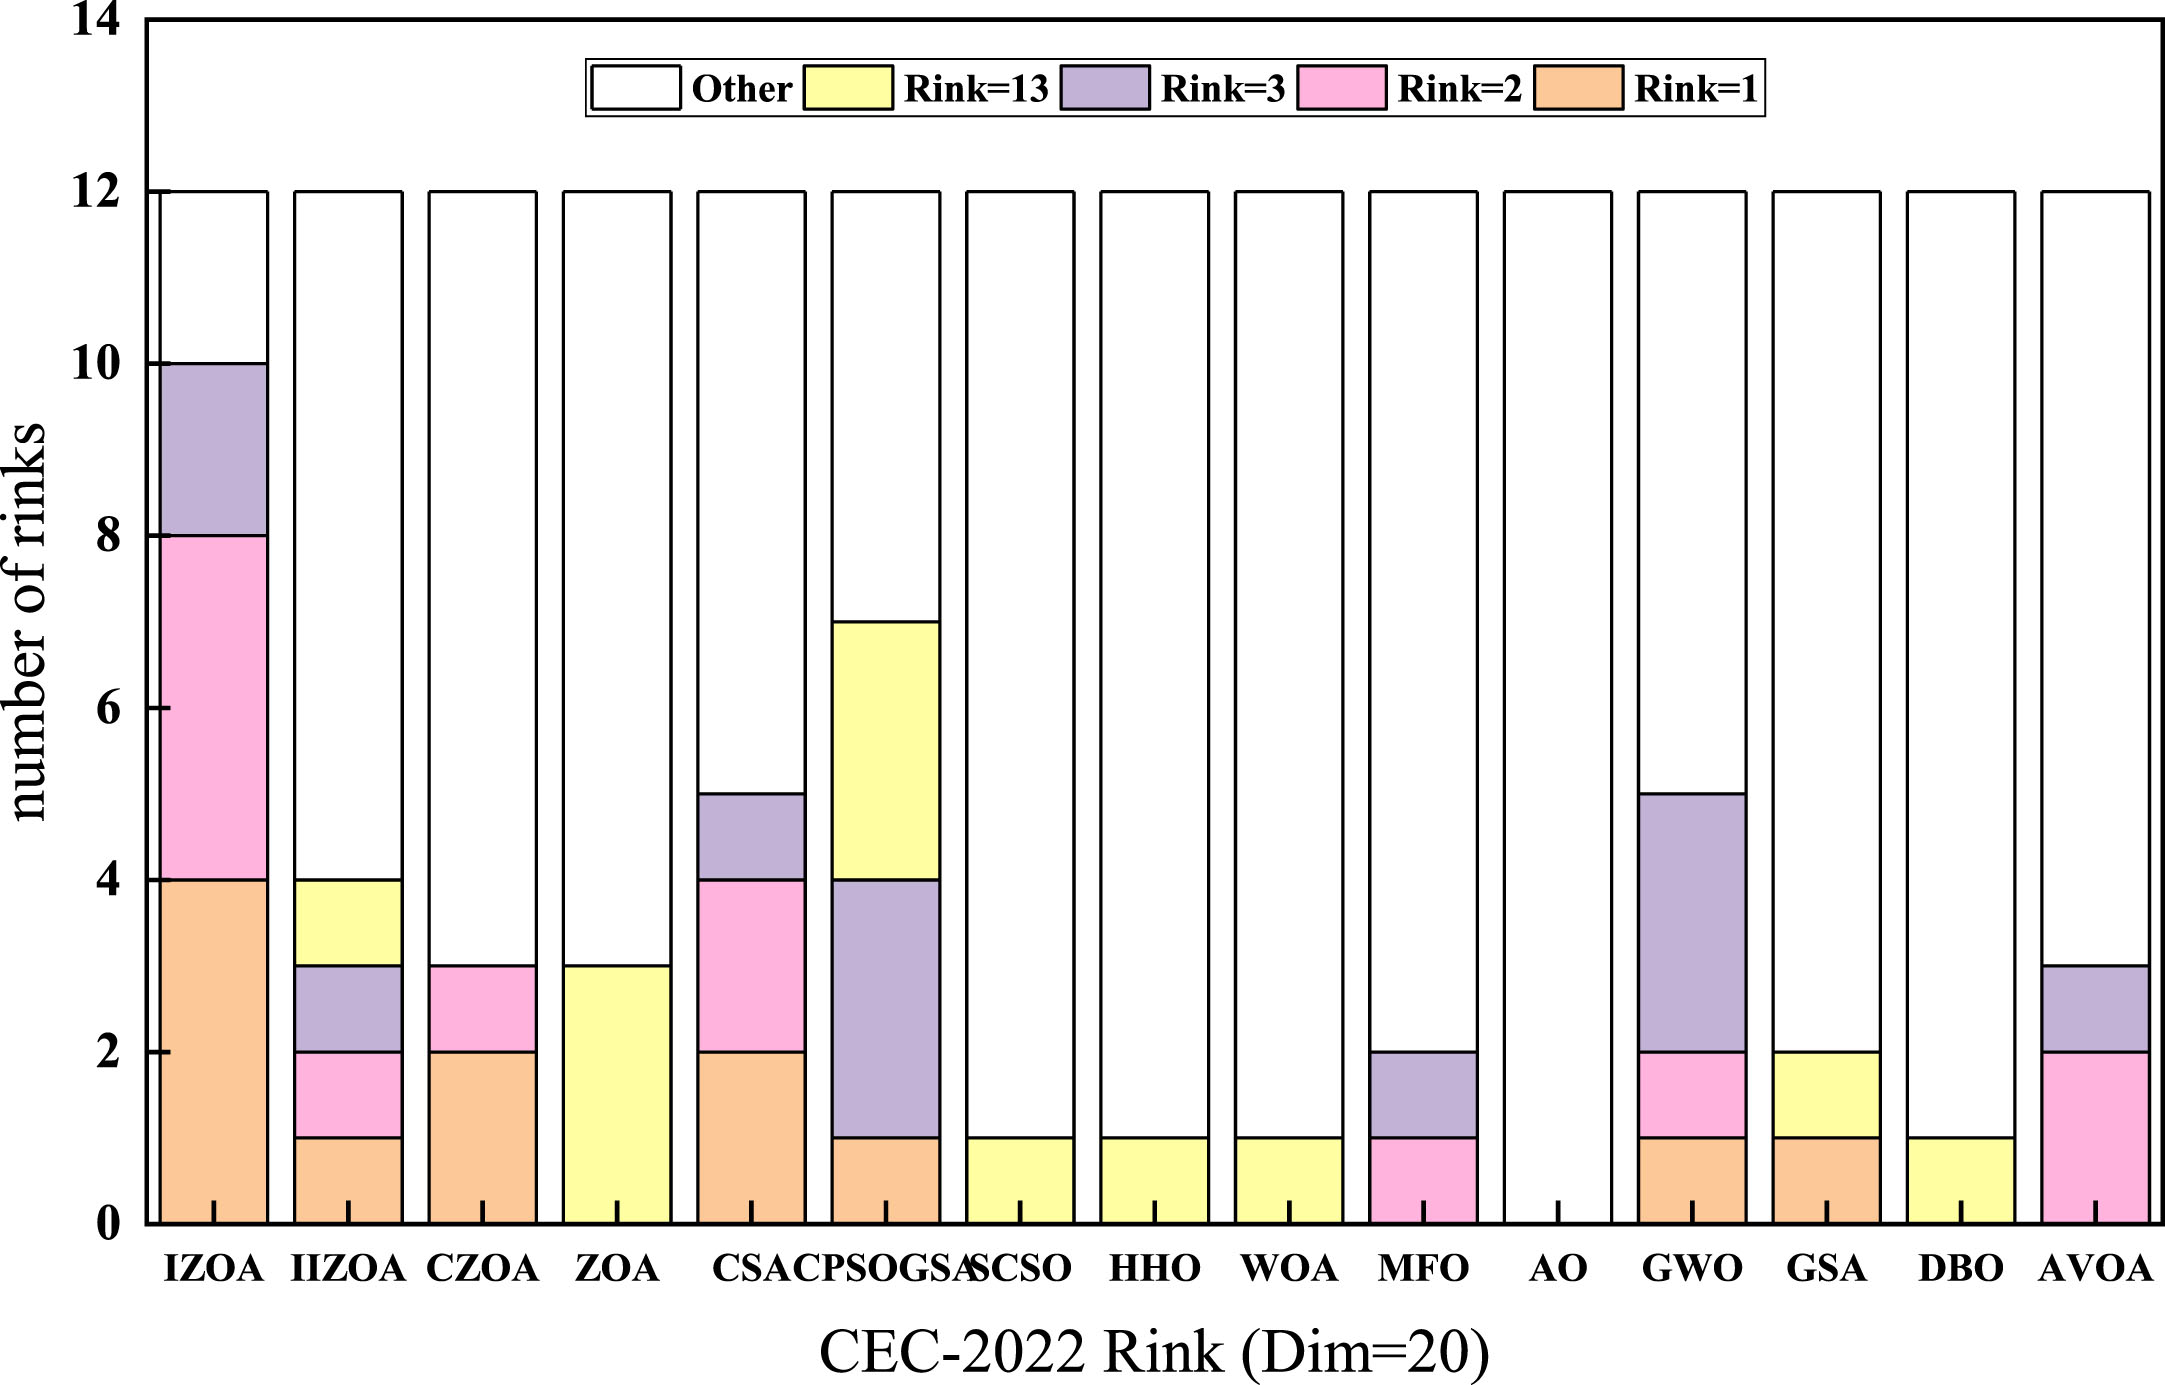
Ranking statistics of different algorithms to optimize CEC-2022 test function results.
In this section, statistical analyses using the Wilcoxon Signed-Rank Test and the Friedman Test are conducted to analyze the experimental results, specifically to statistically discern the differences between the Improved Zebra Optimization Algorithm (IZOA) and other competing algorithms.
Rank-sum test
In this section, to validate the superiority of the algorithm, the Wilcoxon rank-sum test is employed to verify whether the results of each run of IZOA exhibit significant differences from other algorithms at a significance level of p = 5% [23]. The null hypothesis H0 states that there are no significant differences between the two algorithms. When P > 5%, the null hypothesis is accepted, indicating similar performance between the two algorithms without significant differences. When P < 5%, the null hypothesis is rejected, suggesting significant differences between the two algorithms. N/A indicates comparable performance between the two algorithms, making comparison infeasible. The rank-sum tests of IZOA against the other 12 algorithms in the 100-dimensional experiments on CEC-2017 and the 20-dimensional experiments on CEC-2022 are shown in Appendix 3 to Appendix 4. Values exceeding 0.05 are bolded for ease of observation.
From Appendix 3 to Appendix 4, it is apparent that there are few bolded data for IZOA, indicating that IZOA does not closely resemble other algorithms and there are significant differences. This demonstrates that IZOA, with its improvement strategies, performs optimally among mainstream algorithms, showcasing the effectiveness of thesestrategies.
Friedman test
IZOA and other algorithms were ranked according to their experimental results on CEC-2017 and CEC-2022 using the Friedman average rank test, as shown in Table 4. According to the table, IZOA has the lowest values in both Average Rank and Overall Rank in the test function set experiments, with its Average Rank significantly lower than that of other algorithms. This indicates that IZOA’s performance is superior to that of other algorithms.
Friedman mean rank test results
Friedman mean rank test results
In the preceding sections, experimental results have demonstrated the superior performance of IZOA compared to other algorithms. However, algorithms detached from practical optimization problems may lack practical significance. Therefore, in this section, IZOA will be applied to the classic engineering problem of Roller Bearing Design (REBD) to assess the algorithm’s practical effectiveness. By solving this real optimization problem, the performance of IZOA will be compared with the previously mentioned 13 optimization algorithms including AVAO, DBO, GSA, GWO, AO, MFO, WOA, HHO, SCSO, GPSOGSA, CSA, ZOA, CZOA, ZOA, and IZOA.
Design problems of rolling bearings
The rolling bearing problem is more complex than the aforementioned optimization problems. It involves more optimization parameters and a higher degree of complexity in its mathematical model. The performance requirements for optimization algorithms are therefore higher. The ability of bearing support loads is constrained by ten parameters: the pitch circle diameter (Dm), ball diameter (Db), curvature coefficients of the outer and inner rings (fo and fi), total number of balls (Z), e, ɛ, ζ,
KD
max, and
KD
min. The details of this optimization problem are outlined below. Consider:
Minimize:
Subject to: φ0
Where,
φ0
T = D - d - 2D b , D = 160, d = 90, B w = 30,
Parameters range:
The optimization results, as shown in Table 5, demonstrate that even when confronted with the more complex rolling bearing design problem, IZOA is capable of providing a superior solution compared to the other 12 algorithms. Its optimization value of 16958.2022869 ranks first among all algorithms.
Comparison of results of rolling bearing design problems
Comparison of results of rolling bearing design problems
The integration of the Improved Zebra Optimization Algorithm (IZOA) with a Long Short-Term Memory (LSTM) neural network is a novel approach to enhance predictive modeling, particularly in the context of renewable energy forecasting. Using a dataset of over 2000 records of onshore wind power generation from Spain in January 2015 for experimental validation, this hybrid approach aims to demonstrate the efficacy of IZOA in optimizing the performance of LSTM models.
LSTM network model
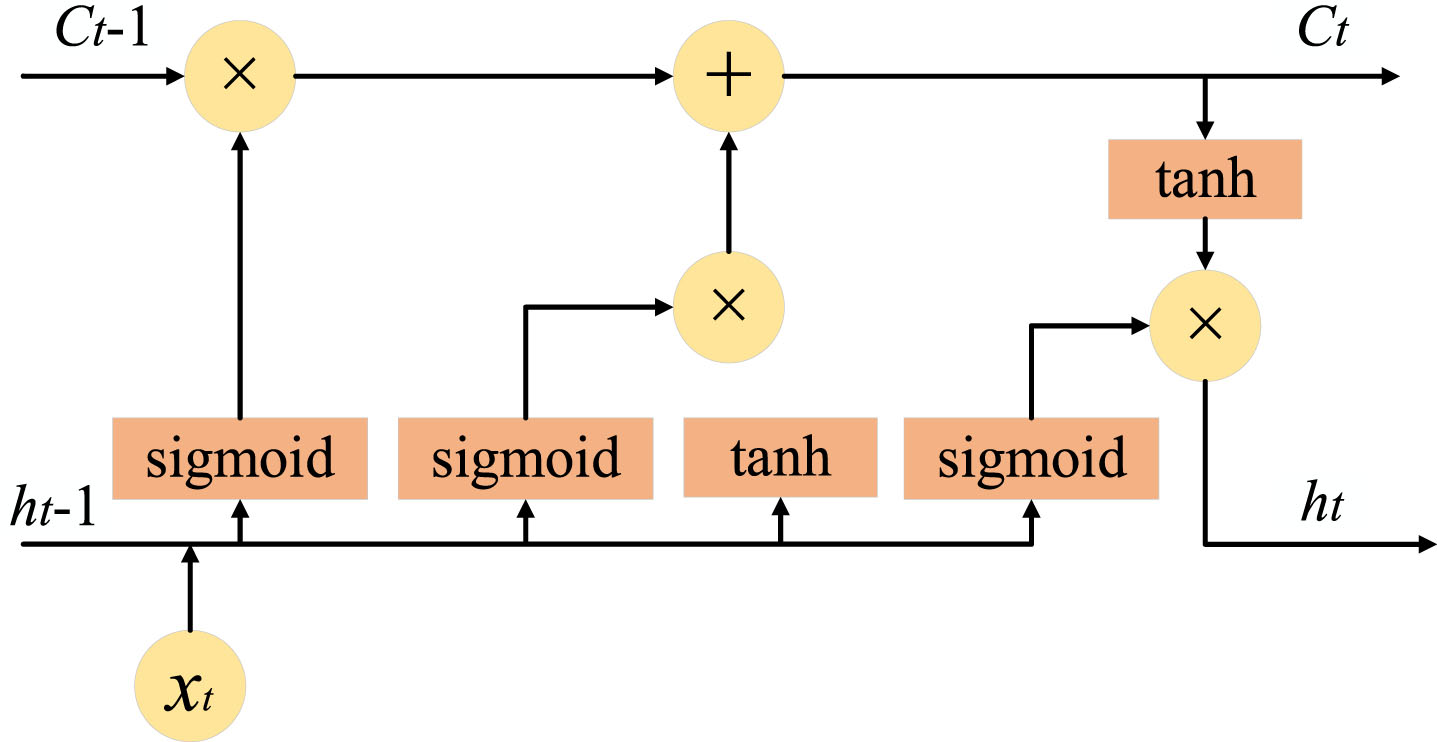
The Long Short-Term Memory model (LSTM) represents an advancement over traditional Recurrent Neural Network (RNN) architectures, addressing critical issues such as gradient explosion and vanishing, inherent in conventional RNNs. It comprises three fundamental components: the forget gate, the input gate, and the output gate. These elements are integral to its functionality, facilitating the regulation of information flow through the network. The structural design of the LSTM, which enables efficient handling of these operations, is illustrated in Fig. 12.

Rolling bearing structure diagram.
LSTM network structure diagram.
The forget gate is responsible for determining which information should be retained or discarded from the cell state. Its operation involves receiving the output from the hidden layer of the previous time step and the input from the current time step. Based on these inputs, the forget gate computes a value ranging between 0 and 1, which signifies the proportion of information to be discarded. The mathematical expression of the forget gate is represented in Equations (14) and (15). These equations typically involve a sigmoid function that processes the combined input from the current input and the previous hidden state, resulting in a decision on the extent to which each number in the cell state is forgotten or retained.
Within this framework, W f denotes the weight matrix associated with the forget gate; b f represents the bias term; and σ signifies the sigmoid activation function.
The input gate is designed to incorporate filtered new information into the cell state, a process achieved through the combined action of multiple function layers, including sigmoid and tanh. The sigmoid function layer determines the degree of selection for new information, while the tanh function is responsible for generating candidate values for this new information. The computational formulas are presented as Equations (16) to (18).
In this framework, matrices W
i
and W
c
are tailored for the sigmoid and tanh function layers respectively, while b
i
and b
c
represent the bias terms associated with both the sigmoid and tanh function layers. The tanh function serves as a hyperbolic tangent activation function. Additionally, the cell state is updated through the forget gate and the input gate, based on the cell state from the previous moment and the current input information. The formula for this update process is as follows:
The output gate serves to filter crucial information from the current cell state, forming a new hidden layer. This is achieved initially by determining the output of the cell state through the sigmoid function layer, followed by an adjustment via the tanh function to derive the new hidden layer h
t
, The mathematical expression for this process is represented by Equations (20) and (21):
In this context, W o represents the weight matrix of the output gate, b o while denotes the associated bias term.
Merging the respective advantages of IZOA and LSTM, this study introduces the IZOA-LSTM neural network model, tailored for the predictive needs of wind power generation. The algorithmic prediction flow chart of this model is illustrated in Fig. 13. This neural network model employs IZOA for the optimization of LSTM network parameters, subsequently integrating these optimized parameters into the LSTM model to enhance the predictive accuracy of the network model.

IZOA Forecasting Flow chart.
To further validate the predictive performance of the model, this experiment compares the forecast results of the IZOA-LSTM neural network with those of the classical LSTM network and other ZOA-improved LSTM networks (CZOA-LSTM, IIZOA-LSTM). The dataset is divided such that the first 70% serves as the training set, with the remaining 30% used as the test set for the model with optimally tuned parameters. The initial parameters for the LSTM model are set as follows: an initial learning rate of 0.001, an L2 regularization coefficient of, a training period of 35 cycles, and a number of hidden units set at 35. The optimal parameters for the LSTM are determined using the ZOA and IZOA algorithms, with the results of this optimization presented in Table 6.
Optimum parameter table
Optimum parameter table
To assess the predictive performance of IZOA-LSTM, this experiment uses three common metrics in neural regression models: Mean Absolute Error (MAE), Root Mean Square Error (RMSE), and Mean Absolute Percentage Error (MAPE) to evaluate the algorithm. Smaller values of these errors indicate more accurate predictions. The formulas for these three evaluation metrics are provided in Equations (22) to (24).
The predictive results of the original LSTM network, ZOA-improved LSTM network, CZOA-improved LSTM network, IIZOA-improved LSTM network, and IZOA-improved LSTM network are shown in Fig. 14, and the evaluation results of these algorithms are presented in Table 7. As shown in Fig. 14, the prediction curves of the original LSTM network do not align well with the actual curves. The prediction curves of the ZOA-improved LSTM network align better with the actual curves than the original LSTM, and the prediction curves of the CZOA and IIZOA-improved LSTM networks align even better than those of the ZOA-improved LSTM. The prediction curve of the IZOA-improved LSTM network almost perfectly matches the actual curve.
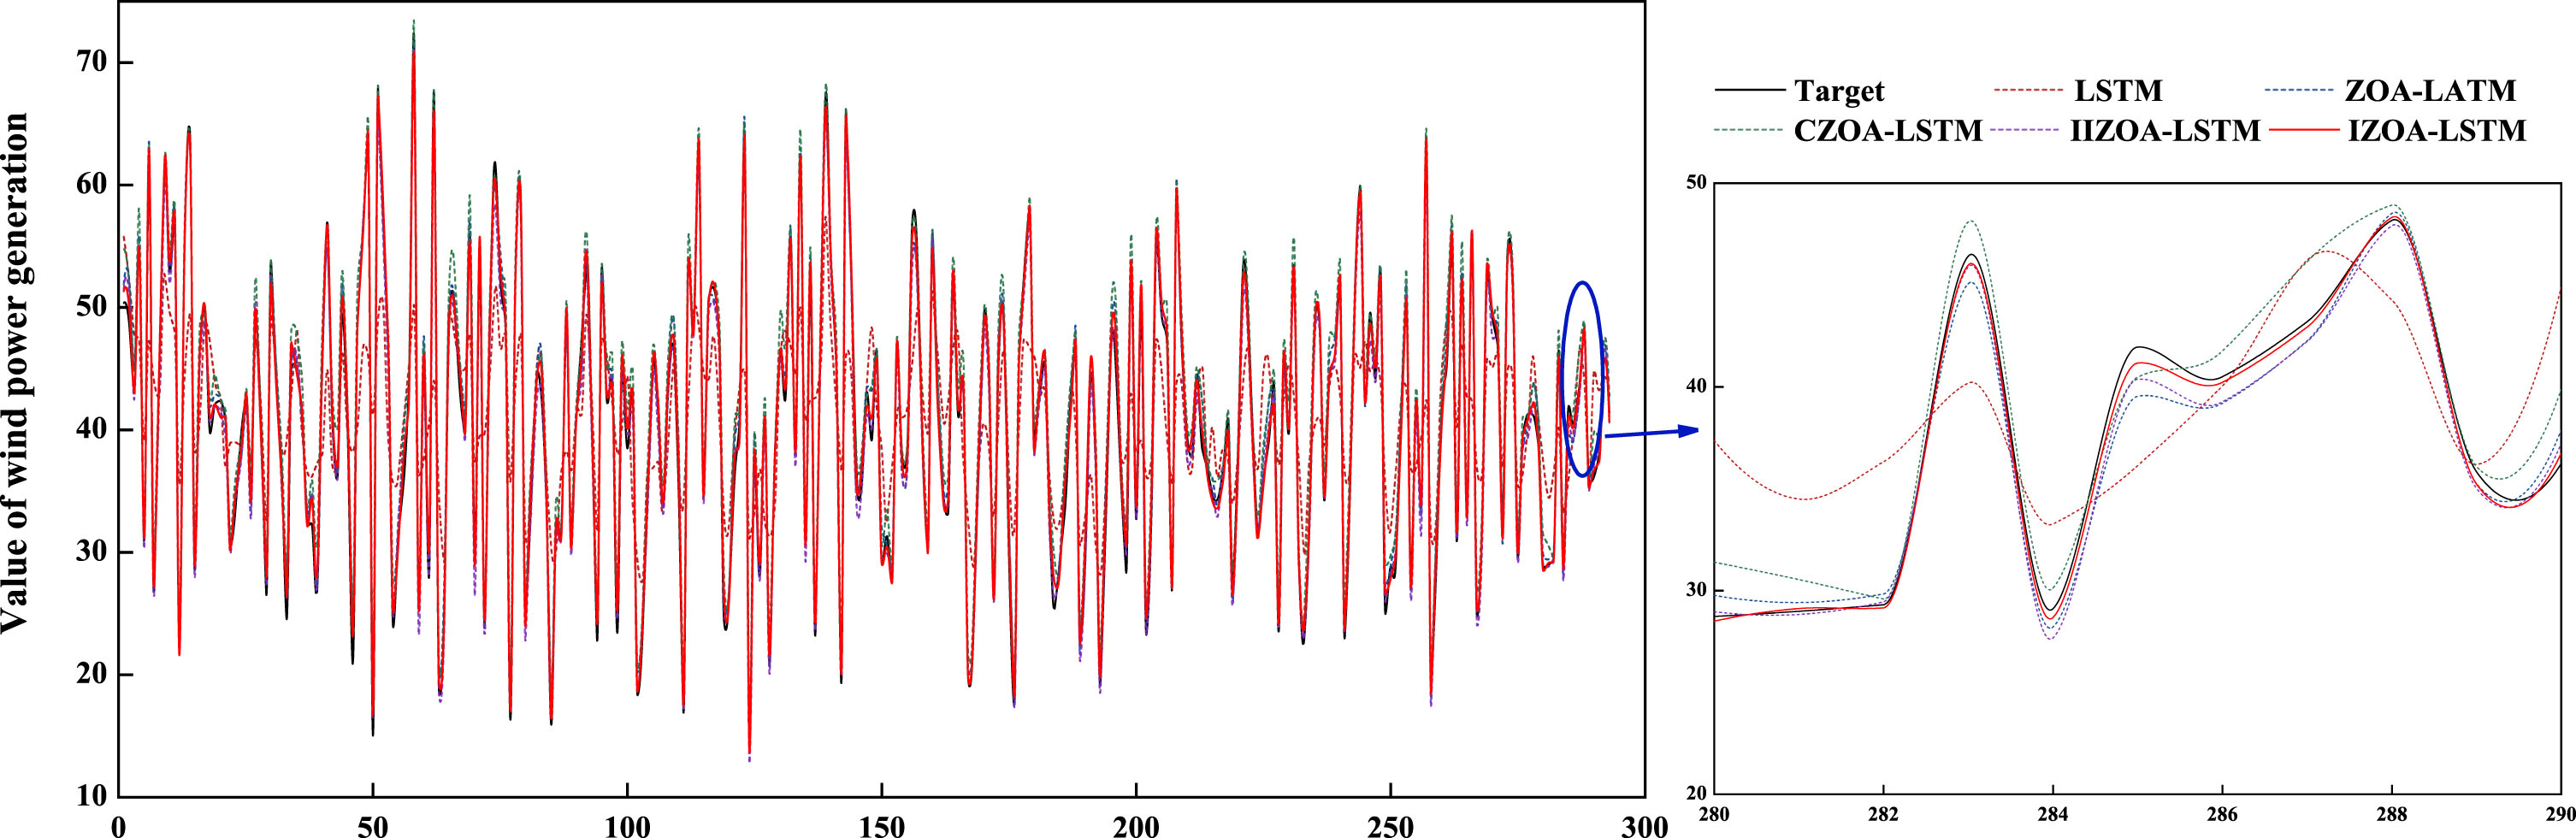
Model prediction results.
Evaluation indicators for the three models
According to Table 7, after optimizing the network model parameters, the prediction errors for wind power generation have significantly decreased. The MAE of the IZOA-LSTM network is reduced by 43.96%, 9.8%, 1.8%, and 1.68% compared to the LSTM, ZOA-LSTM, CZOA-LSTM, and IIZOA-LSTM networks, respectively. Similarly, the RMSE of the IZOA-LSTM network is reduced by 48.13%, 10.17%, 1.6%, and 1.06% compared to the RMSE of the LSTM, ZOA-LSTM, CZOA-LSTM, and IIZOA-LSTM networks, respectively. Likewise, the MAPE of the IZOA-LSTM network is lower than the MAPE of the RMSE of the LSTM, ZOA-LSTM, CZOA-LSTM, and IIZOA-LSTM networks, showing reductions of 89.93%, 8.23%, 5.92%, and 5.05%, respectively.
The analysis of the above results demonstrates that the IZOA-LSTM model offers high accuracy in predicting wind power generation, meeting the needs for such forecasts. It also highlights IZOA’s strong capabilities in solving optimization problems, making it applicable in practical production activities.
This paper proposes a multi-strategy improved IZOA optimization algorithm to address the deficiencies of the Zebra Optimization Algorithm (ZOA), including slow search speed, low convergence accuracy, and susceptibility to local optima. To tackle the issues of limited population diversity and narrow search scope in ZOA, the algorithm introduces the Lévy flight strategy and updates the positions of population individuals based on the position of the population leader zebra individual in each iteration. To address the imbalance between exploration and exploitation stages in ZOA and the difficulty in rapidly approaching and exploiting the optimal solution, a nonlinear convergence factor is introduced. Finally, to effectively mitigate the premature convergence issue caused by ZOA’s susceptibility to local optima, the algorithm incorporates the Cauchy mutation strategy.
To validate the effectiveness of the improved strategies, this study conducted analyses on convergence behavior and performance of algorithmic improvement strategies. The results indicate that the three strategies have to varying degrees addressed the deficiencies of ZOA in different aspects. The enhanced IZOA algorithm demonstrates significant improvements in convergence speed, convergence accuracy, and global optimization capability compared to ZOA.
To assess the performance of IZOA, it was subjected to experiments using the CEC2017 benchmark functions (100 dimensions) and the CEC-2022 benchmark functions (20 dimensions). The results indicate that IZOA exhibits superior performance compared to other mainstream algorithms on both test sets, and maintains stable optimization performance even when addressing high-dimensional problems. Moreover, IZOA maintains stable optimization performance even when faced with high-dimensional problems. Furthermore, this paper applies IZOA to the practical engineering problem of Roller Bearing Design to validate its capability in solving real-world problems. The experimental results reveal that IZOA achieves the top rank in optimizing the design problem, showcasing its ability to solve real optimization problems more effectively than other mainstream comparative algorithms. Finally, IZOA is applied to optimize the parameters of an LSTM network and predict wind power generation. The results show that IZOA enables the LSTM network to obtain optimal parameters, reducing the MAE, RMSE, and MAPE values from 1.7377, 2.3445, and 21.673% to 0.97385, 1.2161, and 2.1832%, respectively. This significant enhancement in wind power generation prediction accuracy demonstrates IZOA’s strong capability in solving real optimization problems effectively.
In the future, this algorithm can be widely applied in various fields, including image segmentation and data clustering, robotic path planning, tool fault diagnosis, simulation circuit fault diagnosis, and wireless sensor networks.
Conflict of interest
The authors declare no conflict of interest.
Data availability description
The data that support the findings of this study are available from the corresponding author reasonable request.
Footnotes
Acknowledgments
This research was Supported by Guizhou Provincial Science and Technology Projects (Grant number: Qiankehezhicheng [2023] General 302, Qiankehezhicheng [2023] General 124 and Qiankehezhicheng [2023] General 117), Guizhou Provincial Science and Technology Projects (Grant No. Qiankehejichu ZK [2022]-General 131), the National Natural Science Foundation of China (Grant number: 52265062)
Appendices
Appendix 4 P-values for 15 algorithms on CEC-2022 (Dim = 20)
| Function | AVOA | DBO | GSA | GWO | AO | MFO | WOA | HHO | SCSO | CPSOGSA | CSA | ZOA | CZOA | IIZOA | IZOA |
| F1 | 4.08E-11 | 3.02E-11 | 3.02E-11 | 1.29E-09 | 3.02E-11 | 3.02E-11 | 3.02E-11 | 3.69E-11 | 1.96E-10 | 4.08E-11 | 3.47E-10 | 7.39E-11 | 5.07E-10 | 8.10E-10 |
|
| F2 | 2.28E-05 | 1.43E-08 | 3.02E-11 | 2.03E-07 | 5.49E-11 | 8.20E-07 | 4.08E-11 | 1.09E-10 | 6.70E-11 | 3.32E-06 | 5.53E-08 | 3.34E-11 | 4.50E-11 | 3.02E-11 |
|
| F3 | 6.70E-11 | 1.86E-09 | 3.02E-11 | 1.43E-05 | 6.07E-11 |
|
3.69E-11 | 3.02E-11 | 8.15E-11 | 3.02E-11 | 2.00E-05 | 3.34E-11 | 7.22E-06 | 3.34E-11 |
|
| F4 | 2.57E-07 | 6.53E-08 | 2.28E-05 |
|
4.44E-07 | 5.60E-07 | 3.69E-11 | 1.07E-09 | 8.15E-11 | 3.47E-10 | 2.81E-02 | 7.70E-04 | 4.12E-06 | 1.31E-08 |
|
| F5 | 3.02E-11 | 4.50E-11 | 3.02E-11 | 2.50E-03 | 3.02E-11 | 3.02E-11 | 3.02E-11 | 3.02E-11 | 6.07E-11 | 3.02E-11 | 4.64E-05 | 3.02E-11 | 1.33E-10 | 3.02E-11 |
|
| F6 |
|
8.66E-05 | 1.99E-02 | 2.39E-08 | 3.02E-11 | 3.83E-06 | 3.02E-11 | 3.02E-11 | 1.60E-07 |
|
|
2.67E-09 | 6.28E-06 | 2.44E-09 |
|
| F7 | 7.09E-08 | 1.86E-06 | 5.49E-11 |
|
2.78E-07 | 9.88E-03 | 8.15E-11 | 1.96E-10 | 4.11E-07 | 2.37E-10 |
|
1.32E-04 | 7.29E-03 | 7.96E-03 |
|
| F8 | 2.81E-02 | 9.79E-05 | 8.99E-11 | 4.64E-03 | 1.84E-02 |
|
2.13E-04 | 1.49E-04 | 5.61E-05 | 4.69E-08 |
|
1.24E-03 |
|
1.11E-03 |
|
| F9 | 3.02E-11 | 3.02E-11 | 3.02E-11 | 3.02E-11 | 3.02E-11 | 3.34E-11 | 3.02E-11 | 3.02E-11 | 3.02E-11 | 3.02E-11 | 3.02E-11 | 3.02E-11 | 3.02E-11 | 3.02E-11 |
|
| F10 | 3.18E-03 | 2.07E-02 | 4.98E-11 | 4.86E-03 | 1.00E-03 | 2.32E-06 | 1.70E-08 | 3.52E-07 | 7.70E-04 | 7.12E-09 | 1.44E-03 | 6.38E-03 |
|
|
|
| F11 | 2.92E-02 | 2.68E-06 | 3.02E-11 | 3.02E-11 | 3.02E-11 | 3.82E-10 | 3.02E-11 | 1.41E-09 | 3.02E-11 |
|
3.51E-02 | 3.02E-11 | 3.02E-11 | 3.02E-11 |
|
| F12 |
|
1.78E-04 | 3.02E-11 |
|
2.92E-09 | 6.36E-05 | 3.47E-10 | 3.69E-11 | 1.25E-07 | 3.02E-11 |
|
3.02E-11 |
|
1.21E-12 |
|