



Abstract
In the course of their day, sample environment professionals can be confronted by numerous technical challenges applicable to a range of scientific questions. This paper presents three successful outcomes from user-posed sample environment challenges for in situ neutron scattering experiments undertaken at the Australian Centre for Neutron Scattering (formerly the Bragg Institute). The sample environments presented here have nothing in common other than their novelty. They may not be the best solution but have been constrained by time, resources and ability. The questions the users posed were:
Can we mount a cylinder in cylinder (CIC) rheometer, more regularly used on a small angle scattering instrument, on a diffraction instrument and obtain usable data? Can we supply high-voltage (up to 10 kV) across a sample within the Paris–Edinburgh press while mounted on a powder diffraction instrument? And finally can a Lakeshore 340 and an in-house built liquid conductivity cell do the job of a commercial liquid conductivity meter? This paper presents the engineering and equipment solutions that were used to answer these questions, and in each case the scientific users left with useful, intriguing and, hopefully, publishable data.
Introduction
This paper presents three examples of “one-off” sample environments developed at the Australian Centre for Neutron Scattering (ACNS), the neutron scattering facility of Australia, each in collaboration with our users. The three presented experiments, based on the original requests from the users, were initially assessed by our technical reviewers as either ‘not feasible’ or ‘conditionally feasible’. However, with close collaboration amongst the users, instrument scientists and sample environment team, solutions were found within the available equipment, budget and time restraints. Of course, more elegant solutions would be possible with greater availability of resources, however, the interest and novelty here resides in the use of equipment in ways that the manufacturers did not intend or predict.
Cylinder-in-cylinder (CIC) rheology with neutron powder diffraction
Forensic pathology of a motor vehicle accident victim in Sydney during the winter of 2006 found crystallised fat structures, which were characterised and found to be comprised of triacylglycerol [13]. The mode of formation was not understood, but thought to be related to shear stresses created during the accident. An experiment was proposed to study the crystallisation behaviour of a triacylglycerol while under high shear stresses, which necessitated the use of a cylinder-in-cylinder (CIC) rheometer mounted on the high intensity neutron powder diffraction instrument, WOMBAT [14].
As the Anton Parr MCR500 rheometer is usually associated with the SANS instruments QUOKKA [5], BILBY [11], and KOOKABURRA [10], an adapter plate was fabricated to allow mounting on WOMBAT. The geometry of the cell and neutron path, shown in Fig. 1, is critical for the success of the experiment allowing the detection of a sufficient neutron diffraction signal. WOMBAT has a continuous 120° angle detector, and efforts were undertaken to make sure that none of this was shielded by the rheometer. The critical diameter for the radial collimator used was 50 mm while the outer diameter of the CIC cell is 49 mm. The gap filled by the sample was 0.5 mm. The mounting of the rheometer was such that the neutron beam fell on the outer arc formed by the sample in the CIC cell. In this geometry, taking into account the cross-section of the neutron beam, approximately 0.3 ml of sample was in the neutron beam at a given time.
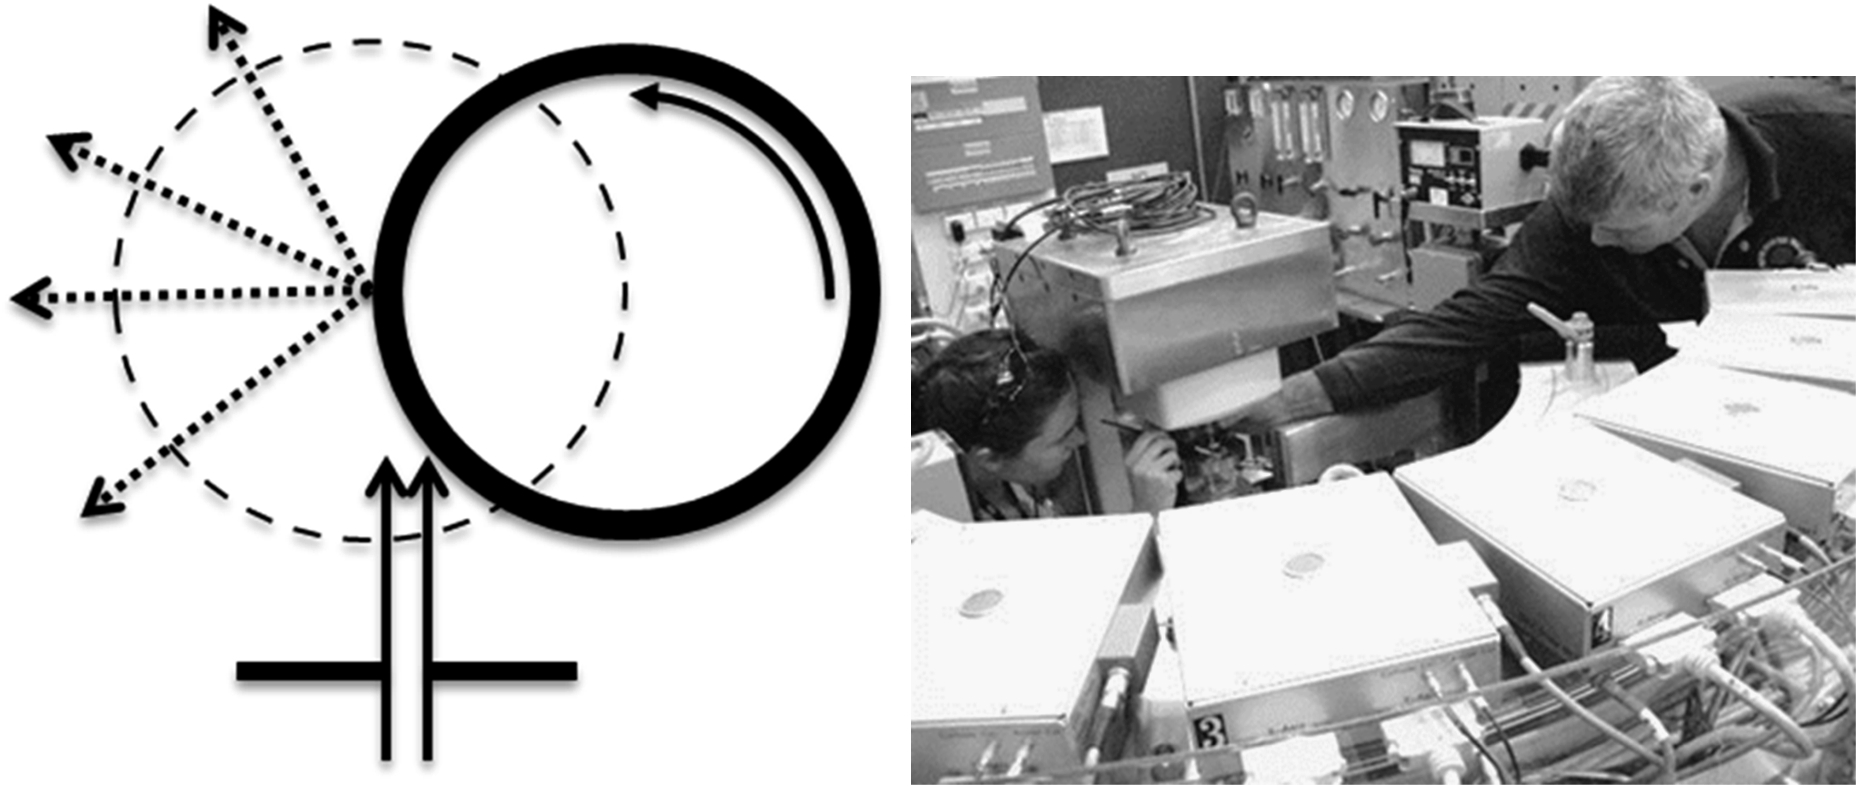
Left: geometry of cell and neutron instrument. Right: loading a sample in the rheometer, the WOMBAT detector is in the foreground of the photo.
The sample studied was deuterated tripalmitin, a model for human triacylgylcerides, with preparation of the deuterated sample carried out at the ANSTO National Deuteration Facility. Data was collected for various static shear stress rates and temperature ramps with one representative set of diffraction data presented in Fig. 2. This shows the α to β transition on cooling for one set of shear conditions [12]. A complete description of the experiment and results will be the subject of an upcoming paper.
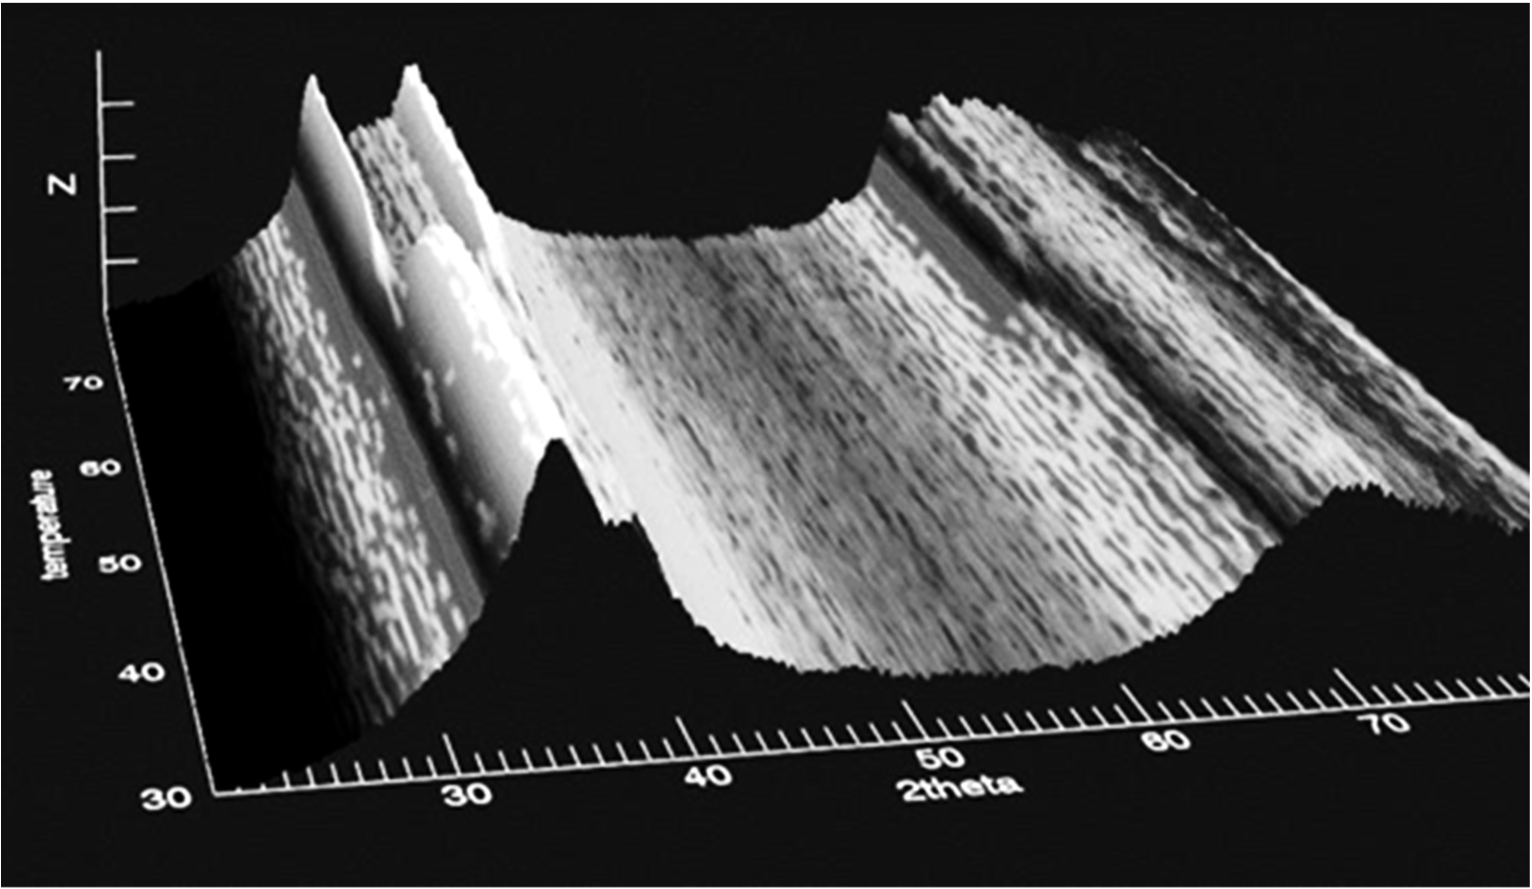
Representative diffraction data at constant shear and increasing temperature of d-tripalmitin (z axis is the background corrected intensity). The two large broad scattering features at
The theoretically predicted behaviour of a user’s dielectric sample required electrical polarisation of at least 10 kV/mm under pressure within a (VX5) Paris Edinburgh press [1,7]. The user developed system of pyrophyllite and Teflon gaskets to isolate electrically the anvils of the press will be discussed in a future paper.
To apply the high voltage safely to the anvils a number of conditions were needed, including reducing the chance of corona discharge and electrical breakdown. Due to the low current threshold for the high voltage supply (Matsusada AU-10R120) of 100 mA, destructive arcing is unlikely. However, partial discharge, tracking and corona discharge are all possible and can lead to unexpected current trips with consequent undesirable waste of precious beam time. To reduce the chance of these trips each source of current leakage would need to be addressed.
Corona discharge is most easily reduced by carrying out the experiment in a vacuum of better than 10−3 mbar. The Paschen curve [3] can be used to determine the combination of vacuum, spark gap and voltage to be avoided. However, it should be noted that this breakdown data recorded in literature were collected using effectively infinite parallel plates and hence the introduction of sharp edges on the high-voltage electrodes will move the voltage minimum to lower sample chamber pressures [3]. As the thickness of the sample was anticipated to be about of 0.8 mm, all other gaps in the set up need to be larger and steps were taken to reduce the chance of partial discharge and tracking on the dielectric insulation.

Left: Paris–Edinburgh press vacuum chamber. Right: Paris–Edinburgh press showing high voltage connections and mounted on WOMBAT.
The vacuum chamber, as shown in Fig. 3 was built using aluminium alloy 6061. To remove the need for producing leak tight aluminium welds the chamber was constructed from three parts all sealed with viton O-rings. This design solution lowered chamber costs and production time and proved to be effective for the low vacuum levels required by this application. The dimensions can be scaled suit any of the VX-type Paris–Edinburgh presses [7]. The lower ring incorporates two O-rings, one seal to the frame of the press, the other seal to the cylinder in which a waisted area serves as the window for the incident and scattered neutron beams. The provision of two vacuum connections allows a vacuum pump and a high-voltage vacuum lead through to be connected. The chamber is then sealed with a cap and O-ring. Future plans include modifying the cap to provide feed throughs for liquid nitrogen cooling of the anvils. The small leak around the large screw thread that secures the hydraulic piston was sealed using GAF Brand RTV silicone.
To simplify the wiring and electrical isolation it was decided to apply the high voltage to the stationary anvil (upper anvil in Fig. 3), which is attached to the breech of the assembly. The lower anvil and all other metal parts, including the vacuum chamber, are connected to ground and the secondary ground was connected to the sample table. A schematic of the wiring arrangement is shown in Fig. 4. This secondary ground is very important in protecting the motors and encoders of the sample table if the primary ground should fail. This is because the resistance to ground measured from the sample table to the ground of the HV supply can be several tens of ohms. If a breakdown occurs a significant proportion of the applied HV can appear on the sample table. This is due to the resistive divider formed by the low resistance to the sample and the relatively higher resistance of the sample stage to high voltage supply. The resistance of the sample when the breakdown occurs is effectively zero and shown as a spark gap in Fig. 4. Because of this the “ground” voltage can be raised locally leading to electrical breakdown from ground to supply within the motor and encoder units.

Wiring schematic of the high voltage circuit grounding showing the importance of secondary ground.
A further consideration was the electrical isolation of the upper anvil from the frame of the press. Once again, the problem is the sharp corners of the anvil and screw breech. To avoid premature breakdown either the electrode has to be modified to remove the electric field concentration at the corners or the dielectric has to be extended beyond the electrodes. The better solution is to do both; however, the hardened steel of the press should not be machined. To overcome the need for machining the hardened steel a plate with a radial profile around its periphery to gradually reduce the field concentration should be used. The optimum profile for such a modification was determined by Rogowski [15]. However, the additional plate would have made the set up overly complicated and it was decided not to proceed with it.
Hence the only modification involved the dielectric separator. The issues here are to account for the primary breakdown mode for the surface of the dielectric known as tracking. This occurs due to the presence of contaminants on the surface. The dielectric separator has to protrude beyond the electrode to increase the available path length. This was achieved by using a stepped Teflon collar to hold the anvil, dielectric separator, and backing screw assembly as shown in Fig. 5. The dielectric diameter was made 4 mm oversize on the diameter. The high voltage connection was then made via one of the three screws through the Teflon collar holding the anvil in place. The dielectric for this application has to withstand the electric field strength of the applied voltage as well as the force exerted to compress the sample. Mica composite sheets were selected as this material had sufficient compressive strength, high dielectric breakdown (<25 kV/mm) and could be cut to size with scissors.

Modified anvil holder for high voltage application across the Paris–Edinburgh press. Teflon collar and mica insulation.
After the first promising results from the commissioning experiment, further experiments with this arrangement are planned at ACNS. The gasket design and results will be the subject of a future paper after further experimental work is carried out.
When using the liquid cells on the neutron reflectometer, PLATYPUS [6], with solute delivery of varying concentration and expensive deuterated chemicals, it is advantageous to know when the cell is filled and the solution concentration at equilibrium. A user using ionic electrolytes and the HPLC quaternary gradient pump (Knauer BlueShadow 40P) requested an inline liquid conductivity sensor to be placed at the outlet of the liquid cell so monitoring of the ionic concentration could be carried out remotely and in real time. The normal solution for this problem would be to buy a liquid conductivity meter as used for Ionic Chromatography [9]. These units include inductive (non-contact) conductivity measurement, drift stabilisation, automatic zeroing and remote control of parameters. As this was not an option, an alternative that relied on existing equipment requiring minimal fabrication and with sufficient measurement resolution was sought.
The considerations for accurate liquid conductivity measurement involve accounting for the resistance contributions of the electrodes themselves, and separating this from the true liquid resistance. The problem arises due to the formation of a double layer at the surface of the electrodes. The double layer can be considered electrically as a resistance and a capacitance in parallel. The values of this parallel circuit change with time, while the measurement voltage is applied, as more ions accumulate at the electrodes. Hence if a direct current (DC) resistance measurement is attempted the measured resistance will change (generally increase) over time, with the baseline resistance drifting unpredictably. The material used for electrodes also affects the DC reading. Platinum is the preferred metal due to its high ionisation potential. To reduce this effect large electrodes are used to reduce the resistance, whilst an alternating current (AC) measurement can reduce the effect of the capacitance and average the drift in the electrode resistance [2]. To increase the area of the electrode the platinum can be platinized, this is an electrolytic process that deposits platinum black on the electrodes greatly increasing the electrode surface area [4].
The equation for electrical conductivity is given in equation (1) and for solid samples the electrode gap and area can be determined accurately. However, in solution the area (especially after platinization) and the electrode spacing may not be known. All these effects are lumped into the cell constant, c, which is determined by measuring standard solutions of known conductivity and the same ionic species as those to be determined during the experiment.
To record R, an accurate potentiostatic resistance meter with a periodic current reversal, with a range from 102 Ω to 105 Ω, is required. This actually describes the input parameters for a Lakeshore 340 set to measure a Cernox temperature sensor. The Lakeshore 340 reverses current at a rate of 10 Hz and autoranges the excitation current to maintain an approximately constant voltage. Excitation current and resistance ranges for the Lakeshore 340 are given in Table 1 [8]. From an estimate of the cell constant for the fabricated cell and the expected standard solution conductivities the concentration resolution for a 10 mM KNO3 solution was predicted to be 0.01 mM. The Lakeshore is set to the Cernox input and the raw sensor value is recorded in place of the converted temperature reading. The cell is shown in Fig. 6. Platinum wires enter via holes in the top of the cell, bend through 90° and travel toward the middle of the flow channel to form a ∼1 mm gap. The body of the cell is polycarbonate. Some raw data from using the flow conductivity cell and a Lakeshore 340 are presented in Fig. 7. The accuracy of the conductivity measurement is determined by the calibration of the cell and the important consideration is the accuracy and stability of the resistance measurement. Some commercial flow cell conductivity units quote accuracy of better than 5% of full scale [9]. The absolute accuracy is seldom of concern; the important factors are high resolution and low drift to measure relative change.
Lakeshore 340 10 mV excitation NTC RTD input specification [8]
Lakeshore 340 10 mV excitation NTC RTD input specification [8]
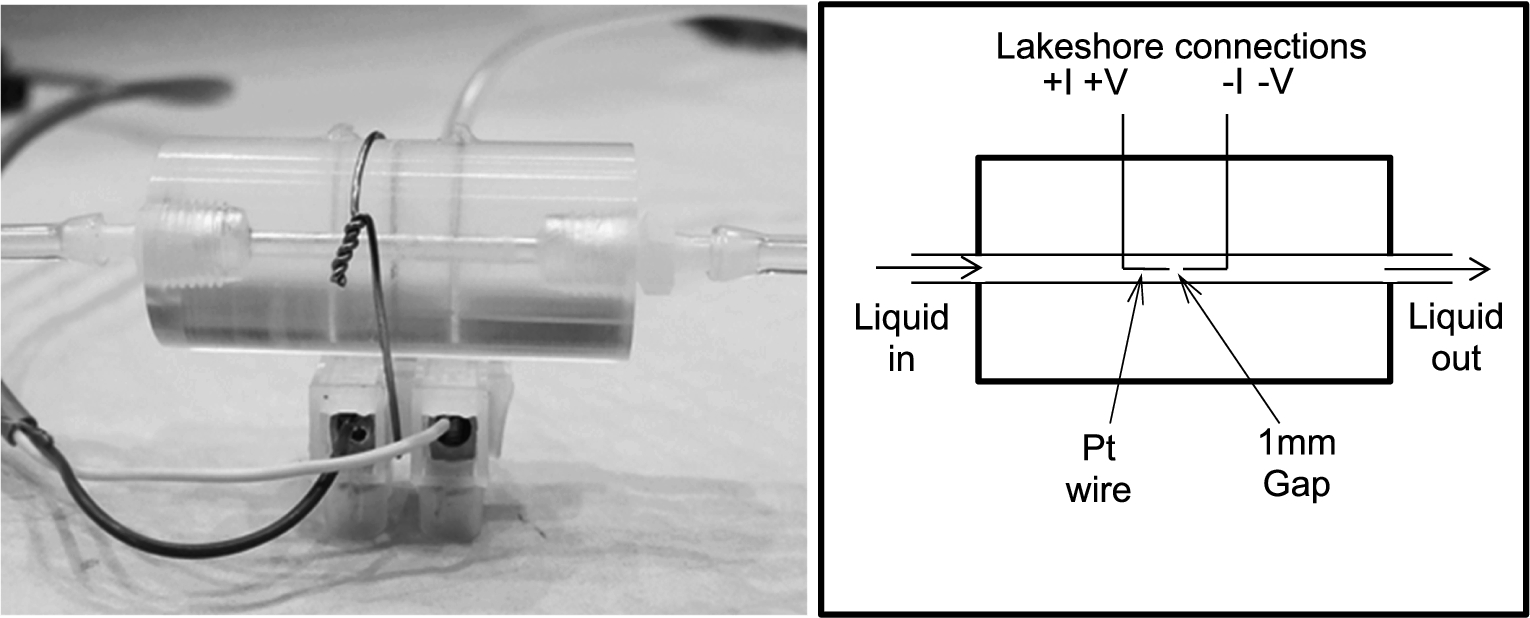
Left: Flow conductivity cell. Right: Liquid and electrical schematic.
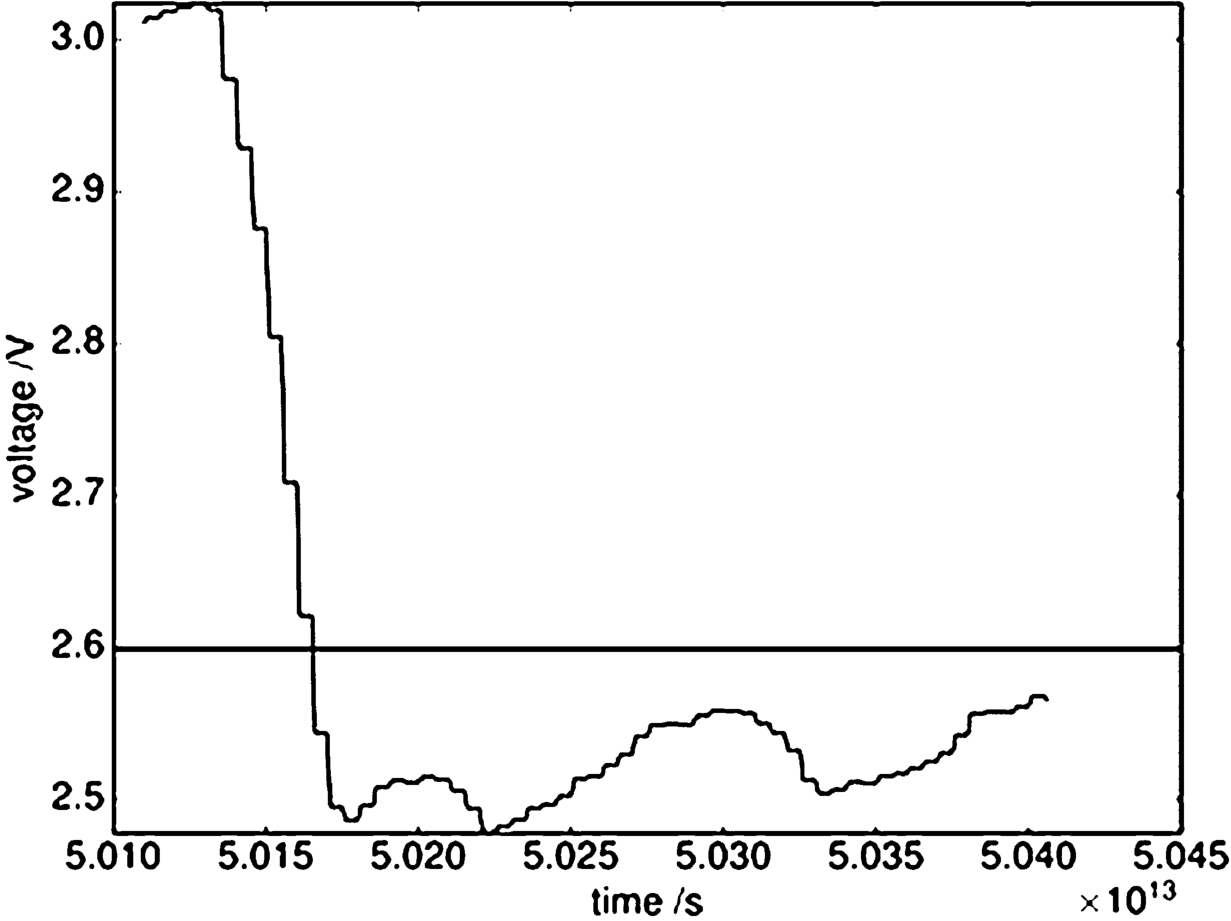
Raw data from using the flow conductivity cell on a series of step concentration changes.
Prior to using the flow conductivity set up an opportunity arose to test the logging of resistance using the Lakeshore on a magnetoresistive bismuth/antimony alloy. The data are given in Fig. 8. After these successful applications it is planned to use this technique more commonly for sample resistance measurement as it reduces the number of instruments required when an unused input can be utilised on a Lakeshore 340.

Left: Results of bismuth/antimony magnetoresistive experiment. The line is to guide the eye Right: Sample mounted on cryostat stick.
Through close collaboration with instrument scientists and users, the sample environment team at ACNS attempts these difficult requests within constrained budget and resources. A significant reduction in the impossibility of a measurement can be achieved with sufficient resources. However, having every “meter” that a user can imagine is not a cost effective or desirable answer. Instead, effective solutions can be found that make the best use of the available equipment and resources, such as those outlined in this paper, are more realistic. There is rarely any harm done in trying as long as there is sufficient time for preparation and testing so the obstacles in the planned measurement can be overcome.