
Abstract
OBJECTIVE:
Through a sequential explanatory mixed-methodology approach, this study explored the adulthood employment outcomes of youth with disabilities that received services from Vocational Rehabilitation (VR) while in high school.
METHODS:
A VR database was examined to understand differences in the employment outcomes of 4,731 youth with disabilities based on demographic characteristics and services received. Individual interviews with key stakeholders were conducted to expand on the results of the quantitative data.
RESULTS:
Results revealed individual and systemic challenges for VR supporting youth with disabilities transitioning to adulthood. Employment outcomes were worse for females, African American youth, and youth with mental disabilities (also known as mental illness). In contrast, males, Latino(a) youth, and youth with intellectual/developmental disabilities fared well in the VR system. Analysis of the VR status progression system showed that few students were employed, and more than half of students were eligible but received no services.
CONCLUSIONS:
Overall, students with disabilities in this urban public school system must receive more comprehensive VR services to attain their employment goals. In relation to successful or unsuccessful status progression, three main themes emerged: (1) family involvement and support, (2) resources and opportunities, and (3) systemic barriers. Limitations and implications for practice and research are discussed.
Keywords
Introduction
Transition from high school to adulthood is a step that every student must take, but this can be more difficult and less successful for students with disabilities. People with disabilities comprise 18.7% of the total U.S. population, with approximately 10% (∼5.7 million) being youth ages 15–24 (Brault, 2012). The Office of Disability Employment Policy (ODEP, 2018a) reported that for youth 16 to 19 years old, the employment rate was 26.5% versus 33.7% for youth without disabilities. These employment disparities increase between the ages of 20 to 24 for youth with disabilities (50.5%) and youth without disabilities (72.1% [ODEP, 2018a]).
There are a variety of demographic characteristics that affect adult employment outcomes of youth with disabilities. Research has shown that earlier transition programming and services are important to the success of youth with disabilities (Awsumb, Balcazar, & Alvarado, 2016; Fabian, 2007). Conversely, it appears that females (Balcazar, Oberoi, & Keel, 2013; Fabian, 2007); African American and Latino youth (Balcazar et al., 2013) youth with severe disabilities (Fabian, 2007); low-income youth (Murray & Naranjo, 2008); and youth receiving financial government assistance (Fabian, 2007; Luecking & Wittenburg, 2009) are less likely to achieve successful competitive employment outcomes. Given the large prevalence of learning and behavioral disabilities, it is encouraging to see that these youth are finding employment (Awsumb et al., 2016; Fabian, 2007). Additionally, the literature suggests that more successful employment outcomes are possible when students are supported through family involvement (Keel, Cushing, & Awsumb, 2018; Povenmire-Kirk, Lindstrom, & Bullis, 2010) and connections to outside service agencies (Balcazar et al., 2012; Luecking & Luecking, 2015). While the literature suggests there are discrepancies in outcomes based on the personal and demographic characteristics of youth with disabilities, many opportunities exist to implement effective programming to increase employment outcomes.
Students with disabilities may not be receiving effective services to transition successfully from secondary education to employment. Low employment rates (21.5%) for all people with disabilities suggest that supports should be strengthened to increase the likelihood of youth with disabilities transitioning successfully to adulthood (ODEP, 2018b). Another important consideration is that under the Individuals with Disabilities Education Improvement Act (IDEIA, 2004), schools are mandated to provide comprehensive services and supports to youth with disabilities while in school, but these often disappear after students graduate or age-out of school (at 22 years). All services after high school have to be actively pursued by the youth and/or their family. This shift in responsibility implies that youth and their families need to know how to access and acquire services and supports after high school. Legislation mandates that school districts connect students with disabilities to outside agencies to initiate eligibility for supports in postsecondary employment and education; yet, it is unclear if this is commonly occurring (Balcazar et al., 2012).
The leading outside agency serving people with disabilities in seeking and gaining employment and providing supports to attend postsecondary education is Vocational Rehabilitation (VR). Additionally, IDEIA (2004) and the Workforce Innovation and Opportunity Act (WIOA) of 2014 require VR to work in partnership with the school district to serve youth with disabilities. Unfortunately, the literature shows that VR is not reaching its full potential in serving youth with disabilities (Oertle & Trach, 2007; Oertle, Plotner, & Trach, 2013; Plotner, Trach, & Stauser, 2012; Plotner, Trach, Oertle, Fleming, 2014). Issues include: (a) many VR counselors lack sufficient secondary transition knowledge to effectively serve youth with disabilities, and (b) that there is a limited amount of involvement in the transition process by VR counselors due in part to large caseloads (Oertle et al., 2007, 2013; Plotner et al., 2012, 2014). This is concerning given that for many youth with disabilities, VR counselors have a key support role as they move from high school to navigating adult opportunities.
Interagency collaboration has been identified as a key element in the transition to adulthood for youth with disabilities (Noonan, Gaumer-Erikson, & Morningstar, 2013). However, research largely shows that the present status of involvement of outside agencies and VR in the transition process is not supporting youth, particularly from low-income and minority communities, in achieving postsecondary employment goals (Balcazar et al., 2013; Oertle et al., 2013; Plotner et al., 2014). Research also indicates common barriers to successful interagency collaboration relationships include lack of communication, staff dedication, and secondary and transition knowledge (Oertle et al., 2013; Plotner et al., 2014). Strategies leading to successful interagency collaboration include the degree of commitment to the partnership (Johnson et al., 2003), flexibility and resource allocation (Johnson et al., 2003), open communication between agencies (Johnson et al., 2003; Noonan et al., 2013), and professional development (Noonan et al., 2013). Improving interagency collaboration between the school district and VR is imperative to support youth with disabilities achieve employment goals (Balcazar et al., 2013; Oertle & Trach, 2007; Plotner et al., 2014).
Current study
This research asks the following overarching question: Given demographic variables and VR services, do students with disabilities move through the VR system to reach competitive employment outcomes? This study examined the post-school employment outcomes of youth with disabilities that were served by a Midwestern VR agency while in a large urban public school district through a sequential explanatory mixed methodology research design. The quantitative portion of the design incorporated descriptive and correlational methods to investigate youth outcomes based on analyses of demographic variables and VR services received. Semi-structured individual interviews were conducted for the qualitative portion to 1) gain an in-depth understanding of key stakeholders’ perspectives about employment outcomes of youth with disabilities and 2) the collaborative interagency relationship that was created to seamlessly link students and families to VR, ultimately to increase successful employment of youth with disabilities.
Method
Quantitative phase
Research settings and participants
The quantitative VR data were collected and de- identified by VR prior to the researcher getting information on the youth with disabilities receiving services while in high school. The information within the quantitative dataset included demographics, service, and outcome variables and contained 4,731 cases collected between fiscal years 2005 and 2012. The information to be analyzed came from youth with disabilities that were enrolled in the public school district and received services from VR who also have outcomes in the VR system as adults. The youth in this data set were ages 14–21 (M = 17.42) with 37.52% female and 62.44% male. For both race/ethnicity and disability, each variable was run as a yes/no in order to give the fullest picture of the race/ethnicity and disability type that each youth identified with, particularly when they identified with multiple races/ethnicities and multiple disability types (final percentages are greater than 100%). Of the youth with disabilities in the VR system, 60.16% were African American, 40.03% were White, 20.99% were Latino(a), and 2.79% were Other. Of the youth with disabilities in this dataset, 46.37% had a learning disability (LD), 38.87% had an intellectual/developmental disability (IDD), 6.51% had a mental disability (MD), 1.20% had a deaf/hearing disability, 1.04% had a physical/orthopedic disability, 0.68% had a traumatic brain injury disability (TBI), and 0.38% had a blind/visual disability.
Measures and data collection procedures
The progression of the participants through the VR service system is complex and therefore explained in detail (see Fig. 1). Participants enter the VR service system at the referral stage (status 00). After the referral has been made, consumers continue onto either the application stage (status 02), or are closed from referral (status 01) because of ineligibility. If a consumer continues on to application, she/he will either move forward in the system to the accepted stage (status 10) or be closed from application (status 03) because of ineligibility. Next, some participants will move into the certified eligible stage (status 04), which is a waiting list; however, most consumers end up being closed cases (status 38). Alternatively, VR may decide that trial work (status 06) is necessary to determine if consumers are eligible to work, but again, most of these consumers are closed after trial work (status 07). The other three options after the accepted stage are to be closed before receiving an individualized plan for employment (IPE [status 30]), closed after the IPE (status 28), and closure after rehabilitation (status 26). Non-rehabilitated (status 28) is a specific closure status of students who were formally accepted for VR transition services and received an IPE and services, but were closed before being rehabilitated. Rehabilitated participants are closed as status 26 when the person has been employed for a minimum of 90 days in either competitive or competitive-supported employment settings after going through the VR transition program while in high school. The status 26 closure occurs after a student graduated high school. To be successful in the VR transition program during high school, students are required to work for a minimum of 60 calendar days and 240 hours to receive a contractual transition outcome. If a student completes the VR requirements in high school and maintains employment post-high school for 45 days, the VR counselors may on a case by case basis close the case as status 26, successful rehabilitation.
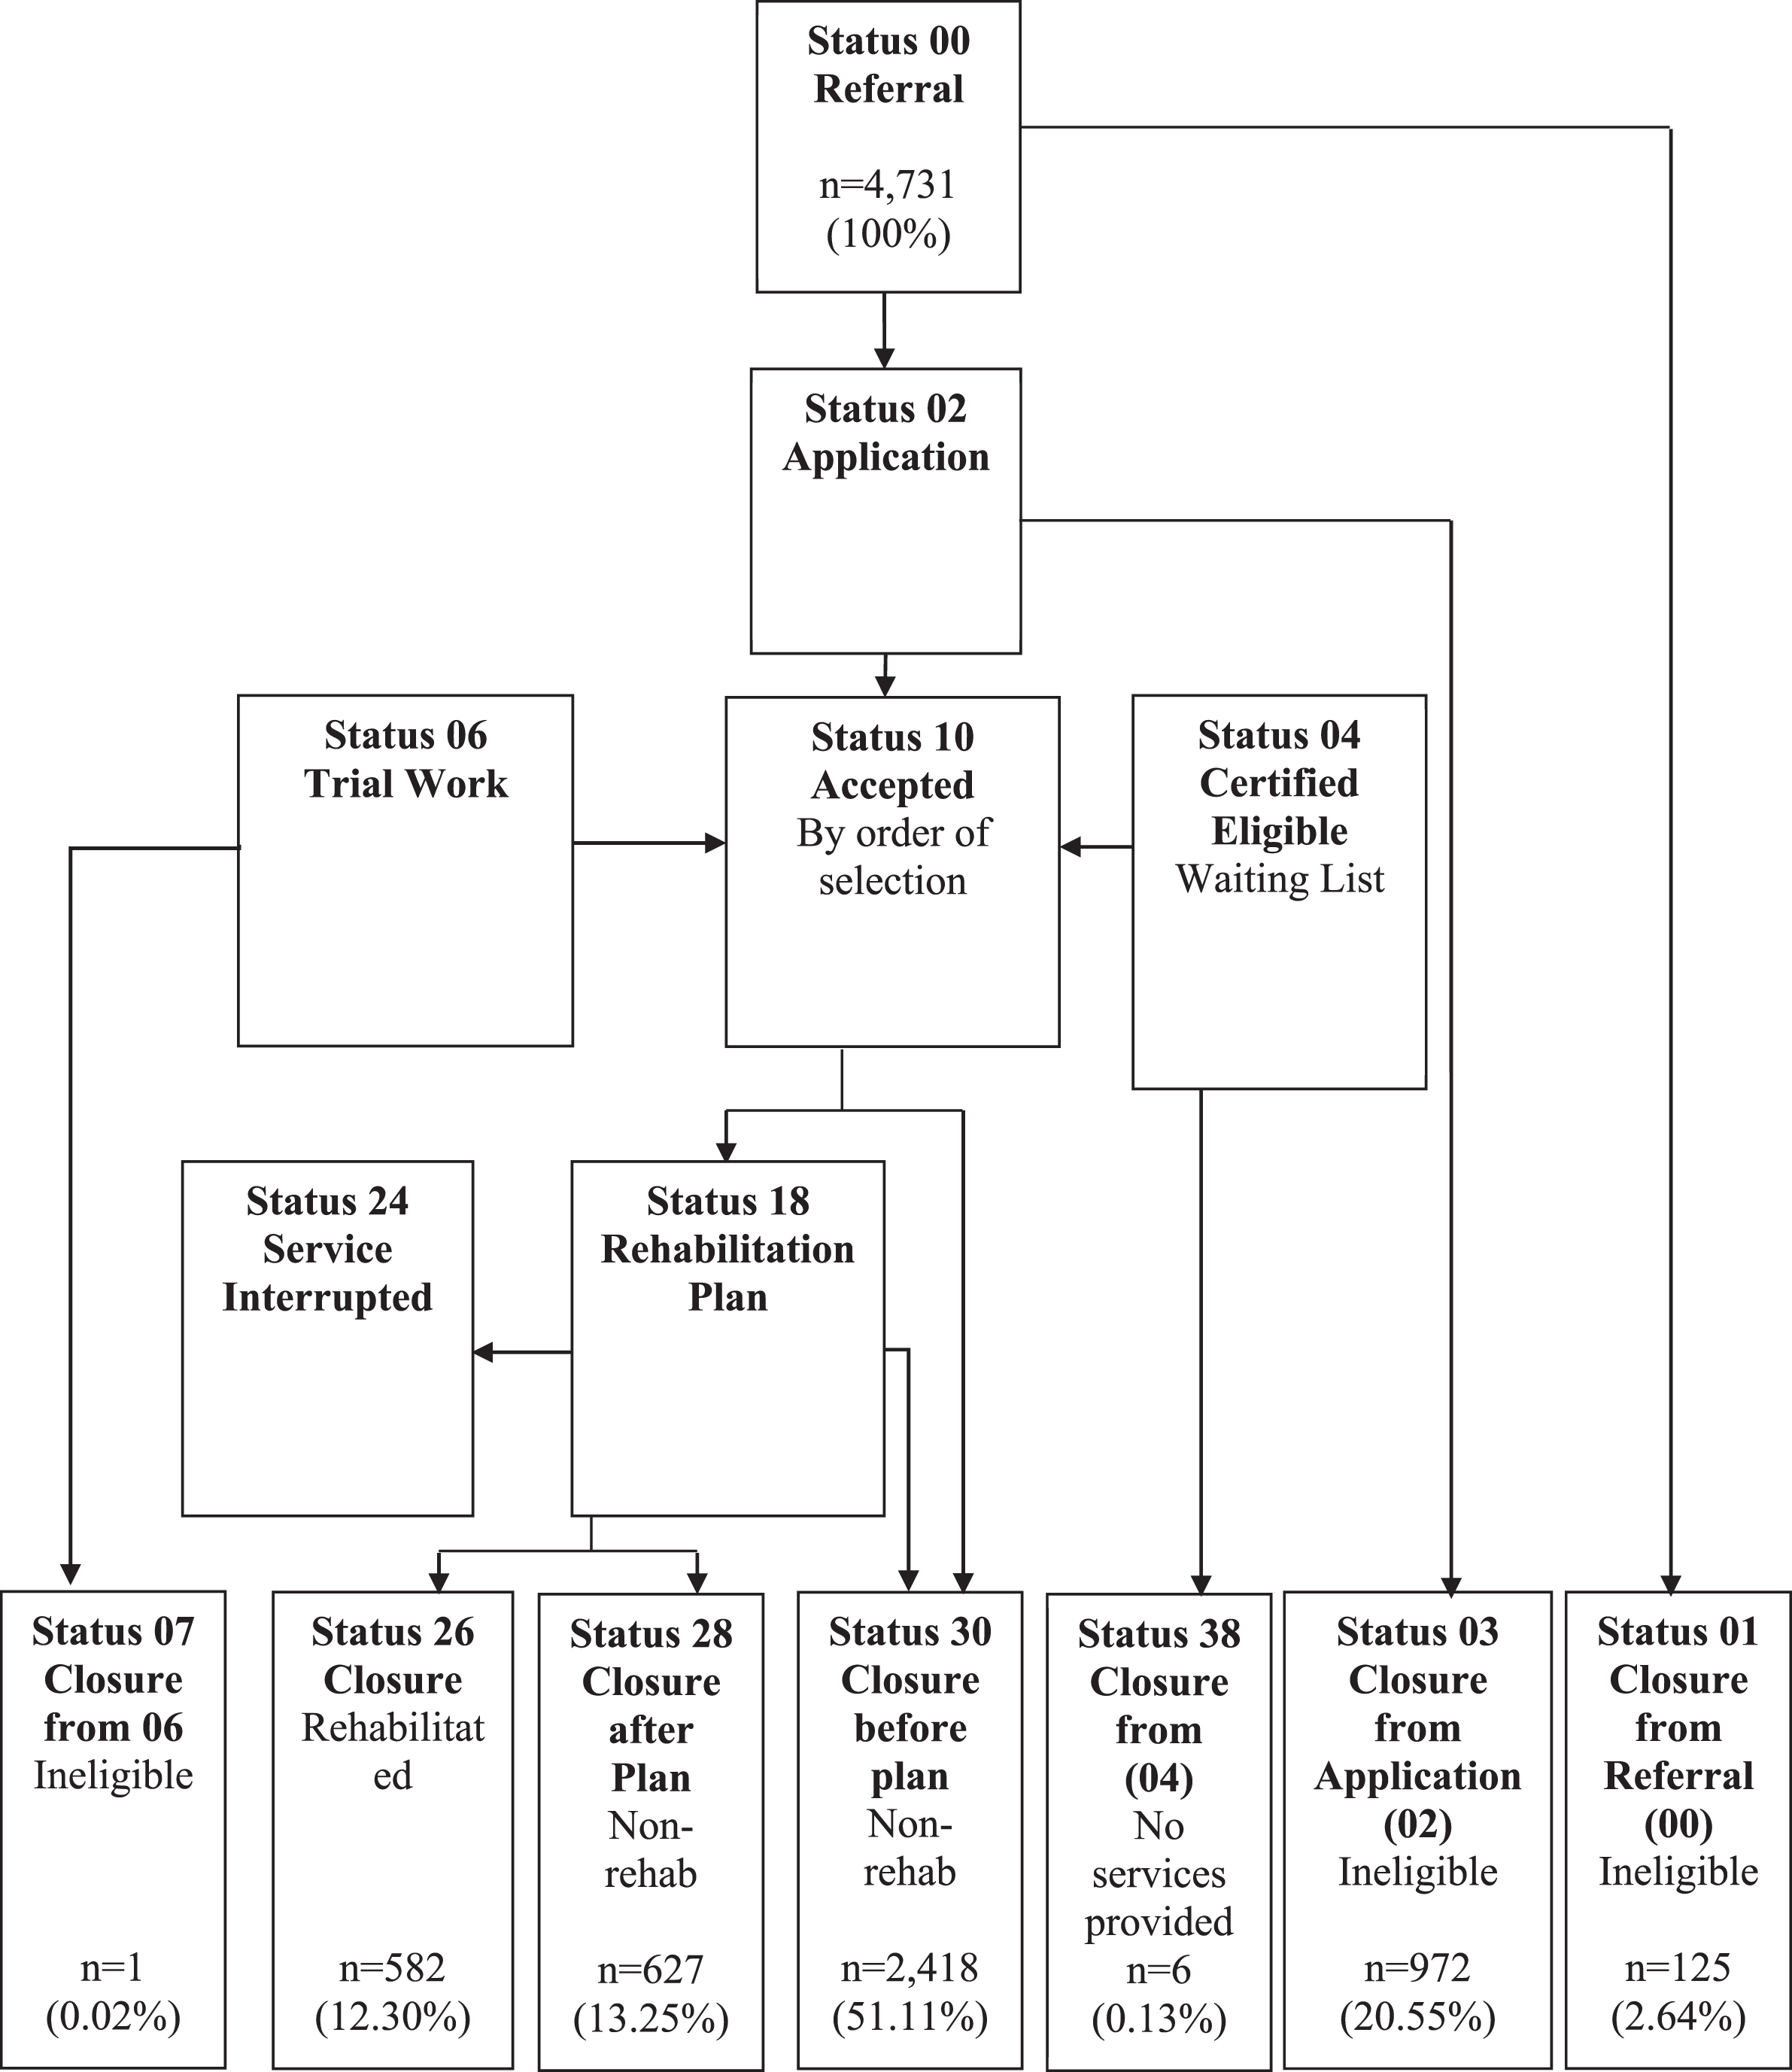
VR status progression chart of youth with disabilities for fiscal years 2005–2012.
Institutional Review Board approval was obtained for the quantitative portion of this study. VR counselors, special education case managers, and teachers collected data about the youth with disabilities. Student data were entered into the VR Virtual Case Management system (VCM), which allowed counselors to input and organize consumer information. Data entered by counselors included demographic characteristics, case history, types of services, and employment outcomes. Counselors collected data from youth with disabilities in person, primarily within each student’s respective high school, though some data were collected in VR offices. Much of the data entered into the VCM were taken directly from IEP documents.
Data analysis
Quantitative analyses focused on basic descriptive statistics and exploration of differences across rehabilitation outcomes (status 1, 3, 7, 26, 28, 30, or 38) for youth with disabilities. Chi-square tests for categorical independent variables and t-tests for continuous variables and a logistic regression model to examine variables that predict rehabilitated or non-rehabilitated outcomes for youth with disabilities were conducted. For chi-square tests, assumptions that were met include independent observations and 80% of the cells having a minimum of five cases. For t-tests, data were on an interval or ratio scale, included independent observations, had a normal distribution, and homogeneity of variances. Finally, examined and fulfilled assumptions for the logistic regression model included a dichotomous dependent variable, a minimum of one independent variable, independent observations, and a linear relationship between continuous variables and the transformed dependent variable (Cohen, Cohen, West, & Aikmen, 2003; Keppel & Wickens, 2004).
Qualitative phase
Research settings and participants
Research was conducted within the VR system, public school district, and a Midwestern University. Interviews were collected within VR offices, at the homes of school professionals, and on-site at the university. The researchers had access to participants from each agency as a result of a former working relationship.
A total of 11 participants were contacted to participate in this study, with 8 agreeing to participate (N = 8). Participants included Division of Rehabilitation administrators (n = 2), VR counselors (n = 2), school district transition specialists (n = 2), and former partnership facilitators from the university (n = 2). The average age of the participants was 48.88 years with 5 females and 3 males. Of the 8 participants, 4 identified as African American/Black, 2 identified as Hispanic/Latino, and 2 identified as White. Finally, all participants held graduate degrees with 5 holding one or more master’s degrees and 3 holding a doctorate.
Recruitment procedures
Purposeful sampling was used to recruit participants that were involved in the partnership before the interview. Secondary recruitment criteria required that participants (1) serve youth with disabilities in either VR or the school district and/or (2) were involved in the partnership at the time of the interview. Stakeholders from the Division of Rehabilitation Services (DRS), VR, and the school district were compensated $50 for their participation. Moreover, a semi-structured interview script was used to interview all participants. Interviews were audio recorded and transcribed verbatim. Member checks were conducted with participants to ensure accuracy of the transcripts.
Data collection procedures
All qualitative procedures were approved by the University and secondary school system Institutional Review Boards. Individual interview data were collected in July of 2016. Participants were contacted by phone or email and asked to participate in the study. If a participant agreed to participate, a date was scheduled to meet at a preferred interview location. Participants received a consent form explaining the procedures, anonymity, risks, and benefits of the study. They also received a copy of their signed consent form.
The results of the quantitative data analysis were synthesized into three worksheets for the qualitative interviews. The purpose of the worksheets was to provide easily understandable data for each participant. Based on the data, participants were asked questions such as: “You can see that there are certain groups of youth that have more success in the VR system than others. What are your thoughts about why this is happening?” In addition, a doctoral student in biostatistics who was familiar with the dataset was asked to review the worksheets to ensure accuracy.
Prior to each interview, participants received copies of the worksheets through email. Upon arrival, participants consented and were given an opportunity to ask questions regarding the interview or quantitative data. On average, the interviews lasted 68 minutes (range = 46–95 minutes). In addition, participants completed a short demographic form including their date of birth, gender, race/ethnicity, and highest education degree received.
Data analysis
After data collection was completed, qualitative interviews were analyzed in multiple phases. Data were first transcribed verbatim using a transcription service. The researcher reviewed each transcript with the audio recording to correct any errors and created a two-column coding table. Next, transcripts were de-identified and participants were assigned pseudonyms. Interviews were examined based on Braun and Clarke’s (2006) thematic analysis approach. According to Braun and Clarke (2006), “Thematic analysis is a method for identifying, analyzing, and reporting patterns (themes) within data” (p. 79). This seminal work provided a well-suited framework given its inherent flexibility in analyzing multiple types of data focusing on various disciplines (Braun & Clarke, 2006). Twenty percent of the interviews were analyzed with a post-doctoral fellow to ensure intercoder reliability. Intercoder reliability averaged 91.88% (range, 91.34% to 92.41%).
Trustworthiness
During the data collection and analysis process, researcher reflexivity, member checking, and peer debriefing were utilized as indicators of trustworthiness. According to Brantlinger, Jimenez, Klingner, Pugach, and Richardson (2005) researcher reflexivity requires one to be open regarding our own “assumptions, beliefs, values, and biases” (p. 201). Before conducting an interview, the interviewer took notes to write any thoughts and checked the notes after the interview to ensure that personal judgments were not brought into the interview. After developing a short summary of each interview transcript, the interviewer contacted participants by phone. Participants were read the interview summary, then had an opportunity to add, retract, or correct any statements. Member checks were conducted with all eight participants. Peer debriefing was used throughout the process of instrument development and data analysis. This involved using a post-doctoral fellow in the development of the interview protocols, the initial data analysis, and for reviewing the final codes and themes. In short, peer debriefing, member checking and researcher reflexivity were vital to this study and helped to ensure trustworthiness.
Results
Quantitative phase
Initial analyses demonstrate the differences in rehabilitation outcomes (status 26 versus status 28 only) for youth with disabilities based on demographic variables through chi-square and t-tests. The results showed gender to be significant with males being significantly more likely to be employed than females, χ2 (1, N = 1,209) = 6.02, p = .014. Youth who were White had significantly better rehabilitation outcomes than youth who were non-White, χ2 (1, N = 1,209) = 27.14, p < .001. Conversely, youth who were African American had significantly poorer rehabilitation outcomes than those who were Non-African American χ2 (1, N = 1,209) = 33.70, p < .001. On the other hand, the rehabilitation outcomes of Latino(a) youth with disabilities were significantly better than Non-Latino(a) youth with disabilities χ2 (1, N = 1,209) = 8.09, p = .004. The only disability type found to have statistical significance was mental disability with these youth having significantly worse employment outcomes than youth without mental disabilities χ2 (1, N = 1,209) = 3.95, p = .047.
In addition, differences in rehabilitation outcomes (status 26 versus status 28) for youth with disabilities based on VR services received were examined. College/university training was associated with statistically significant differences in VR outcomes with youth that receive this service having fewer successful VR rehabilitation outcomes χ2 (1, N = 1,209) = 4.32, p = .038. Additionally, information and referral significantly improved the ability of youth with disabilities to gain a successful employment outcome χ2 (1, N = 1,209) = 12.11, p = .001. Youth with disabilities that received job placement services, job readiness training, and job search assistant had significantly more rehabilitation outcomes χ2 (1, N = 1,209) = 50.51, p < .001; χ2 (1, N = 1,209) = 9.06, p = .003; and χ2 (1, N = 1,209) = 53.36, p < .001 respectively. Moreover, on-the-job supports and on-the-job training were found to be significant in aiding youth with disabilities to gain or retain employment χ2 (1, N = 1,209) = 14.75, p < .001; χ2 (1, N = 1,209) = 6.61, p = .01. On the contrary, other services (any service that does not fall under the umbrella of the 22 listed services) lead to significantly less successful rehabilitation outcomes for youth with disabilities χ2 (1, N = 1,209) = 10.40, p = .001. Youth who received treatment as a service had statistically significantly more rehabilitation outcomes χ2 (1, N = 1,209) = 4.43, p = .035. Finally, the most frequently received service by the participants was vocational rehabilitation and guidance, which was found to be significant in leading to successful rehabilitation outcomes χ2 (1, N = 1,209) = 12.74, p < .001.
A logistic regression model was conducted to test the impact of gender, being White, African American, Latino(a), mental disability, receiving college/university training, information and referral, job placement, job readiness, job search assistance, on-the-job-supports, on-the-job training, other services, treatment, and vocational rehabilitation and guidance (see Table 1). The reference groups were male, non-White, non-African American, non-Latino(a), no mental disability, and for each service the reference group was not receiving the service. The final model explained 14.74% of the variance in statuses 26 and 28. Overall, the model predicted outcomes correctly 63.69% of the time with status 26 being predicted 58.76% versus 68.26% for status 28 (OR = .93, p < .001).
Logistic Regression Model by Rehabilitation Outcome (Status 26 versus Status 28)
Logistic Regression Model by Rehabilitation Outcome (Status 26 versus Status 28)
The logistic regression model predicted that females were significantly less likely to be rehabilitated (OR = .76, p = .033). Moreover, African American youth with disabilities were more likely to be status 28 than youth that were not African American (OR = .59, p = .014). When compared to non-Latino(a) youth with disabilities, those that were Latino (a) were significantly more likely to have a positive employment outcome (OR = 1.38, p = .046).
When looking at mental disability, it was revealed that having a mental disability predicted significantly lower odds of achieving a status 26 outcome (OR = .56, p = .006).
Three services were found to be significant in predicting the success of youth with disabilities. More specifically, receiving job placement services was a significant predictor of a VR employment outcomes for youth with disabilities (OR = 1.71, p < .001). Further, job search assistance strongly predicted successful rehabilitation outcomes for the youth in this dataset (OR = 1.86, p < .001). Finally, the model predicted that vocational rehabilitation and guidance predicted successful status 26 outcomes for the participants (OR = 2.46, p = .016).
Several themes were revealed related to the status progression outcomes of youth that entered the VR system relative to the different demographic factors. Based on the results of the data analysis of participant perceptions, three themes emerged: (1) family involvement and support; (2) resources and opportunities; and (3) systemic barriers. Ineligible statuses (01, 03) and status 30 (closed before plan) were discussed only in the qualitative phase because the only available quantitative information was demographic characteristics.
Family involvement and support
Across participants, family involvement and support was identified as a crucial variable to students’ success or failure in the VR system. One VR counselor believed that females had worse outcomes within the system because, “Typically, parents tend to let young men be more independent than the young ladies. They’re more willing to let young men travel alone as opposed to letting their daughter who has a disability travel by herself.” This participant expressed that many parents felt that independence for a female young adult was not safe and linked this to the infantilization of females with disabilities.
Each participant connected unsuccessful or ineligible closure statuses for African American youth with disabilities to a lack of family involvement and support. One VR counselor discussed the lack of parental involvement in relation to all minority students, “They may not care. They may not even understand what the program is. Therefore, there’s no one telling them to make sure you keep your appointments, make sure you do whatever you need to do to get connected with that adult VR counselor or that transition counselor in school.” While explaining reasons for status 30 closures, a VR counselor explained that the biggest reasons are “ . . . no follow-up, no support first for some of the youth. Mainly African American, which is unfortunate.”
Both VR counselors expressed the opposite for youth of Latino(a) and those of Asian descent. That is, one VR counselor explained, “Latino and Asian students, they tend to have more family support. The family tends to be there every step of the way.” Moreover, the other VR counselor noted, “I would say the Latinos and Caucasian are more than likely to follow-up with their services. One is because I think they have a lot of parental support. The parents are involved and make sure they keep their appointments, and making sure that they’re on track.” Finally, participants discussed family involvement and support specific to disability type. One VR counselor explained, “The parents come with them to make sure they are connected” and in relation to youth with LD, parents of youth with IDD are more involved “versus a student that’s just learning disabled.” Overall, family involvement was identified as a critical component to success, and those lacking family involvement were more likely to be closed as ineligible or status 30.
Resources and opportunities
Participants expressed the importance of resources, and opportunities to the success, or lack thereof, for youth with disabilities in the school district being referred to VR. One University facilitator explained that for older youth, specifically those who are 21 with more severe disabilities, “These kids have—because I think they have more specialized services, they have better outcomes because they are receiving more services.” This participant examined how older youth in the school district often have more severe disabilities necessitating more years of secondary education. Moreover, at age 21, “it’s probably more of a make it or break it type thing . . . they’ve realized they can’t keep sitting at home” (School District Transition Specialist).
Additionally, gender was linked to a lack of opportunities for females:
I think many schools and many programs are still not at the point where they offer the same opportunities for a young girl in high school that they do for a young man. Is it discriminatory? I think it’s discriminatory. Is it right? I don’t think it’s right. (DRS Administrator)
Four participants explored the lack of resources, services, and opportunities for African American youth with disabilities as they related to status 3 and status 30 closures. One reason given was that African American students are often concentrated in schools with less access to programs and services necessary for successful transition outcomes:
A lot of these kids are living in very depressed communities where they attend the schools, the schools that are under-resourced, and overrepresented in special ed. It’s a bad combination of really limited employment opportunities within their own community, too. It’s a combination of context that is not favorable. (University Facilitator)
Two participants spoke about the abundance of community rehabilitation providers and other agencies serving youth with IDD. When discussing why youth with IDD have more success, the school district transition specialist said “there are many more prevalent successful community rehab partners that serve those populations . . . I think it’s because there’s more agencies available to serve somebody with an intellectual disability.”
Participants identified vocational rehabilitation and guidance, job search assistance, and job placement as crucial to the success of youth with disabilities entering the VR system. One DRS administrator thought that “For youth, and the three services are job placement services, job search assistance, and vocational rehabilitation and guidance, the reality is these are the core services or core aspects of supports that anybody is looking towards entering employment will need in their lifetime.” A university facilitator expressed the importance of vocational rehabilitation and guidance for youth with disabilities stating, “ . . . this is the core of a vocational rehabilitation counselor’s job, which is to help the kids understand the process.” In further evaluating this service, the participant suggested, “That means that VR counselors are doing their jobs because they are counseling.” One university facilitator was surprised to see students with higher rates of success based on services with “such vague and broad terminology” and it was unclear “what vocational rehabilitation and guidance means from one office to the next” (University Facilitator). While there are mixed ideas about what services mean, one DRS administrator specified, “Young people that receive these three services are going to be more successful. They’re going to have the knowledge. They’re going to have the guidance. They’re going to have the structure and path.”
Systemic barriers
Almost all participants identified systemic barriers within the VR system as a reason for failure. Both VR administrators described the issue of students not being properly informed about the purpose and benefits of VR, and therefore unsure of why they have been referred, leading to status 30 closures. One DRS administrator explained for students closed at status 30:
The student leaves high school, not really understanding or knowing what the VR program is. Many times they leave there and don’t even know they’ve been referred to the VR program. If any of them met their vocational rehabilitation counselor at their IEP meetings and they were introduced to that person, I’d be surprised.
This DRS administrator believed that students closed at status 30 were never informed of their referral to VR and never met their assigned VR counselor. A school district transition specialist mentioned that some counselors make the assumption that students will not work, and so close the case as ineligible or status 30, “It’s just saying they don’t want to do anything when they graduate. I don’t know why we’re getting all these cases.” One identified reason is that some VR counselors do not understand why they are serving youth with disabilities because “They don’t see this population as helping them reach that goal immediately. Maybe they’ll see that young person two or three years down the road get a job. They can count them as a 26 and now the counselor feels that he’s productive and can show his supervisor how good he is as a vocational counselor” (DRS Administrator). One school district transition specialist made clear that “the counselor is just not writing the plan, because these students are already eligible.”
When discussing youth with mental disabilities, participants expressed that the State’s mental health system is broken “In the area of mental health, it’s very important to understand that our mental health system is very fragmented” (DRS Administrator). Speaking about VR services for youth with mental disabilities, one DRS administrator explained:
What most of the counselors have shared with me is that it’s a challenge with people with mental illness because of the lack of ongoing supports in the mental health service sector that are structured enough to help people sustain their stability for a constant period of time so that they can secure employment and then be on their own.
Discussion
The purpose of this research was to examine whether or not students with disabilities move through the VR system to reach competitive employment outcomes based on their demographic variables and VR services received. The results of the quantitative analyses and perspectives of stakeholders revealed individual level and systemic level factors that affect the employment outcomes of students with disabilities.
Individual level factors
Gender
The results of the study suggest that females are faring worse in the VR system than males. In general, females had similar status progression closures to males except with regards to rehabilitation rates. That is, females had a lower rehabilitation rate than males.
Stakeholders explained that males were identified with disabilities in school more often, therefore entering the system and being rehabilitated at higher rates. This finding is consistent with the literature (Balcazar et al., 2013; Fabian, 2007). In addition, not allowing female youth with disabilities to gain independence and under-identification of disability in females by the school district were specified by participants as reasons for less employment success. Finally, participants agreed that jobs that required a high school degree or less were more accessible for males.
Race/ethnicity
Research has consistently supported that African American youth have less successful outcomes than other youth with disabilities (Awsumb et al., 2016; Balcazar et al., 2013). In the current study African American youth with disabilities had higher unsuccessful closures, lower employment success, and lower rehabilitation rates. Stakeholders elucidated that African American youth often lack family encouragement in seeking services and are hindered by depressed communities and schools that lack sufficient resources. As seen in the literature, failure in the VR system was linked to receiving government subsidies (Fabian, 2007; Luecking & Wittenburg, 2009). However, Honneycutt et al. (2014) found that youth in the VR system have increased employment outcomes and decreased dependence on social security. Consistent with the literature on income and socioeconomic status, youth living in low-income communities with few resources and employment opportunities experienced more unsuccessful employment outcomes (Murray & Naranjo, 2008). Interview participants also noted worse adulthood outcomes as a result of African American youth in schools lacking resources.
Moreover, the results showed that Latino(a) youth with disabilities have the highest rehabilitation rate of any race/ethnicity category. Interview participants explained that many Latino(a) youth have strong family support, which increases the success rate of these youth. In fact, interview participants believed the success of Latino(a) youth with disabilities in VR was exclusively due to family support. The existing literature supports this finding regarding involvement of the family in the VR process as a strong indicator of student success (Keel et al., 2018; Povenmire-Kirk et al., 2010).
Type of disability
Youth with LD were found to have high status 30 closures while having the highest number of VR referrals. One reason for the higher closure at status 30 was a lack of family involvement (Murray & Naranjo, 2008). However, it was also argued that youth with LD might leave the VR system before plan because they do not want services or a disability label in adulthood. Youth with LD had a higher rehabilitation percentage than the average, suggesting that youth with LD are faring better than other disability groups entering the VR system (Awsumb et al., 2016; Fabian, 2007).
Youth with IDD entering the VR system had high percentages of status 3 and status 30 closures, but also had the highest rehabilitation rate of any disability group and the second largest number of referrals. Interview participants indicated that youth with IDD had more service opportunities and well-rounded supports when compared to other disability groups.
Alternatively, Balcazar et al. (2012) found that youth with severe disabilities often have worse employment outcomes. However, interview participants were not clear as to why youth with IDD have high status 3 and status 30 outcomes. One possibility is that counselors believed these youth would not be able to work and received supports from a different service agency. Additionally, counselors may not have contacted youth with IDD as adults or did not know how to support youth with IDD in finding employment. This topic needs further examination.
Finally, youth with mental disabilities were predicted to have lower employment outcomes than youth without mental disabilities. Across interview participants, it was suggested that youth with mental disabilities have less success because of systemic failures. That is, the mental health system in this Midwestern State does not have the capacity to give youth with mental disabilities comprehensive and/or long-term multi-agency coordinated services. Poppen et al. (2016) suggested that lack of appropriate services for youth with mental disabilities is a common occurrence with multi-agency collaboration often missing.
Systems level factors
Status progression outcomes
The results of the descriptive analysis suggest that based on demographic factors, youth with disabilities are disproportionately represented across the different status progression outcomes. In particular, students were overrepresented in status 3 and status 30. General reasons for closure at these statuses included VRs inability to effectively communicate its purpose, poor intra-agency communication about VR resources supporting youth with disabilities, and counselors’ presumptions about limited student work capacity. The stigma of disability labels and minimal community employment opportunities in low-income neighborhoods were also offered as reasons for the higher incidence of status 3 and status 30 closures.
In addition, systemic issues occurred because there are discrepancies in the process of moving a case from referral through plan. Moving a student through plan meant that a student was ready to receive services in high school if necessary, but more likely as soon as the case was moved to an adult counselor. The school district, DRS administrators, and VR counselors all had different accounts of when and how a student’s case was to be moved from referral through plan. The school district advocated that a case should be moved to plan status (not through plan) as soon as the counselor met with the student after referral. DRS administrators explained that students should be moved through plan as soon as the referral was received. Counselors typically followed the adult process, which meant counselors had 30 days to move a case from referral to application, 60 days to move the case to plan, and 90 days to move the case through plan. It was not surprising that the rehabilitation rate of youth with disabilities was so low given the inability to set a standard practice for transition youth and communicate across partners. Further, some students had not been moved to adult services, but had graduated and needed to receive services in order to gain employment.
VR services
The results of the logistic regression model suggested an increased likelihood of employment when youth received job placement services, job search assistance, and vocational rehabilitation and guidance. Participants agreed that youth are more successful when receiving these services as they are the foundational of VR services. Plotner et al. (2012) found two domains that VR counselors were most confident in serving youth with disabilities included (1) vocational rehabilitation and guidance and (2) employment preparation and exploration. However, one interview participant was skeptical about attributing student employment success to receiving vocational rehabilitation and guidance services because there was no standard definition of what must be included in this service. Though one VR counselor made it clear that goals for employment are set under this service.
Employee qualifications
Overwhelmingly, interview participants expressed that VR counselors were not qualified to be working with youth in the school district. This was often suggested in the literature as a serious impediment to effectively serving youth with disabilities (Oertle et al., 2007, 2013; Plotner et al., 2012, 2014). VR counselors often lack knowledge in secondary education and best practices in providing age-appropriate employment services. Moreover, many interview participants discussed that VR counselors are unaware of the purpose of serving youth with disabilities, which compounds the issue of lacking the appropriate secondary education knowledge. Plotner et al. (2014) suggested that counselors were not clear of their role in serving youth with disabilities while in high school.
Limitations of the study
The current study’s findings are significant to better serving youth with disabilities, but several limitations must be examined. One limitation is missing or poorly collected data evidenced by counselor mistakes in the database, which led to the removal of some student data. If a student entered the system, left the system, and returned, they would often receive a new identification number making it impossible to connect the student in the de-identified dataset. Due to improper procedures, many cases received a new identification number when entering adult services. Additionally, the dataset contained more variables than what was examined for the present study. This study examined variables that were most relevant to answer the research questions and did not examine all possible variables in the database.
The qualitative portion of this study is not generalizable given the small number of interviewees. This is both a strength and limitation of the study. Moreover, the qualitative piece was conducted within one-month and while member checks were completed, being able to interview participants at the beginning and end of the school year would have strengthened the results. The original intention was to conduct a focus group with the five current transition counselors. However, only two transition counselors agreed to participate, therefore interviews were more appropriate for data collection.
Implications for practice
The findings of this study suggest there are many implications for increased training within VR. As discussed at length by interview participants, there is a necessity for VR counselors to receive training in secondary transition specifically for youth with disabilities. Ideally, education programs for pre-service VR counselors should add secondary transition courses to the curriculum. Further, within the system, current VR counselors must engage in regular professional development related to the secondary education system, with a focus on working with low-income minority populations and how to involve families in the transition process. Moreover, as was also a result of this study, many counselors and supervisors do not understand the purpose or their role in serving youth with disabilities; therefore, this is essential to add as a continuing education component to in-service VR counselors and supervisors. Two implications for VR training, which would ultimately benefit youth with disabilities, is education on how to translate transition plans into achievable IPE goals and how to deliver individualized services. These should be taught within the DRS system and come from transition experts. There are also discrepancies in understanding the process of VR when working with youth with disabilities; hence, professional development sessions are necessary. VR counselors need training in working with outside agencies including the school district and Community Rehabilitation Providers.
Implications for research
It is important that the intersectionality of different demographic factors as well as service level variables be examined. For example, what do employment outcomes look like for African American males with LD? Moreover, is there a specific combination of services that yield better employment outcomes for certain types of disability? Document comparison of student transition plans and IPEs would yield important information about the function of VR counselors in delivering transition services to support youth goal attainment. Future research should examine the quality of employment outcomes for youth with disabilities served by the VR system including whether services were individualized or their satisfaction with their employment status. Additionally, research that tracks students longitudinally from referral through young adulthood employment, ideally up to five years after graduation is critical. This would yield rich information about the growth and of and barriers encountered by youth with disabilities from the public school district through VR and into adulthood.
Conclusions
Although the results of this study suggest that some groups of students are more successful than others, overall, students with disabilities in the Midwestern public school district being referred to VR must receive better services to attain employment goals. When looking at outcomes of youth with disabilities, participants identified themes including family involvement and support, increased resources, opportunities, services, and community and agency supports, without which students had poorer employment outcomes. Additionally, multiple systemic barriers were referenced which acted as a catalyst for failure for youth with disabilities. The findings from this study support the need for additional funding and Pre-Employment Transition Services for students with disabilities that are now required under WIOA.
Conflict of interest
The authors declare that they have no conflict of interest.
Ethics
Procedures involving experiments on human subjects are done in accord with the ethical standards of the Committee on Human Experimentation of the institution in which the experiments were done or in accord with the Helsinki Declaration of 1975.