
Abstract
BACKGROUND:
Vocational rehabilitation (VR) can potentially help disability-insured workers stay at work or return to work when they experience a disability. Such assistance could prevent or delay entry into the Social Security Disability (SSD) program.
OBJECTIVE:
We present descriptive statistics on the extent to which new VR applicants for 1998 through 2005 receive SSD benefits before or after VR application.
METHODS:
We matched Rehabilitation Services Administration (RSA-911) records for the years 1998 through 2009 with the Social Security Administration’s program and earnings files.
RESULTS:
The analyses show that a substantial number of VR applicants entered SSD in the 60 months following VR application—more than 60,000 (12.3 percent) of the first-time VR applicants in 2002. The analyses also disclose variation in SSD entry across states, with some states accounting for entry percentages twice as high as that of others. We also found a positive relationship between our measure of wait time and entry into SSD.
CONCLUSIONS:
Although the large number of VR applicants entering SSD after VR application is modest compared to the number receiving an SSD award each year, the potential influence of VR services on later SSD and Medicare expenditures could be in the billions of dollars annually, in either direction.
Introduction
Social Security Disability (SSD) benefits, which are administered by the Social Security Administration (SSA), are an essential lifeline for millions of Americans. SSD benefits are available to people with established work histories who have a medically determinable work disability expected either to last at least one year or to result in death. Others with qualifying medical conditions are entitled to SSD by the entitlement of a parent to retirement, survivor, or disability benefits or a widow or widower entitled to survivor benefits. All benefits are paid from the Old Age, Survivors, and Disability Insurance (OASDI) Trust Funds; benefits for workers with disabilities and their dependents (disabled or not) are paid from the Disability Insurance (DI) Trust Fund, whereas benefits for disabled dependents of retirees and deceased workers are paid from the Old Age and Survivors Insurance (OASI) Trust Fund.
Growth in the number of SSD beneficiaries and expenditures is of major concern to policymakers, albeit tempered by a recent unexpected decline. In 2015, following exceptionally rapid growth in the number of beneficiaries from 2007 through 2014, Congress temporarily diverted payroll tax revenues from the OASI Trust Fund to the DI Trust Fund, thereby avoiding the expected 2016 exhaustion of the latter. DI awards have since declined by more than projected, and the most recent trustees report projects the DI Trust Fund’s exhaustion in 2032 (Board of Trustees, 2018). Whether these favorable developments will persist remains uncertain. Further, because the OASI Trust Fund is projected to be exhausted in 2034, there remains considerable pressure to reduce DI expenditures.
Many experts and policymakers believe that early intervention, before an individual enters SSD, is the key to increasing the proportion of workers who stay at work or return to work after disability onset instead of exiting the labor force and entering SSD (see, for instance, McCrery & Pomeroy, 2016). The federal-state Vocational Rehabilitation (VR) program is a potential point of early intervention for all SSD entrants and is by far the largest public program offering employment services exclusively to people with disabilities. VR agencies give priority to individuals who are significantly disabled should the state be unable to serve all eligible individuals. VR helps individuals maximize employment and independent living, but not necessarily with the goal of completely avoiding reliance on SSD. It seems likely that VR services do help some clients support themselves rather than become reliant on SSD, but the extent to which they do so is unknown.
VR counselors coordinate services for eligible clients, including but not limited to, rehabilitation counseling, assistive technology, job accommodations, mental or physical restoration, prosthetic or orthotic devices, job search/placement assistance, transportation, and personal assistance. VR agencies also offer training-related services, such as vocational assessment and postsecondary education ranging from trade school to graduate-level coursework. This does not necessarily mean VR services will result in engagement in substantial gainful activity (SGA), however.
In this paper, we report descriptive information on the extent to which VR applicants receive SSD before or after VR application. We refer to workers, disabled adult children (DAC), and disabled widow(er) beneficiaries (DWB) who receive Social Security Disability Insurance (SSDI) collectively as “Social Security Disability beneficiaries.” We do not include all Supplemental Security Income (SSI) recipients in this definition because SSI benefits are a welfare benefit and not part of the Social Security program, even though SSA administers both programs. We use complete matches of individual-level VR closure records from the Rehabilitation Services Administration (RSA) for 1998 through 2009 to SSA demographic, disability program, and earnings files. Significant numbers of VR closures in the later years of this period are for individuals who applied several years earlier. As a result, we have essentially complete data for annual cohorts of first-time applicants for VR services in each year from 1998 through 2005. Sufficient time had passed before we extracted the data to allow us to track outcomes in SSA records for each cohort for many years after the application year. Much of the analysis focuses on a single applicant cohort—those who applied for VR services in 2002—all of whom we were able to follow for at least 72 months. The analyses shows that a substantial number of VR clients who were not SSD beneficiaries at the time of VR application entered SSD in the 60 months following VR application—almost 60,000 (12.3 percent) of the first-time VR applicants in 2002. SSD entry varies with VR applicant characteristics; those with relatively high SSD entry include non-Hispanic whites, those not employed at application, those with more than a high school education, and, especially, those already receiving SSI but not SSD. We also noted wide variation in SSD entry across states, with some states accounting for entry percentages twice as high as those of other states. We also document variation in applicant wait times across states and the variation’s relationship to flows into SSD. The findings are important for numerous reasons, not the least of which is that they indicate the extent to which interventions targeted at VR applicants could potentially affect the flow of applicants into SSD. Although the large number of VR applicants entering SSD after VR application is modest compared to the number receiving an SSD award each year, the potential for VR services to influence post-VR SSD and Medicare expenditures could be in the billions of dollars annually, in either direction.
Background
SSD eligibility criteria
SSD is the nation’s primary earnings replacement program for workers who become unable to support themselves through work because of a physical or mental impairment (“disabled workers”). The program also provides disability benefits to DACs and DWBs. In making determinations about SSD program eligibility, SSA assesses whether a person (1) is unable to engage in SGA for at least 12 months or until death (“medical eligibility”) and (2) either meets the earnings history requirement for SSD eligibility or is entitled to Social Security as a dependent of another beneficiary (“non-medical eligibility”). SSA defines SGA as the performance of significant physical and/or mental activities in work for pay or profit or in work of a type generally performed for pay or profit. In 2018, SGA is defined as any activity that is comparable to unsubsidized paid work for monthly wages of at least $1,180 for non-blind individuals or $1,970 for blind individuals. The SGA amount includes the total (unsubsidized) earnings net of allowable expenses that SSA classifies under impairment-related work expenses.
After SSD entry, beneficiaries lose their benefits if they engage in SGA for a sufficiently long period. The law requires immediate termination of benefits if the person’s medical condition improves enough to allow engagement in SGA (“medical recovery”) or if the individual engages in SGA before the end of the 12 months starting with the month of disability onset (including the 5-month waiting period). After that, if medical recovery has not occurred, an SSD beneficiary is allowed to engage in SGA for a limited period without benefit loss. The limited period includes 9 trial work period (TWP) months followed by 3 grace period months in which a beneficiary may earn any amount without benefit loss. After that, benefits first are suspended and then terminated (starting in month 37 after TWP completion) if the beneficiary continues to engage in SGA.
The non-medical criterion is complex. There is no minimum age for disabled-worker benefits, but workers must have earnings in jobs covered by Social Security payroll taxes (legally, almost all jobs today). Work history is measured by quarters of coverage (QC). In 2018, one QC requires calendar year earnings of $1,320, an amount adjusted for wage inflation every year, and a maximum of 4 QC may be earned in a year (for annual earnings above $5,280 in 2018). It is important to note that an individual does not have to engage in SGA to earn quarters of coverage; the QC amount is 37 percent as large as three months of earnings at the non-blind SGA amount—$3,540 in 2018. To qualify for SSD, workers under age 24 must have earned at least 6 QC in the last 12 calendar quarters. Starting at age 24, the number of QC required increases by 2 per year, reaching a maximum of 20 at age 30. DAC and DWB do not have to meet work history requirements; their benefits depend on the eligibility of the primary beneficiary.
SSD policy concerns
The number of SSD beneficiaries is large. In December 2017, 8.7 million disabled workers received SSD benefits. In addition, 123,257 DAC and 258,286 DWB beneficiaries received SSD (SSA, 2018, Tables 5.D1, 5.F4, and 5.F8). In 2017, SSA paid an estimated $143 billion in SSD benefits from the DI Trust Fund (Board of Trustees, 2018). The latter figure is less than the year’s $171 billion in DI Trust Fund revenues, and also less than the $157 billion in expenditures that were projected in the Trustees 2015 report, but larger than what revenue would have been in the absence of the temporary reallocation of payroll taxes from the OASI Trust Fund to the DI Trust Fund under the 2015 Bipartisan Budget Act—$130 billion 1 . Additional expenditures for the support of these same SSD beneficiaries under Medicare, Medicaid, and Supplemental Security Income (SSI) roughly double federal expenditures for their support (Riley & Rupp, 2015). Some beneficiaries also receive other public benefits, such as veterans’ compensation, veterans’ health benefits, Supplemental Nutrition Assistance Program (SNAP) benefits, and housing subsidies. As well, some receive private benefits, most notably workers’ compensation and private disability insurance or pension benefits.
Earlier efforts to reduce SSD caseloads and program expenditures have focused on helping beneficiaries return to work with earnings sufficient to permit them to forgo their SSD benefits. To date, most of these efforts have been largely unsuccessful in slowing growth in the number of SSD beneficiaries or public expenditures for their support.
In response, many practitioners and researchers have recommended a different tack: reducing the number of individuals who enter SSD by providing services and incentives that help them establish or maintain self-sufficiency through work rather than through entry into SSD (MacDonald & O’Neil, 2006; Social Security Advisory Board, 2006; Stapleton, O’Day, Livermore, & Imparato, 2006; Autor & Duggan, 2010; Burkhauser & Daly, 2011; Mann & Stapleton, 2011).
As the primary source of publicly funded employment supports for people with disabilities, state VR agencies are well positioned to help people with disabilities return to or remain at work rather than enter SSD, and many SSA beneficiaries have acknowledged the role of VR in their efforts to return to work (GAO, 2007). In the past, SSA has considered testing whether VR agencies could successfully provide early intervention services for disabled worker applicants—effectively diverting them from entry into SSD (Berkowitz, 2002). RSA has also established early intervention as a research priority for existing SSD clients, as profiled in this special journal issue (Foley & Livermore, 2020). According to the RSA 911 data, a substantial percentage of those accepted for VR services report an employment history, although their work experience does not necessarily mean that they meet the work-history requirement for SSD, called “disability-insured status.” This is the first study to examine the extent to which applicants for VR services in fact enter SSD after application for VR services.
Several studies have addressed VR client outcomes and SSD status. They have shown substantial covariation between SSD status and VR employment outcomes or between services provided to SSD beneficiaries and employment outcomes. Evaluations of the SGA Project, an experimental design demonstration featured in this special journal issue, have shown a positive impact on employment and earnings for SSD beneficiaries who receive stepped-up pacing of VR services and engagement (Kehn & Honeycutt, 2020; Sevak & Martin, 2020). Other evidence on causal relationships is limited. Using a quasi-experimental design, Tremblay et al. (2006) found that specialized benefits counseling has a positive impact on the employment outcomes of VR clients with psychiatric disabilities who are on SSD. Using RSA 911 data, Rogers et al. (2005) found that job placement services caused a three-fold increase in competitive employment at closure for SSI and SSD beneficiaries. Researchers also have examined VR outcomes for SSD beneficiaries compared to non-SSD beneficiaries. For example, Stapleton and Erickson (2004) used the Longitudinal Study of the Vocational Rehabilitation Services Program to show that clients who are SSD or SSI beneficiaries are much less likely than other clients to earn above the SGA earnings level even after controlling for many detailed, observed client characteristics.
Substantial evidence outside of VR shows that earlier intervention services can reduce job loss and long-term work disability (see, for instance, McLaren, Reville, & Seabury, 2010; Ben-Shalom, Bruns, Contreary, & Stapleton, 2017). Most of the evidence of success is based on services delivered before termination of the worker’s employment, often in the context of workers’ compensation or private disability insurance programs. Its applicability to VR services is unclear because only a few VR agencies reach out to employers with the intent of helping workers—on the brink of exiting the labor force—remain in work. A quasi-experimental analysis of VR data found evidence that reducing wait times for VR services reduces subsequent entry into SSD (Schimmel et al. 2014). To our knowledge there is no experimental evidence that VR services provided to non-beneficiaries increases their employment and earnings sufficiently to reduce entry into SSD.
This study addresses a gap in the research literature on characteristics and traits related to SSD entry after application for VR services. Researchers have previously examined how VR client characteristics, including program status while receiving VR services, are related to employment outcomes at VR closure, but to our knowledge no one has considered SSD outcomes for those not already receiving SSD.
Data and methods
In this study, we used RSA’s Case Service Report (RSA-911) for the years 1998 through 2009 matched to records from SSA’s Numident File, Ticket Research File (TRF; starting in 2011 the new name for the TRF is the Disability Analysis File [DAF]), and Master Earnings File (MEF). 2
We matched the subfile to the 2009 version of the TRF (TRF09), which includes a record for every individual age 18 to 65 who received an SSD benefit in at least one month since 1996. Among other data, the TRF includes data on monthly benefits, demographic characteristics, primary impairment, TWP status, and months with no benefits following suspension or termination for work. We used the MEF solely to determine whether the applicant’s work history met the SSD eligibility requirement for workers. The TRF and MEF are restricted-use data sets. Hildebrand et al. (2009) provide full documentation on the TRF09.
Briefly, for the RSA 911, we extracted demographic (e.g., race, age, gender) information, programmatic information (such as application, individual plan for employment [IPE], and closure dates), and state agency. We used the Numident to validate the identification information in the 7,457,183 records from the RSA 911 on the basis of Social Security number, sex, and date of birth. We excluded from the analysis file cases that do not match (4.9 percent of those submitted—367,696). Data from the TRF include month of first SSD payment, which we used to determine whether the VR applicant had first received payment of a benefit during or before the VR application month, during or before the applicant’s closure month, and as of the end of 12-month intervals after the month of VR application, up to 72 months. A qualified SSA employee used the MEF record to determine whether the VR client was disability-insured as of the VR application month. The final analysis file includes one record for each unique VR applicant from 1998 to 2005 (N = 3,656,105). Once we created the matched records for new VR applicants, we sorted them according to calendar year of application, creating annual cohorts of new VR applicants. Because our interest is in “new” applicants, we excluded records that indicated previous VR closure within 36 months of the date of application. In addition, some applicants had multiple applications in our sample period, in which case we included only the first. Many of the statistics we present here pertain to the FY 2002 applicants, of which there are 480,566 in the file.
There are a number of known problems with the data. First, we excluded a small share of first-time applicants from 1998 to 2005, especially in the most recent years, because their first cases had not closed by the end of 2009. Second, we cannot be certain that all remaining records account for individuals who were applying for VR services for the first time. This is likely a more significant problem for the early years of the sample period (i.e., Fiscal year 2000 and before) than for the later years, as in later years we are able to observe directly the recent history of VR application for each applicant rather than rely on the RSA 911 information for closures in the last three years. Third, for those awarded SSD benefits, we cannot be certain whether they first received a primary award as a disabled worker or as a DAC or DWB. Instead, we know only their most recently reported status, likely resulting in some errors in classification across status categories as of the application month because some beneficiaries find it advantageous to change their status following the initial SSD award. For instance, a young disabled worker can become dually entitled as a DAC when a parent claims retirement benefits. In our data, such beneficiaries are counted as DAC, but they might not have been DAC at the time of VR application.
Each statistic presented in later sections is based on the sample for the annual cohort indicated. Most of the statistics are means or percentages for the population of all individuals in the applicant cohort of interest, not estimates of those values based on a sample. Hence, we do not present standard errors.
Results
SSD awards to annual VR applicant cohorts, 1998 through 2005
In this section, we present longitudinal SSD award statistics for annual cohorts of new VR applicants for 1998 through 2005. For each cohort, we present statistics on the number and percentage awarded SSD in the month of VR application or earlier, as of VR closure, and as of the end of 12-month intervals after the month of VR application. We also compare the longitudinal percentages across the cohorts to the extent that they have been observed.
In Table 1, we present detailed SSD award statistics. Each statistic is cumulative; that is, it indicates whether an SSD award ever was made to the applicant in or before the month indicated. If an award was made in the past but SSD benefits were suspended or terminated in or before the month indicated, as is true in a small minority of cases, the applicant is still counted as having entered SSD. In Fig. 1, we plot the percentages ever receiving an SSD award.
The number and percentage of new VR applicants ever having received an SSD award as of the VR application month; months 12, 24, 36, 48, 60, and 72 since application; and at VR closure, by application year
The number and percentage of new VR applicants ever having received an SSD award as of the VR application month; months 12, 24, 36, 48, 60, and 72 since application; and at VR closure, by application year
Sources: RSA 911 and TRF.

Percentage of new VR applicants ever receiving an SSD award as of VR application month and months 12, 24, 36, 48, and 60 since application, by application year.
For all cohorts with 72 months of data post-application, we found that the percentage of VR applicants having entered SSD increased by 12.6 to 13.7 percentage points from the application month until 72 months later (Table 1). There is a substantial positive trend across successive cohorts in the percentage entering SSD as of VR application and a positive, but lower, increase in the percentage entering as of closure. For each cohort, the largest 12-month increase in SSD awards occurred in the first 12 months after VR application. The cohorts for years 1998 through 2000 show the largest percentage increases as of the 12th month. After 24 months, the percentage of new VR applicants receiving an SSD award in each cohort increases by approximately 1 to 2 percentage points per year.
In Fig. 1, we plot data on the 1998 through 2003 cohorts over the 60 months after VR application. We exclude the later cohorts because incomplete processing of their SSD applications might affect their SSD entry statistics for later months. Using the 1999 trend line as an example, we show that 2.8 percent (13,604) of the new VR applicants had entered SSD as of the month of application. The percentage entering SSD increased rapidly during the first 36 months, rising to 14.5 percent by 60 months after VR application. In Fig. 1, we also show an increase in the annual trend in the percentage entering SSD by the time of VR application, from 1.2 percent for the 1998 cohort to 6.3 percent for the 2003 cohort, with an approximately equal increase as of 60 months after VR application (from 12.5 to 17.6 percent). The fact that the percentage at 60 months for the 2003 cohort is slightly lower than the corresponding value for the 2002 cohort might reflect longer-than-usual processing times for SSD applications following a recession-induced surge in applications that started in 2008.
In this section, we present findings on the relationship between new VR applicant characteristics and SSD status at application, at closure, and 60 months after closure. We focus on the 2002 new applicant cohort because 2002 is the first year that changes in the RSA 911 data requirements were fully implemented (RSA, 2002). Characteristics at VR application include socioeconomic and disability characteristics observed in the RSA data, SSI entry, state of application, disability-insured status, and SSD entry.
Table 2 presents statistics on SSD status of the 2002 cohort of VR applicants as of VR application, closure, and 60 months after closure by demographic and socioeconomic characteristics. As Table 2 indicates, the majority of VR applicants were male (55 percent), most were non-Hispanic white (64.3 percent), and over 40 percent were under age 30. Among racial or ethnic groups, Hawaiians and Pacific Islanders were the least likely to receive SSD by 60 months after VR application, and Non-Hispanic whites were the most likely to do so. VR applicants age 50 through 59 were most likely to receive SSD at 60 months and had the largest percentage point increase in SSD entry between application and closure. The higher the level of education at application, the more likely the applicant had already entered SSD or had done so as of closure and at 60 months. For example, 5.8 percent of VR applicants with a high school diploma had already entered SSD compared to 9.8 percent of those with a bachelor’s degree; at 60 months both figures are higher, and the difference is larger—19.2 percent for high school graduates and 26.2 percent for those with bachelor’s degrees.
Demographic characteristics of the 2002 new VR applicant cohort and percentage ever awarded SSD as of application, closure, and 60 months after application
Demographic characteristics of the 2002 new VR applicant cohort and percentage ever awarded SSD as of application, closure, and 60 months after application
Sources: RSA 911 2002 and TRF. Note: There were no people who were both under age 18 and an SSD beneficiary at the time of VR application. FRA: Federal retirement age.
A majority of first-time VR applicants in 2002 were reported to have a cognitive impairment (22.6 percent), a psychosocial impairment (19.3 percent), or other mental impairment (10.4 percent). However, those with vision, orthopedic/neurological and other physical impairments were more likely to have entered SSD as of VR application. Those with hearing impairments were substantially less likely than others to have entered SSD. All groups experienced substantial increases in SSD entry by VR closure and 60 months after application, but the relative rankings of the impairment groups remained approximately the same.
Table 3 presents statistics on SSD status at VR application, closure and 60 months after application by employment and program status at application. As expected, VR applicants employed at time of application were less likely to have entered SSD as of application, closure, or 60 months after application. Among those who were in SSI current pay status at the time of VR application, a large percentage (28 percent) had also entered SSD as of application. That figure increases to 50 percent at closure and 94 percent at 60 months. Although some might have entered SSD as DAC or DWB, it seems likely that many earned enough to become disability-insured.
Employment and program status of the 2002 new VR applicant cohort and percentage ever awarded SSD as of application, closure, and 60 months after application
Sources: RSA 911, MEF, and TRF. aClassification as DAC/DWB is based on most recent status reported in the TRF, and some VR applicants who were disabled workers as of the application month might have subsequently attained DAC/DWB status, or vice versa. bThe base for percentages in this row is the total number of applicants in the SSD not entered category.
As expected, we found that those determined to be disability insured at VR application were much more likely than those not disability insured to be receiving SSD (by 5.1 percentage points), but the difference narrowed by the month 60 (3.9 percentage points)—presumably in part because some of those not disability insured at VR application became disability insured due to later employment. The finding that 2.9 percent of those who were not disability insured at VR application had been previously awarded SSD is at least in part because some had DAC or DWB awards, based on the status of a primary beneficiary. 3 One other explanation is that the algorithm used to determine disability insured status may have misclassified some of those having entered SSD before VR application as not disability insured because it did not account for the freeze in disability-insured status that occurs when workers first enter SSD. 4
The final set of statistics in Table 3 addresses SSD status as of VR application. Here we differentiate between disabled workers and DAC/DWB as of the most recent status in the TRF09. Their status might have changed since VR application; specifically, some disabled workers might have become DAC/DWB and vice-versa. We show that, at most, only a very small share of applicants had entered SSD already in DAC/DWB status (0.6 percent); over eight times as many (at least 4.9 percent) had already entered SSD as disabled workers. Those who entered SSD only after application were much more likely to be in the disabled worker category than in DAC/DWB status; for instance, at 60 months, 0.7 percent of this group at most had entered as DAC or DWB (given the possible classification change), whereas at least 12.3 percent had entered as disabled workers.
In Fig. 2, we display cumulative SSD entry statistics by state of VR application. The bottom bar for each state indicates the percentage ever awarded SSD at application, the middle bar shows the additional percentage awarded SSD by the closure month, and the top bar shows the additional percentage awarded SSD through month 60 after application. The states have been ordered according to the percentage ever awarded SSD through month 60. Puerto Rico, South Carolina, Utah, and the District of Columbia are at the low end of the spectrum, at under 15 percent entering SSD through month 60. Maine, Massachusetts, and New Hampshire are at the high end, with approximately 30 percent—more than twice as high as states with the lowest percentages. Among the larger states, Texas and New York have relatively lower rates of SSD entry. Relatively high rates of SSD entry might imply relatively low rates of employment success among those already disability insured at VR application, but could also imply relatively high rates of employment success and attainment of disability insured status among those not disability insured at VR application.
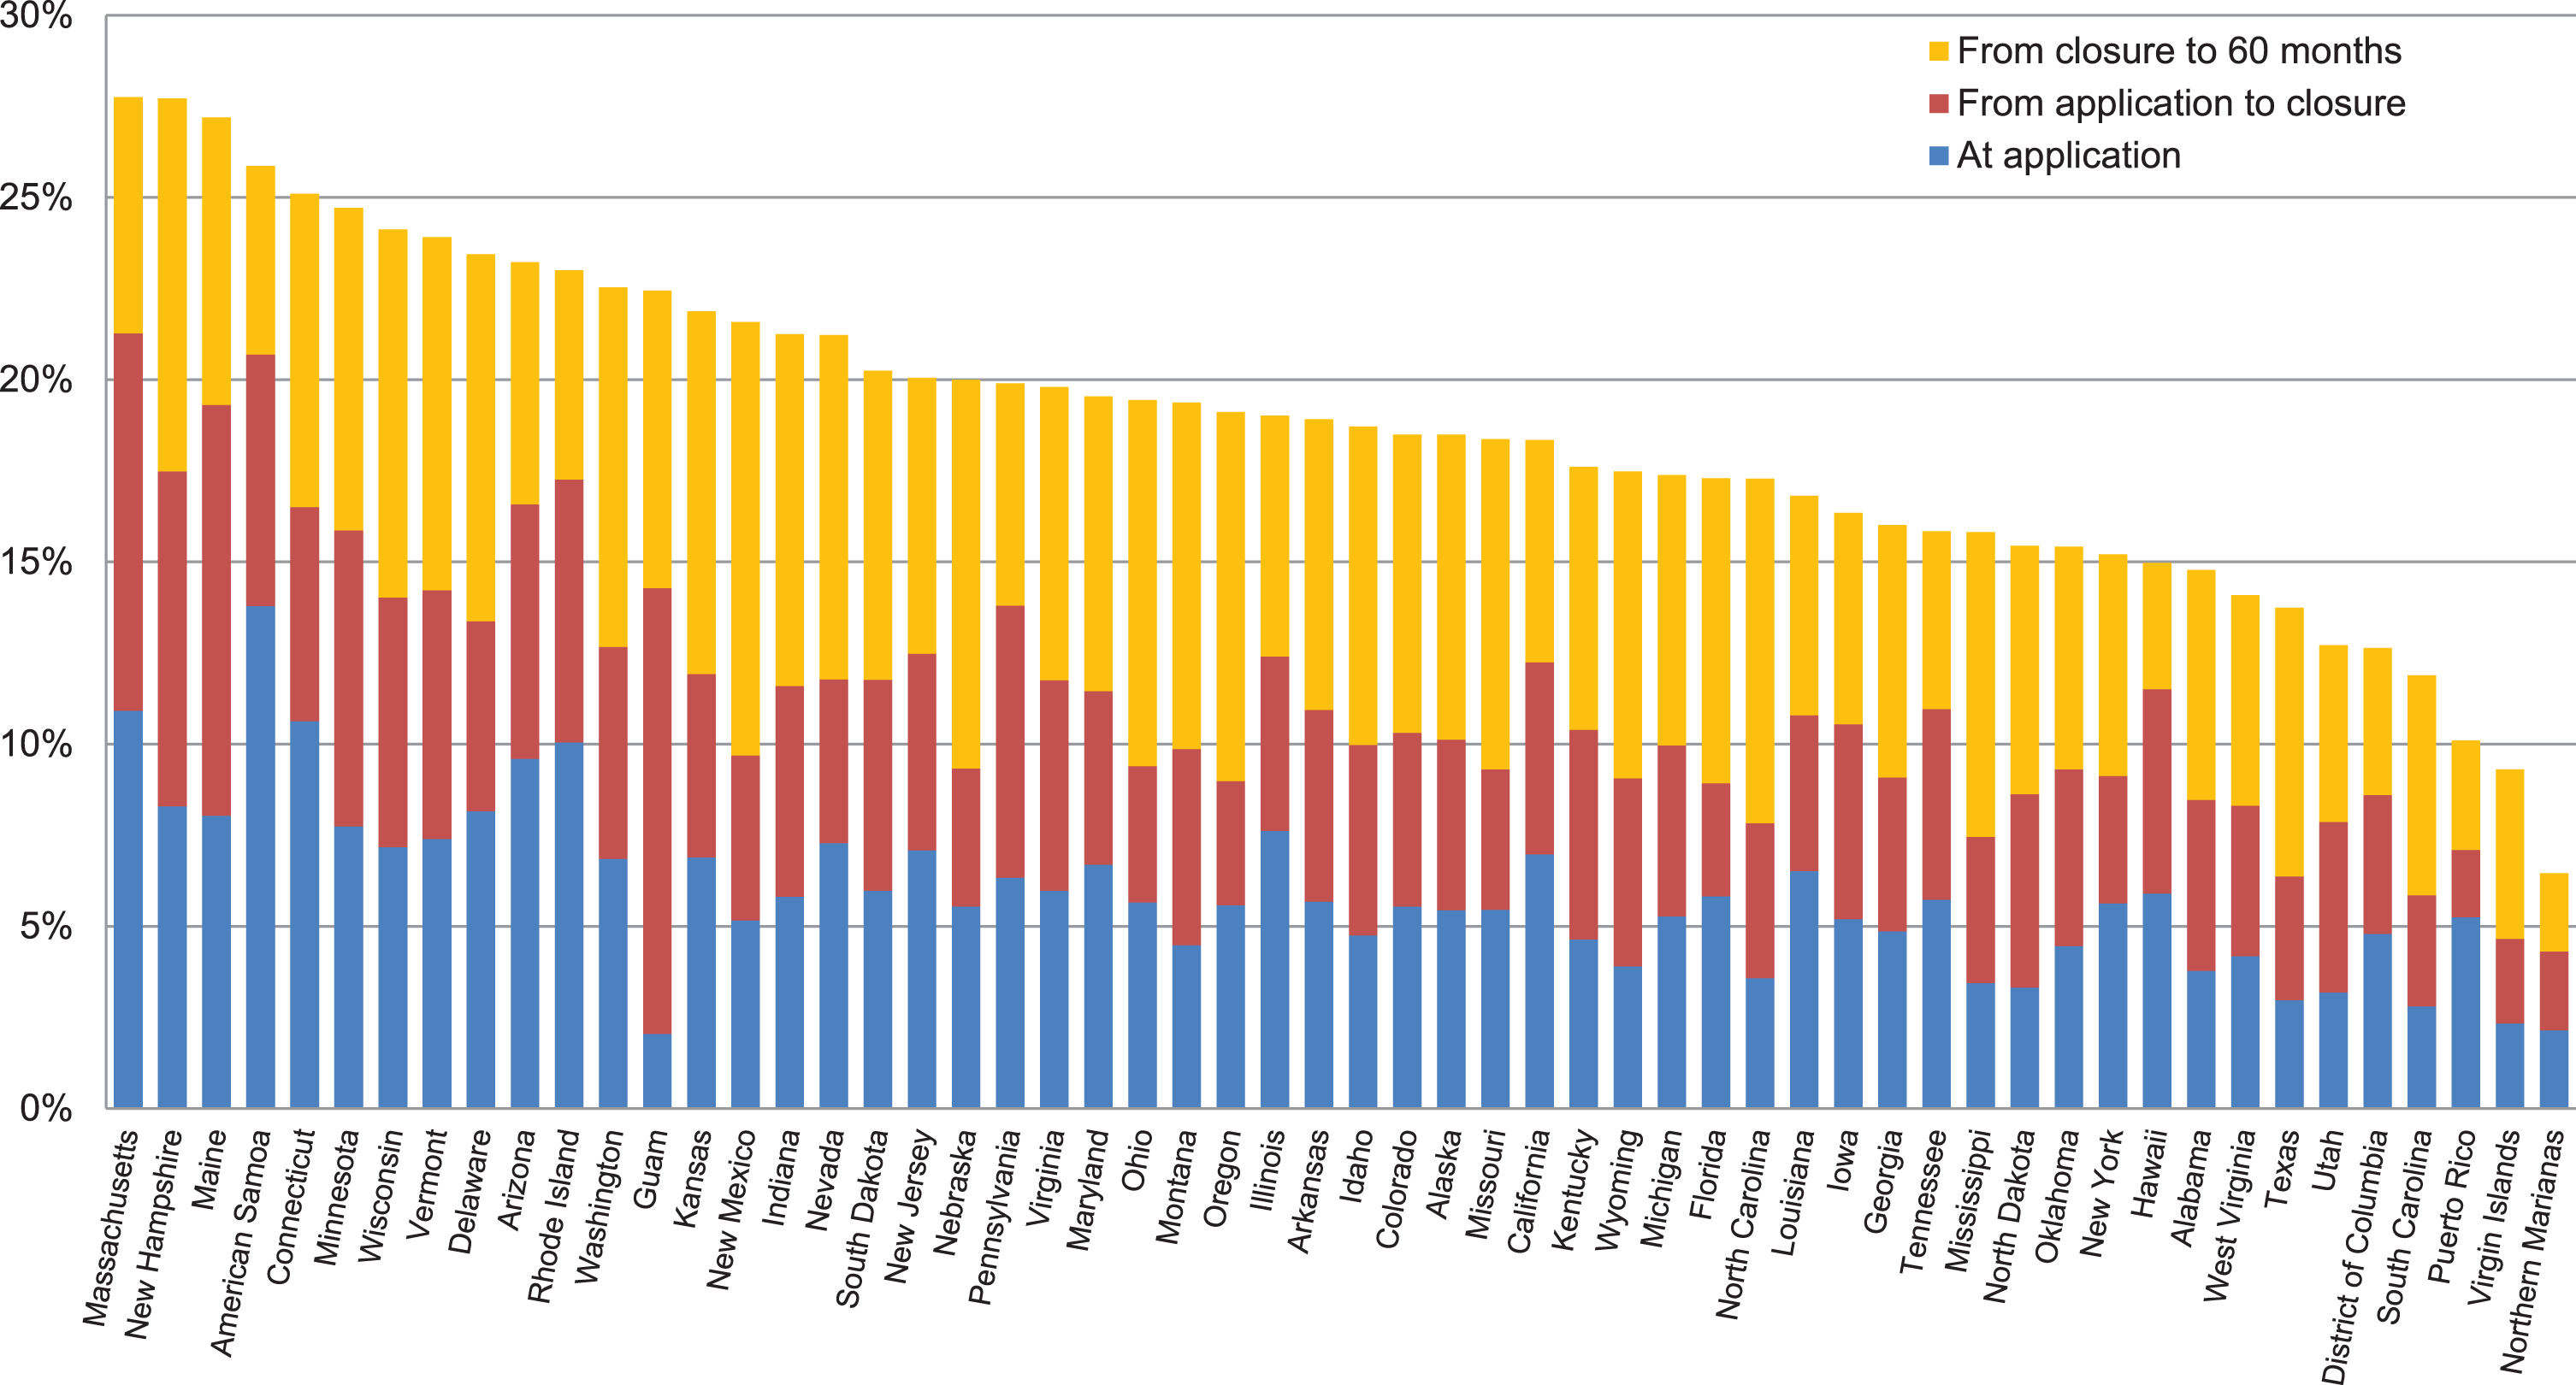
Percentage of the 2002 new VR applicant cohort ever awarded SSD at application, closure, and 60 months after application, by state of application.
We found that the longer the delay from application to service delivery, the more likely the applicant will enter SSD by VR case closure or within 60 months after application. Our measure of the delay is the duration from the application date until completion of an IPE. An IPE is required by federal regulations and represents the first completed step in the service delivery process. Although available for all states, cross-state variation in the administrative use of the IPE likely reduces comparability of duration to IPE across states.
The data for the 2002 new VR applicants not enrolled in SSD demonstrate that, in fact, there is substantial variation in duration to IPE across applicants within a single year (Table 4, first column). Almost 36 percent of applicants who were not on SSD at the time of VR application had an IPE within three months of application, and an additional 10 percent had one within six months. Another 11 percent received an IPE before closure, but some took longer than three years. Almost 43 percent of the cases were closed without completion of an IPE. The last group includes applicants whom the agency determined were ineligible for services as well as those who were eligible but whose cases were closed without receiving any services.
Duration from application to IPE for the 2002 new VR applicant cohort and percent ever awarded SSD as of VR application month, closure, and 60 a months after application
Duration from application to IPE for the 2002 new VR applicant cohort and percent ever awarded SSD as of VR application month, closure, and 60 a months after application
Sources: RSA 911 2002 and TRF.
If delays in VR services accelerate (or decelerate) SSD entry, holding other things constant, we would expect a positive (or negative) relationship between duration to IPE and entry into SSD in the period after VR application. Statistics in Table 4 (columns 2 and 3) show that, for those with an IPE at case closure, there is a positive relationship between duration to IPE and SSD entry following application. At closure, the percentage entering SSD increases monotonically with duration to IPE. Compared to those receiving an IPE within 3 months of application, those receiving an IPE more than 36 months after application are more than twice as likely to have entered SSD (11.8 versus 5.4 percent). At 60 months after application (columns 4 and 5), the relationship is also positive, but not as strong; 11.9 percent of those with an IPE within 3 months had entered SSD versus 14.3 percent of those receiving an IPE after 36 months.
The observed positive association between service delays and SSD entry cannot necessarily be attributed to the causal effect of VR service delay on SSD entry because characteristics of applicants that contribute to delays may also increase the likelihood of SSD entry. For example, it might systematically take VR agencies longer to develop IPEs for applicants with more severe disabilities, and these are the applicants most likely to enter SSD. Applicants without an IPE at closure are less likely than all others to have entered SSD at closure (3.3 versus 6.3 percent) but are more likely than others to have entered SSD as of 60 months (13.6 versus 12.5 percent).
Using matched RSA and SSA data, this study has produced longitudinal statistics on the percentage of VR applicants who enter SSD and the timing of that entry relative to VR application. For 2002, we found that 5.5 percent of first-time applicants had received an SSD award before VR application, 10.3 percent by VR closure, and 17.8 percent by month 60.
We also produced extensive statistics on how SSD entry varies with the characteristics of first-time VR applicants at the time of VR application. This analysis focused on the 2002 cohort, again followed for 60 months. Groups with relatively high SSD entry include non-Hispanic whites, those not employed at application, those with more than a high school education, and, especially, those who had entered SSI as of the VR application date. For the 2002 cohort that entered SSI, 28 percent had also entered SSD as of VR application, increasing to 50 percent at VR closure and 94 percent at month 60. There is also variation in SSD entry across states, with 60-month entry ranging from approximately 15 to 30 percent.
Our analysis of duration from application month to IPE found wide variation in waiting time for the 2002 cohort. After we reported these findings in our longer working paper (Stapleton and Martin 2012), Schimmel Hyde, Honeycutt and Stapleton (2014) reported non-experimental evidence that longer delays actually increased SSD entry after VR application. More specifically, they found that SSD entry as of 60 months among those not receiving SSD at VR application increased with a measure of the typical duration from VR application to IPE for all those applying for services in the same state and month of the applicant. Honeycutt and Stapleton (2013) conducted a similar analysis for those already on SSD at VR application and found that, the longer this measure of the delay, the less likely the applicant was to achieve employment with substantial earnings. This line of research was a major reason that the SGA Project included “rapid pacing”—that is, acceleration of eligibility determination, IPE completion and subsequent service delivery—as a component of its experimental intervention (Foley & Livermore, 2020).
Most important, our results show that VR agencies are already offering what might reasonably be called early intervention services to substantial numbers of potential SSD entrants in each year. For the 2003 cohort of new VR applicants, 50,829 entered SSD after VR application. Although the number is large, it is modest by comparison to the total of 829,831 individuals who received SSD awards in 2003 (SSA, 2004). Of course, we do not know whether VR services helped these individuals delay or accelerate SSD entry, and we do not know how services affected SSD entry for those who had not entered as of 60 months after application.
Reducing SSD entry has never been an explicit mission of VR agencies. According to RSA’s website, the mission of VR agencies today is to maximize their clients’ employment, independence and integration into the community and the competitive labor market. 5 For many clients, the best opportunity may be to combine benefits with work. Given the mission, there is no reason to expect that VR services either increase or decrease entry into SSD.
Even a small impact of VR services on SSD entry, in either direction, could imply an impact on SSD, Medicare, Medicaid, and SSI expenditures in the billions of dollars each year. Riley and Rupp (2015) estimate that life-time expenditures for the typical SSD or SSI entrant under these four programs total about $300,000. To illustrate, if VR agencies are currently reducing SSD entry by 10,000 per year, the savings are on the order of $3 billion per year—comparable to total federal grants to the state VR agencies. Conversely, if they are effectively increasing SSD entry by 10,000 per year, they could be increasing federal expenditures for other programs by that same amount.
The potential for VR services to reduce or delay SSD entry is perhaps much more important than the extent to which VR services currently delay or accelerate entry. Perhaps a more aggressive effort requiring VR agencies to help workers with disabilities remain in the workforce rather than enter SSD would also pay for itself through reduced SSD and Medicare expenditures, although there is no guarantee. One option would be an increase in federal funding for VR services specifically for workers with chronic medical conditions to support immediate continuation of work, perhaps via their employers. Alabama’s Retaining a Valued Employee (RAVE) initiative and similar programs in Arkansas, Georgia, South Carolina, and possibly other states already provide such services on a limited scale (Alabama Department of Rehabilitation Services, 2018). Another option is to increase support for VR agency services in the context of broader initiatives to improve workforce retention of such workers, including initiatives to be tested under the U.S. Department of Labor’s Retaining Employment and Talent after Injury/Illness Network (RETAIN) demonstration grants to states (DOL, 2018). In addition to improving outcomes for workers and their employers, such investments have the potential to more than pay for themselves through SSD, SSI, Medicare, and Medicaid savings. Extensive development and testing of any such initiative is critical, however, as the result of implementation of such initiatives without testing could be poorer outcomes for workers and their employers or increased public expenditures for their support.
Conflict of interest
None to report.
Footnotes
Acknowledgments
We are grateful for the programming assistance of Mathematica’s Dawn Phelps; the assistance of the Social Security Administration’s Jim Sears and Thuy Ho, particularly for their analysis of earnings records; and the comments of David Wittenburg, Todd Honeycutt and Paul O’Leary on earlier drafts. This work was supported by a grant from SSA through the Michigan Retirement Research Center (Grant #3001657991-UM11-03). The findings and conclusions expressed are solely those of the authors and do not represent the views of SSA, any agency of the federal government, or the Michigan Retirement Research Center.
Calculated as actual revenue ($171 billion) times the pre-2016 DI payroll tax rate (1.80) divided by the temporary rate for 2016 to 2018 (2.370). Source: Bipartisan Budget Act of 2015 (Public Law 114-74, Title C, section 833).
We accessed the MEF through the assistance of qualified SSA personnel.
To investigate this further, we produced statistics on the ages of the 46,348 individuals (1.3 percent) across all cohort years (1998 through 2005) who had received an SSD award but were determined to not be disability-insured at the time of VR application (see Stapleton & Martin, 2012). If many are DAC, we would expect them to be relatively young. We found that nearly 50 percent were age 29 or younger compared to 40 percent of the entire 2002 cohort.
More specifically, the algorithm used to determine disability-insured status is based on earnings only, regardless of SSD status. The “disability status freeze” occurs when a disability-insured worker first obtains benefits; after benefits start, the worker maintains disability-insured status without regard to subsequent earnings.