
Abstract
Citation pattern analysis is an important component for measuring research performance of the author. Co-citation analysis has been used as an effective method to find citation pattern analysis, but it does not take co-occurrence analysis among authors. A method to find co-occurrence analysis among authors is proposed in this work. Web of science citation data set is used for experimentation and parsing of this data, extracted first author name and CR link. The next step in the proposed model is to find first author co-occurrence frequency and followed by all author co-occurrence frequency. In this work applied network density, Triadic closure on co-citation graph. The proposed method provides the author-author co-relation, predicting, who is probably next co-author and author collaborate on community of authors.
Introduction
Publication of the scientific articles is the important activity in the research domain. Scientific journals are used to report academic achievements, so they play very important role in scientific research development. Every scientific article contains reference to other’s article, which are having relevance and mention other researcher’s contributions. Citation is not just a reference item at the end of the article citation index. It is the representation of relationship between the present work doing and the work of another author [2].
The basic element connecting research is the citation of related author’s publication or article. Understanding the use of references in a document is essential to conduct a successful research. The citations from a paper reinforce its arguments and connect it to an intellectual linkage, and the citations to a paper enable communities to evaluate its intellectual contribution and quality. Generally, co-occurrence analysis is the process of counting of paired data with some relation. In this work co-occurrence process is used find relationship between various authors in the scientific document domain. Co-citation is indicated that someone cites any article in their work and the same is cited by another author in a new document of his/her own. This kind of co-citation of authors is mostly attractive. The graph can be generated in analytical manner to know the interrelationship of the author in specific field [1]. The citation context analysis provides to achieve this understanding because, it provides useful information such as citation purpose or function in the scientific document and it provides impact assessment.
Literature study
The study reveals that Co-citation analysis has been used as an effective method to find citation pattern analysis, but it does not take co-occurrence analysis among authors. Buzydlowski [6] was concluded that the collection of all the co-occurring elements form a framework from which to mine associations, be them in the form of clusters, association rules, or transitive associations and can be found within systems which highlight for the analyst those unknown facts. White and Griffith [1], carried out the number of co-occurrences of any two different authors is calculated as an author co-citation frequency, and this analysis used Pearson correlation coefficient. Boyacket et al. [3], they were used bibliographic coupling methods which gave the most accurate solutions, followed by co-citation analysis. Hernandez-Alvares et al. [7], suggested the scheme and develop corpus could be applied for summery generation and information retrieval the scheme on annotation corpus in general dimensions like purpose, polarity and aspects. Yu et al. [16, 8] suggested that feasibility to recognize abnormal journals involved coercive self-citation. They considered 11 features used to constructing the feature space to describe journal citation behaviours. Jurgens et al. [9], mentioned on their work behavioural analysis of scientific fields using a new corpus annotated with citation function and centrality. They demonstrated that, how author is sensitive to communication structure and publication venue, while citing. Trujillo and Long [4] constructed co-citation network through bibliographic data. These data were used to recognize by system and then validate by testing their internal consistency external validity and stability [13, 14, 15]. Yoo Kyung Jeong, Min Song, Ying Ding were mentioned how to perform Content-based Author Co-Citation Analysis effectively in their work [20]. Many studies already have verified the quality, scope, visibility and effectiveness of citations and few researchers misleading the citation and influencing.
According to our study presently citations are used in the research valuation to circumvent proper evaluations and focused on quantity only [19]. Semantic relationship between cited documents is one of the vital parts in the evolution process [17, 18]. Content based analysis is also necessary to evaluate citation of the scientific documents.
In the information science, particularly information retrieval co-occurrence matrix generated, and it can be used as co-citation, co-word and co-link matrices [21]. Schneider el al. done comparative study done on all author co-citation analysis [22]. They have done analysis on first-versus and all author co-citation count along with matrix generation approaches. Kumar et al. mentioned the author similarity identification based on doing similar work in the domain of the ACL anthology [23]. LoetLeydesdorff is experimented Pearson’s correlation coefficient and cosine similarity measure on author citation analysis and found the correlation analysis [24]. Bornaman et al. introduced new type of bibliometric networks. In this work authors performs keyword co-occurrence networks based on the context of citations [25].
The broad literature study related to co-occurrence analysis on various scientific documents gives to road map to this work particularly co-citation network analysis.
Proposed model
The proposed model initially parsing of the web of science citation data and initially extract the first author details and find the co-occurrence frequency of the first author pair. After performed the first author co-occurrence frequency, perform all author co-occurrence frequency, which will show in the co-citation analysis and visualized in the co-citation network graph.
Proposed model to visualization of co-citation analysis using co-occurrence frequency.
Edge list for the web of science data set.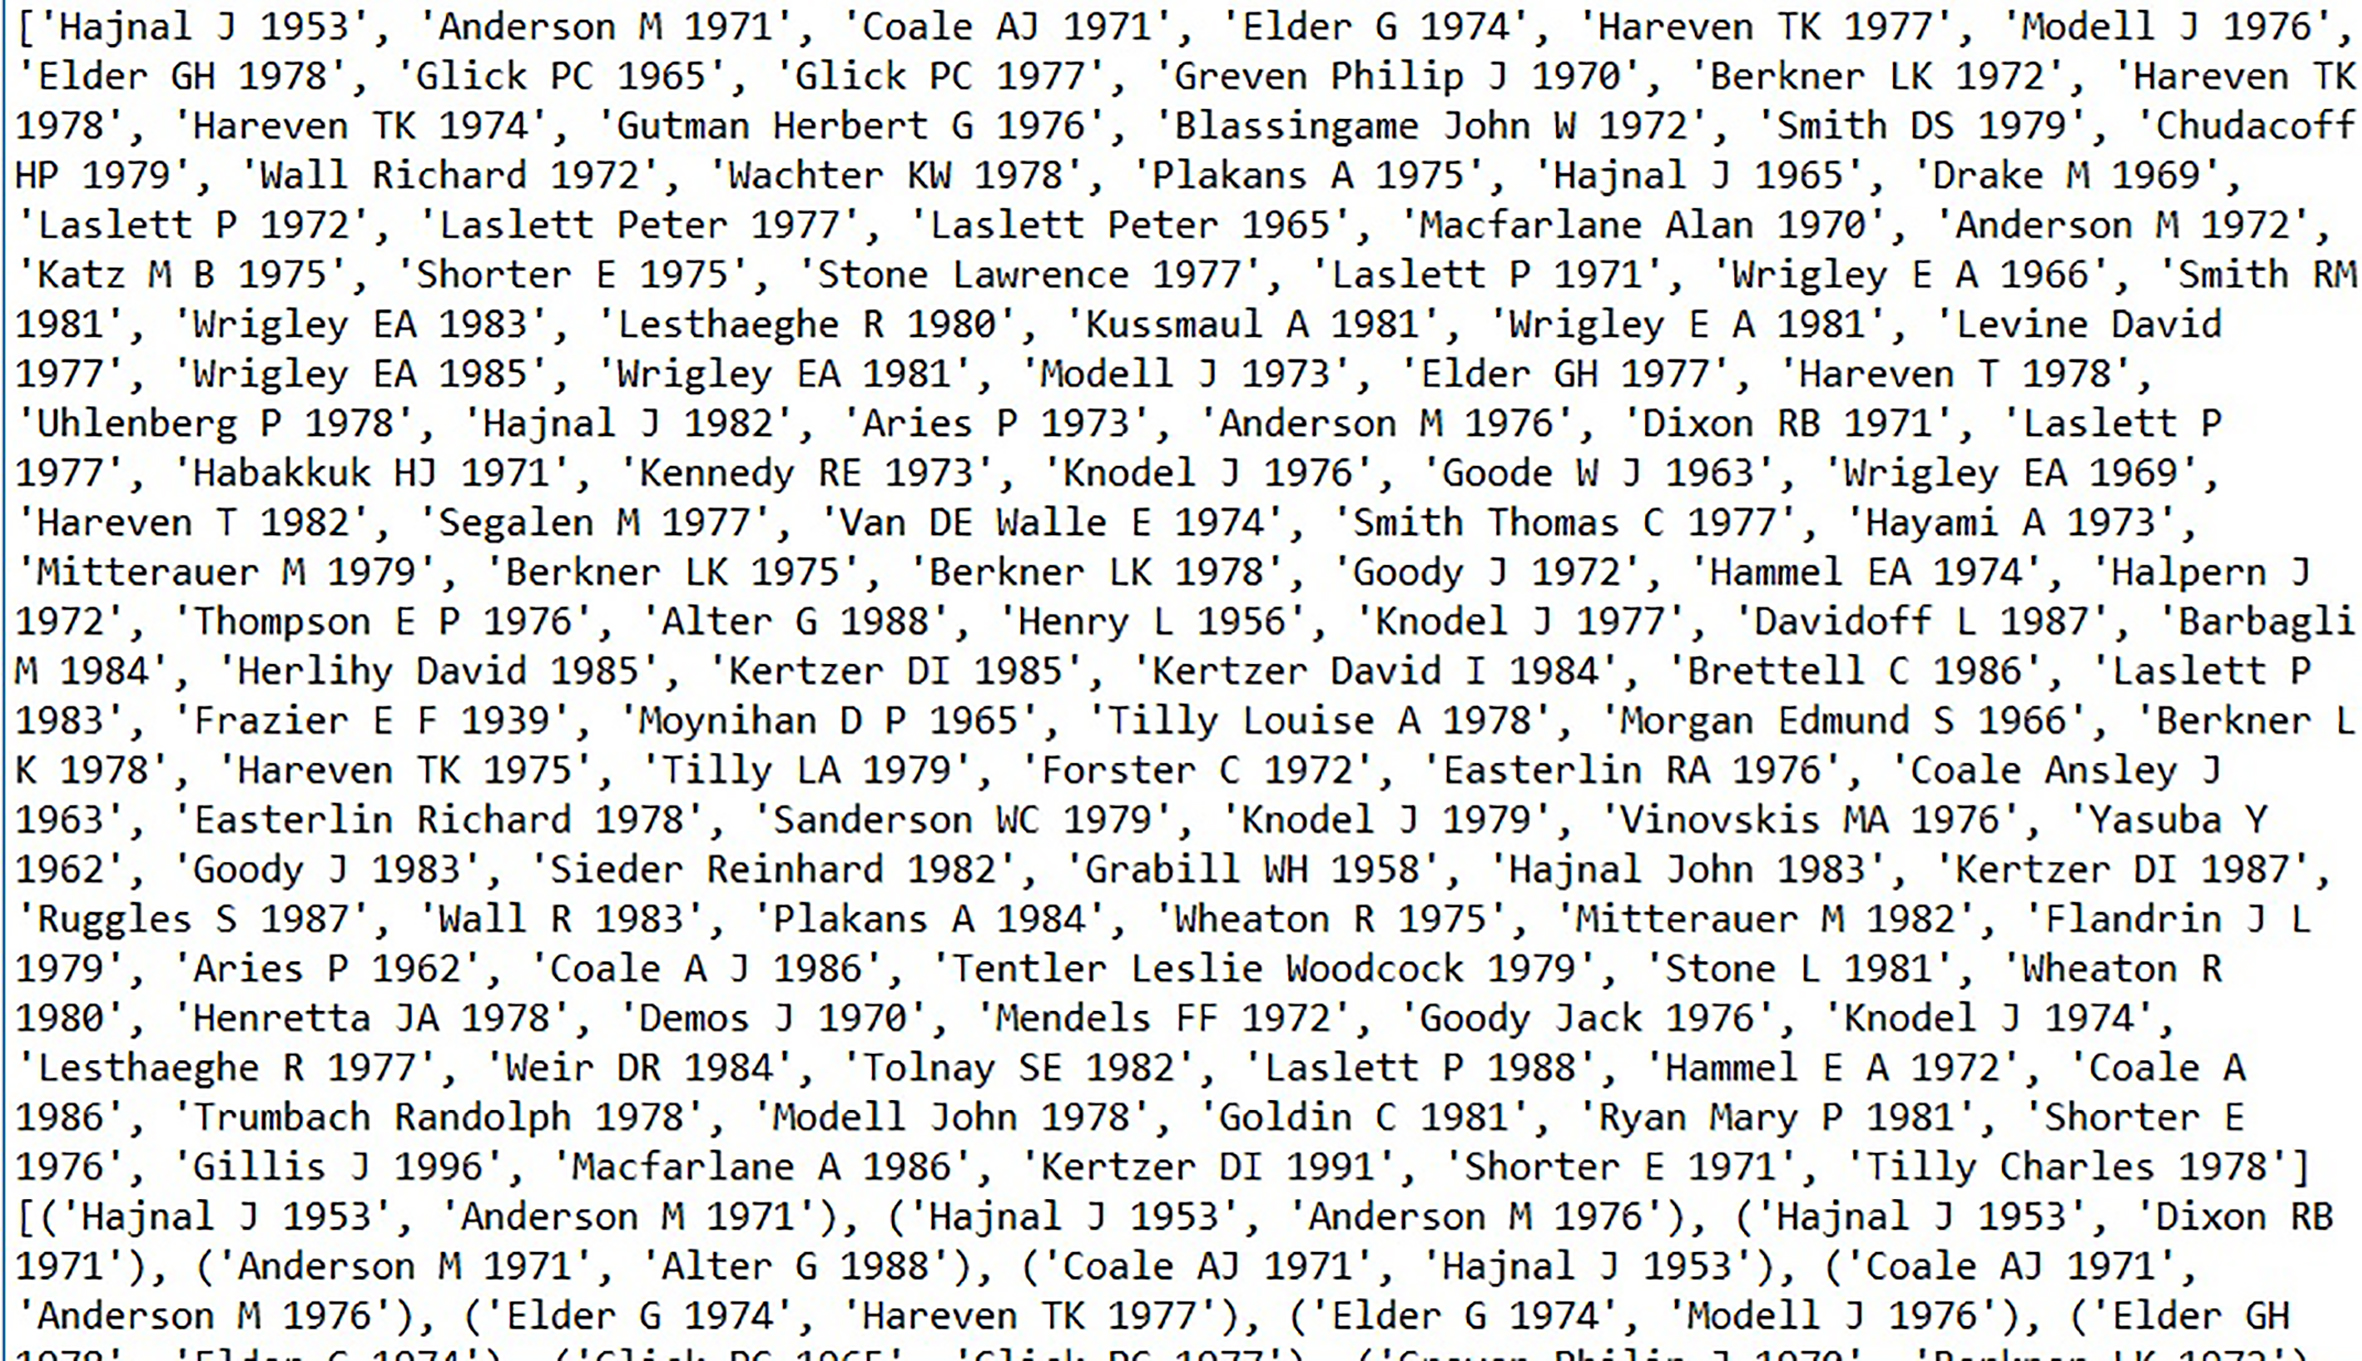
Co-citation graph for web of science data set.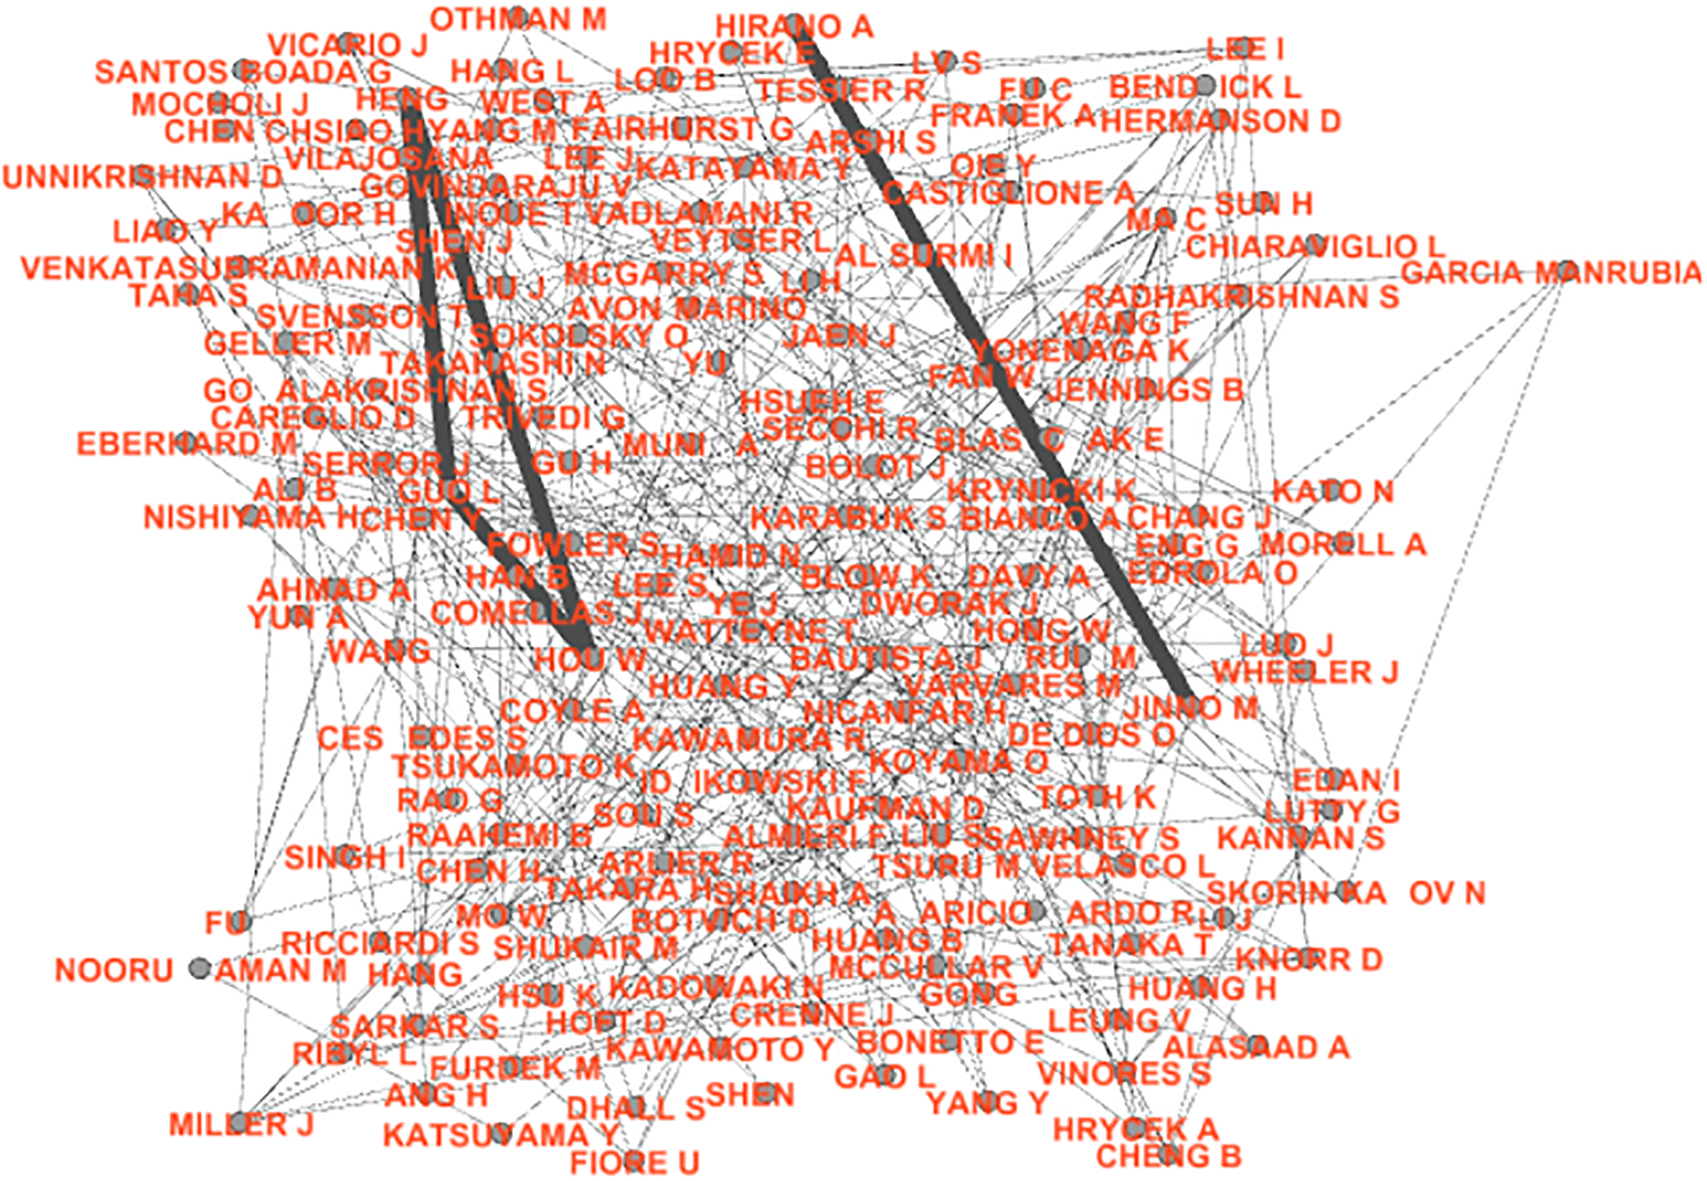
In this model basically performs the pre-processing of web of science scientific documents. Initially extracted first author name and its cited references (CR) link and then make it as co-occurrence frequency matrix. Another vital part is also performing in the proposed model, which can have called as co-citation of all author pair. In the proposed model various scientific documents are organized in the co-occurrence matrix form and for its comparison used cosine similarity measure, which can be shown in the Eq. (3).
The proposed model is implemented using python language. The web of science data set has been taken as input the whole experimentation to find the co-citation analysis generated co-citation graph. The experimentation performs to find first author pair co-occurrence frequency and all author pair co-occurrence.
Data set
Web of science data set is world leading citation database. In the science citation index expanded, there are over 8850 major journals across 150 disciplines. We have chosen subset of the data set in this experimentation. Web of science data contains many core fields, in this there are two-character alphabet filed tags in the records. For example, AU indicates Author, AF indicates Author Full name, BA Book author, CA Group Authors, CR indicates cited references etc., Web of science data set is the world’s most trusted citation index data set. Web of science data is reliable, and it contains complete Meta data from huge repository. In this data set full author and institutional affiliation information also indexed.
Experimentation process
The proposed work is implemented using Python language. Initially web of science data set is connected to the pre-processing step and extracted names of the authors in their research paper. The next step in this work is generated co-occurrence frequency matrix to check co citation analysis with using edge list as shown in the Fig. 2. The network density is calculated as per the co-citation network graph for the web of science data. Co-citation is performed based on the network graph and its properties namely network density, triadic property. The performance analysis is shown experimentation results section.
Experimentation results
Co-citation network graph
The co-citation network graph delivers visualization of research communication among various authors. Each circle in the graph represents citation and the complete graph represents the citation among various articles. The web of science citation data set used for the experimentation, which is represented the association of various scientific documents and their citation. The Python language used to generate the citation network graph shown in the Fig. 3. It measures the frequency of jointly citation of various authors in the scientific graphs. The network contains nodes and edges, which can represent in the co-occurrence matrix. In the co-occurrence matrix values names represents nodes of the graph and edges represents weights.
Network density
Network density is one of the important measures to calculate the potentiality of the connection in the network. The potentiality of the connection is a connection that might potentially exist between any two nodes in the network [10, 11].
Network density calculation
The network density is calculated based on the potential connections between nodes in the network. The following Eq. (2) used for to find potential connections and network density.
Here ‘
For example, in the network there are three nodes are connected as shown in the above Fig. 4.
Examples of different networks.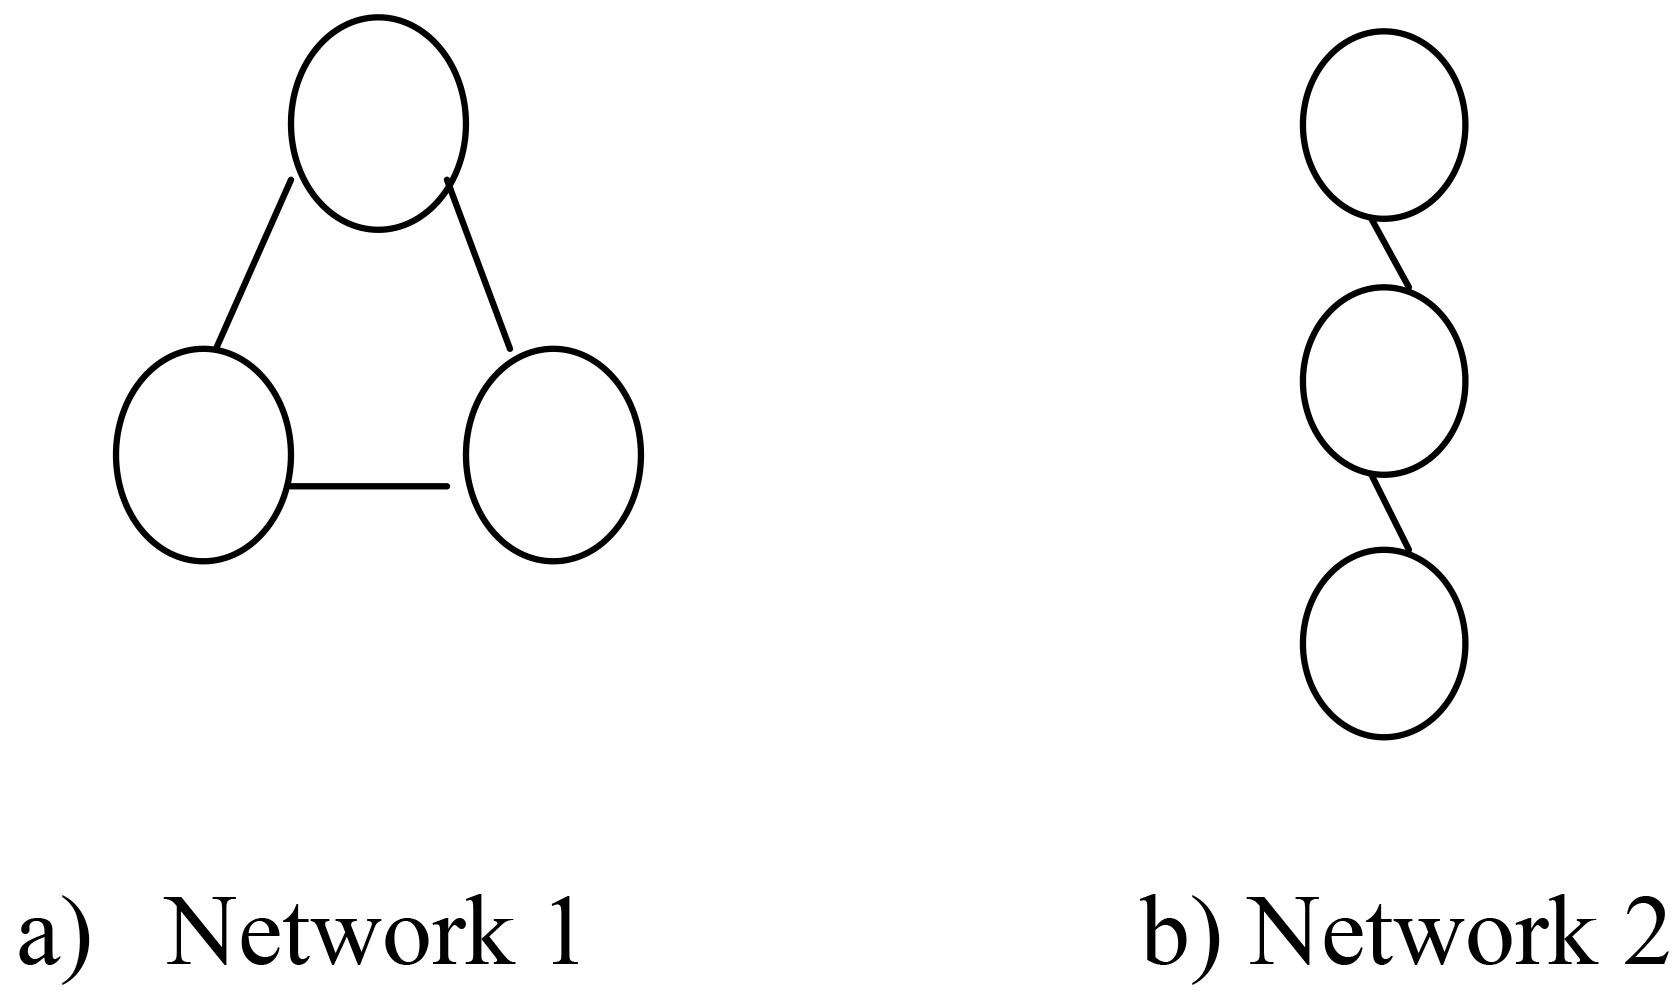
In Fig. 4a contains three node networks, which contains 3 actual connections. The potential connection is calculated for the Fig. 4a network as per the Eq. (2)
Triadic closure property is first proposed by Georg Simmel, it shows the strong tie exist between nodes in the network. For example, in the network there are three nodes namely A, B, C, such that there is strong tie between A-B, A-C, the triadic closure can able to find there is a weak or strong tie between B-C. In the triadic closure clustering coefficient is one of the important measures. The cluster coefficient node of a node is defined as the probability of two randomly selected friend’s node of each other [12].
Here V is a specific node which we would like to find the cluster coefficient. Kv is the degree of the V and Nv is number of links between neighbour of V.
Example of network in contain various nodes.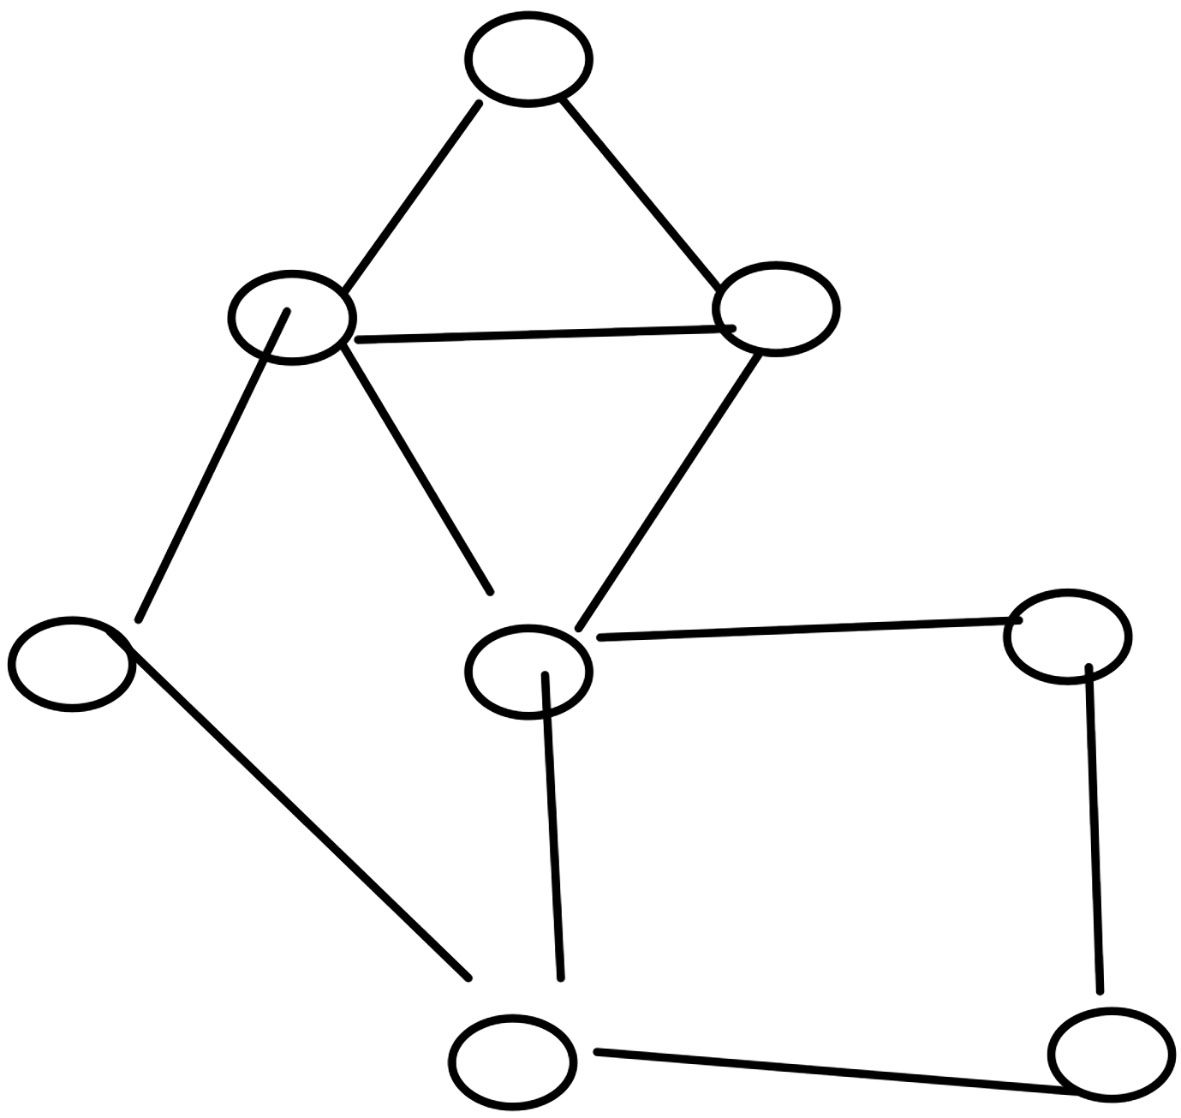
To find cluster coefficient of the network is as shown in the Fig. 5 for particular node V as per the Eq. (4).
The node V contains four neighbour nodes, which indicate Kv, here Kv is 4 and Nv indicates the number of links between neighbours of V, which is 1. As per the Eq. (4) Cluster coefficient of node V is
As per the triadic closure, the network grows over the period, edges come and go. The point of triadic closure is the presence of triangles in the network.
Different networks as example of triadic closure.
In the network there are set of nodes with the property that any two distinct nodes may joined by an edge is called a clique. Generally triadic closure increases the clustering coefficient. As per property of triadic closure, A is a friendship with B and C, which shown in the Fig. 6a. This network provides possibility to meet B and C and become friends as shown in the Fig. 6b.
Network priorities of network density.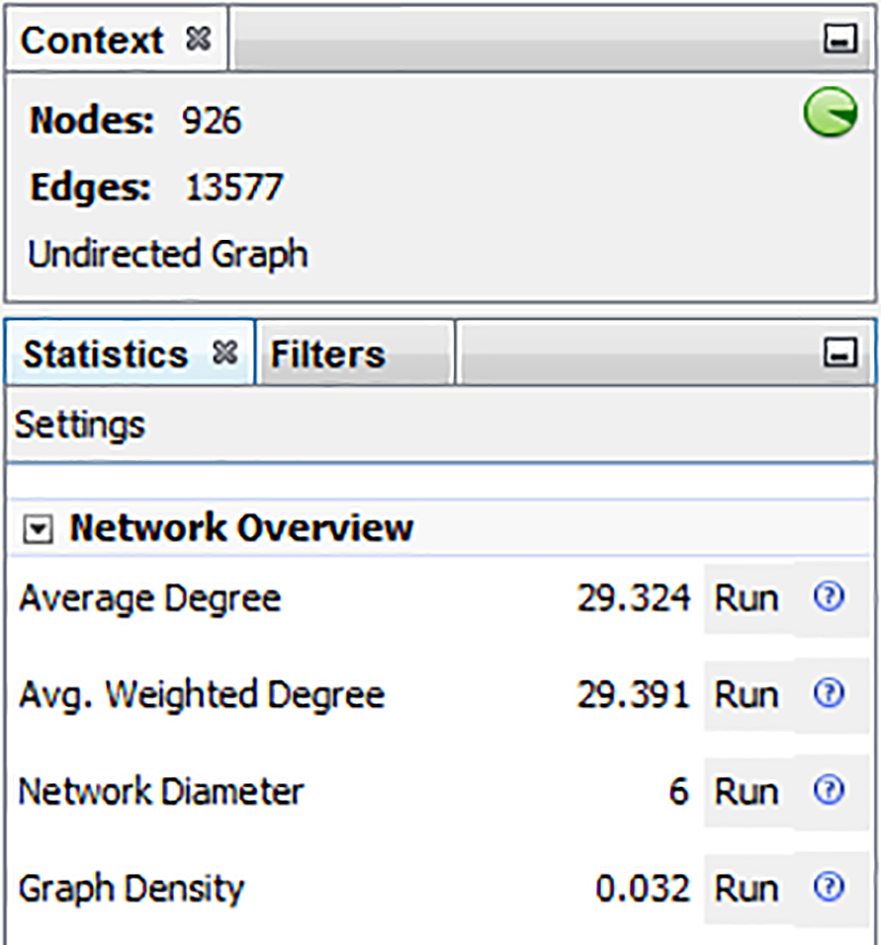
In Fig. 3 shown co-citation graph prepared for the web of science data set, which contains author-author relationships. The co-citation graph is used to find the network priorities of network density and triadic closure. As per the experimental results the network density is around 2.5% and triadic closure is 0.13.
Co-citation edge and weight representation of the web of science data.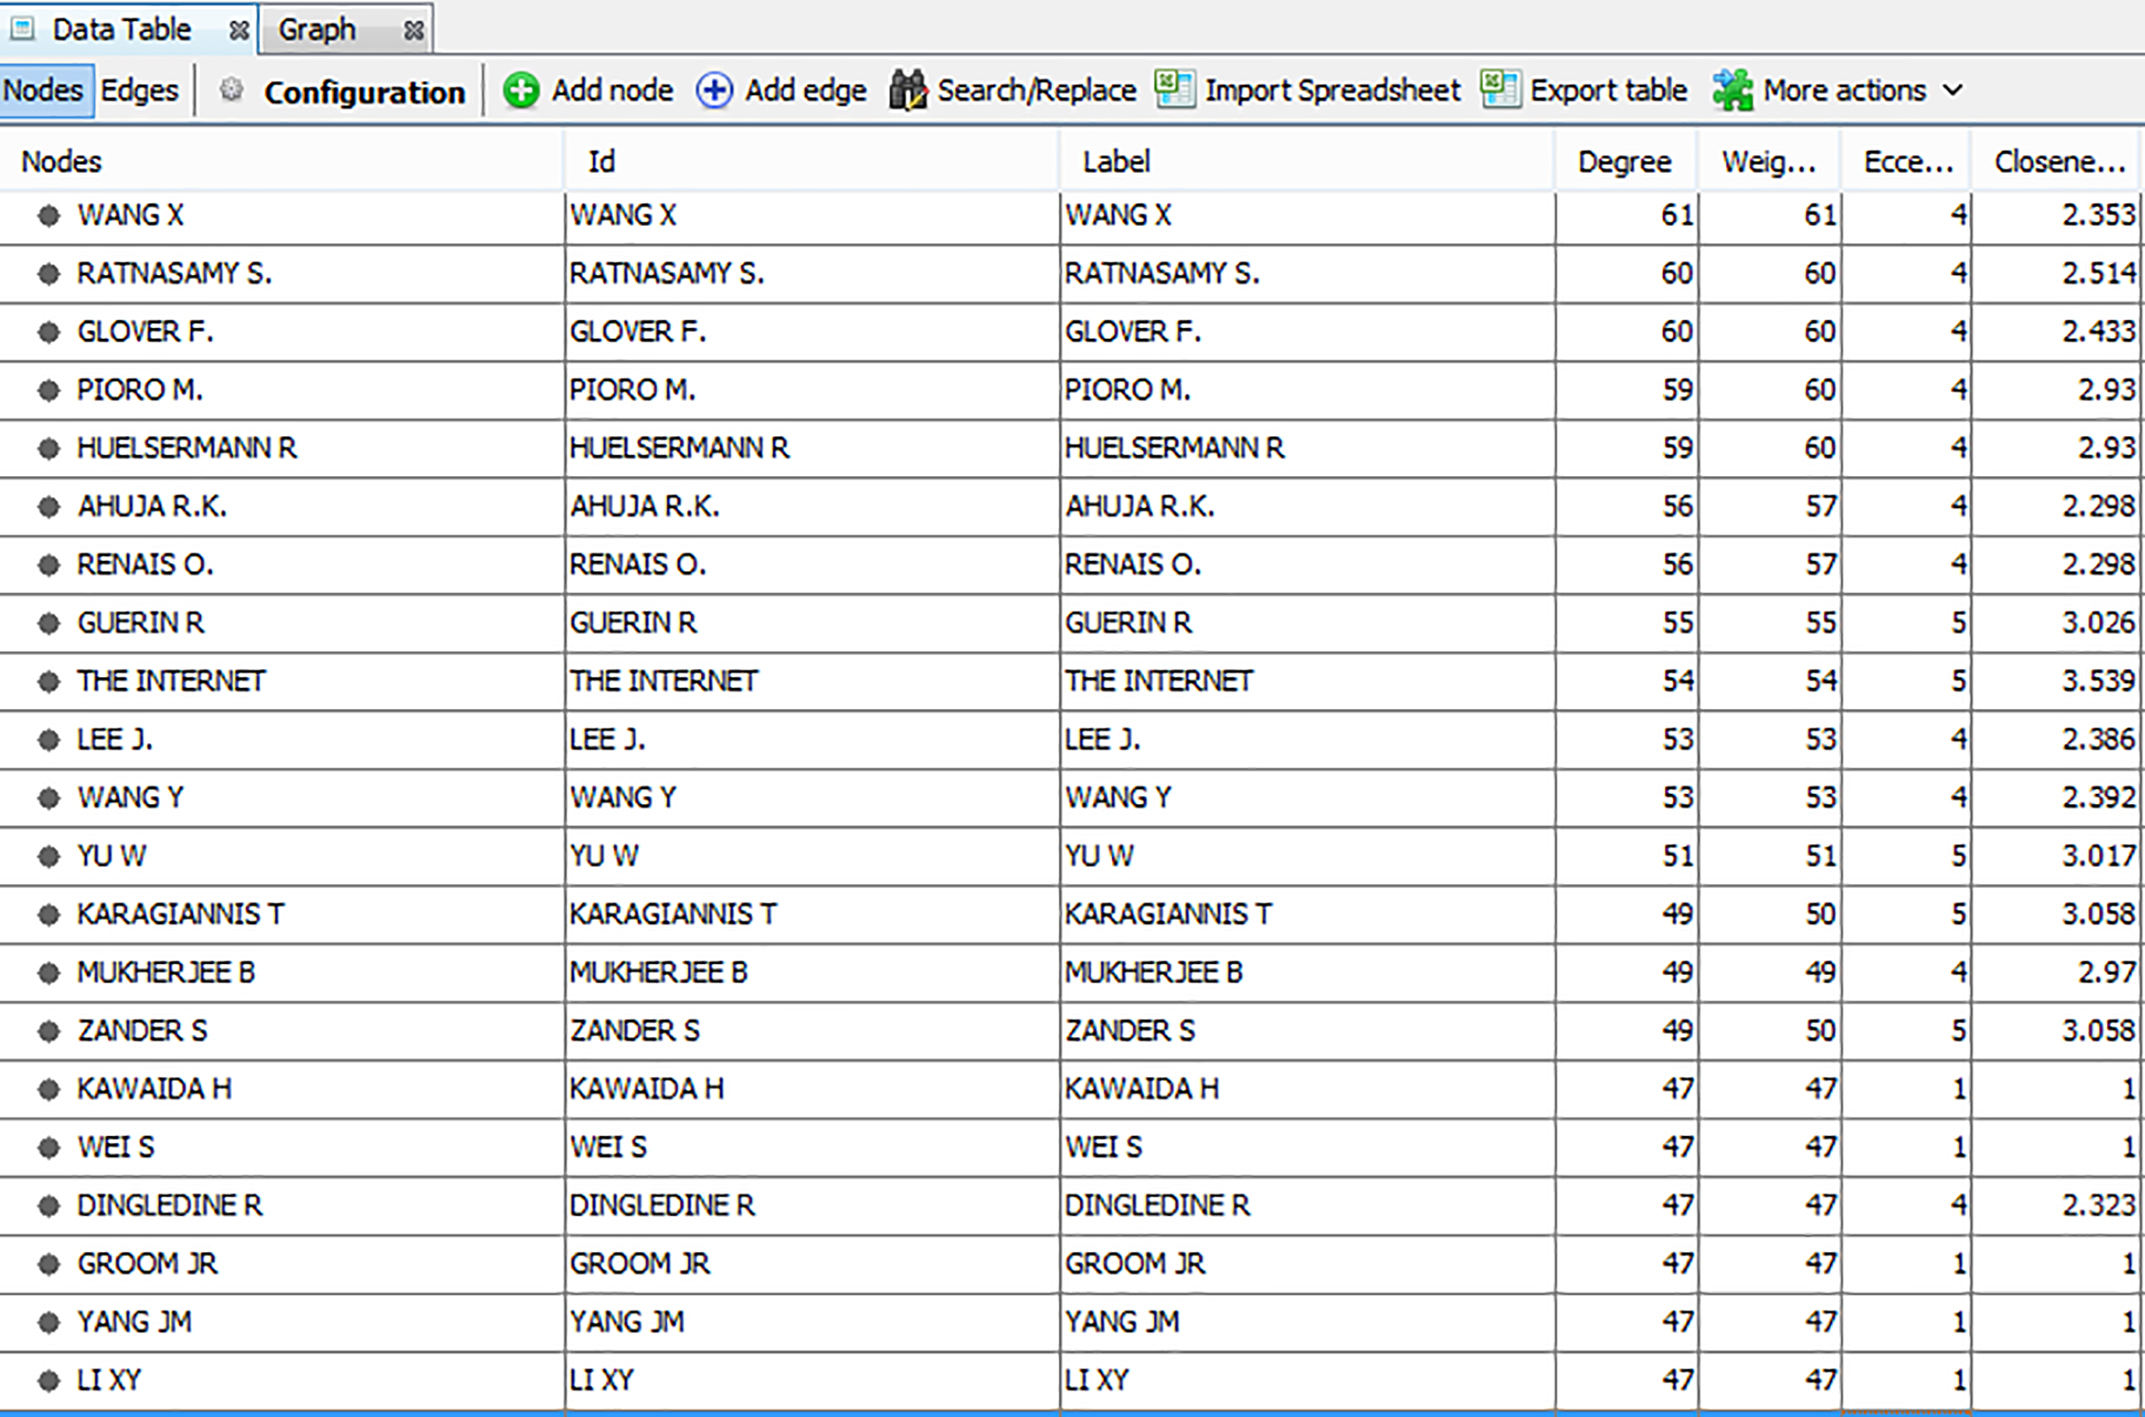
In the implementation process of proposed model is mainly on co-occurrence of authors in the scientific publications. The proposed model is to generate co-citation network graph for the web of science data set after pre-processing of parsing and extraction of author details and generated co-occurrence matrix. In the experimental work first generates co-citation graph as shown in the Fig. 3. In this work co-citation graph analysis is based on the network properties particularly network density and triadic closure. Results of network properties of the co-citation graph on web of science data are shown in Table 1, which are enhanced with the average degree, average weighted degree, graph density, HITS modularity, average path length, page rank connected components, average clustering coefficient, and network diameter. This result helps us to proceed further to analysis on citations of scientific documents.
Comparison of proposed method on network properties
In this work co-citation analysis is used to find occurrence analysis has been used as an effective method to find citation pattern analysis, but it does not take co-occurrence analysis among authors. A framework for co-occurrence analysis is generated in the proposed method. It’s useful for finding the co-occurrence of authors in citation analysis. The proposed methodology can be able to find co-occurrence analysis among authors. Web of science citation data set is used for experimentation and parsing of this data, extracted first author name and CR link. The next step is to find first author co-occurrence frequency and followed by all author co-occurrence frequency. The proposed method provides the author-author co-relation, predicting, who is probably next co-author and author collaborate on which community of authors.