
Abstract
This paper presents forecasting and trend analysis of foreign currency exchange rate in financial market using a hybrid Deep Analytic Network (DAN) technique optimized by a modified water cycle algorithm called Weighted WCA (WWCA) with better generalization capability than the traditional WCA.DAN comprises several stacked KRR (Kernel Ridge Regression) Auto encoders in a multilayer nonlinear regression architecture approach that provides better generalization and accuracy using regularized least squares technique. Further DAN using wavelet kernel function is particularly attractive for its strong data fitting and generalization ability along with its simplified execution procedure, high speed, and better performance achievements in comparison to LSSVM (least squares support vector machine). The output from the DAN is fed to a weighted KRR module to reject noise or the outliers in the noisy data and to make DAN a more robust predictor of the Forex markets, To obtain optimal values of wavelet kernel parameters, a modified metaheuristic water cycle algorithm i.e. the proposed WWCA is utilized. Applications of this new approach to predict forex rate along with trend analysis on three stock markets provide successful results and validate its superiority over some well known approaches like ANN, SVM, Naïve-Bayes, ELM.
Keywords
Introduction
Forex market is a major and important financial market in the world economy and forex rates are the imperative indices and play a major role in the growth of economy. Forex rates are affected by political, economic, as well as psychological factors that are correlated to each other. The non-stationary and highly fluctuating nature of forex market makes it complicated to study the future indices in financial markets. Therefore forex price forecasting is treated as a difficult task in financial market. Thus there are numerous studies on currency exchange market prediction.
It is well known that machine learning technique like Artificial Neural networks (ANN) are quite capable of capturing the nonlinearities in highly noise data series and proved with better accuracy as compared to linear models. Hybrid models are more capable than individual models. ANN integrated different hybrid methods such as ANN-Autoregressive moving average (ANN-ARMA) [1], ANN with fuzzy logic system (ANFIS) with Generalized auto regressive conditional heterodasticity (GARCH) [2], ANN-GARCH [3], ANN with support vector machine (ANN-SVM), Radial basis functional neural network (RBFNN) with ARMA and Wavelet transform (WT), Wavelet transform with recurrent neural network (RNN) [4], multiple ANN classifiers [5], ANN-SVM (support vector machine) [6], fuzzy interval network with statistical features [7], functional link artificial neural network [8], ensemble based multi-objective based neural classifier [9], neural network performance in currency exchange rate prediction and volatility prediction [10, 11] etc. have applied successfully in stock market, forex market, energy market, etc. where the linear models could not beat the proposed integrated methods. Further, ELM has been developed to train single layer feedforward neural network, and ELM is anon-iterative technique which avoid iterative learning and makes the process very fast with higher learning speed. However, in traditional ANNs, gradient-based learning algorithm is common which leads to slow convergence, easily trapped in local minima, suffers from the problem of over fitting. In ELM, the learning process at the initial stage comprises random feature mapping and then the output layer parameters are solved by a pseudo-inverse least square which ignores the general iterative procedure. However, the choices of neurons in hidden layer as well as its activation function are still an unresolved problem. Thus Kernel based extreme learning machine (KELM) has been developed as a solution. The non-iterative based methods like ELM, KELM, Kernel ridge regression (KRR), etc. are in great demand for its better generalization capability. In recent years, different KRR-based methods have been developed for the solution of regression/classification problems in various research fields [12, 13, 14, 15, 16, 17, 18, 19, 20]. These methods are all single layer based structures.
In recent years, multilayer (deep) neural network as a machine learning approach has received great attention. Deep neural networks are used in many tasks. With multiple hidden layers, deep learning is responsible in meaningful feature representation [21]. With multiple hidden layers it forms the feature representation learning [22]. Recently stacked autoencoder (AE) i.e. several AEs are stacked together to formulate the multilayer neural network with deep learning and extract meaningful features [23]. In several tasks, deep neural network are proved to be very successful, but these are not the solution for all types of tasks [24]. Traditionally in DNNs, like CNN, LSTM and other architectures have parameters which are optimized through training by backpropagation (BP). DNNs are very effective for regression and classification problems, still these DNN models suffer from large data requirements to confront over fitting problems, occurrence of local minima, slow speed of convergence, high computational complexity, and network adaptability and scalability problems, very sensitive to the learning rate setting, etc. due to iterative learning process. Besides DNNs require a correct choice of number of hidden layers, number of neurons in each hidden layer, activation function, etc. to provide good prediction accuracy. Over the last few years, multi-layer based models specifically stacked Auto-encoder based multi-layer structures have been developed due to its increasing attention. Such structures can lead to better feature representation for regression/classification problems [25] and dimensionality reduction [26].
Thus, in this work, DAN comprising a stack of kernel machine (KRR) Auto-encoders in a multilayer architecture is proposed for addressing currency exchange rate prediction and trend detection. Each of the Kernel machines Auto-encoder can be trained independently using generalized least squares without the use of BP algorithm. On the contrary kernel ridge regression (KRR) modules is more suitable that maps the set of predictors into a high-dimensional feature space that satisfies the Mercer condition, and which ignores the dimensionality problem. This approach bypasses the problem of computational complexity that exists in the standard ridge regression method when the number of predictor variables is large as compared to the number of time series observations. Due to its simplified execution procedure, high speed and generalization capability and performance accuracy it has attracted great attention in various fields for solving regression and classification problems. To deal with highly complex data and high level feature reduction through hierarchical structure learning by multilayer representation, is adopted in this work using KRR based stacked Auto-encoders and having a weighted KRR classifier.
Recently a robust formulation of ELM has been outlined in [27] to take care of the noise and outliers in the data samples. In a similar way the new improved weighted DAN which uses a variable weighting factor with error residuals is presented in this paper to provide better accuracy by rejecting noise and outliers in financial data. The choice of the wavelet kernel in kernel machine is due to the fact that it fits the data very closely and is known to produce generalization and stability to the DAN. Further to improve forecasting accuracy the kernel parameters are optimized by an improved water cycle algorithm with enhanced performance for achieving higher accuracy due to its fast convergence with global optimum. Water cycle algorithm has been implemented in [28, 29] for optimal solution of unknown parameters. In this solution, we have taken the minimum weighted chaos mapping functions to generate the random series instead of random numbers between [0 1]. In order to implement the proposed hybrid method, we have used three foreign currency exchange (forex) datasets as we are aware that forex prediction is of great challenge in recent years and is an important issue in financial market, and the supportive forecasting results obtained in the WWCA-Wavelet-DAN yields better prediction performance in terms of RMSE, MAE, and MAPE than some well-established methods for daily exchange rate prediction.
In financial market, forex trend detection is also important which is dependent on the behavior of past forex prices and can be determined using technical indicators which are based on past price values like closing price, open price, low price, high price of the forex market in order to know the general movement of the forex market which is nonlinear in nature and needs attention for future trend prediction. In this regard, among some contributions made for trend analysis in financial market existing in literature based on technical analysis are presented in [30, 31, 32, 33, 34, 35, 36, 37]. With an aim to develop a good forecasting tool for forex price and trend analysis, in this study, we have proposed the robust non-iterative kernel ridge regression with wavelet kernel (Wavelet-DAN) with kernel parameters optimized by an improved water cycle algorithm i.e. WWCA. The price movement direction is determined along with future price prediction. To accomplish this task, in the proposed WWCA-Wavelet-DAN approach, we are using past values like six technical indicators: moving average (MA), moving average convergence and divergence (MACD), relative strength index (RSI), %K indicator and %D indicator, and Larry William’s R (R indicator) which are fed as inputs to the proposed system for classifying the trend.
The details of the proposed method and its implementation are presented in subsequent sections. Apart from the introduction described above, the remaining portion is described as follows: Section 2 describes the Wavelet Kernel Ridge Regression proposed for forex price prediction; Section 3 explains the processing of modified WWCA used for optimizing kernel parameters. Section 4 explains the overall framework of the proposed prediction method, considered forex datasets for day ahead price prediction and trend detection; explains the input variables used to implement the proposed model and the performance metrics used for evaluating the performance accuracy. This section also describes the numerical results of forex price prediction. In Section 5 the forex trend detection procedure and its prediction results are summarized with discussion along with comparisons to some popular methods. Section 6 draws the overall conclusion followed by relevant references.
Deep robust analytic network for forex rate prediction
The DAN architecture comprises several layers of stacked KRR Auto encoders with the final layer having a weighted KRR for removing the presence of outliers in the data.Nonlinear Kernel ridge regression (KRR) utilizes the well established kernel trickthat transforms the time series data into a high dimensional feature space thereby providing linear separability, fast processing speed, generalization, and accuracy. It uses those kernel functions which satisfy Mercer’s condition and they can be either local or global depending on their data fitting capabilities. The m dimensional data input vector is represented as
where
By deriving
Thus solving Eqs (4) to (6) the value of
Using Kernel matrix
where
Hence the output from
Thus for
After transforming the input data by passing it through successive
where the target
In a similar way to earlier formulation the Lagrange multipliers are applied to yield the following expression:
By deriving
Thus solving Eqs (16) to (18) the value of
Using Kernel matrix
where
Hence the output from the weighted KRR predictor is obtained as
where for the test sample
From Eqs (19) and (20) it is observed that the empirical loss weight matrix
A simple formula given by Huber [45] is used here to compute the individual weight parameters
Here the value of
Regarding the choice of kernel functions it is well known that the wavelet kernel either Mexican Hat or Morlet type has strong function fitting capability with strong generalization ability. Therefore in this paper Morlet type wavelet kernel function is used for the lth layer stacked KRR-AE and it is described as:
The parameters
Number of layers in the stack
(1) Evaluate kernel matrix
(2) Evaluate output weight for the
(3) Evaluate new updated data
(4) Find the output weight
In simpler form the steps are:
Flow of the DAN processing.
At the first step, for l=1 to L do if Create the first layer with ( Train the KRR-AE Transformed output Else Final layer i.e Lth layer for prediction ( Train the End if End for
The flow chart is represented in Fig. 1.
WCA as a population based optimization algorithm which is developed by observing the movements of streams and rivers towards sea in the natural water cycle process starting from the creation of rivers. In this process, water passes through the processes of evaporation, transpiration, condensation, etc. A stream or a river is generated whenever water flows downhill. Thus most rivers are generated in high up places like mountains when snow melts by flowing from one place to another. Rivers on their way to sea carries rainwater and stream water from different places with them when flowing down hills. Here sea is treated as the optimum destination for the streams and rivers. Based on this natural concept, the water cycle algorithm is processed. At the initial process of raining, random population of raindrops are generated to start the algorithm based on the natural water cycle process.
In this study, the water cycle algorithm with a modified version is applied for optimizing the kernel parameters of the proposed Wavelet-DAN predictive approach with minimization of cost function to enhance the performance accuracy. Here, cost function is represented in Eq. (20) that is directly proportional to the discharge intensity. In the WCA process, the initial kernel parameters are treated as the position of the rain drops. The objective function (cost function) for this optimization is the square of the total residual error and is expressed as:
Suppose, the number of total rain drops in the population is ‘
For all the initially generated raindrops, discharge intensity is obtained. Among all the raindrops, the raindrop obtained with lowest cost function i.e. discharge intensity value is treated to be the supreme raindrop which is then termed as sea whereas nearby raindrops i.e. raindrops with lower cost function values are treated as rivers, and the remaining raindrops are known as streams that move to rivers and sea.
Say, among the rain drops,
So,
Once identified the sea, river and stream, the reformulation of Eq. (27) can be expressed as
The streams towards it’s destination to river or sea is decided by their calculated discharge intensity values and one stream can enter into one river or sea. The number of streams for river or seato enter into is formulated as:
and
The streams flow to river or to sea, whereas flow of rivers is always towards sea.
Hence, they modify their existing positions to move towards sea i.e. the final destination.
The position of streams will be modified by Eq. (32) to flow towards river:
The positions of streams will be modified by Eq. (33) to flow towards sea:
The position of rivers will be changed by eq.(34) in order to flow towards sea:
where, rand is a random value between [0 1] and
The discharge intensity of each raindrop will be computed after the modification of the positions of streams as well as rivers. If the new discharge intensity is found to be better for a river as compared to its connected sea then the particular river will act as sea whereas the sea behaves as river. In this case, now the streams connected earlier with the particular river will be connected to the sea as the particular river has already converted to sea by modification. The similar process is followed between sea and streams, and sea and rivers according to the flow of intensity.
While the streams and rivers join the sea then evaporation process starts which causes the sea water to evaporate which is an important phase of water cycle algorithm as like in the natural water cycle process water evaporates from river and the evaporated water later on with condensation drops as rain to the earth. Thus, in this process a tiny value i.e.
The condition of evaporation for river to join sea will be:
If the conditions stated above are satisfied then new raindrops are created by the raining process to generate new streams like the natural process. The positions of the newly generated streams are obtained by:
where lb and ub are the lower and upper bounds of decision variables.
The value of
where Maxiter
Continue the above process till the last iteration to meet the convergence criteria and find the best solution.
Initially select parameters of WCA such as
Decide the number of streams that flow to the rivers and sea utilizing the following:
Here
Generate initial population of streams randomly and form streams, rivers and sea initially.
Find the intensity of flow which indicates how many streams flow to their corresponding rivers and sea utilizing Eq. (30).
while the maximum iteration reaches ie. (
for
streams move to its corresponding rivers and sea utilizing Eqs (32) and (33)
compute the value of the cost function of the created stream
if cost_stream
river
if cost_stream
sea
end if
end if
rivers move towards sea utilizing Eq. (34)
compute the value of the cost function of the created river
if cost_river
sea
end if
end for
for
if (|sea
generte new streams utilizing Eq. (36)
end if
end for
decrease
end while
Obtain final results
A chaotic mapping function is a well-known procedure in nonlinear systems. The chaotic system influences the parameters to a great extent and its initial condition as small changes in the system parameters and in initial conditions may lead to a large variation in the future hehaviour of the system [39]. The chaos mapping helps in preventing premature convergence, provide diversity in search space in the optimization process and thus speed up the convergence. With an aim to enhance the convergence speed of the optimization process, chaos functions are utilized in this work. The chaotic mapping functions which are expressed below are well illustrated in literature for nonlinear system:
The two dimensional sinusoidal map is chaotic with parameters
The sinusoidal map Eq. (38) is a two dimensional map and the sin map Eq. (39) is a unimodal map.
The initial condition of the variables are taken between [0 1].
It is reported in [41, 42] that instead of random number between (0,1) if associated a chaotic map for random number generation it permits diversity in the solution space and hence increases the efficiency of the algorithm. Thus in this analysis, to introduce diversity, the sinusoidal and sine chaos maps are associated to the WCA in a combined form with a weighted minimum form. For the initial condition the values are chosen between (0,1) and then the chaotic series is generated with the above formulation.
In order to enhance the efficiency of the proposed WCA approach, different chaotic functions are associated to the water cycle algorithm. In the traditional WCA the position of streams and rivers are modified with random values to find the destination i.e. the sea by obtaining the minimum objective function value at the position modification stage and thus accordingly exchange the position of rivers /streams to determine the sea. The value of C is assigned beforehand in WCA and this value also affects the algorithm in balancing the exploration and exploitation, and thus in WWCA, the C value is determined by multiplying the weighted minimum combination of two chaos functions ie. the two chaos functions are combined together with two random weights assigned to it and the weighted minimum value is multiplied to find the value of C. With the minimum relation of two chaos functions, the modified positions of the streams and rivers in WWCA are calculated using the Eqs (40)–(43).
where
where
Instead of taking random values between [0 1] as in the original WCA for modifying the position of streams and rivers the nonlinear chaotic functions with weighted minimum to modify the position of streams, rivers and evaporation process to enhance the exploitation capacity of the water cycle algorithm and hence to avoid premature convergence.
The evaporation and raining process with the nonlinear chaotic functions mutually provides a solution to avoid premature convergence and in this solution the evaporation condition with the chaos function is verified on the basis of the following pseudo code:
The value of
The chaotic formulation in WWCA enhance the search diversification of WCA.
The chosen chaos functions in combined form are used to generate the raining process during iteration as:
The chaotic functions allow diversification in the problem search space by providing more iteration in the chaos formulation. The movement of streams and rivers based on chaos formulation through Eqs (34)–(37) with its generated chaotic patterns are quite efficient to provide exploitation/exploration during raining process. The chaos function with more iteration also permits to find better convergence in the local best and hence avoid premature convergence.
Outline of the WWCA-Wavelet-DAN forecasting processing.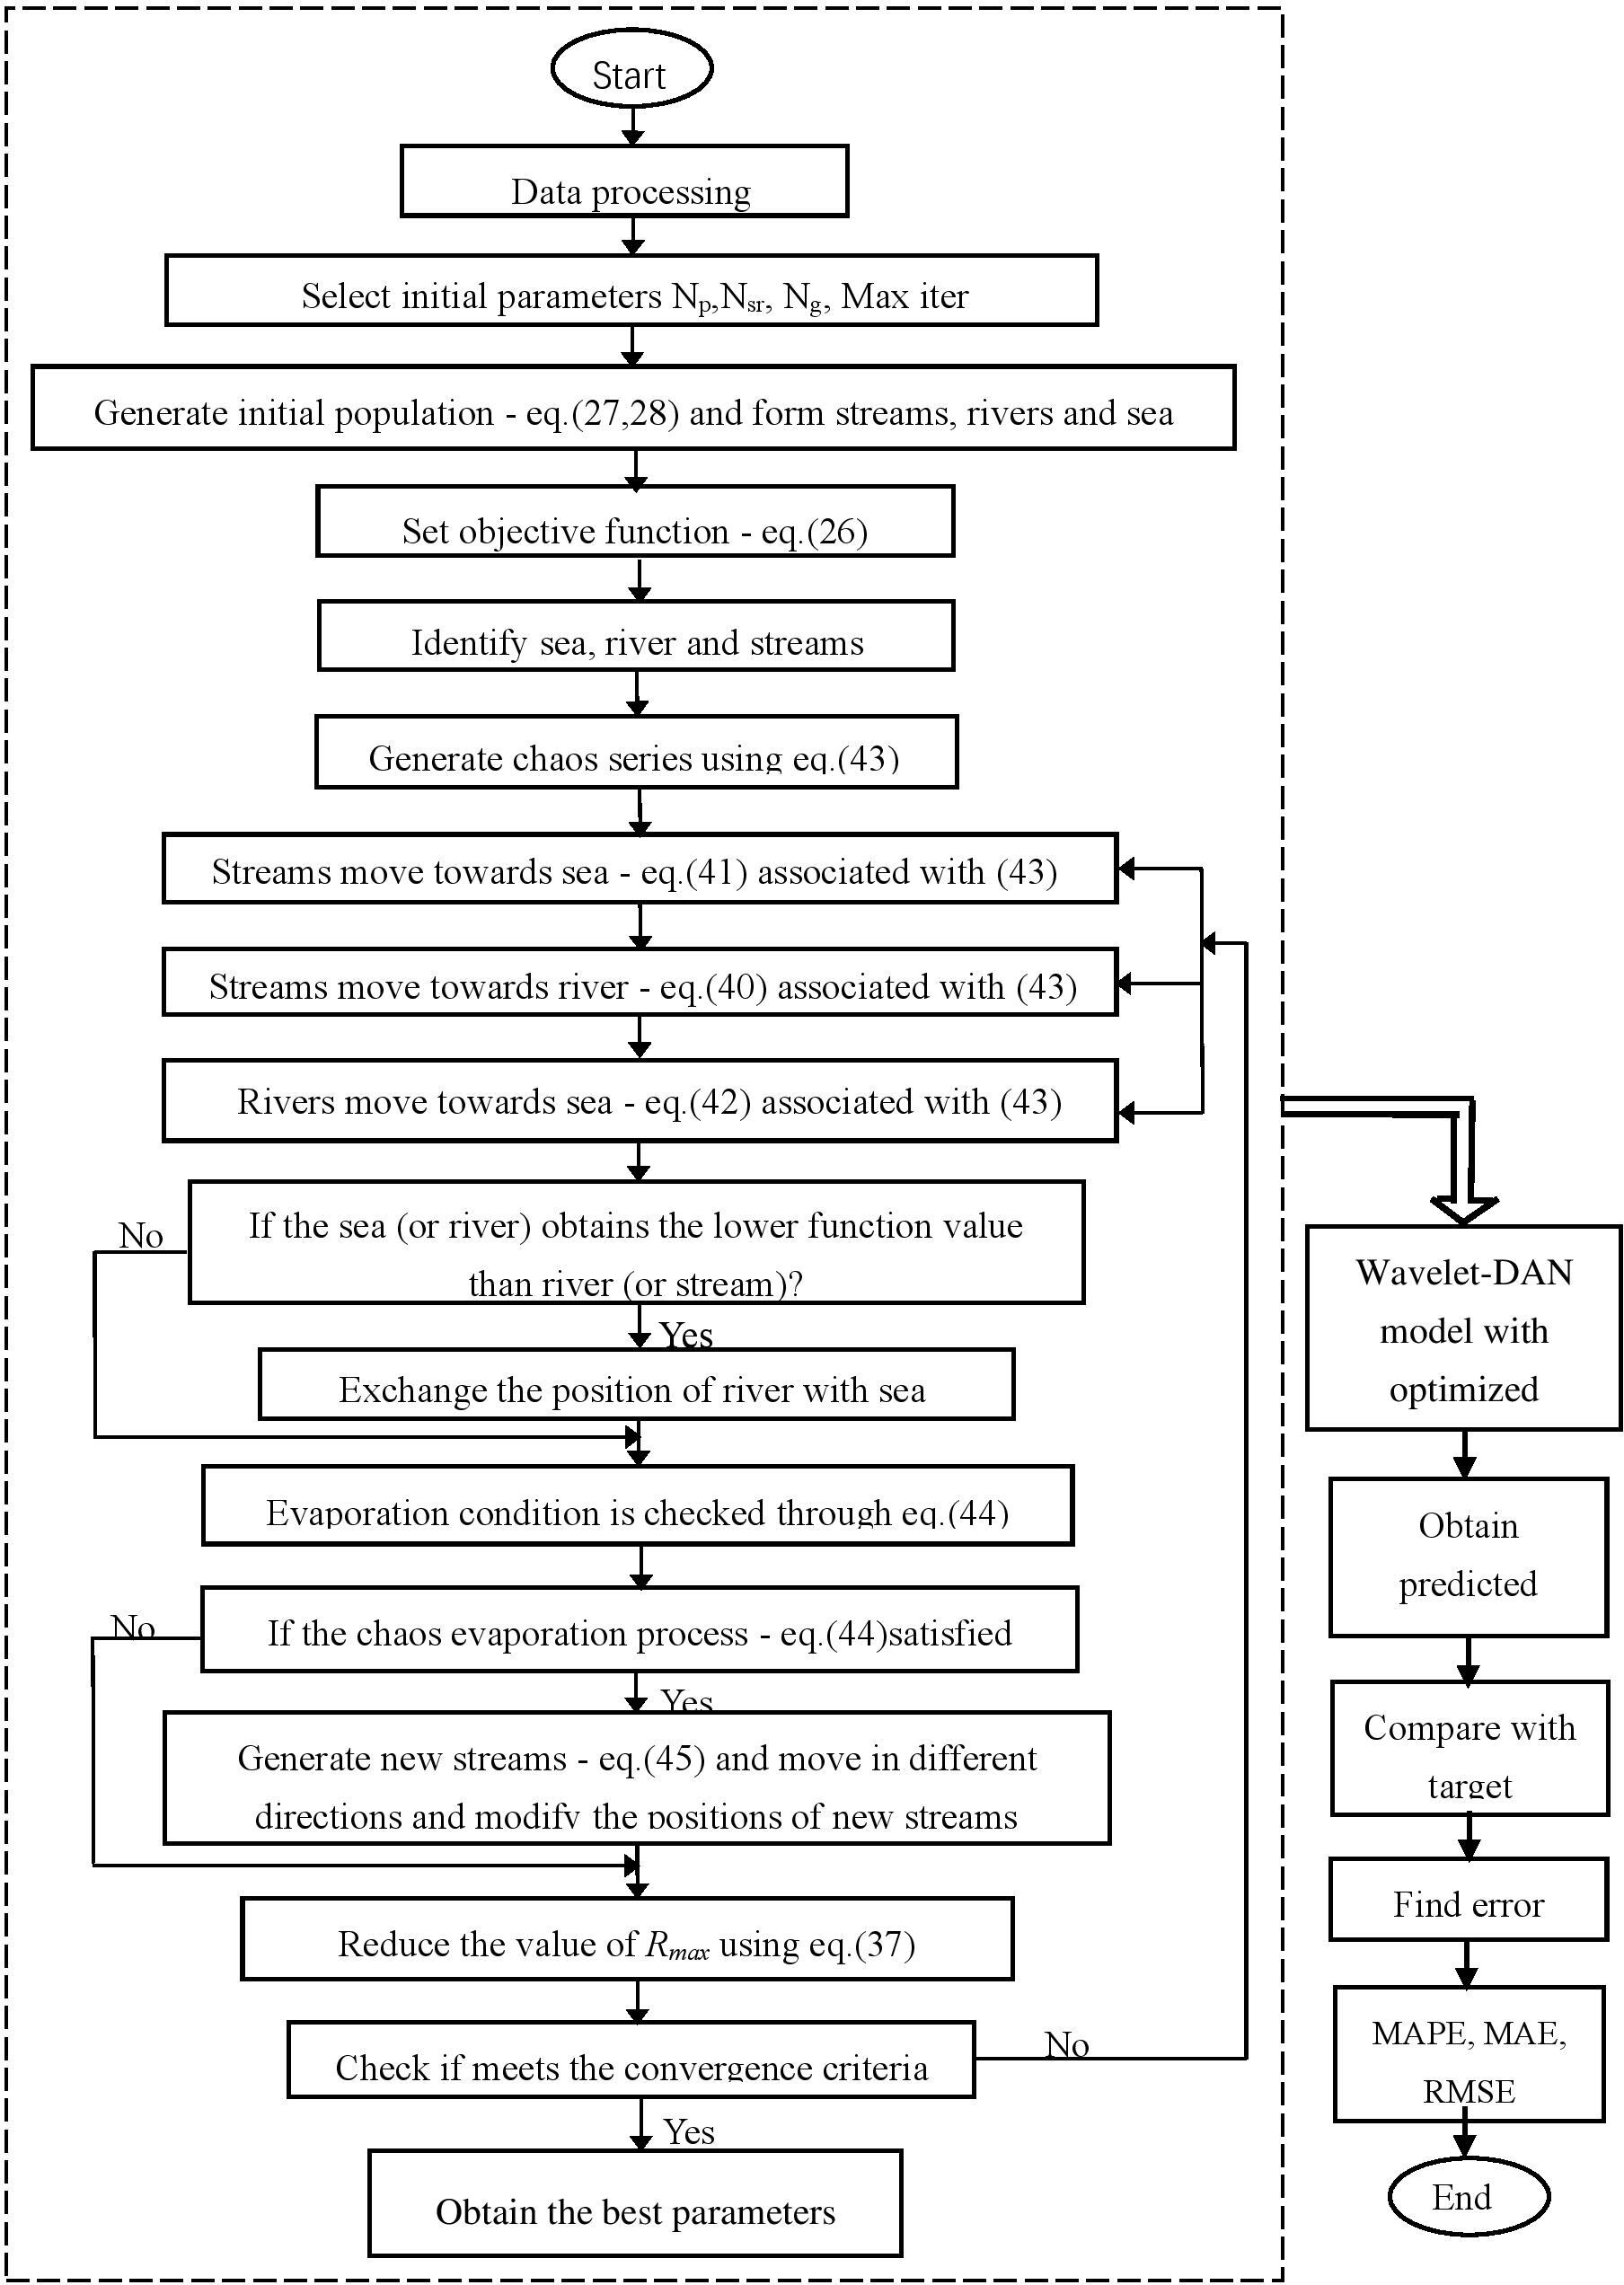
The implementation process of the proposed WWCA-Wavelet-DAN model for forecasting forex price is depicted in Fig. 2 as a flow chart. The numerical experiment goes through the following steps for its implementation for currency exchange rate prediction. The experimental results support the capability and efficiency of the proposed method.
Performance evaluation measures
The experimental results of the proposed model use three different performance metrics for model evaluation; Mean Absolute Percentage Error (MAPE), Mean Absolute Error (MAE), Root Mean Square (RMSE) for one day ahead prediction (refer Eqs (46)–(48)) as these measures are usually considered for evaluating the performance of a prediction model.
here NT
The daily closing prices in major cases play an important role for daily future price prediction. There are several influential technical indicators such as moving average (MA), Moving Average Convergence and Divergence (MACD), Relative Strength Index (RSI), Stochastic K (%K) and D indicator (%D), Larry William’s R (%R), which are useful for traders in financial market to follow trend of financial time series like stock market price, currency exchange market rates, etc. and take a trading decision and have proved successfully in several applications. These technical indicators are formulated below:
The value of MA is the simple mean calculated as per Eq. (49) on closing prices for a fixed number of past days fd (here fd
where fd: fixed number of past days,
The value of MACD is obtained using Eq. (50) based on daily closing price values.
RSI is a momentum indicator and its value is calculated using Eq. (53)
The values of %K and %D oscillators are calculated using Eqs (55) and (56) based on daily closing prices, high and low prices.
where
%R is a stochastic oscillator and its value is obtained using Eq. (57).
where
Forex datasets used for daily exchange rate prediction
Forex datasets used for daily exchange rate prediction
Forex datasets used for trend prediction
In this paper we examine the daily exchange rates data of three currencies i.e. Malaysian Ringgit (MYR), Mexican Peso (MXN), and Brazilian Real (BRL) against (USD) and the daily observations are used for one day ahead exchange rate prediction. The whole dataset covers the time span from 03 January 2012 to 05 August 2015, a total of 900 data pairs (Saturday and Sunday data pair values are missing). The dataset is partitioned into training and testing. The training part contains the initial 600 data pairs from the whole dataset in order to train the model proposed in this paper and the testing part contains the rest 300 data pairs. To test the efficiency of the model, we have chosen the observations from 26 May 2014 to 05 August 2015 in the datasets where fluctuations are more prominent. The details of the MYR/USD, MXN/USD, and BRL/USD datasets discussed above are given in Table 1a.
The trend detections are calculated on three currency exchange markets, such as MYR/USD, MXN/USD, BRL/USD and each of these datasets carry 1044 data instead of 900 data in total as the trends are detected for the entire period for each year up to December 2015.The details are given in Table 1b.
The inputs to the proposed model comprise lagged scaled prices of past 5 days for day ahead price prediction i.e. the prediction of day (
where
The six influential technical indicators explained above i.e. MA, RSI, MACD, %K %D and %R are used as input variables to the considered predictive models. The calculated technical indicator values are scaled between 0 and 1 by following procedure in Eq. (58).
Performance comparison of wavelet based DAN model with other predictive models in terms of MAPE, MAE, and RMSE (Models: WWCA-Wavelet-DAN, Wavelet-DAN, WWCA-Poly-DAN, WWCA-tanh-DAN, WWCA-Gaussian-DAN, ELM, BPNN, SVR)
MYR/USD, MXN/USD, and BRL/USD datasets containing 1044 data.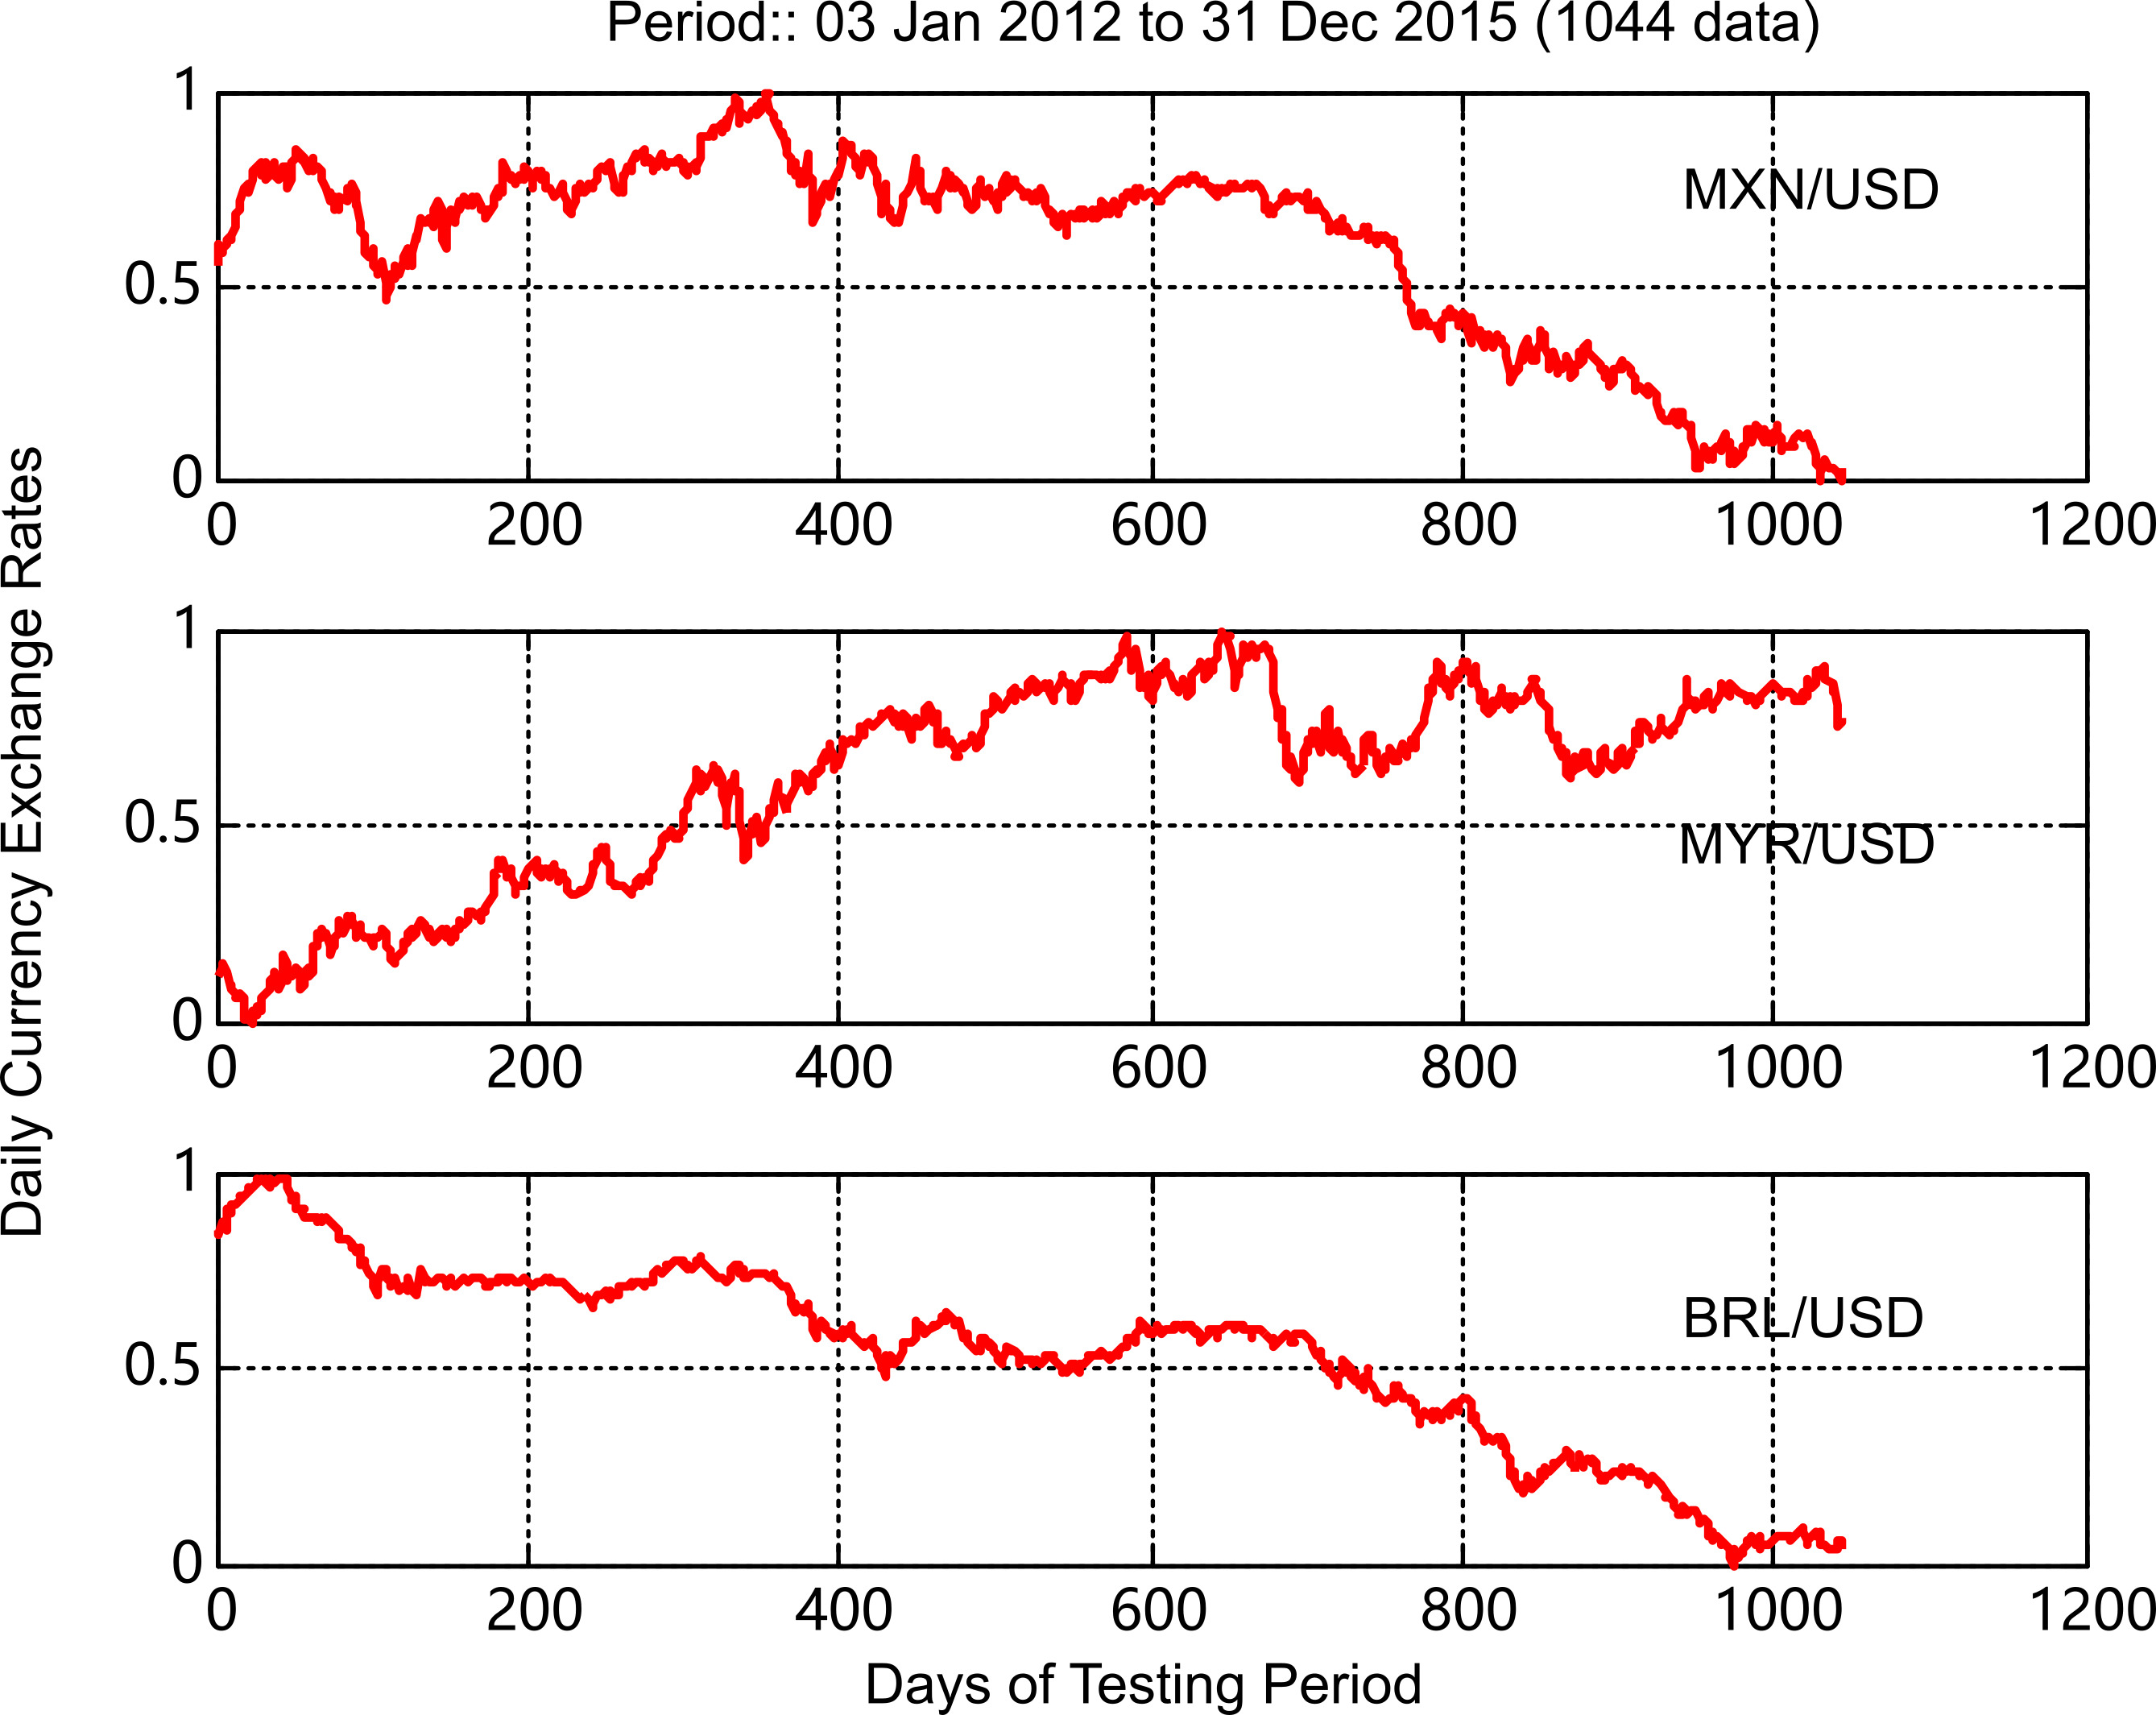
The proposed model called DAN using Wavelet kernel is first trained for one-day ahead prediction using the three datasets from MYR/USD, MXN/USD and BRL/USD forex markets and then testing starts for the same as per Table 1. Then the performance of the proposed model is compared with other kernel functions like polynomial, tan hyperbolic, and Gaussian kernel models and these modes are named as Poly-DAN, tanh-DAN, Gaussian-DAN. The proposed Wavelet-DAN model is first trained with random values assigned for the wavelet kernel function parameters. Initially we run for ten times using different random values and measure the errors and find the MAPE, MAE and RMSE values. Then the average of the ten measured errors in terms of MAPE, MAE and RMSE are taken as the final prediction errors for the kernel function based DAN model. In order to achieve better accuracy, we have used a modified water cycle algorithm i.e. WWCA to optimize the kernel parameters in the first KRR-AE and use the best obtained values in the proposed stacked KRR-AEs in the subsequent layers (WWCA-Wavelet-DAN) and then measure the performances of the three datasets implemented for prediction analysis. Similar process is applied for the DAN approach with other kernel functionsi.e. Poly-DAN, tanh-DAN, Gaussian-DAN mentioned above and the optimized version of these models are known as WWCA-Poly-DAN, WWCA-tanh-DAN, and WWCA-Gaussian-DAN. Further the comparison is also done with non-iterative ELM technique, BPNN and SVR (support vector regression) for testing the robustness of the proposed model.
(a) MYR/USD Testing results with errors. (b) Modified WWCA and WCA convergence curve for MYR/USD results.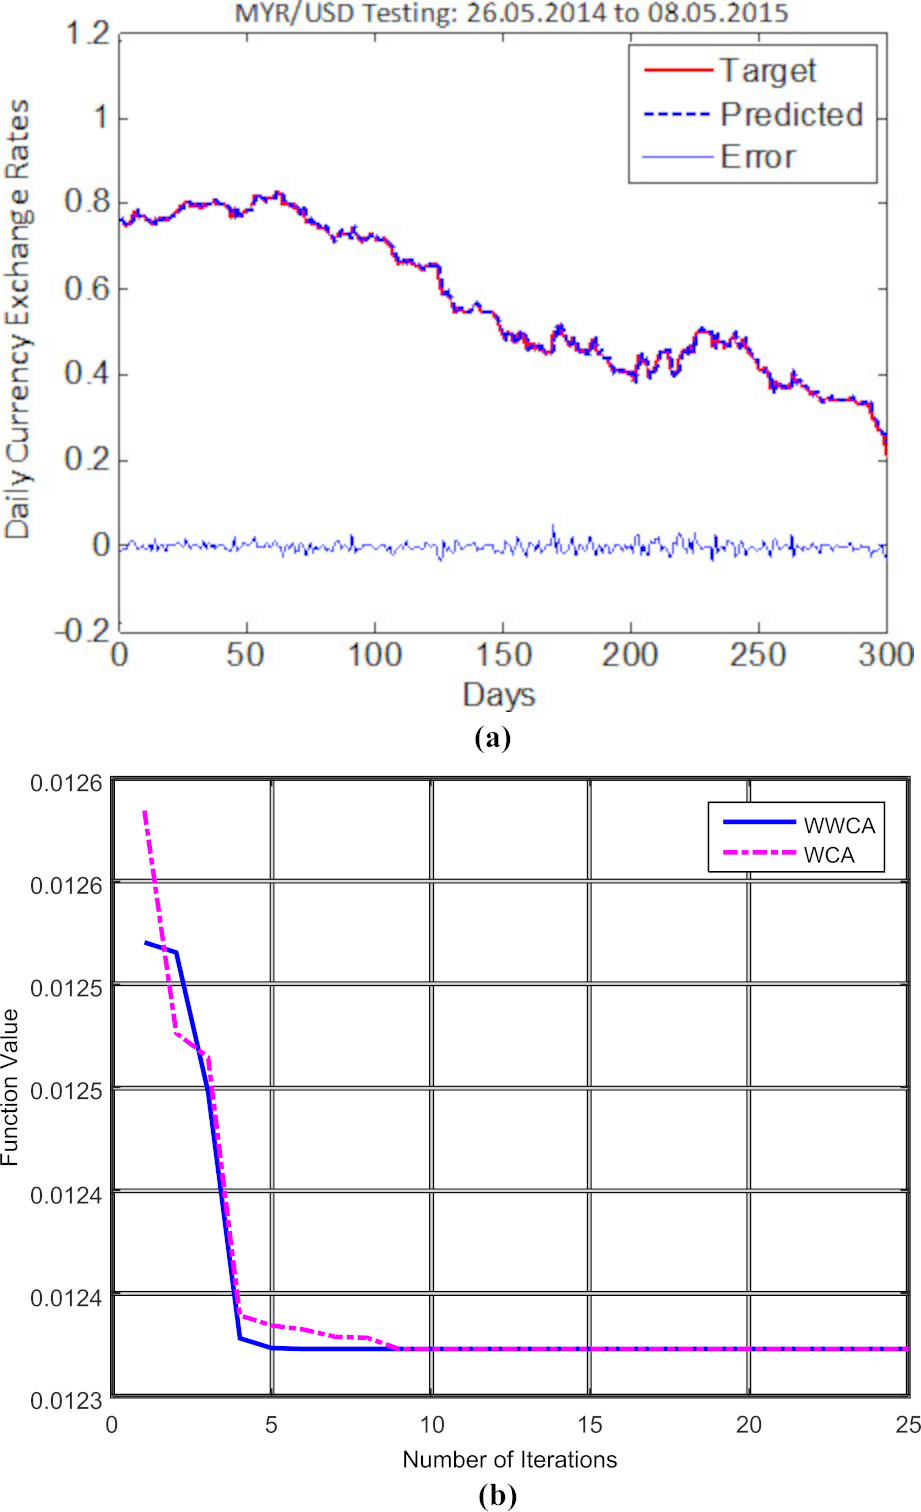
The findings of the experimental results during testing using the considered predictive models are reported in Table 2. In the optimized based WWCA-Wavelet-DAN experiment, the MYR/USD shows MAPE, MAE and RMSE values of 1.3537, 0.0091 and 0.0123, respectively, while the MXN/USD shows MAPE, MAE and RMSE values of 1.3850, 0.0097 and 0.0137, respectively. The BRL/USD yields the lowest errors with lowest MAPE, MAE and RMSE values of 1.3301, 0.0072 and 0.0106, respectively for day-ahead price prediction. The performances of these test cases are quite satisfactory in terms of MAPE, MAE and RMSE. The MAPE, MAE and RMSE values of other kernel variants are depicted in Table 2. The visualization of target vs. predicted results of MYR/USD, MXN/USD, and BRL/USD implemented in the proposed WWCA-Wavelet-DAN approach are depicted in Figs 4 and 5, and 6along with their corresponding convergence curves. In these forex datasets, the wavelet kernel function supports the performance accuracy to a higher rate whereas the other kernel functions reports lesser accuracy as can be observed from the measured MAPE, MAE, and RMSE values presented in Table 2. From the table it is also clear that the conventional WWCA-DAN reveals lesser prediction accuracies with the four different kernel variants in all cases as compared to the robust WWCA-DAN model using a weighted KRR model as the final predictor.
(a) MXN/USD Testing results with errors. (b) Modified WWCA and WCA convergence curve for MXN/USD results.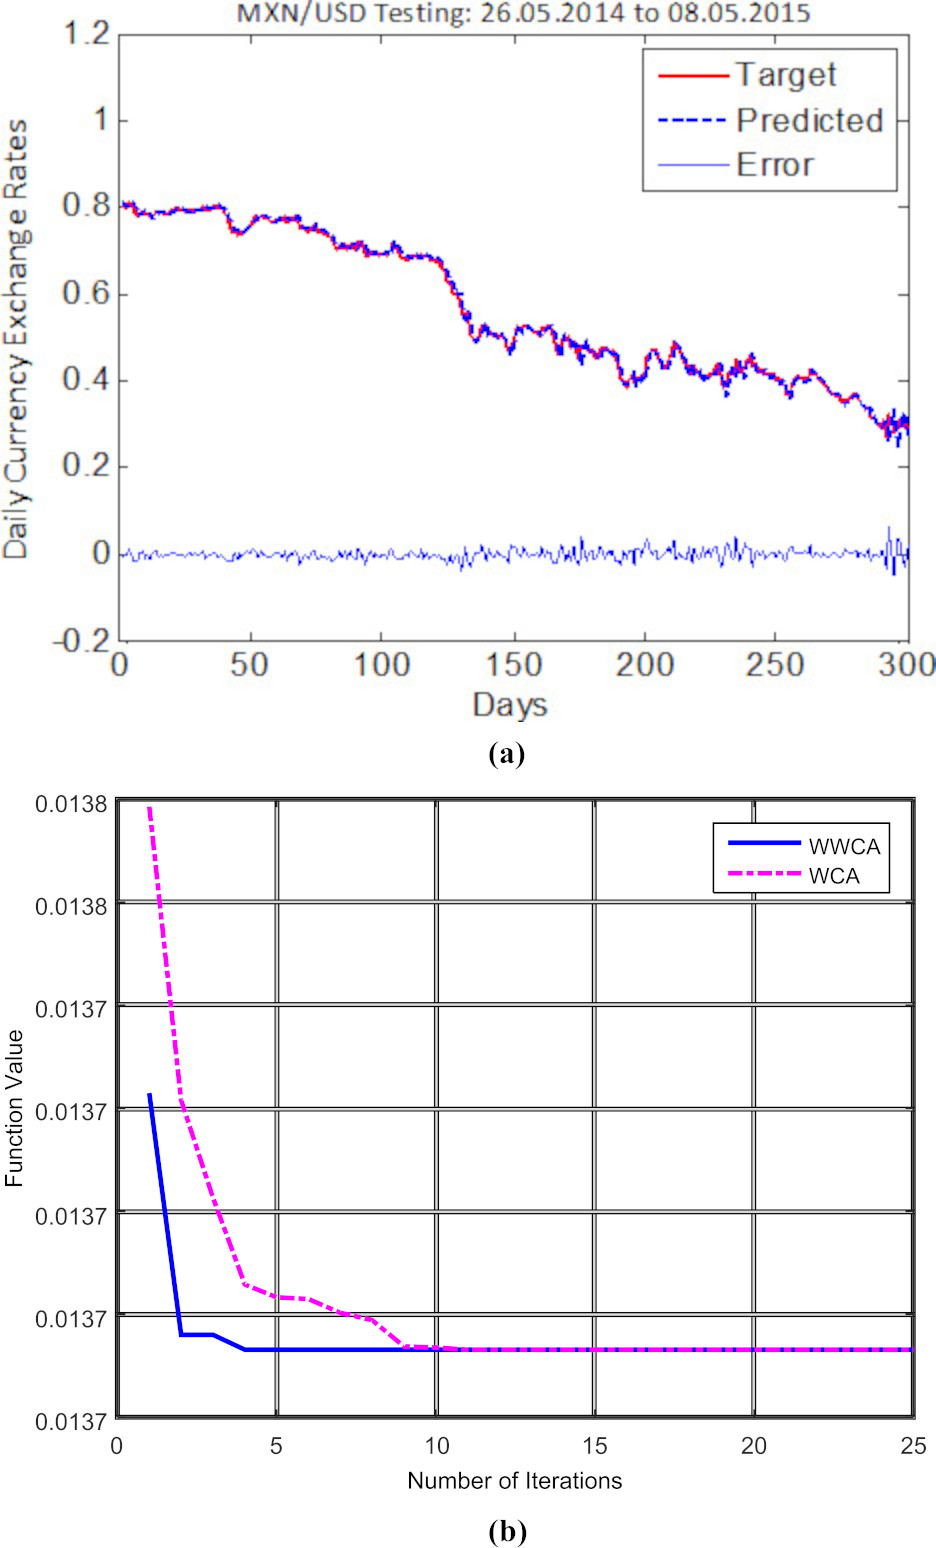
As the non-optimized approaches provide lower accuracy, for illustration purpose we have shown the measured errors of the proposed Wavelet-RDAN approach for the considered datasets in Table 2. From the convergence figures of the three datasets for the optimized WWCA-Wavelet-DAN shown in Figs 4b, 5b, and 6b, it is evident that the errors converge at less than five iterations in all the test cases whereas WCA takes more iterations to obtain the optimized values of kernel parameters. After a few more iterations, WCA converges almost with the same objective function values with a very little higher obtained error. In all the cases the number of population is fixed as 50, number of iterations 25; in each case we can notice WWCA is more effective than WCA with regard to error convergence. Thus we used the proposed WWCA technique with our proposed DAN network for optimizing the kernel parameters for day ahead currency exchange rate prediction.
(a) BRL/USD Testing results with errors. (b) Modified WWCA and WCA convergence curve for BRL/USD results.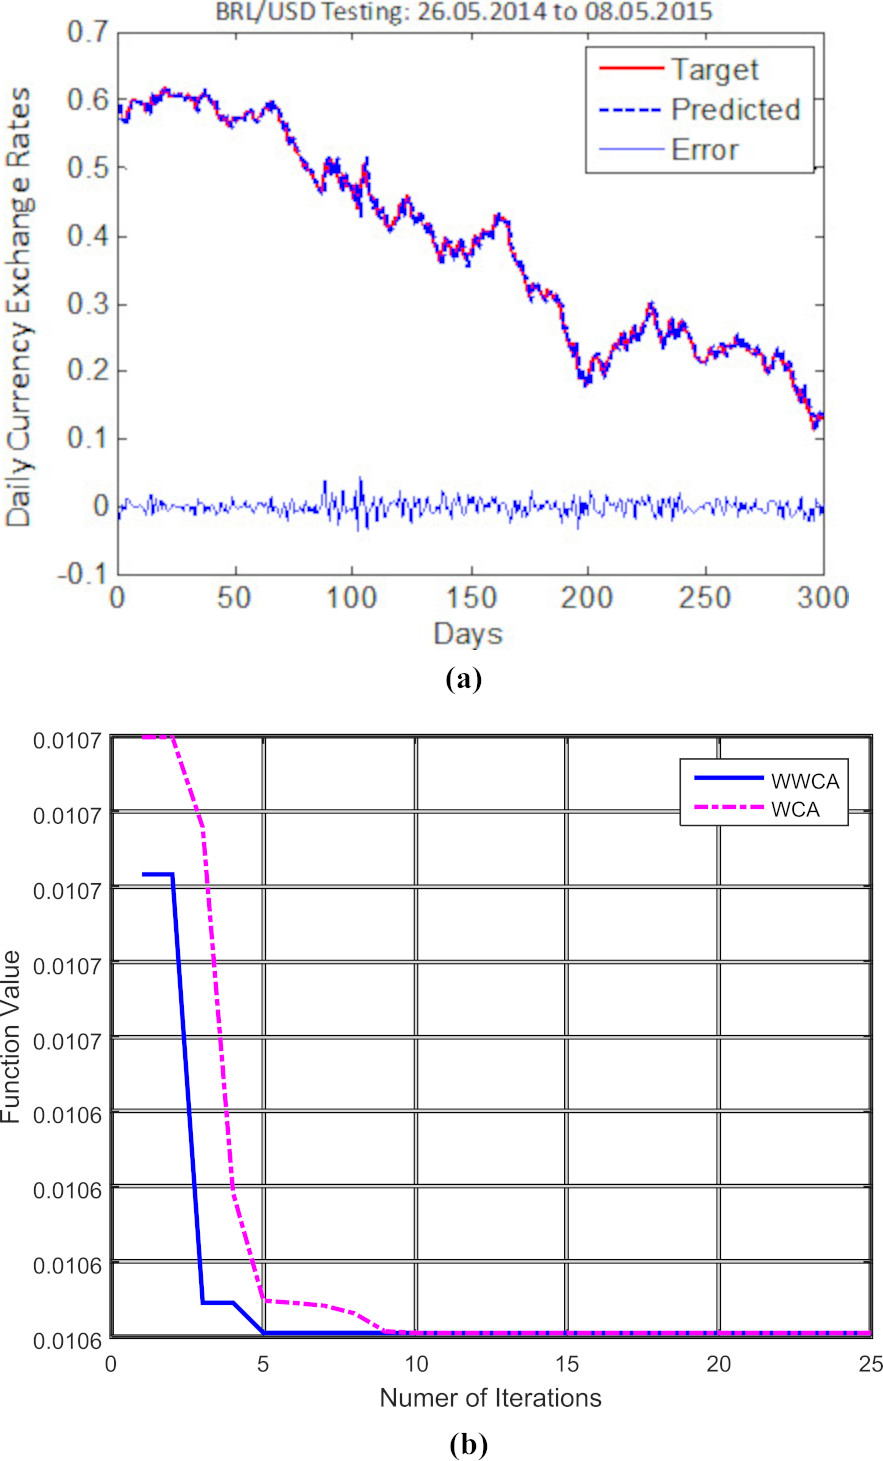
The MYR/USD and BRL/USD converge at the lowest of five iterations whereas the MXN/USD takes approximately eight iterations for convergence and to get the optimal wavelet kernel function values i.e.
The considered models are examined with Friedman test [43] with Scheffe’s procedure at 95% confidence level to identify the best model by performance. The obtained Friedman test values are presented in Table 3. Among the mean rankings of the considered models, the proposed WWCA-Wavelet-RDAN model is obtained with the lowest mean rank (MR) value which indicates the supremacy of the model as compared to other models by ranking comparisons. The MYR/USD yields the lowest MR value of 2.9654, the MXN/USD yields the lowest MR value of 3.0206 and the BRL/USD shows the lowest MR value of 2.8933 in the proposed WCA-Wavelet-DAN model which are lower than the MR values of other models. The proposed model comparison with other models shows Scheffe’s p-values (p) below 0.05 which identify the significance differences among the models. The details comparisons are provided in Table 3 for the three datasets.
Scheffé’s procedure based on Friedman test with 95% confidence level for MYR/USD, MXN/USD, BRL/USD
Note: MR: mean rank,
Price trend in each year on historical data of MYR/USD, MXN/USD, and BRL/USD
The solution to trend prediction in the form of binary classification problem is examined on three currency exchange markets, i.e. MYR/USD, MXN/USD, and BRL/USD over a period of four years from 3 January 2012 to 31 December 2015 and each dataset carries 1044 numbers of currency exchange prices.
Forex trend calculation on historical data for target fixation
The daily exchange price directions of these datasets in terms of 1 (up)/0 (down) are calculated year wise for the entire dataset. The up and down instances are obtained on 1044 data by finding the difference between the daily prices with simple rule base which indicates that if price on current day exceeds the price on recent previous day then the instance will be considered as up trend (1) and in reverse case it is considered as down trend (0), and if both the conditions fail then it will be considered to have no trend. The number of up/down instances calculated on this rule base in each year for the MYR/USD, MXN/USD, BRL/USD datasets are depicted in Table 4 and the number of up/down instances calculated for further divisions of training and testing as per Table 1b are reported in Table 5.
Price trend in each year on historical data of MYR/USD, MXN/USD, and BRL/USD selected for training
and testing
Price trend in each year on historical data of MYR/USD, MXN/USD, and BRL/USD selected for training
Classification accuracy obtained during training and testing of MXN/USD datasets using WWCA-Wavelet-DAN and other kernel function based DAN approach
Avg: Average, Trn: Training, Tst: Testing, PCCA: Percentage correct classification accuracy, Fm: F-measure.
The MYR/USD dataset contains 554 up instances which claim 53.07% of the total 1044 data and 490 down instances which claim 46.93% of the total 1044 data. Each year contains 261 data. 127 up trends and 134 down trends are found in 2012, 156 up trends and 105 down trends are found in 2013, 134 up trends and 127 down trends in 2014, and 137 up trends and 124 down trends in 2015 are found in 2015. The MXN/USD dataset contains 500 up instances which is 47.89% of the total instances and 544 down instances which is of 52.11% of the total 1044 instances. Out of 261 instances, 120 up trends and 141 down trends are found in 2012, 137 up trends and 124 down trends are found in 2013, 119 up trends and 142 down trends are found in 2014, and 124 up trends and 137 down trends are found in 2015. Similarly the BRL/USD dataset contains 461 up instances i.e. 44.16% of the total instances and 583 down instances i.e. 55.84% of the total 1044 instances. Out of 261 instances, 111 up trends and 150 down trends in 2012, 116 up trends and 145 down trends in 2013, 118 up trends and 143 down trends in 2014, and 116 up trends and 145 down trends in 2015 are found from the historical data.
Each training data carries 261 data in each year out of which 131 data (
Classification accuracy obtained during training and testing of MYR/USD datasets using WWCA-Wavelet-DAN and other kernel function based DAN approach
Classification accuracy obtained during training and testing of MYR/USD datasets using WWCA-Wavelet-DAN and other kernel function based DAN approach
Avg: Average, Trn: Training, Tst: Testing, PCCA: Percentage correct classification accuracy, Fm: F-measure.
Classification accuracy obtained during training and testing of BRL/USD datasets using WWCA-Wavelet-DAN and other kernel function based DAN approach
Avg: Average, Trn: Training, Tst: Testing, PCCA: Percentage correct classification accuracy, Fm: F-measure.
The three datasets taken from MYR/USD, MXN/ USD, and BRL/USD are analyzed for trend detection using the proposed WWCA-Wavelet-DAN model by training. Once the model is well trained then testing is processed for the dataset held for testing and measured the prediction accuracy in terms of PCCA (Percentage correct classification accuracy) (Eq. (59)) and Fm (F-measure) (Eqs (60)–(62)) and discussed the obtained results and compare with the results obtained in other kernel variants like Gaussian kernel,tan hyperbolic kernel and polynomial kernel functions.
tn
Price trend on historical data of MXN/USD, MYR/USD, BRL/USD selected for training
Classification accuracy obtained during training
Avg: Average, Trn: Training, Tst: Testing, PCCA: Percentage correct classification accuracy, Fm: F-measure.
The calculated scaled values of the MA, RSI, MACD, %K, %D, %R technical indicators are employed as inputs to the proposed method for starting the model processing with an aim to correctly classify the trend against targeted trend. Once the inputs are employed to the model, it yields output with continuous values which is further utilized to find the trend with a decision point fixed at the mean (
The prediction accuracies in the proposed model and with other kernel variants are reported in Table 6 for MXN/USD dataset. From the obtained results we found the proposed Wavelet-KRR model with WWCA optimized values (WWCA-Wavelet-DAN) claims to be the best with higher PCCAs in all cases and yields the highest average PCCA (APCCA) of 86.69% over four years i.e. 2012, 2013, 2014 and 2015 during training and 82.60% during testing which are the best obtained accuracies as compared to other kernel variants like polynomial, tanh, and Gaussian kernels. The measured APCCAs using polynomial, tanh and Gaussian kernel functions during training are obtained with lower accuracies of 84.74%, 82.53%, and 86.11%, respectively, and during testing the accuracies are found to be 79.30%, 81.40%, 82.00%. The year wise accuracies in almost each case are lesser than the wavelet kernel based DAN model. The calculated Fm values are seen in the table. From tabular values and the results analysis, it is quite clear that the wavelet kernel is more efficient in finding correct classes in each year during training and testing for the MXN/USD dataset.
We can observe in Table 7 that in case of MYR/USD dataset, the highest classification accuracy is obtained with the proposed model showing 81.15% average accuracy in training and 76.20% average accuracy in testing across all the years. The year wise classification accuracy almost in each year is also superior to other kernel variants. On the other hand, the training accuracy in Poly-DAN approach over the years varies between 75.20% and 76.80% during testing and training accuracy varies from 80.15% to 82.53% which is comparatively lesser than the proposed one. Similarly the tanh-DAN and Gaussian-DAN functions are lesser efficient in these cases compare to the proposed one. The corresponding Fm values also support the achievements of the WWCA-Wavelet-DAN approach. We can notice from the table that the accuracy is increasing consistently in the proposed method while comparing the performance year wise for the other kernel variants and hence the proposed WWCA-Wavelet-DAN model is achieved to be the best model among different predictive models considered here.
The trend prediction result of the third dataset i.e. BRL/USD is summarized in Table 8. Here also the proposed approach achieves better performance in all the considered cases which is clear from result analysis. The resultant average classification accuracy is found to be 85.83% which is the highest among the other considered models. The year wise classification accuracies are higher to the resultant accuracies obtained in other kernel variants year wise. In the years 2012 and 2015, the highest accuracy is found to be 86.40% whereas in 2013 and 2014 it is found to be a little lower. In all the cases the WWCA-Wavelet-DAN keeps maintaining higher accuracies both in training and testing. The Fm values reported in the table show the efficiency of the proposed model in all the case studies. With all the analysis and discussion, it is ascertained that the proposed model achieves quite promising performance results using the MYR/USD, MXN/USD, and BRL/USD datasets.
Further for verification purpose, the entire data across all the four years are partitioned into two phases; first 50% of the entire data are for training and the next 50% data for testing which carries 522 data in each phase covering the period 03 Jan. 2012 to 31 Dec. 2013 and 01 Jan. 2014 to 31 Dec. 2015, respectively, for the training and testing phase. The up and down trends on historical data during training as well as testing are summarized in Table 9. The trend prediction performance accuracies with reference to Table 9 are reported in Table 10. While comparing these results with the obtained average PCCAs presented in Table 6, Table 7 and Table 8 across four years for MXN/USD, MYR/USD and BRL/USD reported in Table 10, similar results are found with better achievements in accuracy using the proposed WWCA-Wavelet-DAN model.The comparison of the robust WWCA-WDAN with WWCA-WKRR is also shown in Table 10 which indicates the efficiency of the proposed WWCA-WDAN model with higher classification accuracies in all cases.
The variation in training and testing datasets for the three forex markets again verifies the model efficiency and the obtained PCCA and Fm values in the experiment prove the efficiency of the proposed WWCA-Wavelet-DAN model as compared to the other kernel variants. Further the model is compared with Naïve-Bayes classifier, support vector classifier and ANN. The classification results with comparison shown in Table 10clearly indicate the significant achievement of WWCA-Wavelet-DAN (bold fonts) in classification accuracy by showing higher PCCAs and Fm values in all the datasets. The WWCA-Wavelet-DAN model produces superior performance in comparison with all the predictive models considered in this studyincluding other kernel variants for forex trend detection.
The study and analysis of forex market is one of the complex tasks in financial market and stands as a challenge to human intelligence. Therefore, the proposed method is executed for forex price as well as forex trend prediction. Thus in this analysis, the non-iterative Wavelet-DAN model is proposed for forex price prediction and trend detection in order to achieve promising performance accuracy with less computation overhead. In order to maximize the forecasting as well as classification accuracy, a modified WCA algorithm i.e. WWCA is proposed and utilized to optimize the kernel parameters. This model is compared with the optimized DAN and KRR models combined with other kernel functions like polynomial, tan hyperbolic, and Gaussian kernel. From the experimental results it is confirmed that the optimized WWCA-Wavelet-DAN model reveals the best prediction accuracy with lowest prediction errors with RMSE, MAE, and MAPE values among the considered kernel functions for MYR/USD, MXN/USD, and BRL/USD forex data sets which is also superior to the well known non-iterative ELM and RELM techniques, and traditional BPNN technique which requires a higher number of iterations for its convergence with high computational overhead.
The forex trend prediction treated here as a classification problem is solved using modified WWCA-Wavelet-DAN approach in the three forex datasets (MXN/USD, MYR/USD, BRL/USD)and the revealed classification accuracies from the experimental results in terms of PCCA and f-measure prove its superiority over the other kernel variants and some well known classifier techniques like Naive-Bayes classifier, support vector classifier, and ANN. The proposed model offers simple execution procedure and is quite efficient for nonlinear time series prediction like currency exchange rate. From the results and discussion, we reach at a conclusion that the proposed approach is quite efficient and can be treated as a promising machine expert approach for nonlinear time series prediction in highly noise environment.
Footnotes
Conflict of interest
The authors declare that they have no conflict of interest for this paper.
Future scope
This paper is focused on currency exchange rate prediction for day ahead prediction and daily price trend detection. In a future work the authors will focus on trading for taking decision for stock investment by taking predicted factors. The proposed method can be applied to other forecasting problems like stock price forecasting, electricity price forecasting, load forecasting, etc. Other variants of chaos functions will also be considered and verified for currency exchange rate prediction and trend detection.