
Abstract
Sales and operations planning translates the requirements of the customers at the market place (related to new and/or existing products and services) into actionable tactical plans to drive the activities of the value chain of the organization. The present work aims to provide a multi-period and multi-perspective evaluation framework to compare the sales and operational performance (SOP) of firms in an emerging market. SOP is one of the frontline KPIs that describes the efficiency and effectiveness of the sales and operations planning. There is a scantiness in the extant literature about well-defined indicators to measure SOP. The current work fills the gap in the literature by developing a hybrid multi-criteria decision making (MCDM) framework utilizing the Logarithmic Percentage Change-driven Objective Weighting (LOPCOW) and Evaluation based on Distance from Average Solution (EDAS) models for a novel application in assessing SOP. From the data analysis, it is also evident that there is a variations in the year wise ranking of the companies. However, all individual year wise rankings maintain statistically significant correlations with the aggregated ranking. For aggregation purpose, Borda Count Method is used. The companies like ITC Limited, Hindustan Unilever Ltd., Avanti Feeds Ltd., Britannia Industries Ltd., and Symphony Ltd. hold the top five positions on aggregate. The comparison with other MCDM models is made and sensitivity analysis is carried out. The present work is a first of its kind that would encourage the analysts and the policy makers to evaluate the sales and operational performance using a scientific way.
Keywords
Introduction
Sales and operations planning translates the requirements of the customers at the market place (related to new and/or existing products and services) into actionable tactical plans to drive the activities of the value chain of the organization [1]. In other words, sales and operations planning integrates the functional activities of the firms, for example, sales and marketing, supply chain management, financial management and others. The effectiveness of the sales and operations plan is evaluated by review of the results, i.e., organizational performance in creating and delivering the value to the customers. The sales and operational performance (SOP) is one of the frontline KPIs that describes the efficiency and effectiveness of the sales and operations planning. In recent days business situations are convoluted because of the diversity of consumer preferences, technological advancement and globalisation. Azim el al. [2] conducted a research based on the ceramic companies of Bangladesh to explore the relation between operational performance and profitability of the firm. The result explains that the profitability is absolutely influenced by alteration in the fixed asset movement, return on equity and asset. Also the research finds that there is a relationship between the operational performance and profitability. Performance measurement is the important to appraise the firm’s competitive advantage. In manufacturing segment, operational performance has significant bearings on the parameters like product cost, product reliability, and cycle time [3].
To develop the operational excellence, a skilled management teams is needed along with innovative product development, fulfilling customers and employees’ need, proper investment planning, and efficacious waste management system [4]. The study of Gomes et al. [5] advocates for execution of the daily measurement process rather than the performance system strategy. In manufacturing firms the two hindrances that constrains effective operational performance measures are lack of appropriate training and absence of eloquent visions [6]. The paper of Melnyk et al. [7] discussed about the significance and necessity of metrics-related approach to provide the crucial linkages between intended strategies, actual implementation, and final value creation. Their research suggest that the metrics can be categorized based on two main aspects: metrics focus and metrics power. Based on these aspects they designed four different varieties of metrics such as financial/outcome, financial/predictive, operational/outcome, and operational/predictive. They have also identified the future research scope for finding the association between metrics characteristics and business performance. The study of Indrayono [8] also demonstrated the necessity to improve the financial performance for gaining the positive response from the investors reflected in the stock prices.
The extant literature argued for creating firm value by providing value-added products and services to the customers and wining the mind of the stakeholders. The firm value gets manifested through various outcomes. One of the significant indicators that describes the value of the firm is its stock price at the market. A higher firm value indicates company’s worthy situation for the investors. The firm value has an impact on capital structure and the profitability. Sales growth is positively associated with capital structure. Capital structure arbitrates the impact of sales growth on firm value [9]. In another study [10], the authors demonstrated the role of the sales force in fostering innovativeness of the firms. The efficiency of the sales operation ameliorates the connectedness of the firms with the customers which in turn helps the organization to provide innovative value-added products and services. As a result, the firm enjoys the growth in sales and earn more revenue. The growth in the revenue leads to profitability that attracts the investors. In effect, the firm becomes able to raise more capital through a rise in the stock price. Nurcahyo and Habiburrahman [11] noted the positive impact of improvement in the operational performance on overall business performance reflected in its sales growth, profitability and market share. The study was conducted on Indonesian automotive component manufacturers. Liu et al. [12] conducted a study to delve into the interrelationship between operating efficiency and flexibility of the firms and their stock prices amidst extreme disruptions caused by COVID-19. Based on the event study approach the authors reported that the operating flexibility results into an abnormal stock return. In a similar type of work, Nugraha et al. [13] put effort to discern the impact of sales growth, total asset, size of the firm and stable cash flow (proxy: net income) on stock price over a period of five years (2014–18) on Indonesian manufacturing firms. Using a panel data regression approach the study revealed a different finding as it noted the significant impact of only the firm size on stock price.
From the above discussions, we note that the extant literature (apart from few exceptions) reported that SOP has an importance in creating firm value which in turn favourably influence the stock price and growth of the organization. However, a further deep introspection of the past work (which we present in Section 2) reveals that there are several frameworks available in the literature that explain the importance and cornerstones of sales and operations planning. However, there is a void in the literature in terms of non-availability of a multi-factors based structured framework to evaluate SOP of the firms and compare their performance. The researchers [14, 15] pointed out the need to develop a comprehensive SOP evaluation framework linking various dimensions and theories of sales and operations planning, supply chain performance and overall achievement of the firms in financial terms. Motivated by the gaps in the literature, we undertake the ongoing work. Since there is a need to integrate multiple aspects for developing a framework to evaluate SOP, the present work proposes a hybrid MCDM model. We demonstrate the application through a real-life case study on FMCG and CD firms operating in India. Hence, the primary objective of our work is to discern the SOP of firms using MCDM approach. The research questions that we enquire through our work are as follows.
RQ 1. How can MCDM models be used to formulate a reliable framework for evaluating SOP of the firms?
RQ 2. How can an aggregated SOP score be calculated to rank the firms?
RQ 3. To what extent the firms differ from each other in terms of their SOP?
To answer the above-mentioned research questions, we use a hybrid MCDM model based on LOPCOW (used for computing the criteria weights) and EDAS (for ranking purpose). The LOPCOW model is developed by Ecer and Pamucar [16] to derive the criteria weights. The model provides a number of advantages. Unlike the other widely used MCDM models like entropy method, LOPCOW is able to provide reliable result even under the presence of negative values in the decision matrix. In addition, the LOPCOW model utilizes a fundamental statistical approach to adjust the dispersed performance values of the alternatives (under the effect of the criteria) by considering the standard deviations. The use of logarithmic function further helps to bring in a reliable distribution of the criteria weights. Keshavarz Ghorabaee et al. [17] developed the EDAS method as a distance-based MCDM model to compare the alternatives based on their performance with respect to the criteria set. Given the criteria set and performance values, EDAS computes two types of distances such as PDA (positive distance from the average) and NDA (negative distance from the average) for each alternative. Then, a composite appraisal score is calculated to rank the alternatives. EDAS has been widely used because of the advantages like ability to produce stable and reliable outcome even with substantial variations in the values of the elements of the decision matrix, freeness from rank reversal phenomenon and ability to work with a large number of alternatives and criteria.
The main contributions of the present paper are as follows. First, to best of our knowledge the current work is a first of its kind that provides a multi-criteria based objective measurement of SOP of the firms. Second, a novel method to determine the aggregate SOP score that is useful to compare the firms precisely. Third, in Indian context, the current work is quite rare that compares the SOP of FMCG and CD sectors. Fourth, the ongoing study is a first of its kind work which compares the SOP performance over multiple periods. Fifth, the present paper utilizes a novel application of the hybrid LOPCOW-EDAS model for evaluating operational performance. The previous studies of similar kind have not applied variety of MCDM models extensively.
The rest part of the present paper is constructed in the following manner. Section 2 presents a brief review of the related work to select the criteria for assessing SOP of the firms. Section 3 provides the descriptions of the LOPCOW and EDAS methods respectively. Section 4 describes the case study and the research framework. In Section 5 the major findings are highlighted. Section 6 includes the discussions on the result. Lastly, Section 7 concludes the paper and mentions some of the future scopes.
Criteria for measuring sales and operational performance
In this section we present summary of some of the previous work related to our study for selecting the criteria for assessing and comparing the SOP of the firms.
Discussions on related work
Operational performance can be classified into cost performance and differentiation performance [18]. The “pure cost” company is having a higher relative cost value with lower differentiation value. The “pure differentiation” company is displaying a lower relative cost value with higher differentiation variables values. This group is holding greatest operational performance in consistency of delivery, flexibility of service, and company image. Finally, the “cost and differentiation” company enjoys both higher level of relative cost values and differentiation values. The study by Sobczyk et al. [19] investigated resource utilisation, costs, profits, valuation of inventory, and additional significant operational and financial factors. A fuzzy supply chain operations reference model was designed by Elgazzar et al. [20] to assess supply chain (SC) performance. This approach based on the weighted rate of each attribute permits the firms to accomplish the effectiveness and efficiency of SC operations for achieving SC objectives and to attain total firm’s improvement.
The performance of the firm performance depends upon three important aspects like- marketing capability, operations capability, and diversification strategy. Marketing capability has been also identified as one of the main elements of higher financial performance [21]. The research showcases that a market-driven firm is having improved business performance than that of operational competences oriented firms. The multiple regression analysis by Duarte et al. [22] did not support the positive association between operational practices and financial performance. ISO certification of manufacturing and ceramic industries had a stronger negative association on a firm’s growing percentage than in other segments. The model suggested by Nakhaei [23] delivers a moderating link between economic measures like Economic Value Added (EVA), Refined Economic Value Added (REVA) and EVA Momentum) and accounting measures like Net Profit (NP) and Operational Profit (OP) with market value added (MVA) to calculate business achieve. The business with more strategic flexibility faces a lesser encounters in resolving the associated trade-offs between customized production and mass production along with irregular and gradual innovations in operational level. Mass customization capability and innovative ambidexterity, entirely mediate the association between strategic flexibility and operational efficiency. Also innovative ambidexterity permits the businesses to follow several innovation practices with higher operational efficiency [24].
The study of Gill [25] showcased that the firms having higher profit level report a low asset turnover. The authors argued that improvements in the operational efficiency create the changes in future performance of manufacturing companies of India. Businesses’ future performance is negatively associated with the increment in the cash conversion cycle (CCC). The management can generate positive assessment for the stakeholders by lessening cash conversion cycle at a lowest standard. The company’s cash flow policies, that accomplish working capital as cash receivables from customers, inventory holdings, and cash payments to suppliers, are inevitably related to the business operations. Also CCC metric is not associated for the changes in performance of the firm. The various factors like- processes, tools, systems, metrics and approaches of performance measurement practices have been identified by the former researchers [6]. The researchers proved that there is a positive relationship between the operational performance measures index and factors of performance measurement practices. The financial leverage of a firm has two consequences. First, it decreases the satisfaction of the consumers especially for service industries and secondly, moderates the association between satisfaction and the value of the business. The leverage is also mediated by the advertising expenses. Leverage negatively regulates the customer satisfaction and firm value link. Company’s high value debt obliges the business from developing the intentional prospects available through market-based assets [26]. Financial ratios like return of asset-on-assets (ROA), inventory turns and revenue growth do not give satisfactory considerate for supply chain practices and leaders achievements [15].
The franchises ask for higher values than their corporate counterparts, while governing the operational performance. But they display alike financial performance (like- revenue) for the equivalent standard of operational performance. Service triad structure (i.e. the franchisor, the franchisee and the customer) shows an important role in franchisees’ capability to free-ride on shared brand equity [27]. Former research also underpins the correlation between brand equity and specific non-financial performance measure (operational performance) in FMCG industry [28]. Hence the company with higher brand equity produce higher market share. The previous study has proven that independent retailers are expedient than large chain retailers in terms of human resource utilisation and gross margin though they are weak in purchasing commodity and in-shop space. One of the major motive is the involvement of family members in the business of independent retailers. However, the ongoing exactness of commercial conveniences, retail competition is fetching progressively severe and the living area for retailers is becoming lesser [29]. Framework also has been designed by the researchers to measure sales and operation planning (S&OP) [30]. The framework focuses on the importance of cross-sectional measures and it is formed on the basis of standards of appropriate measures like comprehensiveness, inside process efficiency, horizontal and vertical integration, internal comparability, and usefulness. A linkage model between supply chain (SC) operation and financial model, demonstrates that EVA approach is more efficient and reliable for enhancing business’s overall value along with sufficing the target values for financial ratios [31]. Another mathematical models has been developed by the researchers [32] based on a fully integrated S&OP (FI-S&OP) approach and a partially integrated S&OP (PI-S&OP). This model can calculate the added value of these tactics in another multi-site manufacturing network, where backorder was permissible. Indian Government’s active guidelines like-unwrapping scopes for the private players, creating policies and guidelines, removing restrictions on FDIs have generated the environments to expand worldwide. A framework on Fuzzy Elimination and Choice Expressing Reality (ELECTRE) based approach can generate a strategy to improvise the performance by standardising operational parameters [33].
The dimensions of SC like strategic supplier partnership and information sharing positively influences the overall firm performance. But another dimension of SC, i.e. – information quality is the irrelevant factor of business performance. The sales growth, product growth and current market value are the major elements of firm performance [34]. One study was done based on FAHP, TOPSIS, and a hybrid method of combining FAHP and TOPSIS methods, emphases on investigative the association between financial and operational performance dimension [35]. The modelling framework is designed an evaluation structure that would support in accepting their strength and weakness in the performance metrics. There is no association between earnings management and bankruptcy risk. The business strategy of the firm, having negative association with bankruptcy risk, has a positive and significant association with financial strength. One research framework proposes that companies which apply either one of two generic business strategies of cost leadership or differentiation can considerably moderate lower bankruptcy risk [36]. The credit lenders put significant emphasis on cash flow. The extant literature shows evidence to understand that the cash flow statement influences the confidence of credit officers for both the short-term and long-term tenure. Additionally, lending managers take into account the business condition [37]. Considering the significance of credit risk and capital adequacy of rural bank, one research has been conducted by Buchdadi et al. [38]. The results shows that both have significant impact on financial distress. A research was conducted to realise higher sensitivity and visibility in the supply chain network, finds S&OP processes and the key operations in the supply chain requisite to be completely combined. The information system resources are the main enabler for such combination [39]. The study of Moktadir et al. [40] has identified manufacturing industry’s key performance indicators (KPIs) of operational excellence in relation to sustainability. They developed a framework for evaluating operational excellence using best-worst method (BWM). The results specify that the KPIs related to “Management” category are holding the highest priority. The paper also discussed about the advancement of operational performance by focusing on the areas like- utilisation of resources, effectual inventory management system, maximisation of return on investment (ROI), customer satisfaction etc. In another work on flexible packaging industry suggests the need to evaluate the operational performances continuously based on appropriate KPIs. The companies can improvise their operational performance for securing sustainable competitive advantage. The KPIs can be segmented into the areas like production, quality, financial, customers’ contentment, employee satisfaction and environmental protection [41]. One study [42] was conducted to assess the performance of airlines industries from 2006 until 2016 based on operational and stock market parameters. The investigation revealed heterogeneous performance of the industry over the study period. The performance outcome of the stock market failed remarkably during European debt crisis and United States debt-ceiling crisis of 2011. Based on the result the authors concluded that further broad inferences can be made on performance evaluation methods if both operational and stock market parameters are used.
Another study on food and beverage industries shows that firm size and sales growth do not increase the capital structure and firm value. But capital structure effects the firm value. The researcher also show good liquidity can improvise capital structure of the firm impacting the positive responses of the investors [43]. The detailed SCM strategies had a notable effect on organizational competencies. Organisational competence arbitrated the effect of SCM strategy on operational performance, but not on financial performance [44]. Previous research has empirically proved that operating cash flow had a negative association with financial distress. The company with high of cash flow enhances the confidence level of the creditors in performing its obligations by avoiding financial distress. Similarly higher is the sales growth of the firm, lesser is company’s financial distress. A higher capacity value prospects in regulating shareholders higher expectations and results in higher financial distress [45]. Attainment of financial soundness is very significant for growth of business unit. It can be determined by well-planned payment methods, adequate operations in finance and withstand contingencies. The researchers in this regard, also mentioned that Indian automobile companies enlisted in National Stoke Exchange (NSE) are financially holding robust position and less prone to financial distress or bankruptcy [46]. However, some studies like Kusumah [47] have reported that the factors like Return on Assets, Sales Growth, Asset Growth, Cash Flow and Liquidity have no influence on the firm’s Dividend Payout Ratio. Cash cycle time, return on working capital and perfect order fulfilment are the significant performance metrics as identified by the research of Yildiz and Ahi [48] based on the modern version of Supply Chain Operations Reference (SCOR) model for standardisation.
Criteria for assessing SOP
Based on the discussions made on the arguments and findings of some of the previous work, we derive the criteria for measuring the SOP of the firms. Table 1 provides the list of criteria and their brief descriptions. The criteria are selected considering three aspects such as effectiveness, efficiency and risk.
List of criteria
List of criteria
In this section we provides the computational steps for applying the LOPCOW and EDAS models for comparative assessment of SOP of the firms.
LOPCOW method
The LOPCOW method has been developed very recently. It has already been applied in different real-life problems such as performance evaluation of insurance companies [49], intercity railway construction projects using fermatean cubic fuzzy set based LOPCOW [50], assessment of dividend payment capability [51], Recruitment and selection of sales professionals using spherical fuzzy based LOPCOW [52] and defining sustainable indicators [53]. The procedural steps [16] are described below.
Let,
In this case,
Step 1. Formulation of the normalized decision matrix
Applying the linear max-min type normalization scheme the elements of the normalized decision matrix e obtained as:
Step 2. Computation of the Percentage Value (PV) for each criterion
The PV for each criterion is computed as:
Step 3. Computation of the criteria weights
The weight for the
Where,
The scientific usefulness of the EDAS method has encouraged several researchers to use the model in solving various types of real-life cases. Some of the recent applications include mutual fund performance evaluation [54], selection of third party service providers for logistics solution [55], ranking of mobile payment options [56], crowdsourcing for mobile selection [57], service quality assessment of hotels [58], contractor performance evaluation in the construction industry [59], facility location selection for shopping malls [60] etc. The steps to arrive at the final ranking of the alternatives using the EDAS method [17] are described below.
Given is the decision matrix:
Step 1. Compute the average solution
The average solution is found as
Step 3. Calculation of PDA and NDA
The PDA and NDA are calculated as follows:
PDA:
NDA:
Step 4. Find out the weighted sum of PDA (SP) and NDA values (SN) for all the alternatives
The weighted sums of PDA and NDA, termed as SP and SN are calculated as sum products and given below:
Here,
Step 5. Compute the normalized weighted sum of PDA (NSP) and NDA values (NSN)
For weighted sum of PDAs:
For weighted sum of NDAs:
Step 6. Calculate the appraisal scores (AS) of the alternatives
The appraisal score of the
Here, 0
The alternative that secures the highest AS would be ranked first and the others are ranked as per their AS in a descending order.
The Borda Count is an age old aggregation method used in the preference based rankings [61]. The steps to arrive at the preference based final ranking using this method are described below [62].
Step 1. Preference of the alternatives according to various decision makers or methods
Step 2. Computation of the preference point for each alternative for each decision maker or method which is equal to the number of alternatives following the considered alternative. Therefore, the mostly preferred alternative receives a point value equal to (
Step 3. Find out the total preference points obtained by each alternative.
Step 4. Order the alternatives based on the total points in descending order.
In this context, the Copeland Method (CM) came into existence as an extended and modified version. The procedural steps are described below [62].
Copeland approach
Step 1. Computation of the win score for each alternative with respect to others.
Step 2. Computation of the loss score for each alternative equal to the difference between majority wins’ score and the score obtained by the alternatives in the first stage.
Step 3. Compute the final score for each alternative obtained by calculating the difference between the win and loss scores.
Step 4. Order the alternatives based on their final scores in descending order.
Case study
The present paper demonstrates a case study on Indian FMCG and CD sectors. In this section we describe the details of the research framework.
Study period
We initially consider a total span of 10 consecutive financial years from FY 2012–13 to FY 2021–22. The FY 2012–13 is taken as the base year for calculation of year to year performance indicators (e.g., sales growth). We then exclude FY 2021–22 and FY 2020–21 from our study as most of the firms have not yet restored the unprecedented effect of COVID-19. Hence, our effective study period for comparison of SOP of the selected FMCG and CD firms is from FY 2013–14 to FY 2019–20.
Sample
To select the firms from the FMCG and CD sectors, we calculate the average market capitalization for all the constituent firms from the two sectors over the study period (FY 2013–14 to FY 2019–20). Then, we select our final sample based on higher values of the market capitalization. Accordingly, our sample contains top 25 FMCG and top 5 CD firms. The size of the final sample (
List of firms under study
List of firms under study
Steps of the case study.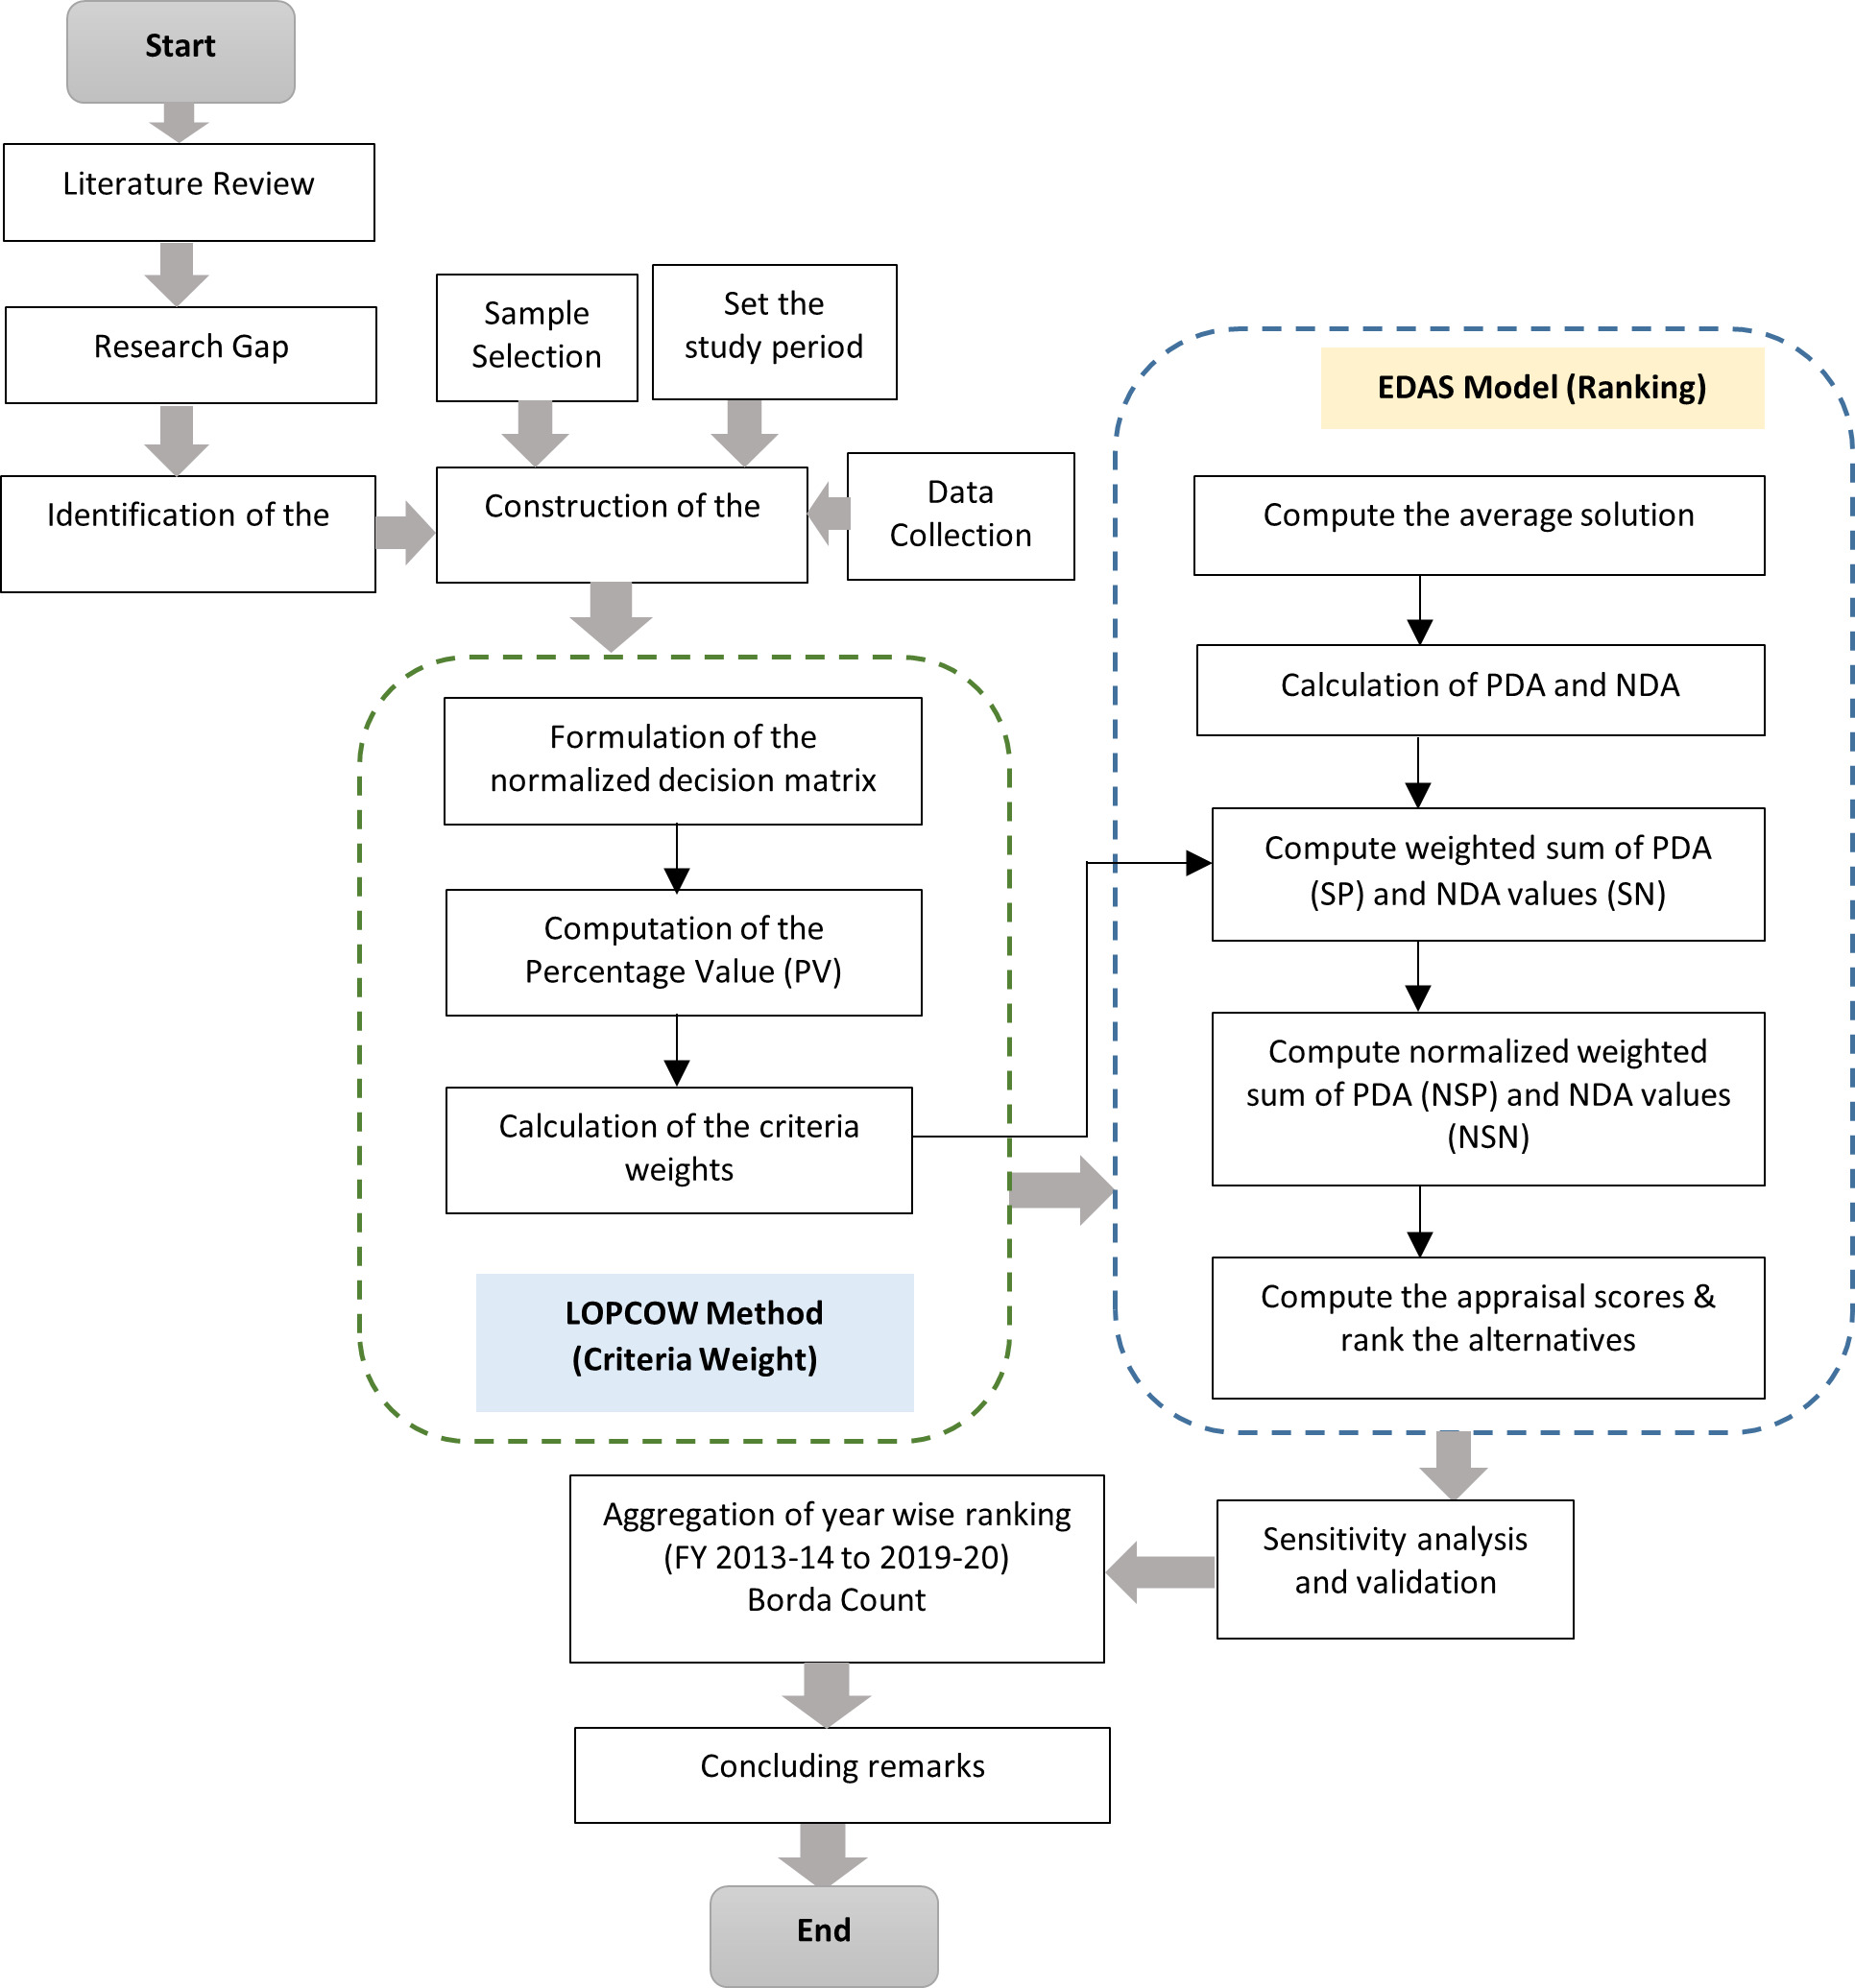
The data has been collected from the secondary sources such as CMIE Prowess IQ (version 1.96) and company websites. Then, the values for the criteria have been calculated and the decision matrices have been formulated for all FYs (FY 2013–14 to FY 2019–20). The same are given in Appendix A. The step by step analysis for the present case study is depicted in Fig. 1.
Findings
In this section we present the results of the step-by-step data analysis. First, we demonstrate the calculation of the criteria weights for the decision matrices (see Appendix A) for the FY 2013–14 to FY 2019–20. We here show one example for calculation of the criteria weights. Let us take the FY 2013–14.
As examples, the normalized values for
For the criterion
Therefore, the difference is calculated as:
Similarly, for
Now using the above calculations, the normalized values are obtained as given below:
Normalized decision matrix (FY 2013–14)
Normalized decision matrix (FY 2013–14)
In this way, all other calculations are made to formulate the normalized decision matrix for SOP FY 2013–14 (see Table 3).
Proceed further the criteria weights are calculated using the normalized decision matrix and with the help of Eqs (4) and (5). Examples of calculations are given below:
In the similar way, the weights of the other criteria are computed for FY 2013–14. The summary is given in Table 4.
Criteria weights (FY 2013-14)
Using the same steps we compute the criteria weights for all other FYs are calculated. Table 5 provides the summary of the criteria weights from FY 2013–14 to FY 2019–20.
Computed criteria weights (year wise)
Now, we proceed for ranking of the companies using the computational steps of the EDAS method as given by Eqs (6)–(13). Some of the calculations (for FY 2013–14) are demonstrated below (refer to the decision matrix given in Appendix A, Table A1).
Similarly,
Final ranking (FY 2013–14)
Some of the calculations for PDA and NDA for the criteria of maximizing and minimizing effects are given below:
It may be noted that criterion 9 is a non-beneficial (i.e., minimizing effect) one. All PDA and NDA values are recorded in Tables B1 and B2 (see Appendix B). Proceeding further we calculate
Examples of calculation:
According to the values of
Next, we proceed to aggregate the year wise ranking using the Borda Count method. Table 8 provides the aggregated ranking of the companies (derived using the procedural steps of the Borda Count method and yearly ranking results).
Aggregation of year wise ranking (Borda count)
We validate the result of the Borda Count method by aggregating the year wise ranking by Copeland method and compare with the former (see Table 9). We notice that both methods produce same result.
Aggregation of year wise ranking (Copeland method)
Consistency test: Year wise ranking
Table 10 provides the correlation of the aggregated rank with the year wise rankings.
For any MCDM related analysis, the results need to be reliable and stable. The reliability and stability of the results depend on various factors such as the number of the alternatives and criteria and their natures, the varying impact of the criteria on the performance of the alternatives, changing priorities of the criteria, the nature of information and presence of bias and so on [68, 69, 70]. The extant literature shows evidences of using a comparative analysis of the results obtained by using the present method with other MCDM models (e.g., [71, 72, 73]). We compare the our method with other two established MCDM models such as Complex Proportional Assessment (COPRAS) method [74] and Multi-Attributive Border Approximation area Comparison (MABAC) [75]. Table 11 shows that our method is comparable with COPRAS and MABAC. Hence, it may be concluded that our result is reliable.
Comparison of EDAS with COPRAS and MABAC
Comparison of EDAS with COPRAS and MABAC
To check the stability in the result, we carry out the sensitivity analysis by changing the weights of the criteria [76, 77, 78]. We follow the strategy used in the work of [77]. The experimentation is conducted in two stages: a) reduce the weight of the criterion of highest preference by a specified percentage and increase the weights of the other criteria proportionately; b) increase the weight of the criterion of least preference by a specified percentage and reduce the weights of the other criteria proportionately. For instance, for FY 2013–14, we reduce the weight of C9 by 2 percent at every stage and subsequently, increase the weights of the other criteria proportionately. Further, we increase the weight of C7 by 10% at each stage and reduce the weights of the other criteria proportionately. In this way we generate 20 experimental cases (see Table 12).
Sensitivity analysis scheme (for FY 2013–14)
We rank the companies for each such experimental cases. From Fig. 2, it is noticed that despite changes in the criteria weights there is no change in the ranking orders. Hence, the ranking (FY 2013–14) is stable. Likewise, we have carried out the sensitivity analysis for all other financial years and observed stability in the outcome.
Results of the sensitivity analysis.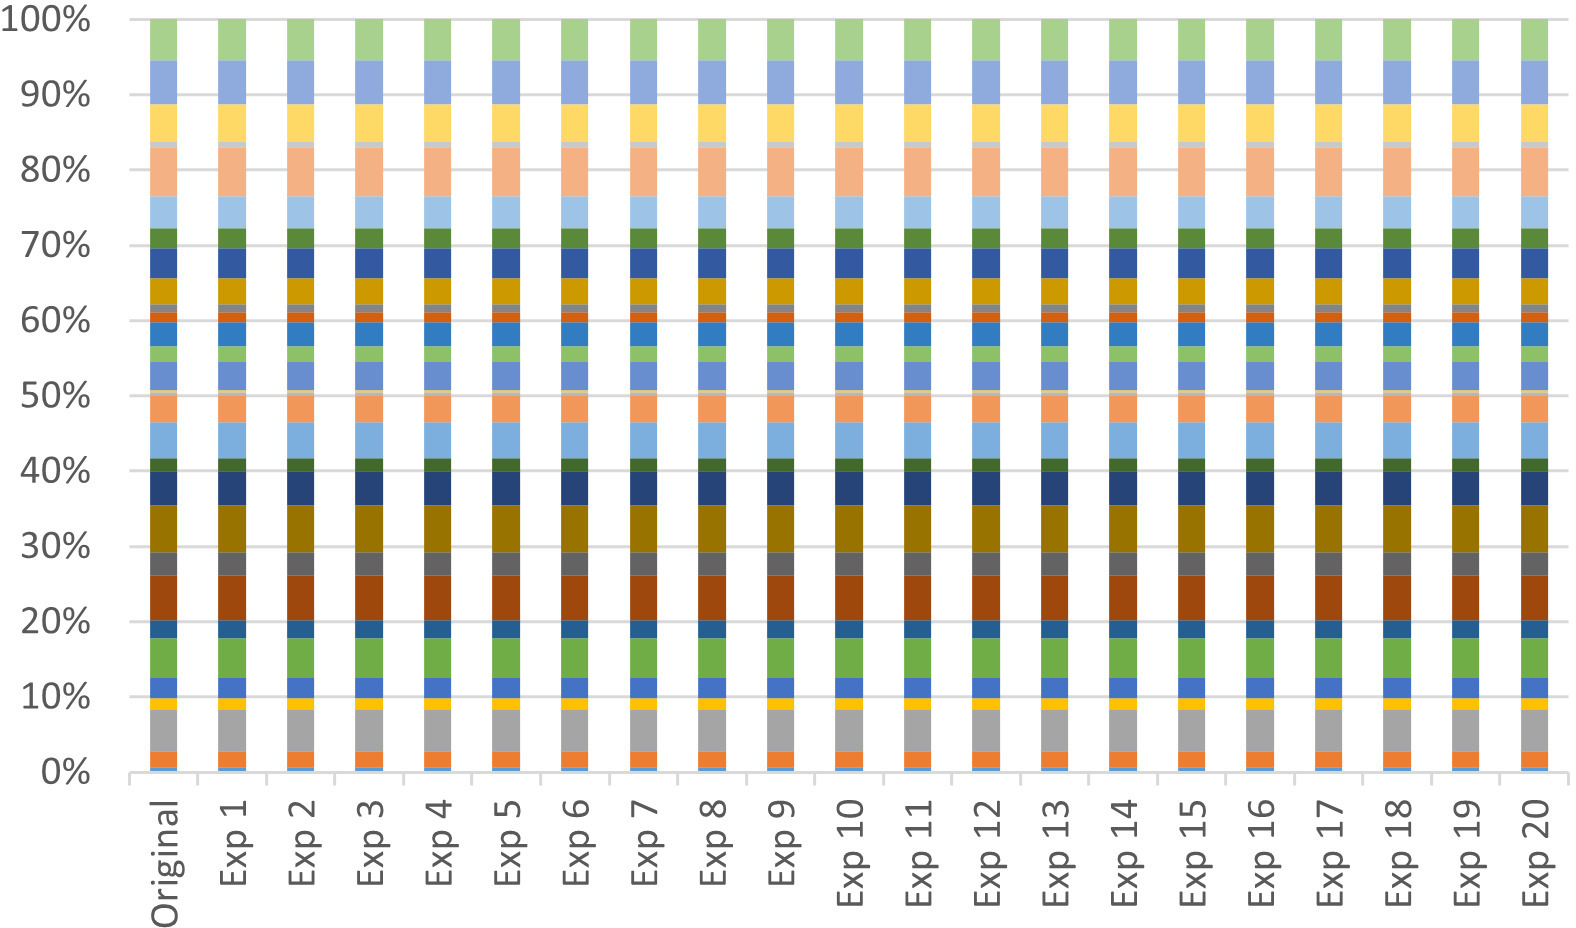
It is seen that A16 (ITC Limited), A15 (Hindustan Unilever Ltd.), A1 (Avanti Feeds Ltd.), A4 (Britannia Industries Ltd.) and A27 (Symphony Ltd.) hold the top five positions on aggregate while A3 (Bombay Burmah Trdg. Corpn. Ltd.), A8 (E I D-Parry (India) Ltd.), A29 (Voltas Ltd.), A10 (Future Consumer Ltd.) and A6 (Colgate-Palmolive (India) Ltd.) remain in the bottom five group. For both top and bottom brackets, FMCG companies dominate the list. Further, for the top bracket, we see that the top two positions are occupied the companies having higher market capitalizations (refer to the Table C1, Appendix C). However, from the data analysis, it is evident that there is a variations in the year wise ranking of the companies.
It is evident that all individual year wise rankings maintain statistically significant correlations with the aggregated ranking. However, FY 2018–19 and 2016–17 show lesser correlations. During FY 2016–17 on 8
From the technical point of view, it is seen that the results obtained by using LOPCOW and EDAS models are reliable (as they are comparable with other models) and stable. However, the models have some limitations. For example, the LOPCOW model does not have any inherent consistency check mechanism. The developers’ version was made on objective information. But, for multi-perspective and/or multi-opinion studies consistency stands as an issue. There is a MCDM model known as Full Consistency Method (FUCOM) which might be used in conjunction with LOPCOW to resolve the issue. One of the drawbacks of the EDAS model is its mechanism to calculate PDA and NDA. There may be some cases when PDA or NDA values for the specific alternative(s) may come out as zeros.
Conclusion and future scope
The present work has aimed to develop a multi-criteria based performance evaluation framework to compare the SOP of organizations. To this end, the current work has presented a case study of 25 FMCG and five CD firms in India. The criteria for comparison have been selected based on review of the theoretical related paper. The present paper is a first of its kind that attempts to derive an objective score for assessing SOP. There is a scantiness in the extant literature about well-defined indicators to measure SOP. The current work fills the gap in the literature by developing a hybrid LOPCOW-EDAS model for a novel application in assessing SOP. LOPCOW is able to provide reliable result even under the presence of negative values in the decision matrix. In addition, the LOPCOW model utilizes a fundamental statistical approach to adjust the dispersed performance values of the alternatives (under the effect of the criteria) by considering the standard deviations. The use of logarithmic function further helps to bring in a reliable distribution of the criteria weights. EDAS is able to produce stable and reliable outcome even with substantial variations in the values of the elements of the decision matrix, free from rank reversal phenomenon and able to work with a large number of alternatives and criteria. The criteria are selected based on three objectives such as effectiveness, efficiency and risk. Accordingly, nine criteria such as sales growth, return on assets, return on working capital, operating profit margin, asset turnover ratio, net cash flow from operating activities, cash to current liability, net working capital days and leverage have been considered to comparing the firms. It is seen that A16 (ITC Limited), A15 (Hindustan Unilever Ltd.), A1 (Avanti Feeds Ltd.), A4 (Britannia Industries Ltd.) and A27 (Symphony Ltd.) hold the top five positions on aggregate while A3 (Bombay Burmah Trdg. Corpn. Ltd.), A8 (E I D-Parry (India) Ltd.), A29 (Voltas Ltd.), A10 (Future Consumer Ltd.) and A6 (Colgate-Palmolive (India) Ltd.) remain in the bottom five group. From the data analysis, it is also evident that there is a variations in the year wise ranking of the companies. However, all individual year wise rankings maintain statistically significant correlations with the aggregated ranking.
There are a number of future scopes. For example, the present work considers only a handful companies of homogeneous nature. A further work may consider many organizations from diverse sectors. Secondly, the criteria set may be augmented with a number of operational (execution related) indicators such as fill rate, time to deliver etc. Third, the current work considers only objective information. A future study may take into account users’ and/or experts’ opinions. Fourth, from the methodological point of view, we plan to extend the model with the application of fuzzy and rough numbers.
Nevertheless, we do believe that the present work is a first of its kind that would encourage the analysts and the policy makers to evaluate the sales and operational performance using a scientific way. Further, the current work shall excite the readers to utilize our model for solving various real-life issues.
Authors contributions
Conceptualization: SB, DP, GB, AS.
Data collection and formatting: AS.
Formal analysis: SB.
Validation: SB, GB, DP.
Writing original draft. SB, AS;
Review and editing the final draft: DP, GB.
Supervision: GB.
Declaration
The authors state that this is an original and unpublished version which has not submitted elsewhere. Further, the authors declare no conflict of interest to anyone. This work has not received any fund.
Supplementary data
The supplementary files are available to download from https://dx-doi-org.web.bisu.edu.cn/10.3233/KES-221601.
Footnotes
Acknowledgments
The authors are sincerely grateful to all anonymous reviewers whose valuable comments have helped to improve the quality of the paper.