
Abstract
Dengue is one of the most dangerous vector-borne infectious diseases in the world which are fatal in many cases due to inefficient treatment. Although the relative risk estimations of dengue transmission are available for Bandung, one of the most populous cities in Indonesia, dengue cases especially among young people have increased rapidly. However, the age factor has not yet been included in these estimations. Because specific treatment and prevention depend on age, this factor must be considered in any dengue transmission model. In this article, the authors classify dengue cases in Bandung into juveniles and adults. Each group is analyzed by SIR-SI model to estimate the relative risk of dengue transmission as an indirect transmission disease which takes into account the stochastic factor. This model also considers a spatial correlation which affects dengue distribution in a specific area for a particular age group. The results of the analysis show that some areas in Bandung have medium to very high dengue risk, especially for the juvenile group. It is expected that The Health Department of Bandung will focus dengue transmission prevention programs more intensively on this group. In further research, if the data needed are available, this model can be applied to other cities in Indonesia.
Introduction
Dengue is a mosquito-borne infectious disease that is dangerous and can cause many losses, i.e. direct or indirect economic losses, and even more loss of life if it is not treated immediately. The disease transmits through the bite of Aedes mosquitoes, namely Aedes Aegypti and Aedes Albopictus. The disease is difficult to be eradicated because it is influenced by many factors, such as unhealthy lifestyle of the society, for example: littering, keeping empty containers or cans in an open place that forms the habitat for the mosquitoes; and environment factors, i.e. climate and rainfall especially in the tropical country. Other factors that accelerate the spread of this disease are population density and high rates of urbanization in an area (Pongsumpun, Patanarapelert, Sriprom, Varamit & Tang, 2004; WHO, 2012; Fong, 2013).
A medicine to cure this disease has not been found (WHO, 2012). Therefore, it is necessary to have strategic steps to prevent this disease from spreading. By understanding the transmission process, a mathematical and statistical model can be developed to estimate the transmission relative risk as one of the prevention strategies (Ma & Li, 2009; Fong, 2013).
In Indonesia, the number of dengue cases continues to increase every year (Widiyani, 2013). Nathan, Dayal-Drager, Guzman et al. (2009) mentioned that 150,000 cases in Indonesia were reported in 2007, the highest on record, with over 25,000 cases reported from both Jakarta and West Java. According to the Health Department of Indonesia, the total number of this disease in 2012 reported to WHO was 90,245 cases. This number increased to 112,511 cases in 2013. Bandung Health Department recorded that the number of dengue cases increased from year to year. Their data showed that in 2011, the total number of the cases was 3911; in 2012, it increased to 5107 and raised again until 5749 cases in 2013.
More specific, Fig. 1 depicts dengue case of juvenile and adult in Bandung. The juvenile group here covers patients in age domain from zero until 15 years old; while the adult group covers age domain 16 years old until the oldest dengue patient. It informs that the juvenile cases increased significantly from 2011 to 2013. This condition might cause students to skip school and therefore, it might have affected the educational attainment.
The high-low risk areas map is usually beneficial to observe the transmission of particular disease in certain critical areas. In addition, this map is also important to anticipate disease transmission in the future. In order to depict the high-low risk areas, The Health Department usually uses the total number of dengue occurrences across the regions. Thus, it has been common to conclude that, without considering the population or the land size, the number of dengue cases in particular areas reflects the level of the risk, i.e., the higher number of the case means the higher risk is; or, conversely the less the number of the case means the less the risk is.
Problem statement
A better depiction of high-low risk areas can be obtained by considering the relative risk to be mapped in term of disease mapping. In order to obtain a better risk map, the high-low risk areas are estimated and predicted using a better relative risk estimation method. This method is not only useful to be applied in Bandung, but also in all areas in Indonesia in particular. It is also expected that it can be applied in other countries as well.
The relative risk should be considered to be mapped in term of disease mapping, because it is taken to measure the excess risk found in relation to that supported purely by the local population, ‘at risk’ (Lawson, 2006). Relative risk is the ratio of the exposed group that will develop a disease to the unexposed group that will develop the same disease. In brief, relative risk is usually used to compare the risks of different groups.
The existing disease mapping from previous researches in Bandung only analyses the deterministic model using the available observed dengue data (Supriatna, Soewono & Gils, 2008; Supriatna, 2009; Kristiani, Samat & Ghani, 2015). In real condition, the random effects which are not taken into account in the deterministic model cannot be neglected. Some researches indicate that the stochastic models are more realistic than the deterministic ones (Bartlett, 1964; Daley & Gani, 1999; Wakefield & Morris, 2001; Wakefield, 2007), therefore the stochastic factor needs to be addressed as well. Recently, there have been some studies on the observed data in Bandung, in which the stochastic factor has been taken into account (Kristiani, Samat & bin Ab Ghani, 2016; Kristiani, Yong & Irawan, 2016).
Moreover, from Fig. 1, it observed that the number of dengue cases from juvenile group is large. Therefore, in this study, it is important to consider the age factor in disease mapping modelling since the age factor is one of factors which influence dengue transmission (Pongsumpun & Tang, 2003; Lawson, 2006; Lawson & Williams, 2008 and Supriatna, 2009). The age factor is related not only to survival capability against a particular disease, but also to certain prevention and treatment of disease transmission. In Nathan, Dayal-Drager & Guzman (2009), it is also mentioned that the greatest burden of dengue in most countries is in children, although in some areas older age groups are also significantly affected. However, this factor does not relate to specific treatment of this disease.
The number of dengue cases for each age group for all districts in Indonesia cannot be determined precisely due to data unavailability. However, detailed dengue cases by age group for Bandung, West Java, Indonesia are available and ready to be used in this study.
Juvenile and adult dengue cases in Bandung, 2011–2013. Compartmental model for Juvenile or adult structured.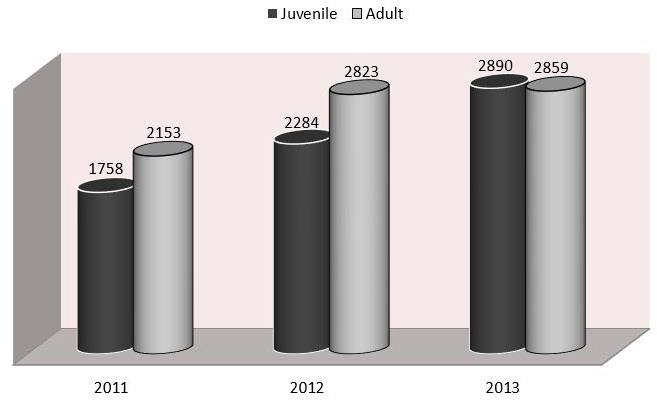

The main aim of this research is to estimate the relative risk of dengue disease transmission in Bandung, West Java, Indonesia which considers the age-factor. To accommodate that purpose, the discrete space time stochastic SIR-SI model initiated by Samat & Percy (2012) is used as the initial model. This model is better to be applied in the same disease mapping than the common models such as SMR or Poisson-gamma; since it considers not only the disease transmission process but also the covariates and spatial correlation between risks in neighboring areas. In the stochastic process, it involves non-constant parameters which can be treated as random variables. To accommodate this condition, Bayesian approach is applied because it allows to treat the parameters as random variables (Bolstad, 2004).
The model applied in this paper that is stochastic SIR-SI which considers the age factor is explained briefly and the data used parameter estimation in the model are discussed. Furthermore, the relative risks estimated by the model are displayed and the analysis of the high-low risk maps of regions in Bandung are discussed. The last part of this study summarizes the material and recommends the further research.
An indirect disease transmission compartment model used was initiated by Esteva & Vargas (1998) and Nishiura (2006). However, this model only accommodates the deterministic assumption; while, on the other hand, it has been explained previously that stochastic approach to estimate the relative risk of dengue transmission will make it more representative of real life (Bartlett, 1964; Daley & Gani, 1999; Wakefield & Morris, 2001; Wakefield, 2007). Therefore, this model was developed into a stochastic model by Samat & Percy (2012). They improved the model by completing the study regions (
In this study, the posterior distribution of the mean number of infected humans is firstly identified. The next step is using this information to find the posterior mean of the relative risk. In this process, the model from Samat & Percy (2012) is implemented to humans with age classification. This model is implemented to model the juvenile compartment, and the adult compartment as well. The compartmental model can be seen in Fig. 2. Using the same method to obtain the detailed estimation, the study area to be mapped primarily is divided into
Some notations from previous compartmental model are customized to meet the needs of this research. Some notations that are used in this research, related to Fig. 2 are symbol
For discrete time interval, the SIR-SI deterministic model for dengue disease transmission in susceptible human population shown in Fig. 2, can be written mathematically as a system of difference equations as follows:
Furthermore, the models for infective and recovered human population are derived as follows:
Similarly, the models for susceptible and infected mosquitoes population can be seen as follows:
Some studies that apply SIR-SI compartmental model usually assume human life and mortality probability constant in each compartment (Esteva & Vargas, 1998). It was so because of data unavailability. In reality, it cannot be implemented. Therefore, in this research, the life and mortality probability will be distinguished based on particular life table of Indonesia. This probability can be used as well to assume the number of susceptible people in a particular district in Bandung.
Further, the difference equations described above are used as a basis for modelling the discrete time, discrete space, stochastic SIR-SI initiated by Samat & Percy (2012). The purpose of this model is to find the posterior mean for the number of new infective dengue cases each week in each age group.
To anticipate the number of new infection cases in a certain age group in the time period
From the deterministic model of
The Poisson distribution is implemented in this modelling for the new infection on humans since it satisfies the characteristic of count data. It includes a simple mechanistic model for infection transmission as well as a linear predictor term which can include covariates or random effects (
In Eq. 8, some additional variables are included. They are
In this study, the Conditional Auto-regressive (CAR) model is applied to the
Bernardinelli et al. (1995) explained that the expectation of the structured variation of a prior distribution
The Bayesian proportionality elaborated in Lawson (2013) with the related parameters which are used in this study is accommodated. Thus, it can be written as below,
with the parameter interest is random effect
To further estimate the relative risk, the steps, adapted from Samat & Percy (2012) are elaborated. Generally, for
Next step is to define the relative risk parameter
The symbol
Thus, the posterior expected relative risk can be approached using an unbiased sample mean,
with
where
Equation 13 can be described that the posterior expected relative risk is counted by dividing the posterior expected mean number of infected populations,
Consequently, the relative risk in Eq. 13 can be estimated using Eq. 14 as below,
This formulation is finally implemented for estimating the relative risk for dengue disease mapping in Bandung area.
Time series of RR estimations for Juvenile group under assumption (a) A(1) with same, (b) A(1) with different, (c) A(2) with same, and (d) A(2) with different, birth and death probability. Time series of RR estimations for adult group under assumption (a) A(1) with same, (b) A(1) with different, (c) A(2) with same, and (d) A(2) with different, birth and death probability.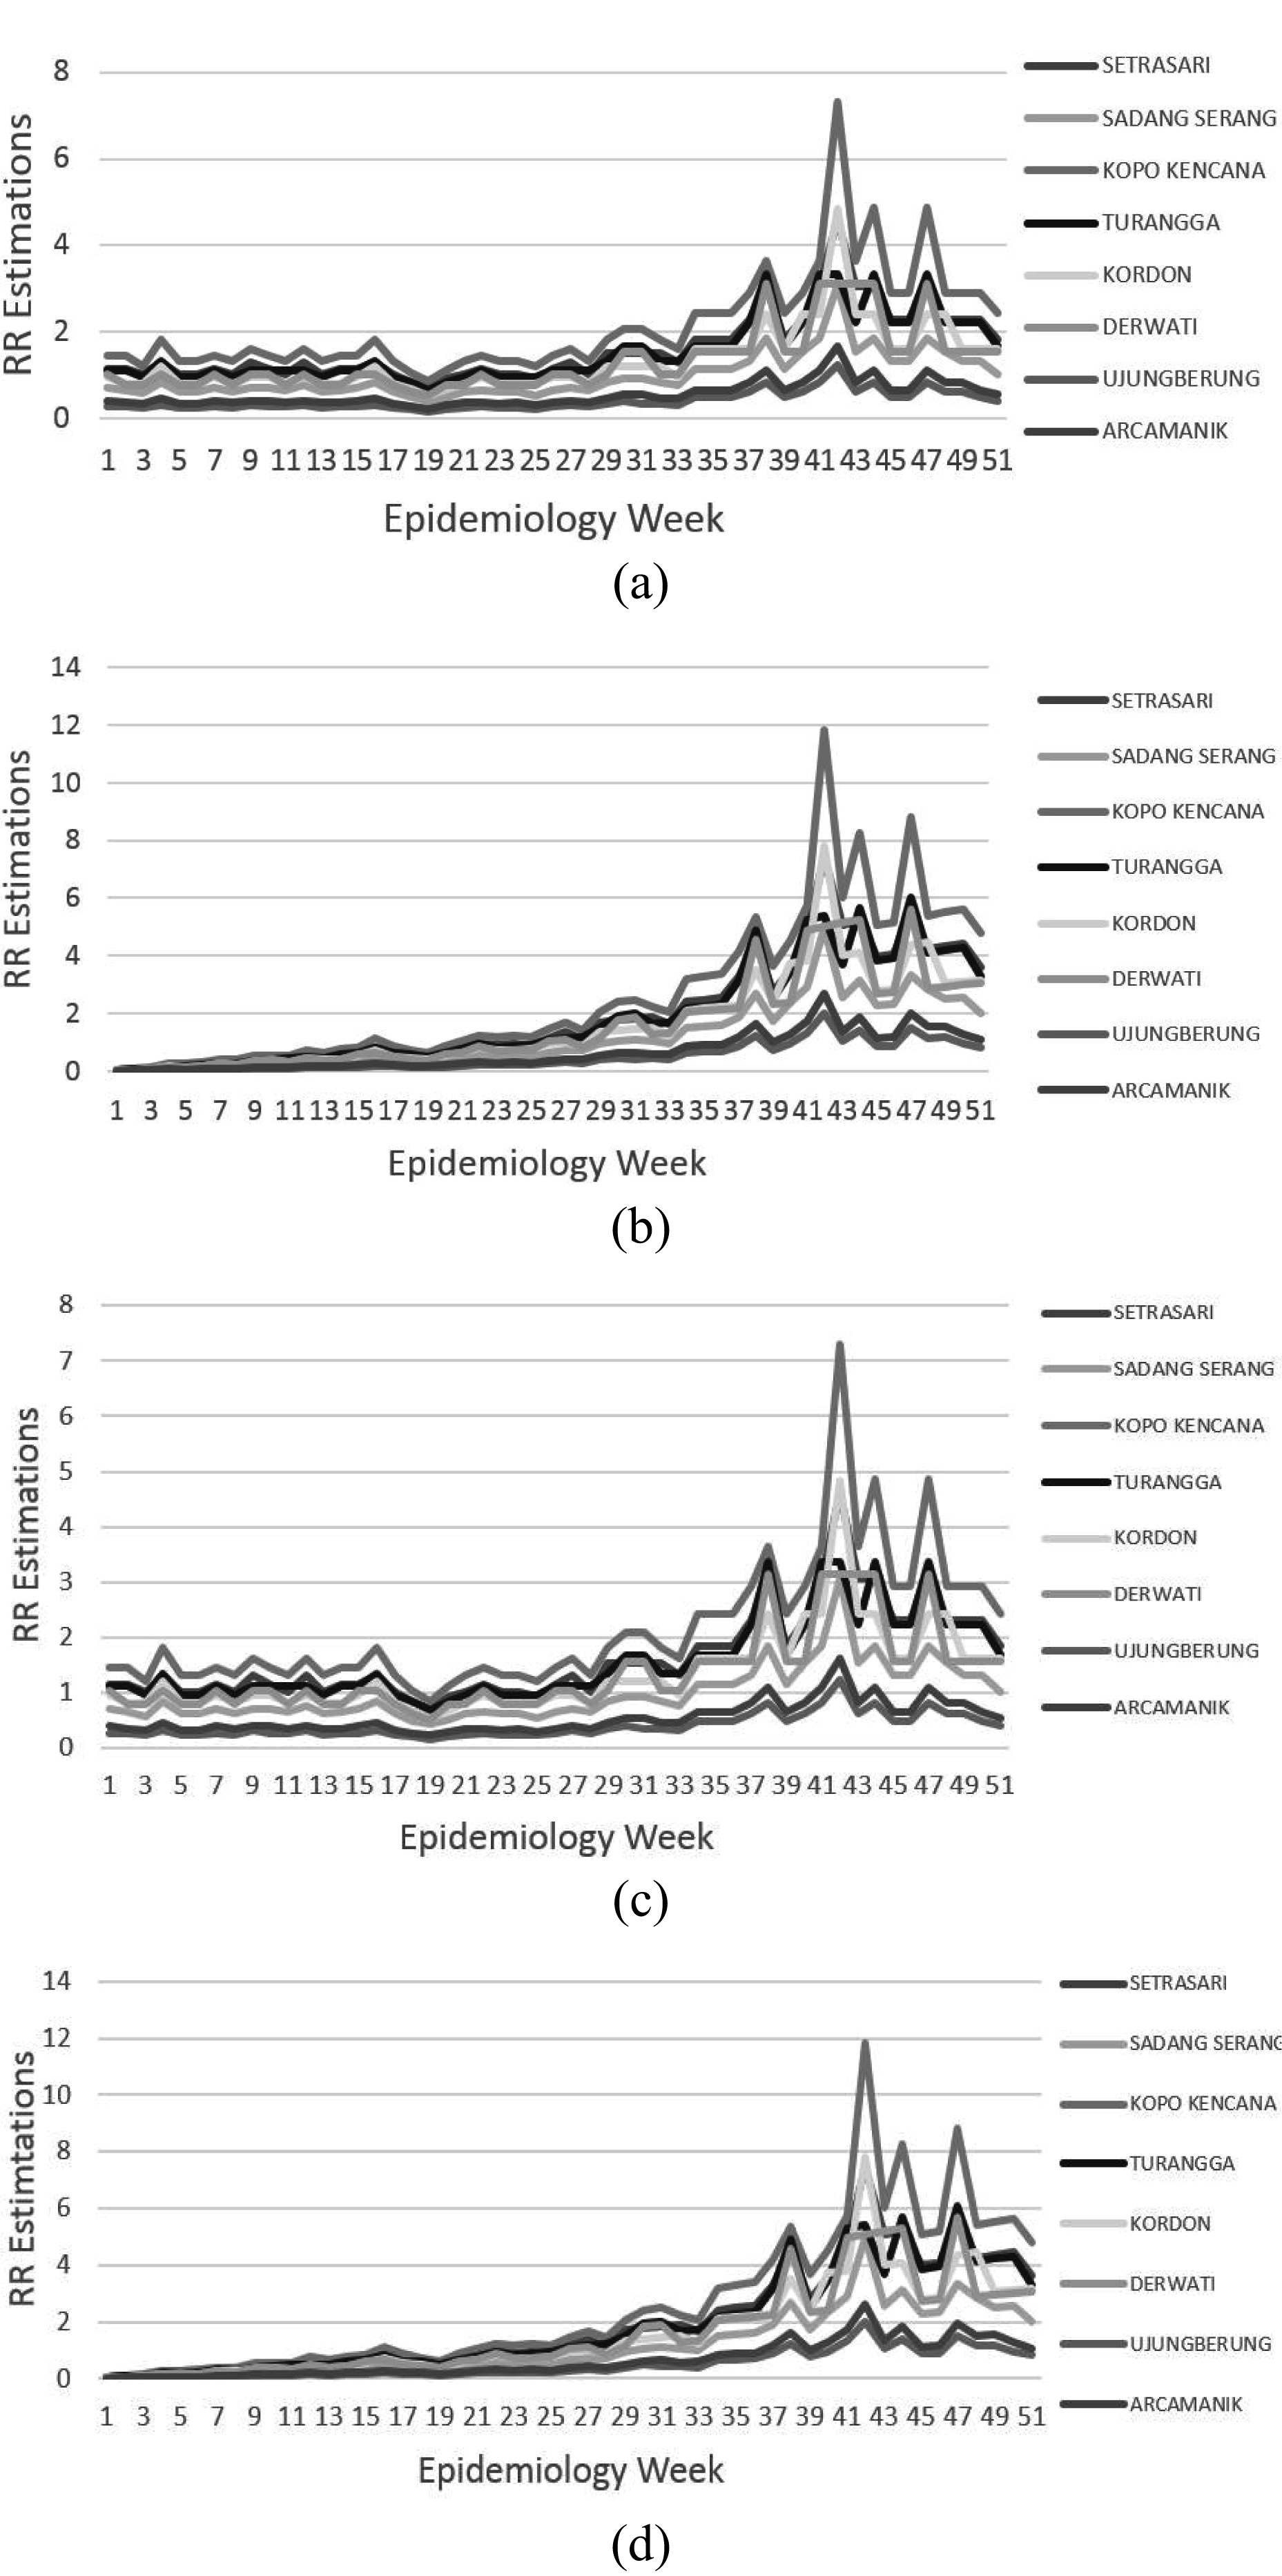

The data set and parameter estimation
The dengue data obtained from some hospitals in Bandung and used for this research were data in year 2013. Since the incubation period of dengue is 4 until 8 days, it is, therefore, important to collect the weekly data of dengue cases for a more detailed observation which is beneficial for obtaining better relative risk estimations. Since the data of the severity level of dengue, i.e. Dengue Fever (DF), Dengue Hemorrhagic Fever (DHF) and Dengue Shock Syndrome (DSS) are not separately documented in some hospitals, dengue data which are used here, include DF, DHF and DSS data. All of those data are classified as dengue disease cases.
It must be noted further that the region of Bandung municipality has two city Service Centers and each center manages four Sub-Centers; in total there are eight Service Sub-Centers, i.e., Arcamanik, Derwati, Kopo Kencana, Kordon, Sadang Serang, Setrasari, Turangga and Ujungberung. The division is intended to increase the quality of some service aspects, such as education, health, administration, etc. If this division area is used in estimating the relative risks in dengue transmission, it is also effective in preventive action and treatment as well, since it will help a particular Service Center to focus on related risky a particular Service Center to focus on related risky sub-centers (Bandung, 2008).
For juvenile case, it is obtained that Kopo Kencana region had the highest dengue cases, i.e. 755 cases in year 2013. Meanwhile, for adult case, there were 848 cases obtained in Sadang Serang region.
In estimating the relative risks, it is important to determine the values for some parameters included in the formulation. Some parameter values can be determined as per the condition in Indonesia or Bandung; however, some values cannot. In this study, the unavailable values refer to those values which were implemented in previous researches.
The values for
Apart from above, information about data of mosquito population is needed. Until now, according to the interview with Bandung Health Department, the data of mosquito population in Bandung are not available. Therefore, in this study, the data refers to the information of previous researches in Malaysia (Ahmad, Ismail, Saat & Han Lim, 1997; Samat & Percy, 2012).
Samat & Percy (2012) conducted five assumptions to estimate the number of infected mosquitoes in Malaysia. This study only adapted Assumptions 1 and 5 of them, since these assumptions are the best two methods according to the DIC goodness of fit test.
In their study, they conducted the proportion between newly infected mosquitoes and susceptible human in every region is constant in every week. The formulation is modified to be more suited for the purpose in this study and it can be written as follows,
with
The second assumption was elaborated in Samat & Percy (2012), known as Assumption 5 in their study. It is based on the assumption that there is a positive correlation between the numbers of infective mosquitoes and the number of new infective humans. Therefore, ratio between the infective mosquitoes and infective humans is constant and follow this condition,
The same method is applied in this study and defined as A(2) in this paper. The approximation is finally applied to estimate the population of mosquitoes in Bandung.
The relative risks are estimated by implementing Eq. 15. In the calculation process of estimation, supporting data about the number of mosquitoes are needed. Since these data are not available in Bandung case, A(1) and A(2) assumptions explained in Eqs 16 and 17 are applied to support the relative risk estimations process. The calculation of Bayesian inference is run on WinBUGS software that is useful to make inference using Gibbs Sampling method in 10,000 iterations in each estimation process for each model.
Figures 3(a)–(d) and 4(a)–(d) display the time series relative risks estimated by Eq. 15. From these weekly time series, it can be observed that generally dengue disease is estimated to have higher risk to spread in the period approaching the year-end, around the 35
To identify a better model, the result of each model is compared using Deviance Information Criterion (DIC) diagnostic as suggested by Spiegelhalter et al. (2002). This method tool is intended to compare the Bayesian models using the criterion of deviance information which takes into account the goodness of fit and the complexity of the model. In this study, the DIC for each model calculated by WinBUGS software is displayed in Table 1. The model with smaller DIC is better because it means that it satisfies the data better.
The DIC comparison
The DIC comparison
Juvenile relative risk estimation
Legend for estimated relative risk of dengue disease mapping.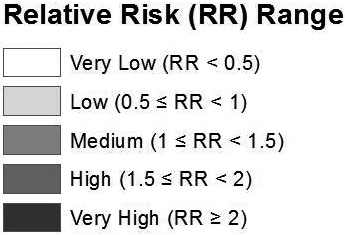
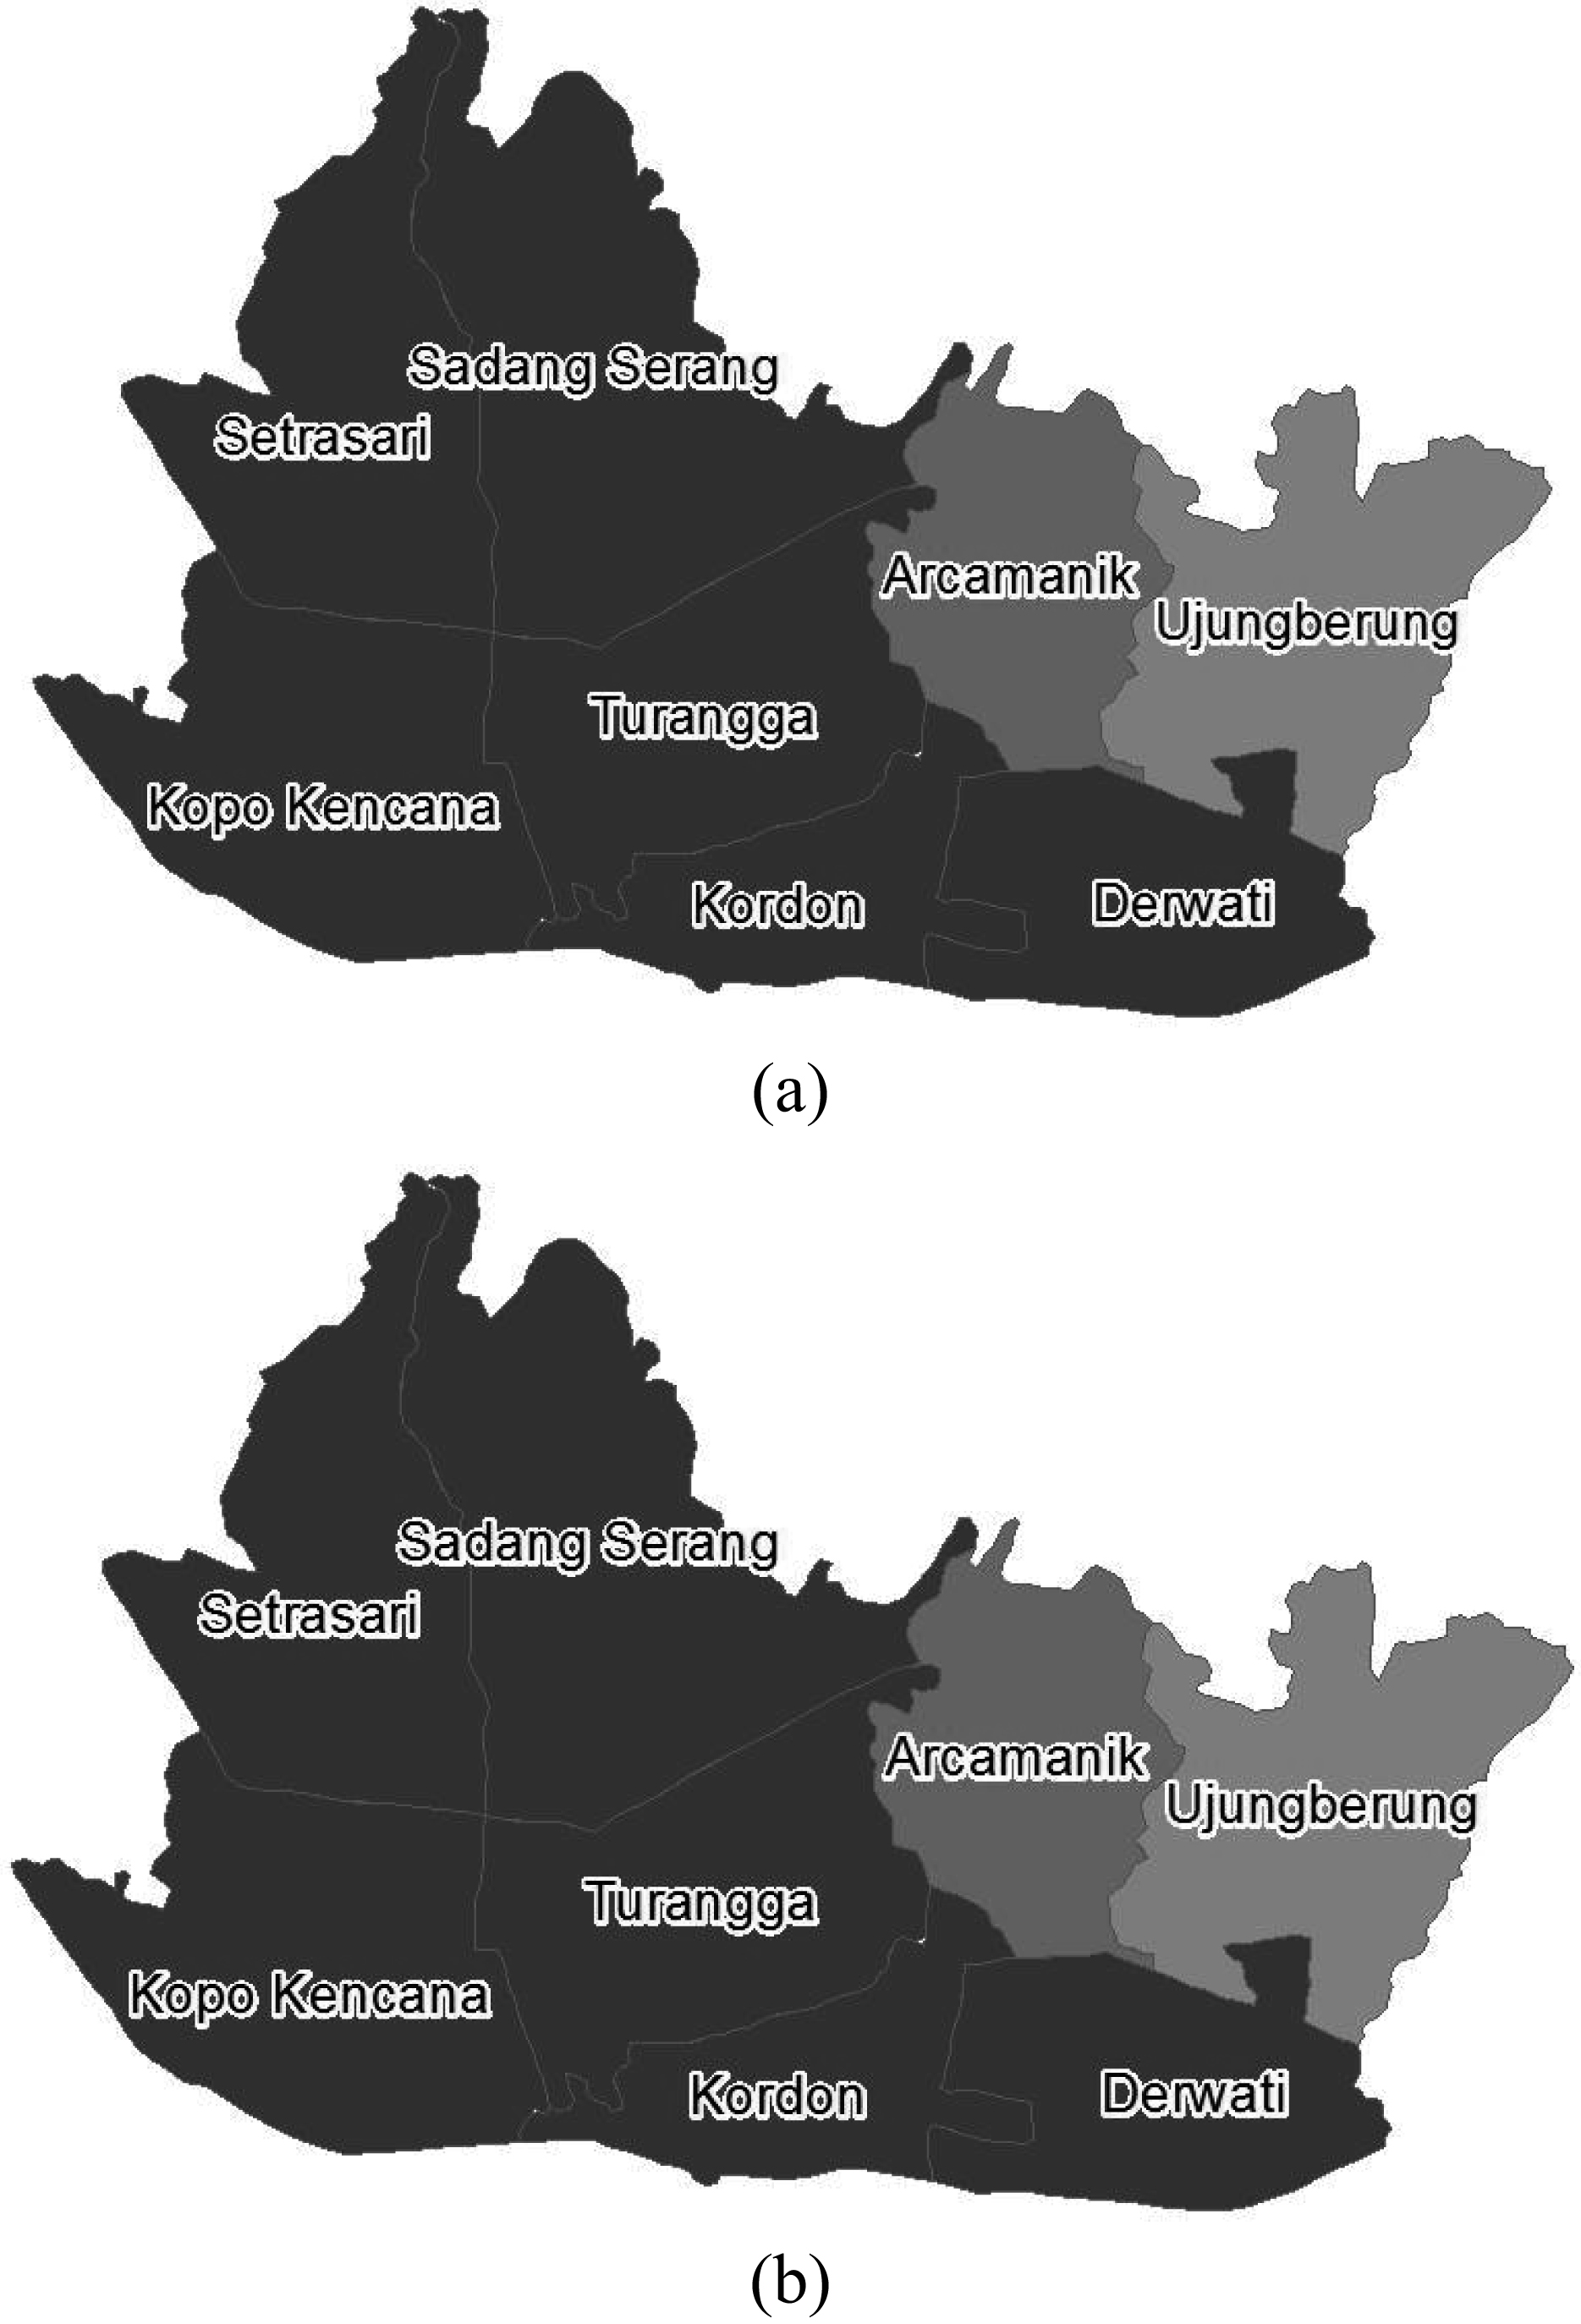
SIR-SI dengue disease mapping for Juvenile using the same life and death probability in Bandung, 2013 based on assumption (a) A(1), (b) A(2). SIR-SI dengue disease mapping for Juvenile using the different life and death probability in Bandung, 2013 based on assumption (a) A(1), (b) A(2).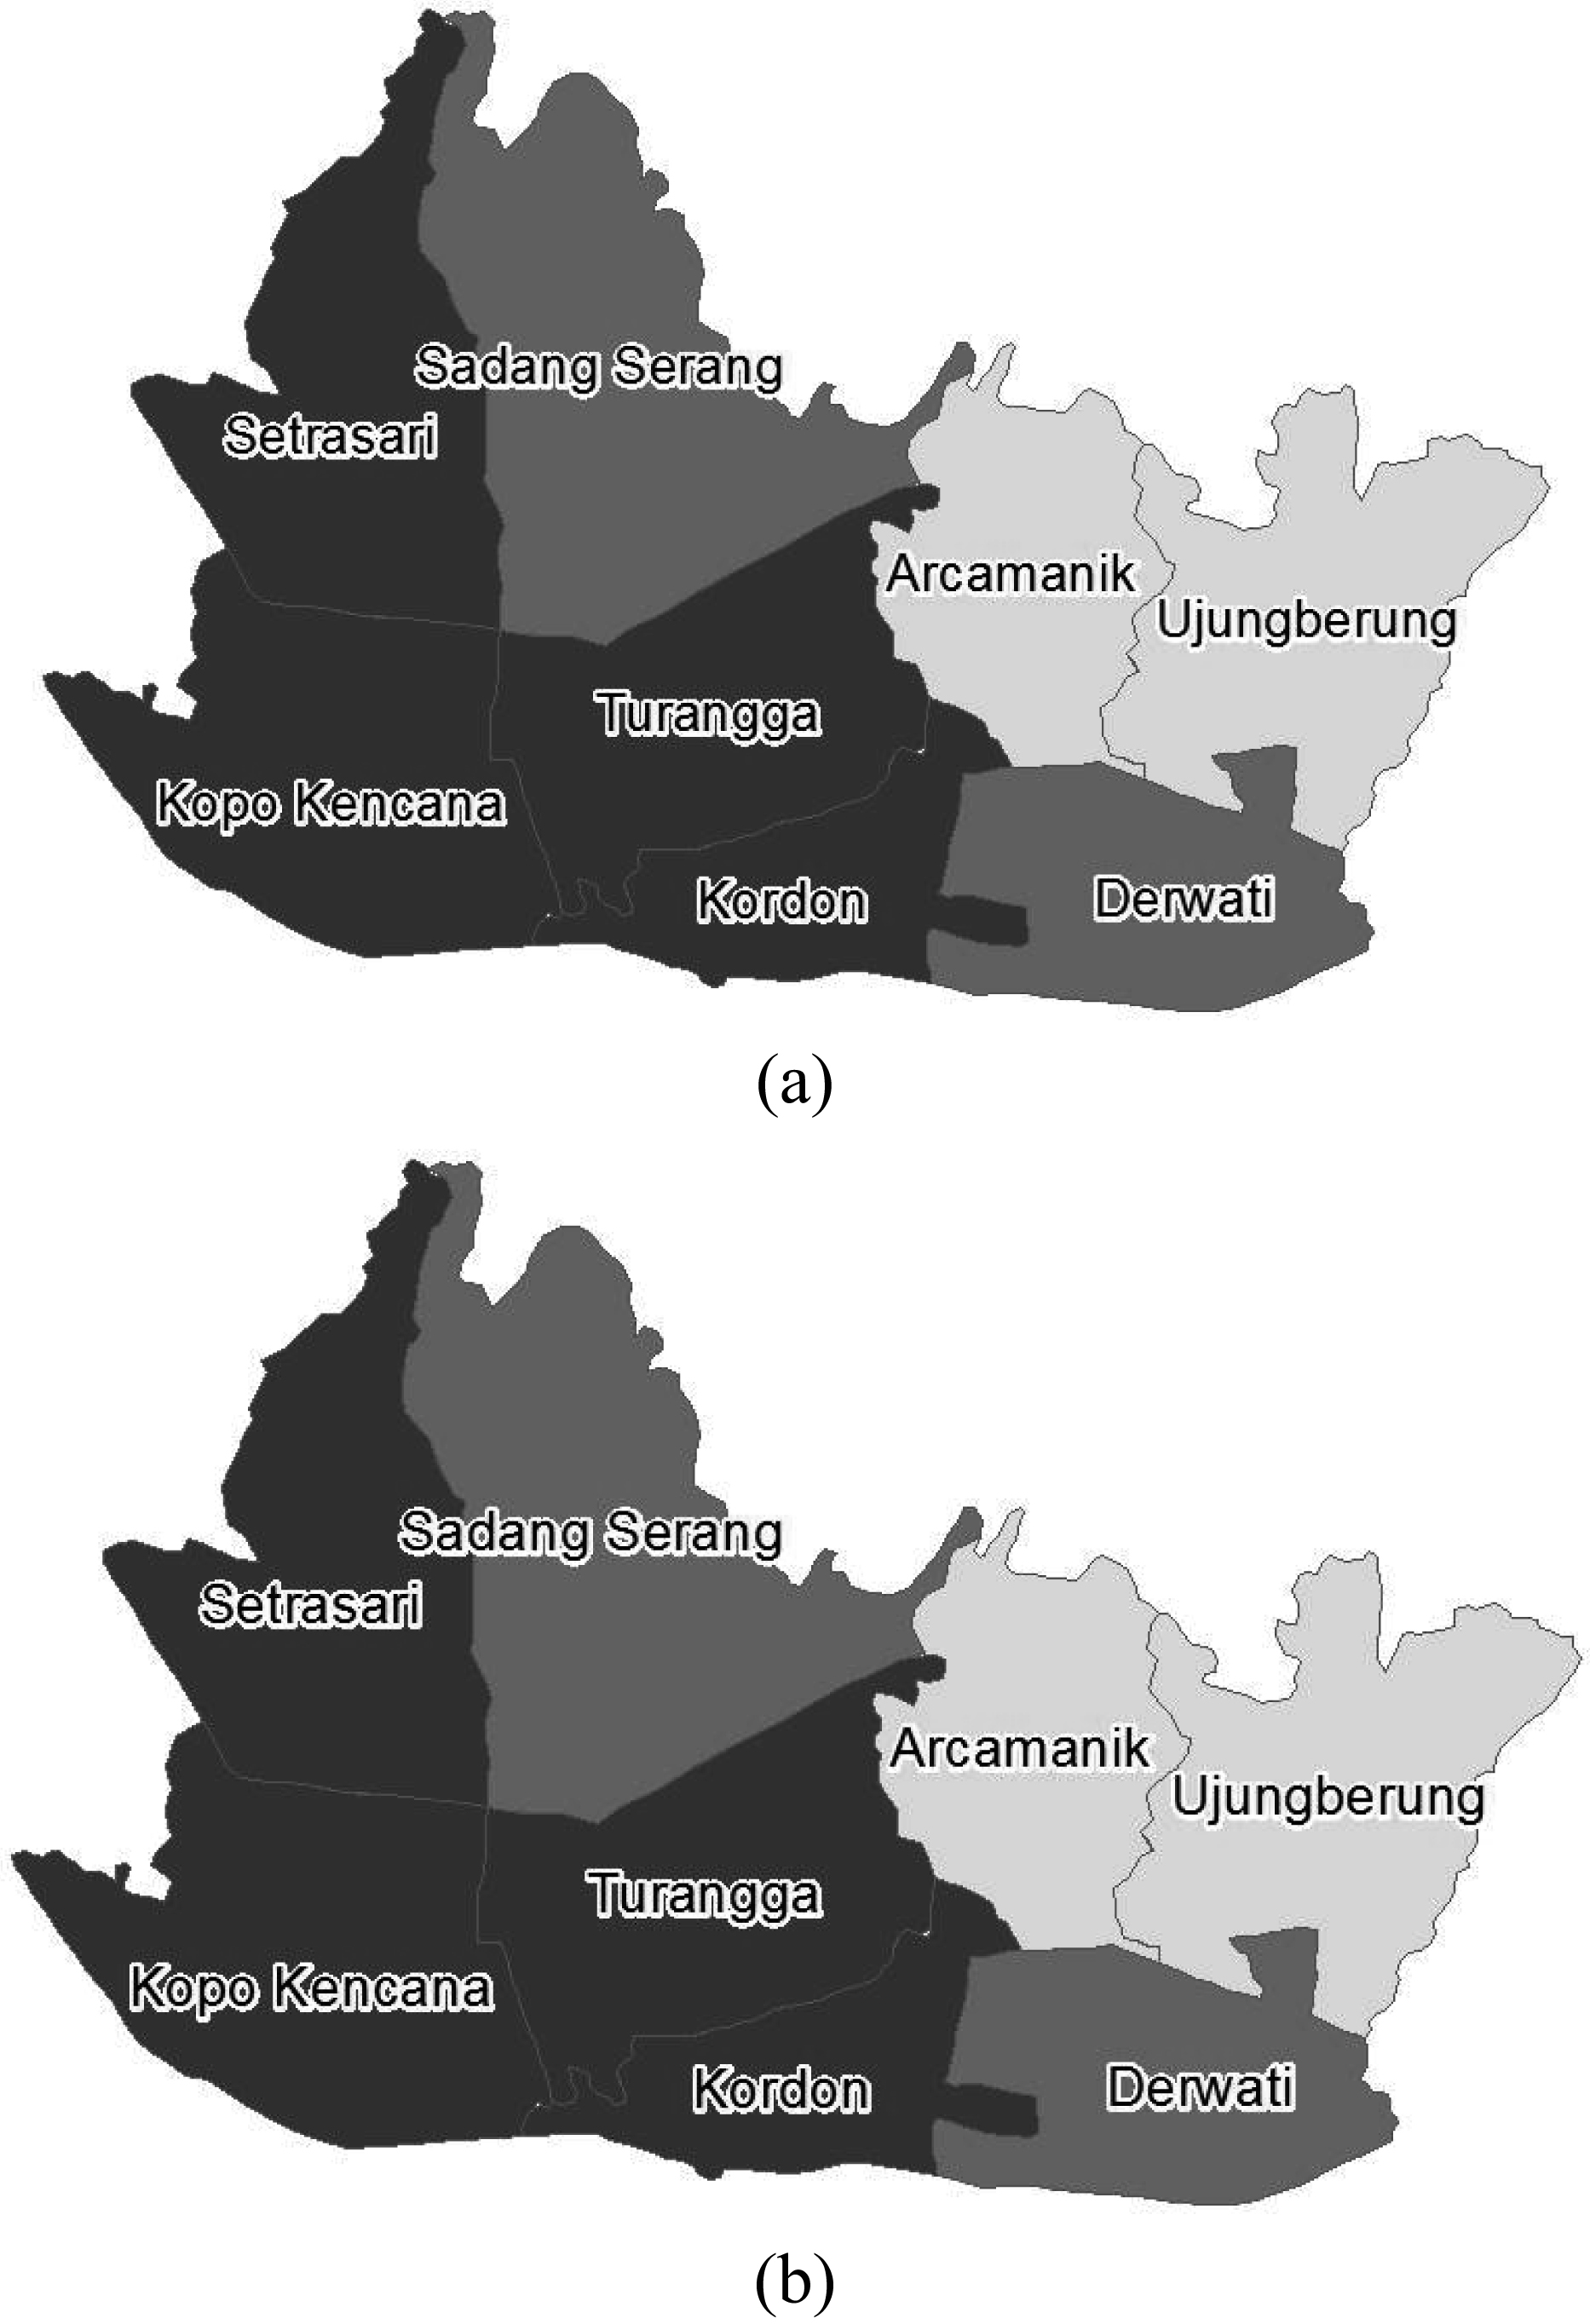
From the DIC displayed in Table 1, it is obtained that model A(2) which assumes that there is a positive correlation between the number of infective mosquitoes and the number of new infective humans with the the same birth and death probability is the best fitted model for both juvenile and adult. This fact suits the fact elaborated in Samat & Percy (2012). Similarly, when the model applies the different life and death probability, for both of the age groups as well, it shows that model A(2) is better than model A(1).
For further analysis, in connection with the characteristic of the SIR-SI model that considers the spatial correlation, it is naturally accepted that the model generally fits the juvenile group data better because usually children do not go too far from their homes. The fact that juveniles like to gather with friends in their neighboring areas becomes the cause that makes the virus easier to spread from one person to another person through mosquito’s bites within the areas (Pongsumpun & Tiensuwan, 2013). It means that the transmission on juvenile group is affected by neighboring areas. Different condition happens to the transmission on adult group; since they are usually more mobile, the transmission on adult group is not affected by neighboring areas.
The next analysis focuses on weekly relative risk estimation. Ideally, every weekly estimations for each age group should be analysed for better anticipation, i.e. the policy makers can pay more attention on particular risky areas. However, in this study, the highest rainfall week in Bandung in year 2013, that is at week 50 or around the second week of December, based on data from National Institute of Aeronautics and Space in Indonesia is chosen for demonstration purposes only. Different weeks chosen might give different appearance on maps.
Because the model fits to the juvenile data better than the adult data, the next analysis finally concentrates on the relative risk estimated in this group. Table 2 displays the relative risk estimations of each region obtained by SIR-SI model in week 50. There are five categories that represent the risk level of each region; those are very low (VL), low (L), medium (M), high (H) and very high (VH) levels. Each of those levels relates to the intervals of [0, 0.5), [0.5, 1), [1, 1.5), [1.5, 2), [2,
The risk level of each region refers to the level displayed in Fig. 5. To have a clearer picture of the risk estimation levels in the regions, the map in the Figs 6 and 7 depict the high-low risk regions in eight Service Sub-Centers.
Figures 6 and 7 are intended to show the purpose of the high-low risk areas mapping to depict the level of risk in each area. The mapping can be applied not only to particular weeks, but also to all weeks.
Although the Maps 7a) and 7b) are the same, however according to the DIC in Table 1, Map 6(b) is the best since the model has the smallest DIC. From this map, it is obtained an estimation that all regions are in low to very high risk. For six regions other than Arcamanik and Ujungberung, that are convincingly estimated to have high to very high risks, the preventive actions that can be done are: to eradicate the Aedes mosquitoes that cause the disease, keep the potential habitats of Aedes clean and dry, and maintain body stamina to prevent from being infected by the disease. To check the accuracy of the estimation, data of dengue cases data in the following year are required. Unfortunately, for this research, due to some limitations, the data required have not been able to be collected yet.
The influence of rainfall can be considered as well, as conducted by Samat & Percy (2012) in their research. It can be applied in the next research once the weekly rainfall data are obtained. If data of mosquito population in a local area are available, it is expected that a better estimation can be obtained.
There are many factors which influence the transmission of dengue disease, for instance, unhealthy lifestyle of the society and the environment factors. It needs the strategic steps to prevent the transmission of this disease. One of the strategies is by statistically modeling the transmission process to estimate the transmission relative risk. In order to obtain a more realistic model, it is necessary to take the random effect into account. Therefore, the stochastic model is applied in this case.
Considering the fact that there are a lot of dengue cases on juvenile group in Bandung, Indonesia and the fact that the preventive actions will be more effective by taking the age factor into consideration, hence, relative risk estimations in this case are expected to provide a better solution to prevent dengue transmission in the risky areas. The relative risks are estimated by the discrete space and time, stochastic SIR-SI which considers age factor.
Compared to the common models such as SMR and Poisson-gamma, the stochastic model is better to be applied in dengue disease case since it considers not only the disease transmission process but also the covariates and spatial correlation between risks in neighboring areas. The stochastic process involves the non-constant parameters which can be treated as random variables. To accommodate this condition, Bayesian approach is applied because it allows to treat the parameters as random variables.
From the DIC obtained, it can be concluded that juvenile models fit the data better compared to adult models. It means that the transmission on juvenile group is affected by neighboring areas. Different condition happens to the transmission on adults who are usually more mobile. Therefore, the transmission on adult group is not affected by neighboring areas.
For further research, it is sugested to consider the rainfall and mosquitoe population in local area, if they are available. It is expected to obtain a better estimation if the estimation model considers both of those factors as well.
Footnotes
Acknowledgments
The authors appreciate the valuable insights and comments provided by anonymous referees, leading to many improvements in the paper. The authors acknowledge support from some hospitals in Bandung, the Health Department of Bandung and West Java Province for their data. The financial support provided by Parahyangan Catholic University is gratefully acknowledged.