
Abstract
Technology analysis is important work in management of technology. Most companies make plans for research and development (R&D) policy, new product development, or technological innovation using the results of technology analysis. In this paper, we propose a methodology of technology analysis using penalized regression models. We analyze the patent keywords extracted from the patent documents using ridge regression, least absolute shrinkage and selection operator, elastic net, and random forest. In addition, to show how our research could be applied to real problem efficiently, we carry out a case study of Apple technology. Our study contributes to perform R&D planning in technology management.
Keywords
Introduction
Technology forecasting is discovering the future trend or aspect of a technology (Hastie et al., 2001). Technology forecasting and management play an important role to improve the technological competition in a company (Hastie et al., 2001). So many studied on technology analysis were performed in management of technology (MOT) (Zou & Hastie, 2005; WIPSON, 2016; USPTO, 2016). The researches were mainly focused on the research and development (R&D) planning, because the technological competition is very important in a company. The methodologies of technology analysis have evolved constantly by many researchers (KIPRIS, 2016; Feinerer et al., 2008; Feinerer & Hornik, 2016; R Development Core Team, 2016). In the most previous researches, patent documents were used as input data for technology analysis, because patent involves so many information on the developed technologies. Furthermore, the exclusive right of technology registered to patent system is protected for a certain period of time (Friedman et al., 2016). So many scientists and engineers apply their developed technology to patent systems in the world. In this paper, we propose an analytical methodology for patent data analysis. This aims to analyze technology for MOT areas such as R&D planning, technological innovation, new product development, technology forecasting, etc. We consider penalized regression models for technology analysis, and use patent keywords as input data to analytical models. The penalized regression models are based on the ridge regression, the least absolute shrinkage and selection operator (LASSO) regression, elastic net, and random forest in this research. The ridge and LASSO regressions are shrinkage models selecting the meaningful variables by minimizing the residuals related to the regression coefficients (Friedman et al., 2010). The elastic net also minimizes the residual equation of regression parameters and select the necessary variables automatically (Han et al., 2012). Using the models based on penalized regression, we perform a case study to show how the methodology could be used to practical problems. Next section shows the penalized regression model for patent keyword analysis. We carry out the case study of Apple technology analysis in Section 3. In the last section, we conclude our research and provide the contribution of this paper.
Penalized regression models for patent analysis
We suppose that the data set involves
Technology analysis using penalized regression models.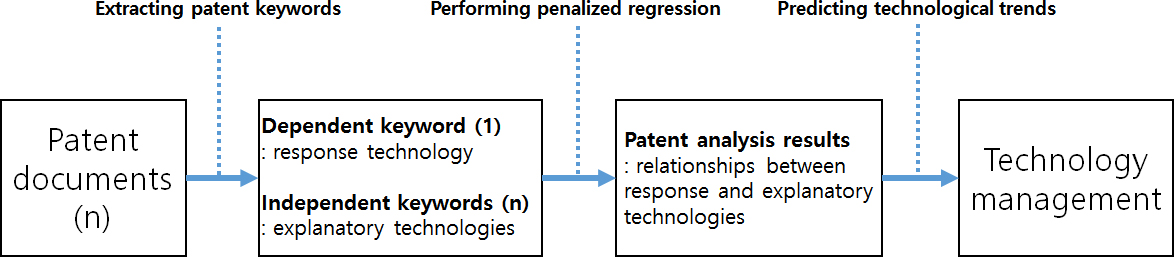
We retrieve the patent documents from the world patent databases such as the United States Patent and Trademark Office (USPTO), WIPS Corporation (WIPSON), or Korea Intellectual Property Rights Information Service (KIPRIS) (Zhao, 2013; Liaw & Wiener, 2002; Roper et al., 2010). Next we extract patent keywords from the patent documents using R data language and its text mining package (Jun, 2015, 2016; Kim & Jun, 2011). We classify the keywords into dependent and independent keywords by the aim of technology analysis. The dependent keyword (Y) represents the target (response) technology in patent analysis, and the independent keywords (X) are the predictive (explanatory) technologies for target technologies. Using the response and explanatory keywords, we perform the penalized regression models to find the relationships between technologies. The regression provides significant results to predict technological trends of target technology in given domain. Lastly we build the R&D policy for technology management. The detailed explanations of regression models for patent keyword analysis are shown in next sub sections.
Ridge regression is one of shrinkage methods in statistics. The regression shrinks the parameters of model by adopting penalized approach. The ridge regression minimizes the following squared residuals (Battistella & Toni, 2011).
We can control the shrink degree using
Though the LASSO regression is similar to the ridge regression, this has a clear difference for the ridge regression. The LASSO regression minimizes the following residual expression (Battistella & Toni, 2011).
Where
Elastic net is a regression model penalized with the L1 and L2 norms. This contains the characteristics of both the ridge and LASSO regressions. This shrinks the groups of correlated variables and selects variables automatically (Han et al., 2012). In the elastic net, the response and explanatory variables are assumed centered and standardized respectively (Han et al., 2012). The elastic net minimizes the following equation (Han et al., 2012).
Where
Random forest is an ensemble based on forest consisting of trees (Choi & Jun, 2014). In the random forest, we carry out the process below (Choi et al., 2015; Guo et al., 2013).
Sampling Performing regression tree using Predicting response technology by results of
In this paper, we analyze patent keyword data using the methods of penalized regression modeling. Next section shows a case study using Apple patent data.
To illustrate how our research could be applied to real problem, we carried out a case study using Apple patent documents. We collected the patent data from the patent databases in the world (Zhao, 2013). We extracted the keywords from the patent documents as follows; access, accessory, address, application, area, assembly, audio, bus, circuit, client, clock, code, color, communication, component, computer, connector, content, control, data, device, digital, disclosed, display, electronic, element, embodiment, frame, generated, graphics, host, housing, image, information, interface, invention, light, list, location, mechanism, media, memory, mobile, multiple, network, node, number, object, operation, pixel, plurality, portable, portion, position, power, present, processor, program, receiving, remote, request, response, screen, sensor, server, set, signal, source, state, storage, surface, system, text, time, touch, unit, user, vector, video, voltage, window, wireless. In this case study, we used the R data language and its package for penalized regression modeling (Kim & Jun, 2011; Hunt et al., 2007; Tibshirani, 1996). Firstly, we determine ‘device’ keyword as a response keyword, and all the rest were used for explanatory keywords. We compared three methods of the penalized regression models. Table 1 shows the RMSE (root mean square error) of comparative methods.
RMSE of
device and
other variables
RMSE of
We knew that the difference between penalized methods was slight. We also made an experiment of comparison of three methods using random forest in Table 2.
RMS of
Like the result of Table 1, there was little difference between the comparative methods. But we found the RMSE values were less than Table 2. We also used reduced model with common keywords from mean decrease accuracy and mean decrease Gini in Table 3.
RMS of
The RMSE values among the comparative methods were about the same. The RMSE values of Table 3 were larger than Tables 1 and 2. So we conclude that the performance of Table 1 result is better than others. Next we considered the keyword ‘Data’ as a response technology in Tables 4–6.
RMSE of
RMSE of
RMSE of
RMSE of
RMS of
RMS of
The result of standard model (Table 4) is better than other results (Tables 5 and 6). This is similar to the conclusion of response keyword ‘Device’. In Tables 7–9, the results of response keyword ‘System’ are shown.
The results of response keyword ‘System’ are similar to the results of response keywords ‘Device’ and ‘Data’. Based on the results, we forecast Apple technology in Table 10.
Apple keyword forecasting for year 2007–2010 with year 1980–2006
We selected five keywords (Device, Data, System, User, and Media) as response keywords, and performed three models (ridge regression, LASSO, and Elastic Net). In addition, we evaluated the performance of technology forecasting by the RMSE. In the results of response keywords ‘Device’, ‘User’, and ‘Media’, the performance of ridge regression is the best. The LASSO provides the best result in the keywords ‘Data’ and ‘System’. Therefore, we conclude that the best model for technology forecasting is based on ridge and LASSO regressions by standard formula.
We proposed a penalized regression models for patent keyword analysis. Each patent keyword is assigned to corresponding technology. So we forecast future technology by technology analysis based on patent keyword analysis. In this paper, we used ridge regression, LASSO, and Elastic net for penalized regression modeling. Also we compared three formula of model (standard, important variables by random forest, and common important variables by random forest) by RMSE measure. From the results of Apple case study, we found that ridge and LASSO regression models were better than elastic net model. In addition, the standard formula is better than others. In the future works, we will consider more advanced shrinkage model for patent data analysis.